electron transfer kinetics of fe( cn)z-/4- on laser ...mccreery/rlm publication...
TRANSCRIPT
J. Electroanal. Chem., 326 (1992) 1-12 Elsevier Sequoia S.A., Lausanne
JEC 01924
Electron transfer kinetics of Fe( CN)z-/4- on laser-activated and CN--modified Pt electrodes
Wenhua Huang and Richard McCreery l
Department of Chemistry, The Ohio State University, 120 West 18th Avenue, Columbus, OH 43210 (USA)
(Received 26 July 1991; in revised form 25 October 1991)
Abstract
The heterogeneous electron transfer rate constant k” for Fe(CN)~-/4- was measured by fast voltammetry at Pt microdisk electrodes with radii from 10 to 50 pm. The observed k” was dependent on electrode pretreatment, but in many cases exceeded the previously reported maximum value of 0.24 cm/s for 1 M KC1 electrolyte. When the electrode was polished with alumina in a slurry made with 10 mM KCN, and the 1 M KCI also contained 3 mM KCN, k” was invariant with scan rate and electrode radius for the range of 200-1000 V/s and lo-50 pm, with a value of 0.55 f 0.07 cm/s. If KCN was absent from the electrolyte, k” decreased with time to below 0.10 cm/s. Laser activation of the Pt electrodes in situ produced reproducibly high k” values of approx. 0.5 cm/s which varied slightly with laser power density up to 75 MW/cm’. Above this level k” increased up to approx. 1.2 cm/s, but this increase is attributed to a laser-induced increase in microscopic surface area. The observations support a mechanism for electrode passivation based on Fe(CN)z-/4- deco mposition to a Prussian blue like film. This process can be prevented by initial saturation of the Pt surface with CN-, resulting in a high stable k”.
INTRODUCTION
The Fe(CN)z-/4- redox couple has been used extensively as a benchmark system for studying electrode kinetics and diffusion, and for characterizing electro- analytical techniques [l- 111. Considered superficially, Fe(CN)i-/4- is a quasi-re- versible well-behaved redox system with an E,,, suitable for Pt, Au and carbon electrodes in aqueous electrolytes such as 1 M KCl. For this reason, it has served as a test system for numerous examinations of solid electrode preparation and modification, most notably Pt [l-4] and glassy carbon (GC) 112-141. Unfortunately,
l To whom correspondence should be addressed.
2
Fe(CN)z-/4- is significantly more complex than a superficial examination indi- cates. The heterogeneous electron transfer rate constant k” cm/s depends strongly on cation and anion identity and concentration, with the cation effect being more pronounced [ll]. Peter et al. [2] attributed the increase in k” with potassium ion concentration to the involvement of K+ in the transition state for electron transfer. A second complication is the chemisorption and decomposition of Fe(CN)z-‘4- on Pt surfaces, indicated by Fourier transform IR (FI’IR), radiochemical, UV-Vis and electrochemical results [1,3,5]. Galus and coworkers [1,4] noted that k” can be increased by adding free CN- to the electrolyte, preventing Fe(CN)i-/4- chemisorption. Goldstein and Van De Mark [ll] noted that large k” values were observed when halides were chemisorbed onto the surface, and associated this effect with the observed anion dependence of k”. An additional issue does not involve the Fe(CN)i-/4- system directly, but has an important effect on observed k” values. The highest literature values for k” on Pt in 1 M KC1 are in the range of 0.1-0.24 cm/s, but in many cases these values are at or near the upper limit of the instrumental technique employed. Most previous detailed kinetic examinations were performed with conventionally sized Pt, Au or carbon electrodes having areas of about 0.05 cm* or larger, and are subject to ohmic potential errors under the transient conditions required to measure large k” values. With the advent of ultramicroelectrodes, these ohmic potential errors can be greatly reduced, such that fast scan voltammetry can yield more reliable k” values above 0.2 cm/s [16-181. In some cases reported in the literature, the observed k” values were acknowledged to be lower limits owing to instrumental limitations [14,15]. When the actual k” is 0.1 cm/s or greater, comparisons of various conditions or electrodes are difficult with voltammetry or rotating-disk techniques on conven- tional electrodes with areas greater than about 0.05 cm*.
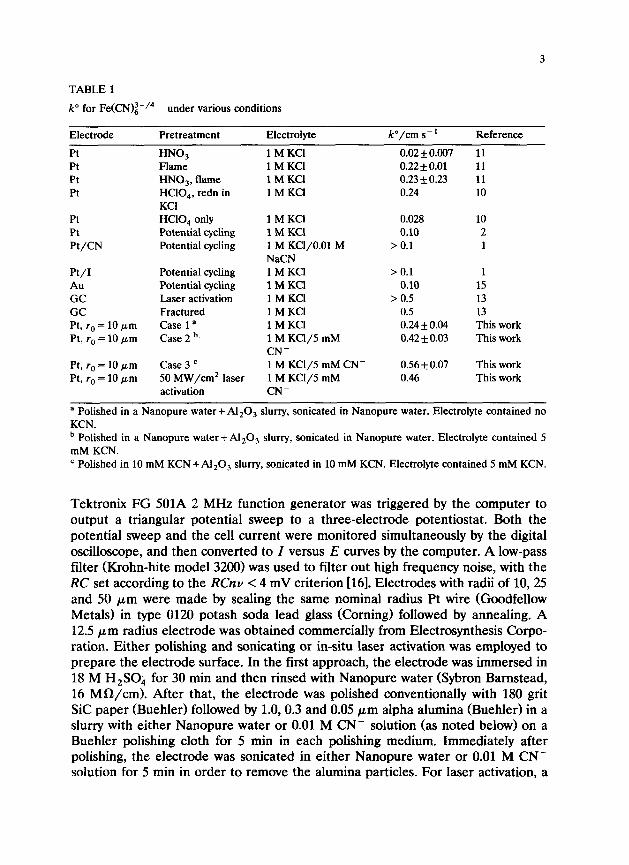
Several k” values for Fe(CN)i-/4- from the literature are listed in Table 1 for various electrode materials, pretreatments and electrolytes. The wide variation in k” on Pt for different pretreatments, with the highest k” observed on a “macro- electrode” in 1 M KC1 being 0.22-0.24 cm/s, should be noted. In our previous work on GC electrodes, we observed k” values of > 0.5 cm/s following laser activation of electrodes with areas of approx. 2 X lop3 cm* [13]. In order to compare k” on GC with that on Pt, it is necessary to reconsider the Pt rates using fast scan rates and microelectrodes under conditions where the complications of chemisorption and electrolyte effects are removed or controlled. In addition, we sought to evaluate laser activation on Pt to compare with the dramatic effects on GC. These fairly specific objectives not only serve to clarify the suitability of Fe(CN)i-/4- as a benchmark redox system, but also bear on the broader question
3 of the surface chemistry accompanying Fe(CN),- i4- electron transfer on Pt and GC.
EXPERIMENTAL
A LeCroy 8400-A digital oscilloscope was used to record voltammograms before transfer to a 286 based personal computer with a locally written program. A
3
TABLE 1
k” for Fe(CN)~-/4- under various conditions
Electrode
Pt Pt Pt Pt
Pretreatment Electrolyte
HNO, lMKC1 Flame HNO,, flame HCIO,, redn in KC1 HCIO, only Potential cycling Potential cycling
k”/cm s - ’ Reference
0.02f0.007 11 lMKC1 0.22 + 0.01 1MKCl 0.23 f 0.23 1MKCl 0.24
11 11 10
Pt Pt Pt/CN
Pt/I Au GC GC Pt, ra = 10 pm Pt, ra = 10 pm
Pt, ra = 10 pm Pt, ra = 10 pm
Potential cycling Potential cycling Laser activation Fractured Case 1 a Case 2 b’
Case 3 ’ 50 MW/cm* laser activation
1MKCI 1MKCl 1 M KCl/O.Ol M NaCN 1MKCl lMKC1 1MKCl 1MKCl 1MKCl 1 M KC1/5 mM CN- 1 M KCl/5 mM CN- 1 M KCl/5 mM CN-
0.028 0.10
> 0.1
> 0.1 1 0.10 15
> 0.5 13 0.5 13 0.24 f 0.04 This work 0.42 f 0.03 This work
0.56 f 0.07 This work 0.46 This work
10 2 1
a Polished in a Nanopure water + Al,O, slurry, sonicated in Nanopure water. Electrolyte contained no KCN. b Polished in a Nanopure water + Al,O, slurry, sonicated in Nanopure water. Electrolyte contained 5 mM KCN. ’ Polished in 10 mM KCN + Al,O, slurry, sonicated in 10 mM KCN. Electrolyte contained 5 mM KCN.
Tektronix FG 501A 2 MHz function generator was triggered by the computer to output a triangular potential sweep to a three-electrode potentiostat. Both the potential sweep and the cell current were monitored simultaneously by the digital oscilloscope, and then converted to I versus E curves by the computer. A low-pass filter (Krohn-hite model 3200) was used to filter out high frequency noise, with the RC set according to the RCnv < 4 mV criterion [16]. Electrodes with radii of lo,25 and 50 pm were made by sealing the same nominal radius Pt wire (Goodfellow Metals) in type 0120 potash soda lead glass (Corning) followed by annealing. A 12.5 pm radius electrode was obtained commercially from Electrosynthesis Corpo- ration. Either polishing and sonicating or in-situ laser activation was employed to prepare the electrode surface. In the first approach, the electrode was immersed in 18 M H,SOi for 30 min and then rinsed with Nanopure water (Sybron Barnstead, 16 MR/cm). After that, the electrode was polished conventionally with 180 grit SIC paper (Buehler) followed by 1.0,0.3 and 0.05 ym alpha alumina (Buehler) in a slurry with either Nanopure water or 0.01 M CN- solution (as noted below) on a Buehler polishing cloth for 5 min in each polishing medium. Immediately after polishing, the electrode was sonicated in either Nanopure water or 0.01 M CN- solution for 5 min in order to remove the alumina particles. For laser activation, a
4
Nd : YAG laser (1064 nm) was used as described previously [8,9,13]. A He + Ne pilot beam coincident with the Nd : YAG beam was used to center the laser on the electrode. The Nd: YAG laser beam has a diameter of 6 mm and output power densities in the range of 5-100 MW/cm2 at the electrode surface. The electro- chemical cell used has been described previously 191. It was constructed from Teflon and was able to accept different size electrodes. The laser beam passed through a quartz window and the solution of interest before impinging on the electrode. Cyclic voltammograms (CVs) were recorded four times during each trial (3 s between each scan) and their average was stored for subsequent data processing.
Scanning electron microscopy @EM) was performed with a Hitachi S-150 scanning electron microscope at an acceleration voltage of 25 kV. Three electrodes were made and polished at the same time preceding SEM examination. After sonicating, one electrode was laser activated with three laser pulses at 75 MW/cm2. Another electrode was activated with 60 laser pulses at 50 MW/cm2 followed by three pulses at 75 MW/cm2. All three electrodes were gold-coated before the SEM examination.
KCl, K,Fe(CN),, KI, KBr and KCN (all AR grade) were obtained from Mallinckrodt and used without further purification. All solutions were made fresh daily with Nanopure water and were degassed with argon for 10 min. Because of the possibility of toxic HCN formation, neither KCN nor K,Fe(CN), solutions were exposed to acidic solutions or reagents.
RESULTS
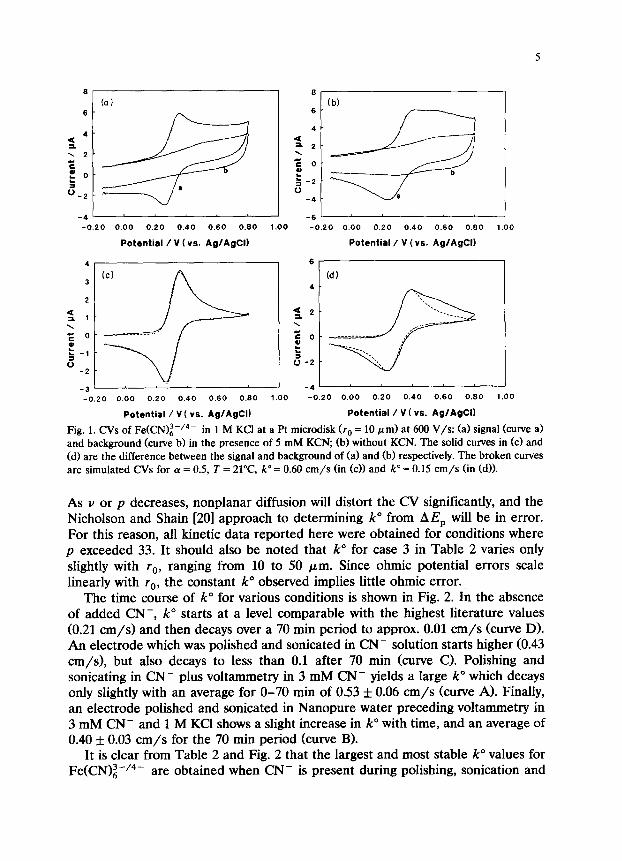
CVs obtained with a Pt microdisk electrode (rO = 10 pm) at 600 V/s in the presence and absence of 5 mM CN- are compared in Fig. 1. Figure l(a) shows the background and Fe(CN)~-/4- CVs with CN- present, while Fig. l(b) is for the case with CN- absent. Note that the background current is higher without CN-, with an apparent wave at about +0.6 V which is attributable to electrode surface oxidation or Fe(CN)i-/4- degradation. Figures l(c) and l(d) show background subtracted CVs with CN- present (c) and absent (d). The broken curves show simulated CVs for (Y = 0.5, T = 21”C, and k” = 0.60 cm/s (c) and k” = 0.15 cm/s cd). Note that the agreement of theory and experiment is quite good with CN- present, and that the CV exhibits excess current in the absence of CN- that was not subtracted as background current. It should also be noted, that the value of 0.60 cm/s for k” exceeds the previously reported maximum of 0.24 cm/s for Pt in 1 M KCI. As will be discussed later, it is significant that the value of 0.24 cm/s was obtained under conditions conducive to Cl- chemisorption.
k” values for three different pretreatments and electrolytes are listed in Table 2 for scan rates ranging from 10 to 950 V/s. In the range from 200-1000 V/s, k” shows no obvious trends but does exhibit random error. The low values of k” observed below 200 V/s are probably due to nonplanar diffusion on the microdisk electrode. At 200 V/s, the p function [19], defined as p = (~zF~&/RTD)‘/~, is 33.
5
-4 ’ I -6 ’ -0.20 0.00 0.20 0.40 0.60 0.60 1 .oo -0.20 0.00 0.20 0.40 0.60
Potential /V (vs. AglAgCI) Potential / V (vs. AglAgCI)
-4 1 -0.20 0.00 0.20 0.40 0.60 0.60 1 .oo -0.20 0.00 0.20 0.40 0.60 0.60 1 .oo
Potential /VI vs. AglAgCI) Potential / V ( vs. AglAgCI)
Fig. 1. CVs of Fe(CN)i-‘4- in 1 M KC1 at a Pt microdisk (rO = 10 pm) at 600 V/s: (a) signal (curve a) and background (curve b) in the presence of 5 mM KCN, (b) without KCN. The solid curves in (cl and (d) are the difference between the signal and background of (a) and (b) respectively. The broken curves are simulated CVs for a = 0.5, T = 21”C, k” = 0.60 cm/s (in (c)j and k” = 0.15 cm/s (in cd)).
As v or p decreases, nonplanar diffusion will distort the CV significantly, and the Nicholson and Shain [20] approach to determining k” from AE, will be in error. For this reason, all kinetic data reported here were obtained for conditions where p exceeded 33. It should also be noted that k” for case 3 in Table 2 varies only slightly with rO, ranging from 10 to 50 pm. Since ohmic potential errors scale linearly with ra, the constant k” observed implies little ohmic error.
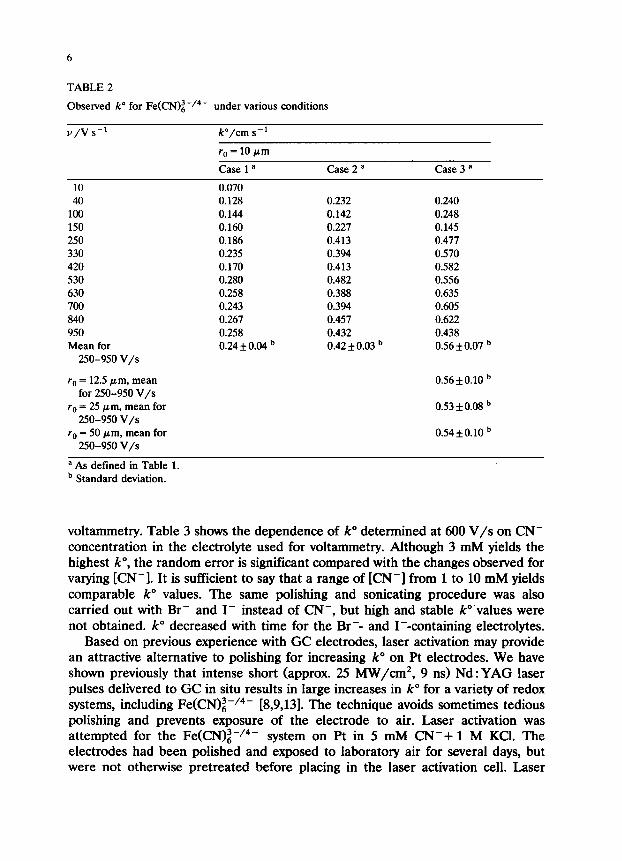
The time course of k” for various conditions is shown in Fig. 2. In the absence of added CN-, k” starts at a level comparable with the highest literature values (0.21 cm/s) and then decays over a 70 min period to approx. 0.01 cm/s (curve D>. An electrode which was polished and sonicated in CN- solution starts higher (0.43 cm/s), but also decays to less than 0.1 after 70 min (curve Cl. Polishing and sonicating in CN- plus voltammetry in 3 mM CN- yields a large k” which decays only slightly with an average for O-70 min of 0.53 f 0.06 cm/s (curve A). Finally, an electrode polished and sonicated in Nanopure water preceding voltammetry in 3 mM CN- and 1 M KC1 shows a slight increase in k” with time, and an average of 0.40 f 0.03 cm/s for the 70 min period (curve B).
It is clear from Table 2 and Fig. 2 that the largest and most stable k” values for Fe(CN)i-/4- are obtained when CN- is present during polishing, sonication and
6
TABLE 2
Observed k” for Fe(CN)z-/4- under various conditions
v/v s-l P/cm s-l
r. = 10 pm
Case 1 a Case2= Case 3 a
10 40
100 150 250 330 420 530 630 700 840 950 Mean for
250-950 V/s
r0 = 12.5 pm, mean for 250-950 V/s
r. = 25 pm, mean for 250-950 V/s
r. = 50 Frn, mean for 250-950 V/s
0.070 0.128 0.144 0.160 0.186 0.235 0.170 0.280 0.258 0.243 0.267 0.258 0.24 f 0.04 b
0.232 0.240 0.142 0.248 0.227 0.145 0.413 0.477 0.394 0.570 0.413 0.582 0.482 0.556 0.388 0.635 0.394 0.605 0.457 0.622 0.432 0.438 0.42 f 0.03 b 0.56kO.07 b
0.56f 0.10 b
0.53 *0.08 b
0.54lto.10 b
a As defined in Table 1. b Standard deviation.
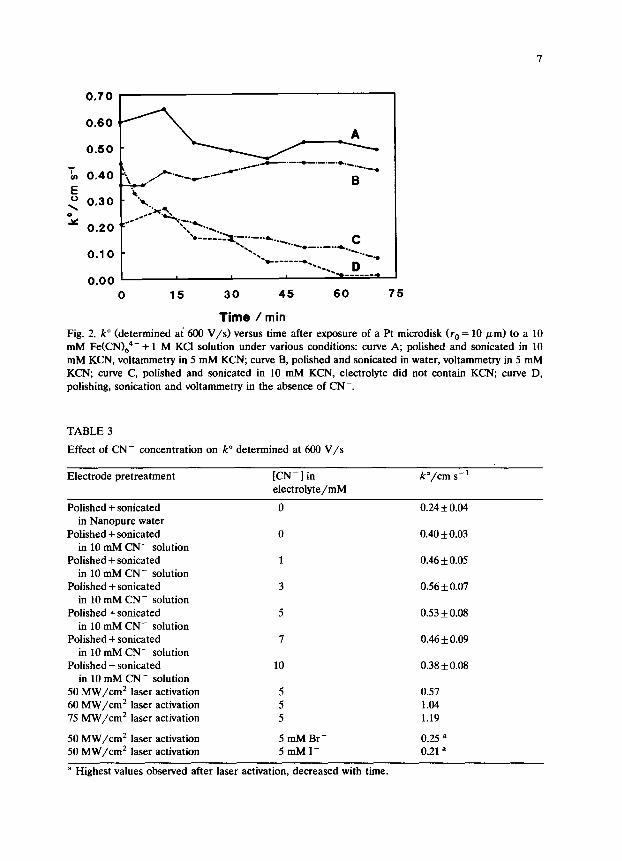
voltammetry. Table 3 shows the dependence of k” determined at 600 V/s on CN- concentration in the electrolyte used for voltammetry. Although 3 mM yields the highest k”, the random error is significant compared with the changes observed for varying [CN-I. It is sufficient to say that a range of [CN-] from 1 to 10 mM yields comparable k” values. The same polishing and sonicating procedure was also carried out with Br- and I- instead of CN-, but high and stable k”values were not obtained. k” decreased with time for the Br-- and I--containing electrolytes.
Based on previous experience with GC electrodes, laser activation may provide an attractive alternative to polishing for increasing k” on Pt electrodes. We have shown previously that intense short (approx. 25 MW/cm2, 9 ns) Nd:YAG laser pulses delivered to GC in situ results in large increases in k” for a variety of redox
3 systems, including Fe(CN),- 14- [8,9,13]. The technique avoids sometimes tedious polishing and prevents exposure of the electrode to air. Laser activation was attempted for the Fe(CN)z-/4- system on Pt in 5 mM CN-+ 1 M KCl. The electrodes had been polished and exposed to laboratory air for several days, but were not otherwise pretreated before placing in the laser activation cell. Laser
7
0.60 G A
0.50 -
0 15 30 45 60 75
Time / min
Fig. 2. k” (determined at 600 V/s) versus time after exposure of a Pt microdisk fro = 10 pm) to a 10 mM Fe(CNJG4- + 1 M KC1 solution under various conditions: curve A, polished and sonicated in 10 mM KCN, voltammetry in 5 mM KCN; curve B, polished and sonicated in water, voltammetry in 5 mM KCN, curve C, polished and sonicated in 10 mM KCN, electrolyte did not contain KCN; curve D, polishing, sonication and voltammetry in the absence of CN-.
TABLE 3
Effect of CN- concentration on k” determined at 600 V/s
Electrode pretreatment [CN-] in /?/cm s-t
Polished + sonicated in Nanopure water
Polished + sonicated in 10 mM CN- solution
Polished + sonicated in 10 mM CN- solution
Polished + sonicated in 10 mM CN- solution
Polished + sonicated in 10 mM CN- solution
Polished + sonicated in 10 mM CN- solution
Polished + sonicated in 10 mM CN- solution
50 MW/cm’ laser activation 60 MW/cm’ laser activation 75 MW/cm* laser activation
electrolyte/mM
0 0.24 + 0.04
0 0.40 f 0.03
1 0.46 f 0.05
3 0.56 + 0.07
5 0.53 + 0.08
7 0.46 f 0.09
10 0.38 f 0.08
5 5 5
0.57 1.04 1.19
50 MW/cm’ laser activation 5 mM Br- 50 MW/cm* laser activation 5mMI-
a Highest values observed after laser activation, decreased with time.
0.25 = 0.21 a
8
T *
E 0
\ 0 2e
1.40
1.20
1.00
0.80
0.60
0.40
0.20
Laser Power Density /MW cnr2 Fig. 3. k” determined in 5 mM KCN+ 1 M KC1 following in-situ laser activation at increasing power
densities. Three laser pulses were delivered at each power, and the activation was cumulative starting at
low power.
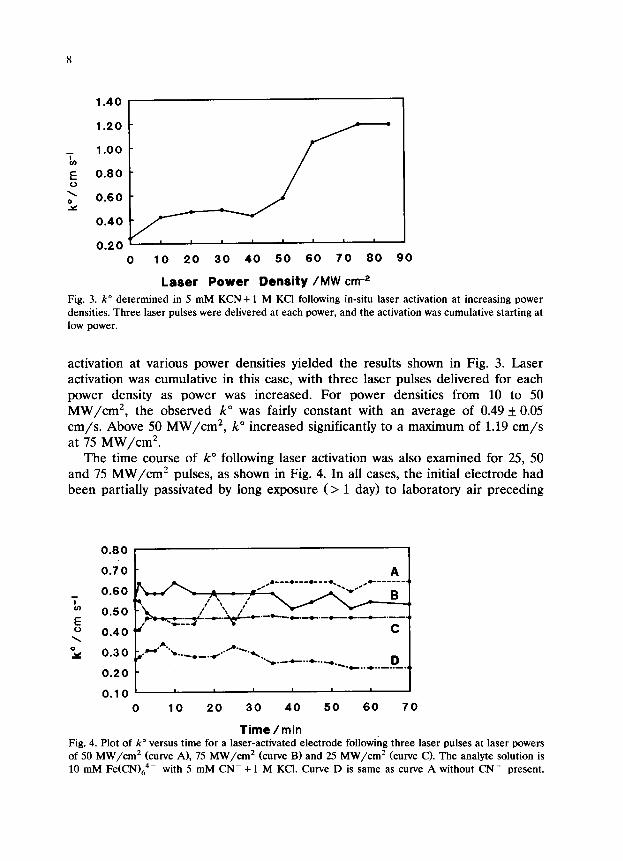
activation at various power densities yielded the results shown in Fig. 3. Laser activation was cumulative in this case, with three laser pulses delivered for each power density as power was increased. For power densities from 10 to 50 MW/cm*, the observed k” was fairly constant with an average of 0.49 + 0.05 cm/s. Above 50 MW/cm2, k” increased significantly to a maximum of 1.19 cm/s at 75 MW/cm2.
The time course of k” following laser activation was also examined for 25, 50 and 75 MW/cm2 pulses, as shown in Fig. 4. In all cases, the initial electrode had been partially passivated by long exposure (> 1 day) to laboratory air preceding
E 0 \ ‘r
0.80
0.70 A
0.30 .~.n....._,_.~..‘.~..
1
“\,_-a-..+..*., D 0.20
.+..*..-..-
“. I ”
0 IO 20 30 40 50 60 70
Time /min Fig. 4. Plot of k” versus time for a laser-activated electrode following three laser pulses at laser powers
of 50 MW/cm* (curve A), 75 MW/cm’ (curve B) and 25 MW/cm’ fcurve Cl. The analyte solution is
10 mM Fe(CN),4- with 5 mM CN- + 1 M KCl. Curve D is same as curve A without CN- present.
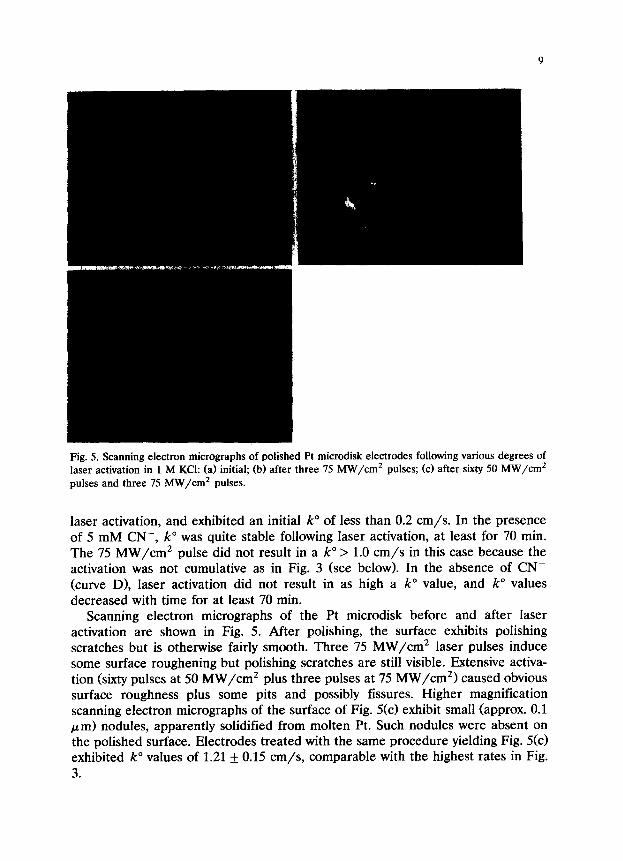
Fig. 5. Scanning electron micrographs of polished Pt microdisk electrodes following various degrees of laser activation in 1 M KCI: (a) initial; (b) after three 75 MW/cm* pulses; (c) after sixty 50 MW/cm* pulses and three 75 MW/cm* pulses.
laser activation, and exhibited an initial k” of less than 0.2 cm/s. In the presence of 5 mM CN-, k” was quite stable following laser activation, at least for 70 min. The 75 MW/cm2 pulse did not result in a k” > 1.0 cm/s in this case because the activation was not cumulative as in Fig. 3 (see below). In the absence of CN- (curve D), laser activation did not result in as high a k” value, and k” values decreased with time for at least 70 min.
Scanning electron micrographs of the Pt microdisk before and after laser activation are shown in Fig. 5. After polishing, the surface exhibits polishing scratches but is otherwise fairly smooth. Three 75 MW/cm* laser pulses induce some surface roughening but polishing scratches are still visible. Extensive activa- tion (sixty pulses at 50 MW/cm2 plus three pulses at 75 MW/cm2) caused obvious surface roughness plus some pits and possibly fissures. Higher magnification scanning electron micrographs of the surface of Fig. 5(c) exhibit small (approx. 0.1 pm> nodules, apparently solidified from molten Pt. Such nodules were absent on the polished surface. Electrodes treated with the same procedure yielding Fig. 5(c) exhibited k” values of 1.21 k 0.15 cm/s, comparable with the highest rates in Fig. 3.
10
DISCUSSION
The first conclusion from the current results is quite practical. The k” values observed here with microdisk electrodes are significantly higher than those re- ported in the literature. Since previous studies use relatively “large” electrodes, the observed k” values are subject to a downward bias due to ohmic potential errors. The constancy of k” with scan rate in the range 200-1000 V/s and with electrode radius, plus the ability to measure rates of 1.2 cm/s for certain condi- tions support the conclusion that the k” values of approx. 0.5 cm/s are reliable, and not just another lower limit. The results indicate that the observed k” values are not instrumentally limited. Resolution of the pragmatic issues of instrumental limits on k” and electrode cleanliness is a prerequisite to more fundamental questions about the factors which determine electron transfer rates. Before elec- tron transfer mechanisms can be elucidated, one must have confidence in measure- ment techniques and surface preparation. The high stable k” values observed here reduce concern about surface cleanliness and preparation, and permit more
3 reliable comparison of Fe(CN),- i4- kinetics on Pt electrodes with those on other surfaces.
Given the previous reports by Galus and coworkers [1,4], it is not surprising that CN- stabilizes k” and prevents degradation of electrode performance. Galus proposed that CN- forms a protective layer by occupying chemisorption sites, similar to I-, and both CN-- and I--treated surfaces yielded k” values for Fe(CN)z-/4- above the instrumental limit of 0.1 cm/s. If this model is correct, a small solution concentration of strongly adsorbing I- or CN- will be sufficient to saturate the surface and prevent Fe(CN)z-/4- chemisorption. This observation should be considered in the light of spectroscopic data indicating formation of a Prussian blue like film in the absence of CN-. In addition, Bocarsly and coworkers [21,22] have demonstrated chemisorption of Fe(CN),-3/-4 onto nickel surfaces, and Wieckowski and Szklarczyk [3] noted that CN- can be bonded at both ends to yield the chemisorbed species
Pt-N = C-Fe(CN):-
All these reports are consistent with the conclusion that excess CN- in solution can saturate the Pt surface and prevent Fe(CN)i-/4- chemisorption. Since 3 mM (or less) of free CN- is apparently enough to prevent chemisorption of 10 mM Fe(CN)z-/4-, the equilibrium constant for CN- adsorption must be significantly
3 higher than that of Fe(CN),- j4- A slight extension of this model involves events 3 occurring after Fe(CN),- i4- chemisorption. It is possible that the Fe(CN),(H,0)3-
desorbs, leaving CN- behind, and then reacts with solution Fe(CN)z-/4- to produce Prussian blue or a related material [6,23]. This reaction leads to a passivating film which eventually impedes electron transfer and decreases k”. Although the current data do not test directly for the presence of chemisorbed Fe(CN)i-/4-, it is clear that chemisorbed CN- prevents Fe(CN)i-/4- decomposi- tion. By polishing and sonicating the Pt electrode in CN- solution, the presatura- tion of the surface may be particularly effective, leading to high stable k” values.
11
Even a partially passivated electrode exhibiting a low k” can be reactivated by sonicating in 10 mM KCN.
Below 50 MW/cm2, laser activation of Pt in the Fe(CN)i-/4- + CN-+ KC1 medium appears straightforward, resulting in k” values of comparable magnitude and stability to the polished values. Based on a simple numerical simulation, the peak temperature excursion for the Pt surface activated by a 50 MW/cm2, 9 ns, 1064 nm laser pulse has an upper limit of approx. 1260°C [24]. Thus the rapid surface heating of the electrode would be expected to desorb impurities and present an initially clean surface to the solution. With CN- present, this surface should rapidly saturate with chemisorbed CN- and a high k” should result. The stability of k” following laser activation is presumably attributable to the same phenomenon that occurs when CN- is present during polishing. After numerous pulses in the 20-50 MW/cm2 range plus several above 50 MW/cm2, the observed k” increases above 1.0 cm/s. Scanning electron micrographs of a similarly treated electrode show significant roughness and surface damage, perhaps from melting or surface ablation. It is quite likely that the increase in k” is a microscopic area effect, implying that the heavily activated surface has a microscopic area roughly twice that of the initial surface. Without an independent measure of microscopic area, it would be risky to conclude that the heavily laser treated surface is more inherently active than the other cases. This uncertainty about area applies to any solid electrode, so that comparisons of rate constants should be made for surfaces of comparable roughness when possible. For this reason, our polishing procedure was conventional with the exception of the presence of CN-.
Table 1 combines several literature values for Fe(CN)i-/4- in 1 M KC1 with current results. Recognizing that instrumental limitations and surface impurities usually result in low k” values, the entries in Table 1 represent lower limits of the true values. Several points about Table 1 deserve special note. First, the highest k” values observed (ignoring the roughened surface) fall in a fairly narrow range from 0.1 to 0.6 cm/s, even for quite different electrode surfaces. Second, the Pt/CN- values reported here are comparable with the highest results obtained on fractured or laser-activated GC [13]. On the basis of the Marcus theory correlating k” with homogeneous self-exchange rates, k” for Fe(CN)i-/4- should be in the region of l-10 cm/s, within an order of magnitude of 0.5 cm/s [4,14]. Third, an inner-sphere electron transfer mechanism based on a CN- or K+ bridge between the surface and the Fe(CN)i-/4- redox center appears unlikely given the data in Table 1. Occupation of Pt surface sites by CN- has a minor effect (a factor of 2) on the initial k” before any degradation. If a K+ or CN- bridge to the Pt surface (or Pt/Cl surface) were important to electron transfer, one would expect that inten- tional CN- chemisorption should markedly change the observed k”. To carry this logic further with reference to Table 1, k” is not greatly different for Pt/CI, Pt/CN, Pt/I, Au, GC (laser) and GC (fractured). If a K+ or CN- bridge were
3 involved in electron transfer to Fe(CN),- j4- the effect would be very insensitive to surface identity. A more likely conclusion is that the electron transfer does not depend on a bridging group, and that the effect of chemisorbed anions (other than
12
to prevent film formation) is quite small, perhaps involving double-layer modifica- tion or alteration of the distance of closest approach of the redox center. Whatever the effects of anion adsorption on a bridging process, they are very much smaller than the effects of surface cleanliness and instrumental factors. If a bridging or adsorption mechanism is operative, its mechanism would have to be compatible with a small effect of anion or electrode identity. The present results do not rule
3 out an inner-sphere mechanism for Fe(CN),- 14- electron transfer, but they do indicate an insensitivity to electrode surface composition.
ACKNOWLEDGMENTS
This work was supported by the Air Force Office of Scientific Research. The authors thank Dennis Evans for providing CV simulation software.
REFERENCES
1 J. Kawiak, P. Kulesza and Z. Galus, J. Electroanal. Chem., 226 (19871 305. 2 L.M. Peter, W. Durr, P. Bindra and H. Gerischer, J. Electroanal. Chem., 71 (1976131. 3 A. Wieckowski and M. Szklarczyk, J. Electroanal. Chem., 142 (19821 157. 4 J. Kawiak, T. Jedral and Z. Galus, J. Electroanal. Chem., 145 (1983) 163. 5 S. Pans, M. Datta, J.F. McAller and A.S. Hinman, J. Electroanal. Chem., 160 (1984) 369. 6 D. Ellis, M. Eckhoff and V.D. Neff, J. Phys. Chem., 85 (19811 1225. 7 K. Itaya, T. Ataka and S. Toshima, J. Am. Chem. Sot., 104 (198214767. 8 M. Poon and R. McCreery, Anal. Chem., 59 (1987) 1615. 9 M. Poon and R. McCreery, Anal. Chem., 58 (198612745.
10 P.H. Daum and C.G. Enke, Anal. Chem., 41 (1969) 653. 11 E.L. Goldstein and M.R. Van De Mark, Electrochim. Acta, 27 (1982) 1079. 12 IF. Hu, D.H. Karweik and T. Kuwana, J. Electroanal. Chem., 188 (1985) 59. 13 R. Rice, H. Pontikos and R. McCreery, J. Am. Chem. Sot., 112 (1990) 4617. 14 R.L. McCreety, in A.J. Bard (Ed.), Electroanalytical Chemistry, Vol. 17, Marcel Dekker, New York,
1991, pp. 221-374. 15 J. Kuta and E. Yeager, J. Electroanal. Chem., 59 (1975) 110. 16 D.O. Wipf, E.W. Kristensen, M.R. Deakin and R.M. Wightman, Anal. Chem., 60 (19881306. 17 R.M. Wightman and D.O. Wipf, in A.J. Bard (Ed.), Electroanalytical Chemistry, Vol. 15, Marcel
Dekker, New York, 1989. 18 J.O. Howell and R.M. Wightman, Anal. Chem., 56 (1984) 524. 19 K. Aoki, K. Akimoto, K. Tokuda, H. Matsuda and J. Osteryoung, J. Electroanal. Chem., 17109841
219. 20 R.S. Nicholson and I. Shain, Anal. Chem., 36 (1964) 706. 21 B.W. Pfenning and A.B. Bocarsly, Inorg. Chem., 30 (19911666. 22 C. Hidalgo-Luangdilok and A.B. Bocarsly, Inorg. Chem., 29 (1990) 2894. 23 L.M. Siperko and T. Kuwana, J. Electrochem. Sot., 133 (1986) 2349. 24 R.J. Rice and R.L. McCreery, J. Electroanal. Chem., 310 (1991) 127.