electronic receiving tubes and mounts: workers · pdf fileelectronic receiving tubes and...
TRANSCRIPT

UNITED STATES TARIFF COMMISSION
ELECTRONIC RECEIVING TUBES AND MOUNTS: WORKERS OF THE HARRISON N. J., PLANT
OF RCA CORP.
Report to the President on Investigation No. TEA-W-249
Under Section 30l(c)(2) of the Trade Expansion Act of 1962
TC Publication 700 Washington, D. C.
November 1974

UNITED STATES TARIFF COMMISSION
COMMISSIONERS
Catherine Bedell, Chairman Joseph 0. Parker, Vice Chairman Will E. Leonard, Jr. George M. Moore Italo H. Ablondi Daniel Minchew
Kenneth R. Mason, Secretary to the Commission
Address all communications to United States Tariff Commission
Washington, D. C. 20436

CONTENTS
Report to the President------------------------------~---Finding of the Commission----------------------------Views of Chairman Bedell. Commissioner Moore. and
Commissioner Ablondi -----------------------------Views of Vice Chairman Parker------------------------View of Commissioner Leonard ------------------------
Information obtained in the investigation: Description and uses---------------------------------U.S. tariff treatment----------------------------------U. S. producers---------------------------------------U. S. consumption. shipments, and imports:
Electronic receiving tube mounts------------------Electronic receiving tubes------------------------Television receivers-----------------------------Semiconductors~----------------------------------
RCA Corp-------------------------------------~------Harrison, N.J •• plant-----------------------------
Production----------------------------------Imports-------------------------------------Exports--------------------------------------
. Employment. man-hours. and wage rates -------Woodbridge, N. J •• plant --------------------------
Production-----------------------------------Employment. man-hours. and wage rates ------
Cincinnati. Ohio. plant------------------------- --Brazilian plant ----------- ----- ------ -- --- --- -----Mexican plant ------------------------------------The effect of the closing of the Woodbridge plant
and the resulting consolidation of production of electronic receiving tubes and mounts on the Harrison plant~--------------------------------
Cost and price comparisons-----------------------Sta tis ti cal Appendix ----- ------------ ----- --- -- -- - ----- ---
Charts
1 3
4 8 9
A-1 A-3 A-6
A-6 A-11 A-16 A-20 A-24
*** *** >): * * * >): *
·,:c * * * ,.,. * >): * * * * >:<
*** A-41
1. Electronic receiving tube mounts (quantity)------------ * >:< >:<
2. Electronic receiving tube mounts (value) ____ ..:._________ * * >:<
3. Electronic receiving tubes (.:iuantity) ------------------ A-12 4. Electronic receiving tubes (value)-------------------- A-13 5. Television receivers (quantity)----------------------- A-17 6. Television receivers (value)------------------------- A-18 7. Semiconductors (quantity)---------------------------- A-22 8. Semiconductors (value)------------------------------ A-23 9. RCA Corp.: Simplified organizational chart----------- * * ""'

ii
CONTENTS
A ppendlx: Tables
1. Electronic receiving tube mounts: U.S. factory shipments imports for consumption, and apparent consumption, 1969-73, January-June 1973, and January-June 1974 ---------------------------"'.'---- * * *
2. Electronic receiving tubes: U.S. producers' shipments, imports for consumption, exports of domestic merchandise, and apparent consumption, 1969-73, January-June 1973, and January-June 1974-- A-43
3. Electronic receiving tube mounts and tubes: U.S. rates of duty and imports for consumption, 1964-73--- * * *
4. Television receivers: U.S. producers' shipments, imports for consumption, exports of domestic merchandise, and apparent consumption, 1969-73 ---- A-45
5. Television receivers: U.S. rates of duty and imports for consumption, by types, 1964-73----------------- A-46
6. Semiconductors: U.S. producers' shipments, imports for consumption, exports of domestic merchandise, and apparent consumption, 1969-73 ----------------- A-47
7. Semiconductors: U.S. rates of duty and imports for consumption, by types, 1964-73 -------------------- A-48
8. Semiconductors: Share of total U.S. imports repre-sented by imports under TSUS items 806. 30 and 807. 00, by types, 1969-73 ------------------------- A-49
9. Semiconductors: Total U.S. imports under TSUS items 806. 30 and 807. 00, by types, 1969-73--------------- A-50
10. Transistors: U.S. producers' shipments, imports · for consumption, exports of domestic merchandise, and apparent consumption, 1969-73 ----------------- A-51
11. Diodes: U.S. producers' shipments, imports for consumption, exports of domestic merchandise, and apparent consumption, 1969-73--------------------- A-52
12. Integrated circuits: U.S. producers' shipments, imports for consumption, exports of domestic merchandise, and apparent consumption, 1970-73-------- A-53
13. RCA Corp.: Production of electronic receiving tube mounts, by plants, 1969-73, January-June 1973, and January-June 1974----------------------------- * * *
14. RCA Corp.: Production of electronic receiving tubes, by plants, 1969-73, January-June 1973,. and January-June 1974 -------------------------------- * * *

iii
CONTENTS
15. RCA Corp.: Electronic receiving tube mounts, total imports entered under TSUS item 806. 30 and value
Page
of U. So components entered under TSUS item 806. 30, 1969-73, January-June 1973, and January-June 1974-- * >:< *
16. RCA Corp.: Electronic receiving tubes, total imports entered under TSUS item 807. 00 or 806. 30 and value of Do S. components entered under TSUS item 807. 00 or 806.30, 1969-73, January-June 1973, and January-June 1974 -------------------------------- . >:< .>:< >:<
17. RCA Corp. : Exports of electronic receiving tubes, 1969-73, January-June 1973, and January-June 1974-- ':' ':' ':'
18. Harrison, N. Jo, plant of RCA Corp.: Average number of employees and of production and related workers producing electronic receiving tube mounts and electronic receiving tubes, 1969-73 and, by months, January 1972-June 1974 --------------------------- ':' >:< ':'
19. Harrison, N. J., plant of RCA Corp.: Man-hours expended by production and related workers in the production of electronic receiving tube mounts and electronic receiving tubes, 1969-73 and, by months, January 1972 to June 1974 ------------------------- >:< >:< *
20. Woodbridge, N. J., plant of RCA Corp.: Average number of employees and of production and related workers producing electronic receiving tube mounts and electronic receiving tubes, 1969-73 and, by months, January 1972 to June 1974 ----------------- >:< * ':<
21. Woodbridge, N. Jo, plant of RCA Corp. : Man-hours expended by production and related workers in the production of electronic receiving tube mounts and electronic receiving tubes, 1969-73 and, by months, January 1972 to June 1974 ------------------------- ':< ':' ~'<
22. Costs of selected electronic receiving tube mounts produced by RCA in its Brazil plant compared with costs of producing them in its Harrison, N. J., plant, January to June 1974 ------------------------ * ':< ':'
23. Estimated cost savings to RCA by importing 3 types of receiving tube mounts from Brazil, January-June 1974--------------------------------------------- ***


REPORT TO THE PRESIDENT
U.S. Tariff Commission. November 15, 1974.
To the President:
In accordance with section 301 of the Trade Expansion Act of
1962 (TEA) (19 U.S.C. 1901), the U.S. Tariff Commission herein
reports the results of investigation No. TEA-W-249 made under
section 30l(c)(2) of the act to determine whether. as a result in
major part of concessions granted under trade agreements. articles
like or directly competitive with electronic receiving tubes and com-
ponents thereof known as mounts (of the types provided for in item
687. 60 of the Tariff Schedules of the United States (TSUS)) produced
by the Harrison, N. J., plant of the RCA Corp., New York. N. Y.,
are being imported into the United States in such increased quantities
as to cause, or threaten to cause, the unemployment or underemploy-
ment of a significant number or proportion of the workers of such
firm or appropriate subdivision thereof.
The investigation was instituted on October 7, 1974, on the basis
of a petition for adjustment assistance filed under section 301(a)(2) of
the act on behalf of the workers and former workers of the Harrison,
N. J., plant of the RCA Corp. The petition was received on Septerr.ber
16, 1974.
Notice of the investigation was published in the Federal Register
(39 F. R. 36649) on October 11. 1974. No public hearing was requested,
and none was held.

2
The information in this report was obtained from the RCA Corp.,
other domestic producers, importers, users of the aforementioned
articles, trade associations, the petitioners, and from the Commis
sion's files.
Earlier this year, the Commission conducted an investigation
under section 301 of the TEA on petition of the workers of the Wood
bridge, N. J., plant of the RCA Corp. who also produced electronic
receiving tubes and mounts. The Commission, by majority vote,
made an affirmative determination in that investigation. Specifically,
the Commission found (Vice Chairman Parker and Commissioner
Young dissenting and Commissioner Leonard not participating) that
articles like or directly competitive with electronic receiving tubes
and components thereof known as mounts (of the types provided for
in item 687. 60 of the TSUS) produced by the Woodbridge, N. J.,
plant of the RCA Corp. New York, N. Y., are, as a result in major
part of concessions granted under trade agreements, being imported
into the United States in such increased quantities as to cause unem
ployment or underemployment of a significant number or proportion
of the workers of such firm or an appropriate subdivision thereof.
3
Finding of the Commission
On the basis of its investigation, the Commission finds (Vice
Chairman Parker and Commissioner Leonard dissenting and Com
missioner Minchew not participating) that articles like or directly
competitive with electronic receiving tubes and components thereof
known as mounts (of the types provided for in item 687. 60 of the
Tariff Schedules of the United States) produced by the Harrison, N. J.,
plant of the RCA Corp. New York, N. Y., are, as a result in major
pa.rt of concessions granted under trade agreements, being imported
into the United States in such increased quantities as to cause or
threaten to cause unemployment or underemployment of a significant
number or proportion of the workers of such firm or an appropriate
subdivision thereof.
4
Views of Chairman Bedell. Commissioner Moore. and Commissioner Ablondi
This investigation relates to a petition filed on behalf of the
workers and former workers of the Harrison. N. J .• plant of the
RCA Corp. (RCA) for a determination under section 301 of the Trade
Expansion Act of 1962 of their eligibility to apply for adjustment
assistance.
The petitioning workers have been engaged in the manufacture
of electronic receiving tubes and electronic receiving tube mounts.
The petitioners contend as a result in major part of concessions
granted under trade agreements. an article like or directly compe
titive with the articles produced by the workers 1 firm is being imported
into the United States in such increased quantities as to cause, or
threaten to cause. unemployment or underemployment of a signifi-
cant number or proportion of the workers of the firm •
Under the Trade Expansion Act of 1962. four criteria must
be met in order for an affirmative decision to be made. These cri-
teria are as follows:
( 1) imports of an article like or directly competitive with an article produced by the petitioning workers must be increasing;
(2) the increase in imports must be a result in major part of trade-agreement concessions;
(3) a significant number or proportion of the workers concerned are unemployed or underemployed, or threatened with unemployment or underemployment, and
(4) the concession-generated increased imports must be the major factor causing or threatening to cause the unemployment or underemployment.

5
In this instance, it is our judgment that each of the four criteria
outlined above has been met.
The facts developed during this investigation are almost identical
with those in two earlier cases where the Commission made affirma-
tive determinations . .]) A discussion of the facts developed during
the investigation of the instant RCA case with reference to each of·
the four c rite ria follows:
Increased imports
Imports of receiving tubes and tube mounts have increased from
':' * * million units in 1968 to >!< * >:< million units in 1973--a ':< "~ >:< percent
increase.
In major part
The second requirement of the act is that increased imports
have resulted in major part from trade-agreement concessions. The
rate of duty on electronic receiving tubes and mounts has been reduced
from 3 5 percent ad valorem in 1930 to 6 percent in 1972 as the result
of trade-agreement concessions.
The duty reduction represented by trade-agreement concessions
were sufficiently large so as to provide an incentive for increased
imports. These concessions from 1930 duty rate increased the aver-
age unit profit of foreign production over domestic production by
an estimated * >!< * percent.
1/ ••• Workers of the Woodbridge, N. J., Plant of RCA Corp. Irlvestigation No. TEA-W-234 ••• , TC PUblication 679, 1974, ••• Workers of the Owensboro, Ky., Plant of General Electric Co •••• , Investigation No. TEA-w-217 ••• , TC Publication 634, 1974.

6
Unemployment and threat thereof
This criterion has also been met. The average annual number
of production and related workers engaged in the producti?n of elec
tronic receiving tubes and mounts from 1969 through the second quar-
ter of 1974 in the Harrison plant decreased from >:C >:C >:C in 1969 to
>:< * >:C in 1973. Ther.e was a parallel decline in the man-hours pe.r
year expended in the production of tubes and mounts during this per
iod from * >:C >:< in 1969 to ':' ':' ':'in 1973. In view of the foregoing,
it is clear that a significant number of workers have been unemployed
or underemployed, or threatened with unemployment or underemploy
ment, within the meaning of the statute.
Major factor
The fourth criterion is that concession-generated increased
imports must be the major factor causing or threatening to cause
the unemployment or underemployment of the workers at RCA engaged
in the production of electronic receiving tubes and mounts. A direct
relationship exists between the increased imports of receiving tubes
. and mounts and the unemployment of such workers. Domestic produc
tion of tubes and mounts is controlled by three highly competitive
producers. Electronic tubes and mounts are interchangeable, and
are sold on the basis of price. As RCA's competitors increased
their concession-generated imports, the company was forced to meet
its competition by changing its production plans, and increasing its
own foreign manufacturing, adversely affecting domestic employment
and causing or threatening to cause increased unemployment. In
7
order to meet the competition of foreign imports, RCA was forced
to curtail domestic production of tubes and tube mounts and increase
its imports. Accordingly, we conclude that the concession-generated
increased imports have been the major factor in causing the unem
ployment of the workers concerned.
Conclusion
We conclude that the workers and former workers of the Harrison,
N. J. , plant of the RCA Corp. , New York, N. Y. , have met the statutory
requirements and therefore have made an affirmative determination.

8
Views of Vice Chairman Parker
I have made a negative determination in this investigation because
increased imports resulting in major part from trade-agreement con-
cessions of articles like or directly competitive with receiving tubes
and mounts produced at the Harrison. N. J .• plant of the RCA Corp.
are not the major factor causing the unemployment or underemploy··
ment of the workers of that plant.
In June 1974, the Commission had before it the same issue
with respect to the workers of the Woodbridge, N. J., plant of the
RCA Corp. In that proceeding I found that increased imports result-
ing in major part from trade-agreement concessions of articles like
or directly competitive with receiving tubes and mounts produced
at the Woodbridge, N. J., plant of the RCA Corp. were not the major
factor causing the unemployment or underemployment of the workers
at that plant.
My statement of views in that proceeding is equally applicable
to this investigation. 1 I
1/ Electronic Receiving Tubes and Mounts: Workers of the Woodbridge, N. J •• Plant of RCA Corp •.•• , Investigation No. TEA-W-234 .•. , TC Publication 679, July 1974, pp. 7-9.

9
View of Commissioner Leonard
My determination in the instant case is negative because one
of the statutory criteria has not been met. i.e .• that the _increase
in imports of articles like or direc~ly competitive with electronic
receiving tubes and components thereof known as mounts produced
by the Harrison. N._J .• plant of the RCA Corp .• New York. N. Y .•
is the result in major part of concessions granted under trade agree-
ments. My reasoning in support of this determination is set forth
in statements of my views in earlier Commission investigations under
the Trade Expansion Act. 1/
1/ Electronic Receiving Tubes and Mounts: ... Report to the President on Investigation No. TEA-W-217 ...• TC Publication 637, 1974. pp. 7-9.
Transistors and Diodes: •.. Report to the President on Investigation No. TEA-W-196 ...• Tc Publication 588. 1973. pp. 10-12.
Electronic Receiving Tubes and Transistors: .•• Report to the President on Investigation No. TEA-W-89 ...• TC Publication 396. 1971. pp. 3-4.
Capacitors and Semiconductors: ... Report to the President on Investigation No. TEA-F-22 ...• Tc Publication 394. 1971. pp.


A-1
INFORMATION OBTAINED IN THE INVESTIGATION
Description and Uses
Electronic receiving tube mounts are consumed in electronic
receiving tubes, which in turn, are today utilized almost entirely
in television receivers. The basic components of an electronic
receiving tube are t.he mount, a glass or metal envelope, and, for
some types, a phenolic base. The mount is a round, flat glass disc
to which the functioning elements of the tube have been attached.
These elements are the cathode(s), plate(s), grid(s), and filament(s),
as well as such accessory parts as getters, metal-heat dissipating
shields, and contacts for external connections. The tube is completed
by placing a glass or metal envelope over the mounts, sealing the
envelope to the base, exhausting the air from the interior to create
a vacuum, and, if required, attaching the base to the glass disc pre
viously described. These finishing operations are highly automated.
The manufacture of the mount components requires a number
of machine operations, such as stamping mica spacers and metal
parts and winding fine coils to form grids. Assembling the compo
nents requires numerous meticulous operations, such as welding fine
wire connections. For those mounts produced in large volume, a
high degree of mechanization is possible. However, setting up auto
matic machinery for long production runs is both time consuming
and costly and is often accompanied by a high rejection rate during
initial assembly. Some operations are extremely difficult to auto
mate, and mounts made in limited quantities are usually assembled
more economically by hand. In general, mounts assembled in domestic

A-2
facilities, such as RCA's Harrison plant, require the least amount
of labor. Mounts which are highly labor intensive are typically assem-
bled in foreign facilities operated by U.S. producers, examples of
which are RCA's plants in Mexico and Brazil.
In recent years, technological advances in solid-state semicon-
ductor components, beginning with diodes and transistors and foll'6wed
by integrated circuits, have permitted these devices to replace elec-
tronic receiving tubes in an ever-increasing number of applications.
These articles are not made in RCA's Harrison and Woodbridge plants--
the two domestic plants _of RCA in which electronic receiving tube
mounts and tubes have been manufactured. 1 I
Diodes include most semiconductors having two terminals, i.e.,
rectifiers. signal diodes, and switches. 2/ A transistor is most
often a three-terminal device which performs most functions of a
diode but is frequently used for signal amplification. Integrated cir-
cuits, which include small-. medium-, and large-scale integration
arrays, may consist of both active and passive components integrated
on a single substrate. Integrated circuits may function as, or include
1 / RCA is gradually phasing out all the ope rations at the Woodbridge plant and consolidating them those at with the Harrison plant. The target date for completion of this move is the first quarter of 1975.
2/ ~ectifiers convert an alternating current signal to a direct current signal. Some rectifiers, such as thyristors, have three or more terminals. Signal diodes perform many functions, depending upon their voltage-current characteristics; e.g •• tunnel diodes may be used as detectors, amplifiers, or switches in electronic circuits. Switches are used to permit or inhibit the movement of an electronic signal; they may have two or more terminals, and one switch may provide many switching functions.

A-3
the functions of. thousands of diodes, transistors. resistors. capaci
tors. and inductors.
Semiconductors (diodes, transistors. and integrated circuits)
have already displaced receiving tubes and other electronic compo
nents in many applications, such as most consumer electronic pro
ducts. computers. communications equipment, industrial controls,
and military electronic equipment. However, receiving tubes con
tinue to be used, largely in high-voltage or high-current circuits
and as replacements in previously produced equipment which utilize
receiving tubes. The bulk of the receiving tubes at present are
used for replacement in television receivers and as original equipment
in new television sets.
U.S. Tariff Treatment
Electronic receiving tubes and mounts, the articles produced
by the petitioning workers at the Harrison. N. J., plant of RCA Corp.,
are classified under item 687. 60 of the TSUS, which also provides
for transistors, certain other electronic tubes, semiconductors, and
related parts. Under the original schedules of the Tariff Act of 1930.
these articles were classifiable in a group of electrical articles under
paragraph 353 at the rate of 35 percent ad valorem. Television
receivers. the end product for most receiving tubes. as well as
diodes. transistors. and integrated circuits. were also classifiable
under paragraph 353 of the Tariff Act of 1930. but now are classifed
under 685. 20 of the TSUS. The 35-percent rate remained unchanged
from June 18. 1930, through December 31, 1938.

A-4
Pursuant to successive trade-agreement concessions beginning
in 1939, the applicable rates of duty have been substantially reduced.
The rates of duty currently (1974) in effect on these articles range
from 5 percent ad valorem to 6 percent, reflecting the final stage,
effective January 1, 1972, of the five-stage concessions granted in
the Kennedy Round negotiations under the General Agreement on 'far
iffs and Trade (GATT).
The effective dates of the various rates of duty applicable to
the aforementioned articles under the Tariff Act of 1930, as modi
fied by trade-agreement concessions and the Tariff Classification
Act of 1962, are given in the following table.

A-5
Certain electronic components and television receivers: U.S. rates of duty, 1930-72
June Jan.
Jan. Jan. June June June July Aug. Jan. Jan. Jan. Jan. Jan.
(In percent ad valorern)
Effective date Authority
:Receiving tubes,: transistors, :Television diodes, and :receivers
integrated : (TSUS i tern circuits (TSUS 685.20)
i tern 687 . 60)
18, 1930----: Tariff Act of 1930----: 35.0 35.0 1, 1939----: Trade agreement with 25.0 25.0
the United Kingdom. : 1, 1948----: GAIT concession-------: 15.0 15.0 6, 1951----:--------do-------------: 12.5 12.5
30, 1956----:--------do-------------: 12.5 11. 5 30, 1957----:--------do-------------: 12.5 11. 0 30, 1958----:------~-do-------------: 12.5 10.5
1, 1962----:--------do-------------: 12.5 10.0 :n, 1963----: 1/ 12.5 10.0
1, 1968----: GATT concession-------: 11.0 9.0 1, 1969----:--------do-------------: 10.0 8.0 1, 1970----:--------do-------------: 8.5 7.0 1, 1971 2/--:--------do-------------: 7.0 6.0 1, 1972-~--:--------do------~------: 6.0 5.0
1/ Tariff Classification Act of 1962. 2/ An additional 10-percent import duty was imposed from Aug. 16,
1971, to Dec. 19, 1971 (Presidential Proclamations 4074 and 4098). On July 8, 1974, the United States Customs Court held that Presidential Proclamation 4074 was invalid (Yoshida International, Inc. vs. United States, Customs Decisions 4550). This ruling has been appealed to the United States Court of Customs and Patent Appeals.
In addition .. the TSUS under items 806. 30 and 807. 00 provides
partial exemption from the duties shown above. Pursuant to the pro-
visions of item 806. 30, articles of metal (except precious metal) that
have been manufactured, or subjected to a process of manufacture,
in the United States and exported for processing and returned to the
United States for further processing are subject to duty only on the
value of the foreign processing. Under tariff item 807. 00, imported
articles assembled in foreign co1 . .mtries with fabricated components
A-6
that in whole or in part have been manufactured in the United States
are subject to duty on the full value of the imported article less
the value of U.S. fabricated components contained therein. No fur-
ther processing in the United States is required for articles imn0rted
under item 807. 00. The provisions of items 806. 30 and 807. 00 have
not been the subject of trade agreement concessions, but the ra.tes
of duty applicable to the dutiable value of articles entered there under
have been subject to concessions .
U.S. Producers
Three firms in the United States account fov- nearly all of the
domestic production of electronic recieving tubes--General Electric
Co., RCA Corp., and GTE Sylvania. These firms obtain the elec-
tronic receiving tube mounts used in manufacturing tubes from their
own plants in the United States and from their foreign affiliates in
Brazil, Mexico, and Singapore. ':' ':' ':' also supplies parts to two
domestic service organizations to assemble mounts.
U.S. Consumption, Shipments, and Imports
Electronic receiving tube mounts ]J
,,, ,,,
1/ The data in this section a re based on information obtained by the Tariff Commission from the three largest domestic manufacture ·-s of electronic receiving tubes. These firms are believed to have accounted for more than 95 percent of U.S. production of electronic receiving tubes, and consequently .. of the consumption, shipment, and imports of tube mounts.

A-7 through A-10
, .. . ,,


A-11
Electronic receiving tubes
Consumption of receiving tubes has declined steadily in recent
years as semiconductors have been utilized increasingly in consumer
electronic products. The expanding use of improved semiconductors
in these products has limited. in large part, the use of receiving
tubes to television receivers and the replacement market.
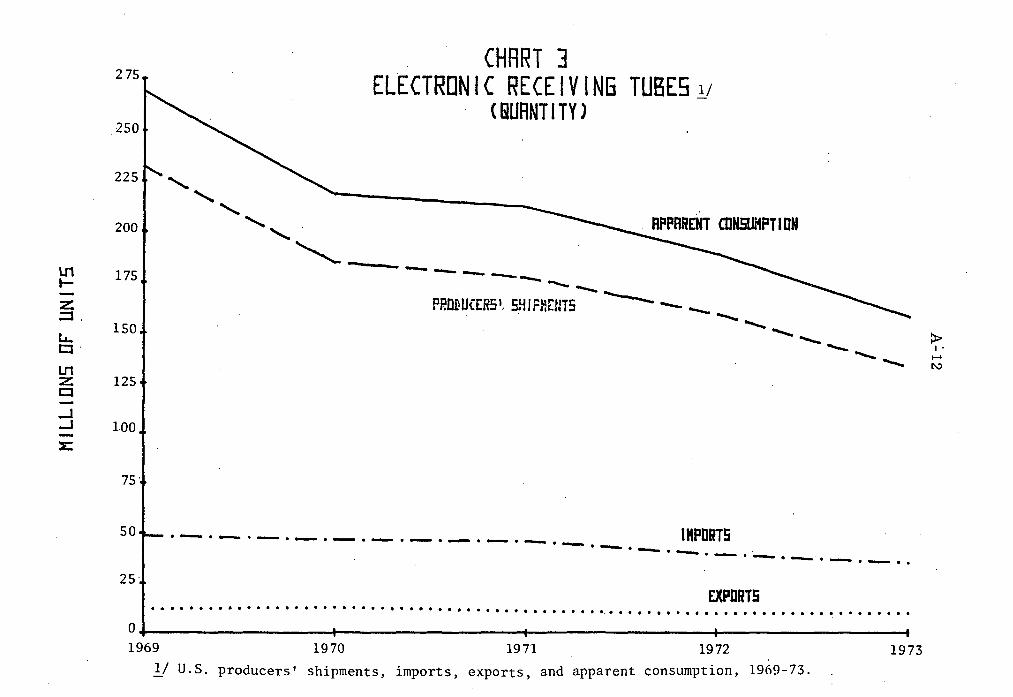
Apparent U.S. consumption of receiving tubes declined steadily
from 269. 0 million units, valued at $230. 2 million, in 1969 to 158. 9
million units, valued at $158. 5 million, in 1973 as shown in charts
3 and 4 on pages A-12 and A-13 (and in table 2). For January-June
1974, tube consumption amounted to 61. 4 million units. valued at
$53. 2 million, compared with 81. 6 million units, valued at $ :9. 6
million, for the corresponding period in 1973.
Shipments of receiving tubes by U.S. producers generally fol
lowed the same trend as U.S. consumption of such tubes, declining
steadily throughout recent years. Annual shipments declined from
232. 2 million units, valued at $225. 0 million, in 1969 to 133. 4 million
units, valued at $152. 1 million, in 1973. These shipments amounted
·to 54. 1 million units, valued at $53. 3 million, in January-June 1974,
compared with 66. 0 million units, valued at $ ·5. 2 million, for the
corresponding period in 1973.
The quantity of U.S. imports of receiving tubes declined steadily
from 48. 7 million units in 1969 to 35. 4 million units in 1973. How
ever, the value of the imports, after declining from $18. 4 million
in 1969 to $17. 6 million in 1970, increased steadily to $18. 8 million
in 1973. For January-June 1974, imports amounted to 13. 1 million
U1 t--z ::::J .
LL.. Cl '
U1 z c:::i
...J
275
250
225
200
175
150
125
', ' .........
'
CHART 3 ELECTRONIC RECEIVING TUBES_v
CGURNTITYl
....... ------------"'-- - -----PRIIDUCER5'. 5HIFMr!ll5 -._-._-._ -- -- .._
...J 100 -x;
75·
so lHPDRTS ·-·-·-·-·-·-·-·-·-·-·-·-·-·-·-·-·-·-·-·· 25
EXPORTS ............................................... •- ............................... . o+-~~~~~~~~~~-+~~~~~~~~~~~+-~~~~~~~~~~-+~~~~~~~~~~--..
1969 1970 1971 1972 1973
1/ U.S. producers' shipments, imports, exports, and apparent consumption, 1969-73.
~ I. I-' t...:>

lI1 0::: c: _J _J CJ 0
I.&.. CJ
lI1 z
250
225
200
175
150
125
CHART ~ ELECTRONIC RECEIVING TUBES 1/
CVRLUEJ -
- ---~........ __ __ ........ ______ --- --------
.....___ --- .......
PRDD
...._ ..........
................................... IPHENlS UCERS' SH ·
::i::. I
..... °"
CJ 100 _J _J
:c 75
so
25 IMPORTS . - . - . - .......... - . - . - . .,..._.. - . - . - . - . -- . -- . - . - . .,_. - . - .. . . . . . . . . . . . . . . . . . . . . . . . . . . . . . . . . . . . . . • . . • . . . . . . • . . • • . . . . . . . . . • . . . . . . . . . . . . ~X}l"Odl'S. 0 +-~~~~~~~~~+-~~~~~~~~---i--~~~~~~~~--t~~~~~~~~~-t 1969 1970 1971 1972 1973
lf U.S. producers' shipments, imports, exports, and apparent consumption, 1969-73.

A-14
units, valued at $7. 0 million. compared with 20. 8 million units,
valued at $10. 5 million, in the like period of 1973. In terms of
quantity, the share of annual domestic consumption of re.ceiving
tubes supplied by imports steadily increased from 18. 1 percent in
1969 to 22. 3 percent in 1973 except for a slight decline in 1972;
the share accounted for by imports in January-June 1974 amounted
to 21. 3 percent, compared with 25. 5 percent for the correspondin·g
period in 1973. In terms of value, the import share of consumption
has risen each year, from 8. 0 percent in 1969 to 13. 2 percent
in January-June 1974. Table 3 shows the U.S. rates of duty and
the value of U.S. imports of electronic receiving tubes and receiv
ing tube mounts during 1964-73; data on imports for earlier years
are not available.
In addition to imports of electronic receiving tubes per se. sub
stantial quantities are imported as parts of imported television receiv
ers. the principal consumer electronic products in which receiving
tubes have been used in recent years. The following table, based
partly on estimates, shows that imports of tubes as components of
imported television receivers increased from 53. 9 million in 1969
to 62. 4 million in 1972 and then declined to 46. 9 million in 1973.
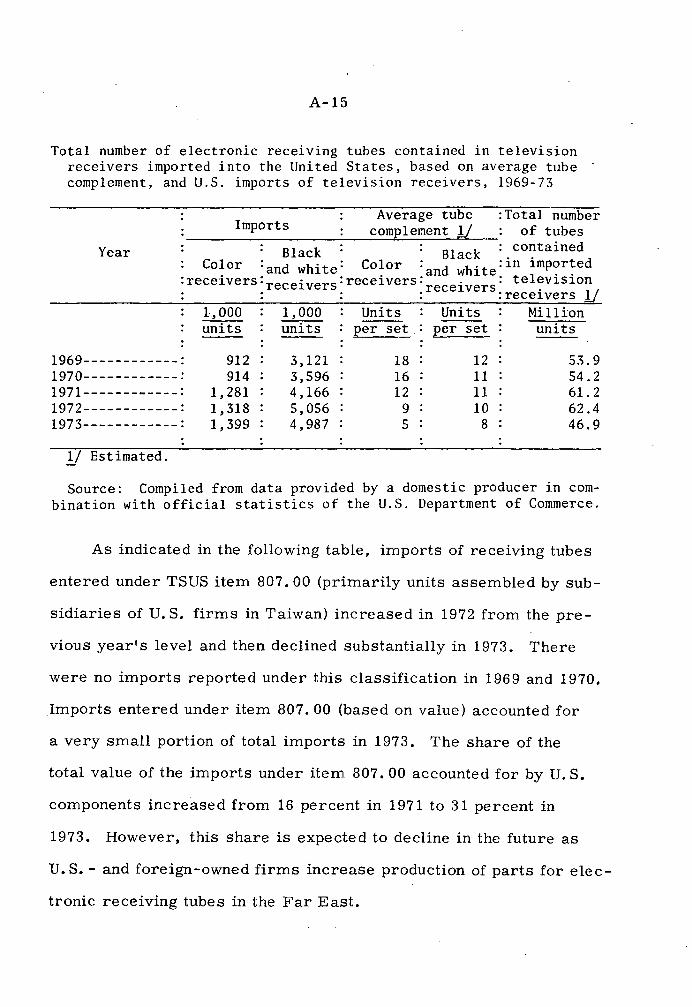
A-15
Total number of electronic receiving tubes contained in television receivers imported into the United States, based on average tube complement, and U.S. imports of television receivers, 1969-73
Average tube :Total number complement l} of tubes Imports
Year Black Bl k : contained ac . . d
Color =and white: Color : d h.t :in 1mporte . an w 1 e 1
. . :receivers=receivers=receivers: . : te ev1s1on
: :receivers:receivers l} 1,000 units
1,000 Units Units Million per set. per set units
1969------------: 1970------------= 1971------------: 1972------------: 1973------------:
1/ Estimated.
912 914
1,281 1,318 1,399
3,121 3,596 4,166 5,056 4,987
18 16 12
9 5
12 5.~. 9 11 54.2 11 61. 2 10 62.4
8 46.9
Source: Compiled from data provided by a domestic producer in combination with official statistics of the U.S. Department of Commerce.
As indicated in the following table, imports of receiving tubes
entered under TSUS item 807. 00 (primarily units assembled by sub-
sidiaries of U.S. firms in Taiwan) increased in 1972 from the pre-
vious year's level and then declined substantially in 1973. There
were no imports reported under this classification in 1969 and 1970.
Imports entered under item 807. 00 (based on value) accounted for
a very small portion of total imports in 197 3. The share of the
total value of the imports under item 807. 00 accounted for by U.S.
components increased from 16 percent in 1971 to 31 percent in
1973. However, this share is expected to decline in the future as
U.S. - and foreign-owned firms increase production of parts for elec-
tronic receiving tubes in the Far East.

A-16
Electronic receiving tubes: U.S. imports entered under item 807.00, 1969-73 l/
Item 1971
Quantity-----------------------------units--: 40,000 Total value------------------------dollars--: 9,281 Value of U.S. components, duty exempt ·
dollars--: 1,486 Foreign value added~------------------do----: 7,795 Ratio of value of U.S. components to total
value of imports-----------------percent--: 16.0
1972
761,855 219,586
1973
41,853 32,888
45,114 10,215 174,472 :· 22,673
20.5 '31.1
1/ There were no imports under item 807.00 in 1969 and 1970.
Source: Compiled from official statistics of the U.S. Department of Commerce.
Television receivers
Apparent U.S. consumption of television receivers (monochrome
and color) increased from 12. 6 million units, valued at $2. 1 billion,
in 1969 to 16. 5 million units. valued at $2. 7 billion, in 1973 as shown
in charts 5 and 6 on pages A-17 and A-18 (and in table 4). The quan-
tity of imports expressed as a percent of consumption increased from
32 percent in 1969 to 39 percent in 1971 and has since remained at
that level. The value of imports expressed as a percent of consump-
tion generally followed the same trend, increasing from 14 percent
in 1969 to 19 percent in 1972 and 1973.
U.S. producers' shipments of domestically produced television
receivers (monochrome and color) declined slightly from 8. 7 million
units. valued at $1. 9 billion, in 1969 to 8. 3 million units, valued
at $1. 7 billion, in 1970 and then increased annually to an estimated
10. 4 million units, valued at $2 .• 3 billion, in 1973.

18,000
15,000
lI1 12,000 l--::z :::l
u.. Cl
lJ1 c z a: lJ1 :::l Cl :r: l-
9,000
6,000
3,000
CHART S TELEVISION RECEIVERSv
CGUANTITY) RPPRRENT CONSUMPTION
------------- - - - - - - - - - - - - - - - -- PRD~UCER5' SHIPllENTS
1HPms· - · - · ..
·-·-·-·-·-·-·-·-·-·-·-·-·-·-·-·-·
EXPORTS 0 I . . ................. . ···················r···················r···················i· .I
1969 1970 1971 1972 l973
..!/ U.S. producers' shipments, imports, exports, and apparent consumption, 1969-73.
::t> I
....... -.J


A-19
During 1969-73, annual U.S. imports of television receivers
(monochrome and color) increased each year--rising from 4. 0 million
units, valued at $296 million, in 1969 to 6. 4 million units. valued
at $531 million. in 1973--representing a gain of 58 percent in terms
of quantity and of 79 percent in terms of value (table 4). The rates
of duty and the valu.e of imports of television receivers during 1964-73
are shown in table 5; data on imports in earlier years are not available.
Imports of television receivers entered under tariff item 807. 00
(primarily units assembled by foreign subsidiaries of U.S. firms
in Taiwan and Mexico) increased during 1969-73 both in absolute amounts
(see following table) and in relation to total imports. Based on value,
imports entered under item 807. 00 accounted for 26 percent of total
imports in 1973. compared with 16 percent in 1969; based on quantity,
such imports accounted for 23 percent and 42 percent of the total.
respectively. in those years.
Television receivers: U.S. imports entered under item 807.00, 1969-73
Item 1969 1970 1971 1972 1973
Quantity--------------1,000 units--: 940 :1,197 :1,423 :2,765 2,703 Total value-------million dollars--: 47.0 56.1 71. 9 :144.5 139.3 Value of U.S. components,
duty exempt----------------do----: 17.7 19.7 22.4 30.5 25.0 foreign value added,
dutiable-------------------do----: 29.3 36.4 49.5 : 114. 0 114. 3
Source: Compiled from official statistics of the U.S. Department of Commerce.
A-20
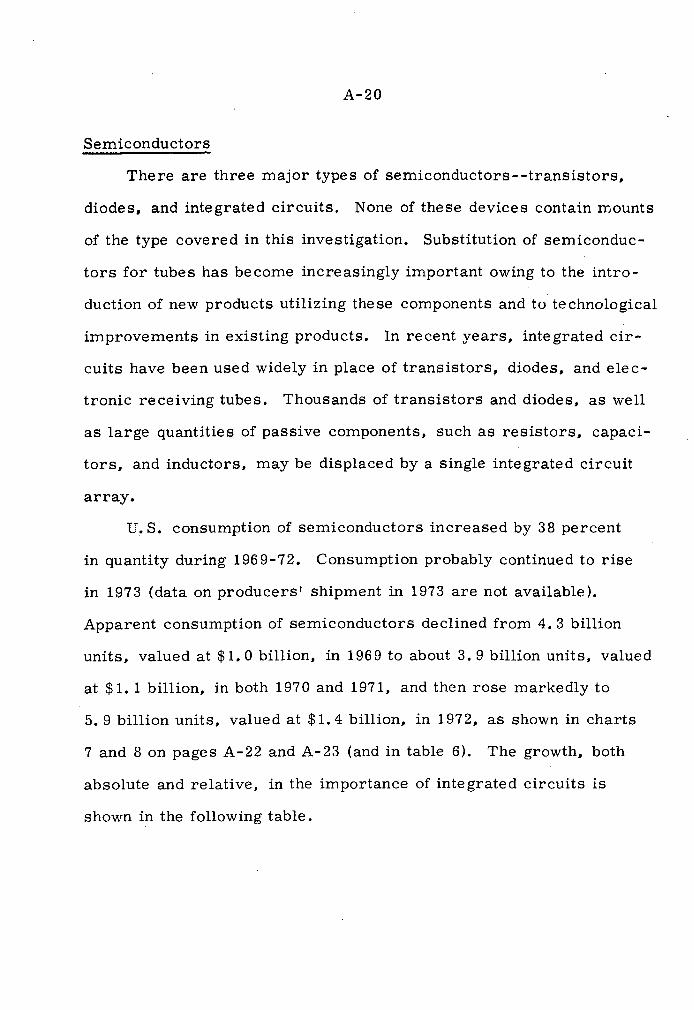
Semiconductors
There are three major types of semiconductors--transistors,
diodes, and integrated circuits. None of these devices contain mounts
of the type covered in this investigation. Substitution of semiconduc
tors for tubes has become increasingly important owing to the intro
duction of new products utilizing these components and to technological
improvements in existing products. In recent years, integrated cir
cuits have been used widely in place of transistors, diodes, and elec
tronic receiving tubes. Thousands of transistors and diodes, as well
as large quantities of passive components, such as resistors, capaci
tors, and inductors, may be displaced by a single integrated circuit
array.
U.S. consumption of semiconductors increased by 38 percent
in quantity during 1969-72. Consumption probably continued to rise
in 1973 (data on producers' shipment in 1973 are not available).
Apparent consumption of semiconductors declined from 4. 3 billion
units, valued at $1. 0 billion, in 1969 to about 3. 9 billion units, valued
at $1. l billion, in both 1970 and 1971, and then rose markedly to
5. 9 billion units, valued at $1. 4 billion, in 1972, as shown in charts
7 and 8 on pages A-22 and A-23 (and in table 6). The growth, both
absolute and relative, in the importance of integrated circuits is
shown in the following table.
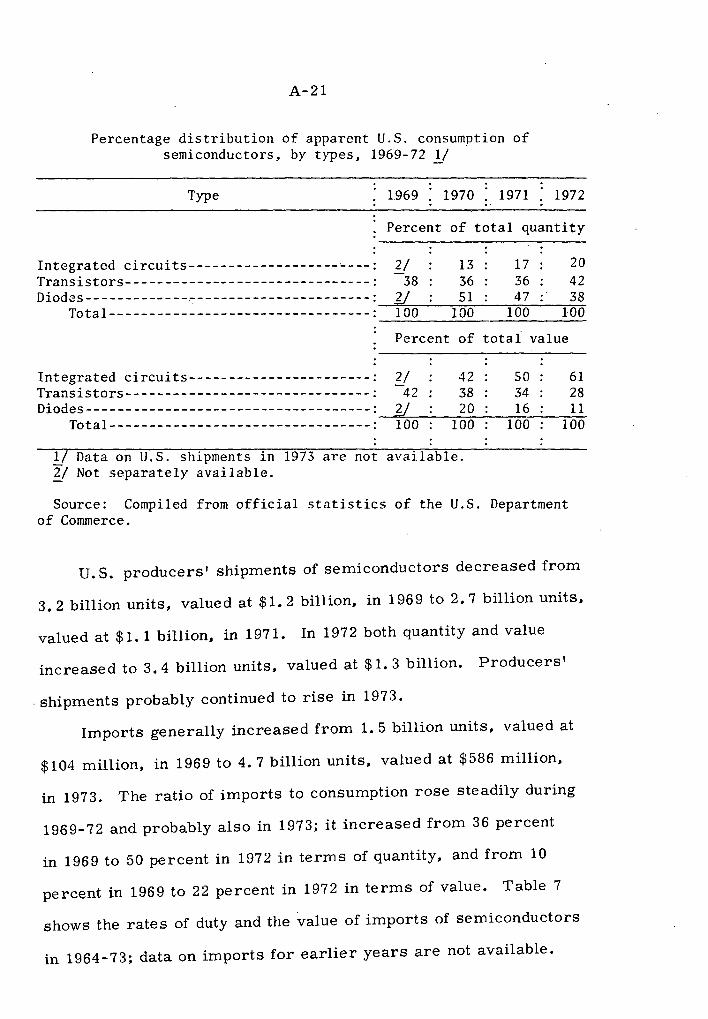
A-21
Percentage distribution of apparent U.S. consumption of semiconductors, by types, 1969-72 .!/ ·
Type 1969 : 1970 1971 1972 .. Percent of total quantity
Integrated circuits-------------------~---· Transistors-------------------------------: Diodes-------------~----------------------:
2/ 38
y
13 36 51
17 20 36 42 47 38
Total----------~----------------------; 100 100 100 100
Percent of total value
y 42 so 61 42 38 34 28
y 20 16 11
Integrated circuits-----------------------: Transistors-------------------------------: Diodes------------------------------------:
Total---------------------------------; 100 100. 100 100
l/ Data on U.S. shipments in 1973 are not available. Y Not separately available.
Source: Compiled from official statistics of the U.S. Department of Commerce.
U.S. producers' shipments of semiconductors decreased from
3. 2 billion units, valued at $1. 2 billion, in 1969 to 2. 7 billion units,
valued at $1.1 billion, in 1971. In 1972 both quantity and value
increased to 3. 4 billion units, valued at $1. 3 billion. Producers'
. shipments probably continued to rise in 197 3.
Imports generally increased from 1. 5 billion units, valued at
$104 million, in 1969 to 4. 7 billion units, valued at $586 million,
in 1973. The ratio of imports to consumption rose steadily during
1969-72 and probably also in 1973; it increased from 36 percent
in 1969 to 50 percent in 1972 in terms of quantity, and from 10
percent in 1969 to 22 percent in 1972 in terms of value. Table 7
shows the rates of duty and the value of imports of semiconductors
in 1964-73; data on imports for earlier years are not available.

U1 r--z ;:::l
Li... CJ
LI1 z Cl -_J _J -z:
6,000
2 '00 l)
CHART 7 SEM l CONDUCTORS i1
C liURNT I TY )
RPPRRENT CD~MPTIDN
.,,,.,,,. / / ,,,
/ . ,, ~I -H' r''.1n,115 .- / , ..... '' p,•;;;•, ... , • :-. ,_., ~ ./ F.'"'"'""" - _,.,,. r
/ --------------/
/ /~ IMPOfH5
/
·---·--· / - . - . --- . .__ . - . --- . --- .
EXPORTS .................... . . . . . . . . . . . . . .. . . . . . . . . . . . . . . . . . . . . . . . . . . . . .
,;' , /.
/
/ ~,
. ............. .
0 +-~~~~~~~~~i--~~~~~~~~-+~~~~~~~~~--~~~~~~~~~-
:i> I
[\j
l,.'V
1969 1970 1971 1972 1973
1/ U.S. producers' shipments, imports, exports, and a_J>parent consumption; 1969-73.

lr1 a:: u: -l -l Cl 0
LL.. t:J
U1 z t:J _J _J -L:
2,000
1,500
I,000
500
CHART 8 SEMI CONDUCTORS i;
(VALUE)
PRODUCERS' 5HIP~.£N15
~ _.,,- ___ ~~
--- ~ -- -- -- ------ - - - --RPPnRENT CDNSUHPTIDN
--- .,,
.,,....-.,,....-
.,,....-.,,....- . .,,....-
. . . ... ... lKPDRlS
. . . . . . . . . . . . . . . . . . . . . . . . . . . . .,,....- .. ······ .--·-- .. ·· ····· --·-- ,•' -- . - . - . - . - . - . - - . ---= : a-- . ~· ................ . EXPORTS
0 ..-~~~----~~----+-----------~------.-------------------t--------------------t 1969 1970 1971 1972 1973.
_!/ U.S. producers' shipments, imports, exports, and apparent consumption, 1969-.73.
~ I ~ UJ

A-24
The great bulk of U.S. imports of semiconductors in recent yea rs
has been classified under TSUS items 806. 30 and 807. 00 and were
entered by a few U.S. firms, principally ':' >:' ':', * ':: ':', and ':' ':< ':<.
As shown in table 8, these imports accounted for 89 percent, in
terms of quantity. and 84 percent, in terms of value, of total imports
of semiconductors in 1969. These shares have declined to 73 percent
and 70 percent, respectively, of total imports of semiconductors in
1973. However, such imports increased irregularly from 1. 4 billion
units, valued at $87 million. in 1969 to 3. 5 billion units, valued at
$408 million, in 1973 (table 9).
Statistics on shipments, imports. exports, and consumption of
transistors, diodes, and integrated circuits are shown in tables 10,
11, and 12, respectively.
-·,,-
RCA Corp.
_,_ -.-

*
A-25 through 40
-·.,, -~ .,,


A-41
STATISTICAL APPENDIX

,,_ 1'
A-42
,,_ .,, *

A=43
Table 2.--Electronic receiving tubes: U.S. producers' shipments, impo~ts for consumption, exports of domestic merchandise, and apparent consumption, 1969-73, January-June 1973, and January.June 1974
___ (Quantity in_..!!1J-llions of units; value in millions of dollar_s~) __ _ :p d ,: : :A : Ratio . ro ucers . pparent · · ·(percent) of Pet iod : ship- : Imports 2/: Exports: consump-: . · · · . I . -- . . t' . imports to . ments 1 . 1on .
---··------·---------__: __________ . ___________ . _______ _ __ : __ consumption
Quantjty ·------
1969---------------: 232.2 48.7 11. 9 269.0 18. 1 1970---------------: 184. 7 46.7 12.7 218.7 21. 4 19 71- - -- - - - - - - - - - - -- - : 177. 4 46.0 10.7 212.7 21.6 1972---------------: 159.9 39.4 9.8 189.5 20.8 1973---------------: 133.4 35.4 9.9 158.9 22.3 .January-June--
1973-------------: 66.0 20.8 s. 2 8 l. 6 25,5 1974-------------: 54.1 13. 1 5.8 61. 4 21. 3
Value
1969---------------: 225.0 18.4 13.2 230.2 8.0 1970---------------: 200.2 17.6 13.3 204.5 8.6 1971---------------: 197.4 18.0 12.7 202. 7 8.9 1972---------------: 178.4 18.7 12.9 184.2 10.2 1973---------------: 3/ 152. l 18.8 12.4 158.5 11.9 January- .June- -
1973-------------: 3/ 75. 2 ] o. 5 6.1 79·6 13-2 1974-------------: 'ii S.3. 3 7.() 7. l 53.2 ).). 2
1/ Compiled from sales data supplied by the Electronic Industries Association and average prices derived from U.S. Department of Commerce
·estimates. 2/ Total imports adjusted by U.S. Tariff Commission to delete imports
of-mounts entered under TSUSA item 687.6010 (estimated). See Customs Information Exchange (C.l.E.) N-95/73 dated Mar. 6, 1973. ii Estimated by the U.S. Tariff Commission.
Source: Compiled from official statistics of the U.S. Department of Commerce, except as noted.

"' ,,.
A-44
·'· .,.

A-45
Table 4.--Television receivers: U.S. producers' shipments, imports for consumption, exports of domestic merchandise, and apparent consumption, 1969-73
(Quantity in thousands of units; value in millions of dollars)
Year Producers' shipments
: : : Ratio : :Apparent:(percent) of
Imports:Exports:consump-: imports to ti on
•· Quantity
1969---------------: 8, 721 4,033 157 1970---------------: 8,308 4,510 126 1971---------------: 8,740 5,447 162 1972---------------: 10,219 6,375 224 1973---------------: l) 10,400 6,387 314
Value
1969---------------: 1,852 296 33 1970---------------: 1,714 315 26 1971---------------: 1,976 413 37 1972---------------: 2,248 497 59 1973--~------------: 1/ 2,300 531 84
lf Estimated by the U.S. Tariff Commission.
12,597 12,692 14,025 16' 3 70 16 '4 7 3
2, 115 2,003 2,352 2,686 2,747
consumption
32 36 39 39 39
14 16 18 19 19,
Source: Compiled from official statistics of the U.S. Department of Commerce.

A-46
Table 5.--Television receivers: U.S. rates of duty and imports for consumption, by types, 1964-73
Imports Year :Rate of duty:~~~~~.~~~~~~~
:Monochrome: Color Total . . Percent
ad valorem Million :Million:Million dollars :dollars:dollars
1964---------------~----------: 1965--------------------------: 1966--------------------------: 1967--------------------------: 1968--------------------------: 1969--------------------------: 1970--------------------------: 1971--------------------------: 1972--------------------------: 1973--------------------------:
10 10 10 10
9 8 7 6 5 5
ll f/ Tl Tl
97 152 174 208 262 269
ll II Tl Tl l06 143 142 205
•. 235 262
1/ U.S. imports of monochrome and color television receivers were not separately reported in official statistics prior to 1968.
39 60
ll5 124 204 296 316 413 497 531
Source: Compiled from official statistics of the U.S. Department of. Commerce.
Note.--Because of rounding, figures may not add to the totals shown.

A-47
Table 6.--Semiconductors: U.S. producers' shipments, imports for consumption, exports of domestic merchandise, and apparent consumption, 1969- 73
(Quantity in millions of units; value in millions of dollars) : . : : Ratio
Producers' : :Apparent: (percent) of Year shipments :imports .Exports.con~ump-: imports to
Quantity
1969---------------: 3,233.3 :1,534.4 497.1 1970---------------: 2,977.9 :l,4o4.8 544.7 1971---------------: 2,655.7 :1,516.3 331.3 1972---------------: 1/ 3,393.7 :2,979.4 468.6 1973---------------: 2J :4,713.7 779.6
Value
1969---------------: 1,154.0 104.3 211. 0 1970---------------: 1,141.1 157.2 246.0 1971---------------: 1,140.7 179.1 191. 2 1972---------------: 1,342.4 316.4 229.6 1973---------------: 2/ 585.9 417.2
1/ Estimated by the U.S. Tariff Commission. I/ Not available.
ti on consumption
:4,270.6 :3,898.0 :3,840.7 :5,904.6
2J
:1,047.3 :1,052.3 :1,128.6 :1,429.2
2/
2J
2/
35.9 37.6 39.5 50.5
10.0 14.9 15.9 22.2
Source: Compiled from official statistics of the U.S. Department of Commerce, except as noted.

Table 7.--Semiconductors: U.S. rates of duty and imports for consumption, by types, 1964-73
Rate of Imports Year duty Integrated :Transistors Diodes
: circuits Percent Million Million Million
:ad valorem: dollars dollars dollars
1964----------: 12.5 5.6 1/ 1/ 1965----------: 12.5 15.1 f / f / 1966----------: 12.5 28.7 f / f / 1967----------: 12.5 26.7 f / f / 1968----------: ll. 0 44.7 f / f / 1969----------: 10.0 59.0 f / f / 1970----------: 8.5 59.8 27.9 69.4 1971----------: 7. o. 60.4 24.5 94.2 1972----------: 6.0 100.1 35.9 180.5 1973----------: 6.0 159.8 69.2 356.9
lJ Not separately available.
Total
Million dollars
. 8.4 24.3 42.2 43.4 71. 5
104.3 157.2 179.1 316.4 585.9
Source: Compiled from official statistics of the U.S. Department of Commerce.
Note.--Because of rounding, figures may not add to the totals shown.

A-49
Table 8.--Semiconductors: Share of total U.S. imports represented by imports under TSUS items 806.30 and 807.00, by types, 1969-73
Type 1969 : 1970 : 1971 1972 : 1973
Integrated circuits-----------: 1/2/ Transistors-------------------: Diodes--------------·----------: 2/ Rectifiers--------------------: 2! Other-------------------------: 2!
Average-------------------:
Integrated circuits-----~-----: yy Transis~ors-------------------: Diodes------------------------: 2/ Rectifiers--------------------: 2/ Other-------------------------: 2/
Average-------------------:
Percent of total quantity
86 97 85 80 92 91 86 87
: ) ( 81 :)y 86 3/ 82 : ( 88 : ) : ( 81
89 90 84 84
Percent of total value
81 95 87 79 86 89 87 82
: ) ( 61 :)y 72 3/ 69 ( 88 : ) ( 66
84 88 85 79
64 75 81 72 68 73
70 73 57 77 56 70
1/ Data do not include integrated circuits imported under TSUS item 806.30.
2/ Data on diodes, rectifiers, and other semiconductors are included with those on integrated circuits.
3/ Data on diodes, rectifiers, and other semiconductors are aggregated.
Source: Compiled from official statistics of the U.S. Department of Commerce.

A-50
Table 9.--Semiconductors: Total U.S. imports under TSUS items 806. 30 and 807. 00, by types, 1969-73
Type 1969
Integrated circuits-----: 1/2/ 718.2
Transistors----: 646.3 Diodes---------: 2/ Rectifiers-----: 2/ Other----------: 2/
Total------: 1,364.5
Integrated circuits-----: 1/2/ 36.6
Transistors----: 50.7 Diodes---------: 2/ Rectifiers-----: 2! Other----------: 2/
Total------: 87.3
1970 1971 1972
Quantity (million units)
240.5 275. 0 538. 6 548.1 481.7 1,222.6
: ) : ( 577 .1 :)~ 529.9 3/ 517.7 : ( 72.2 : ~ : ( 86.9
1,318.5 1, 27 4. 5 : 2,497.5
Value (million dollars)
65.8 82.6 143.0 53.1 52.8 81.8
: ) : ( 12.6 : ) ~ .20.2 3/ 16.8 : ( 7.5 : ) : ( 4 .4
139. l 152.2 249.4
1973
697.2 1,529.·l
970.8 164.6 102.0
3,463.7
249.3 116.1
23. 0 l l. 0 8.2
407. 6.
1/ Data do not include integrated circuits imported under TSUS item 806.30. In 1969 the value was about $20.3 million.
2/ Data on diodes, rectifiers, and other semiconductors are included with those on integrated circuits.
3/ Data on diodes, rectifiers, and other semiconductors are aggregated.
Source: Compiled from official statistics of the U.S. Department of Corrrrnerce.
Note.--Because of rounding, figures may not add to the totals shown.

A-51
Table 10.--Transistors: UrS. producers' shipments, imports for consumption, exports of domestic merchandise, and apparent consumption, 1969- 73
(Quantity in millions of units; value in millions of dollars)
Year :Producers': :shipments: Imports ;Exports
Ratio Apparent : (percent) of consump-
tion imports to
: consumption
Quantity
1969------------: 1,192.3 701.4 280.2 1,613.5 43.5 1970------------: 1,064.4 602.3 249.5 1,417.2 42.5 1971------------: 969.2 559.7 139.6 1,389.3 40.3 1972------------: 1,259.0 1,408.3 212.3 2,455.0 57.4 1973------------: 1/ 2,038.3 351.2 lJ 11
~---'=-~~---'~~~~~~~~~-~-=-~~~~~-=~~
1969------------: 1970------------: 1971------------: 1972------------: 1973------------:
y Not available.
460.5 435.8 372.0 406.1 1/
59.0 59.8 60.4
100.1 159.8
Value
83.1 436.4 13.5 88.9 406.7 14.7 50.3 382.1 15.8 61. 3 444.9 22.5 94.6 y 1/
Source: Compiled from official statistics of the U.S. Department of Commerce.
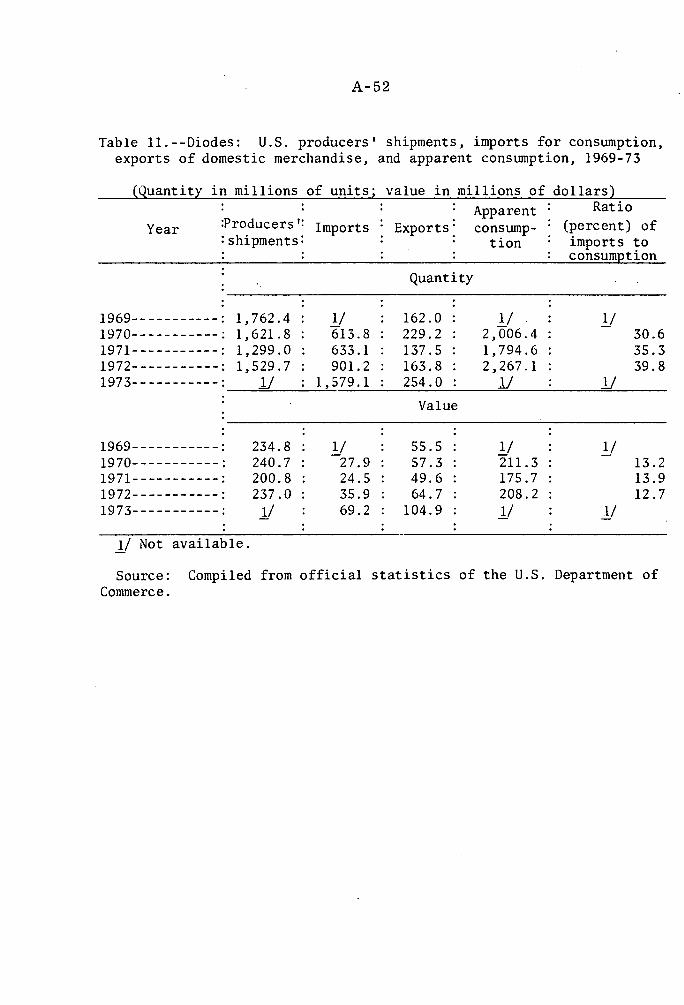
A-52
Table 11.--Diodes: U.S. producers' shipments, imports for consumption, exports of domestic merchandise, and apparent consumption, 1969-73
(Quantity in millions of units; value in millions of dollars) Apparent Ratio
Year :Producers'= Imports Exports: consump- (percent) of =shipments= tion imports to
consumption
1969-----------: 1,762.4 1/ 1970-----------: 1,621.8 613.8 1971-----------: 1,299.0 633.1 1972-----------: 1,529.7 901.2 1973-----------: lJ 1,579.1
1969-----------: 234.8 y 1970-----------: 240.7 27.9 1971-----------: 200.8 24.5 1972-----------: 237.0 35.9 1973-----------: J! 69.2
lf Not available.
Quantity
162.0 229.2 137.5 163.8 254.0
Value
55.5 57.3 49.6 64. 7
104.9
1/ . 2, 006. 4 1,794.6 2,267.1
lJ
1/ 211.3 175.7 208.2 11
lJ
30.6 35.3 39.8
13.2 13.9 12.7
Source: Compiled from official statistics of the U.S. Department of Commerce.

A-53
Table 12.--Integrated circuits: U.S. producers' shipments, imports for consumption, exports of domestic merchandise, and apparent consumption, 1970-73
(Quantity in thousands of units; value in thousands
Year
1970-------: 1971-------: 1972-------: 1973-------:
1970-------: 1971-------: 1972-------: 1973-------:
Producers' shioments
291,701 387,495
1/ 605,000 2J
464,607 567,925 699,296
2/
. . Apparent Imports ;Exports ; consump
tion
Quantity
248,710 66,004 474,407 323,458 54' 211 656,742 669,974 92,483 1,182,491
1,096,354 :174,389 y Value
69,444 99,768 434,283 94,248 91,243 570,930
180,459 :105,541 774,214 356,851 :217,723 2/
1/ Estimated by the U.S. Tariff Commission. 3.J Not available.
of dollars) Ratio
:(percent) of imports to consumption
y
52.4 49.3 56.7
16.0 16.5 23.3
Source: Compiled from official statistics of the U.S. Department of Commerce, except as noted.
Note.--Data for integrated circuits are not differentiated from other semiconductors in 1969 and, thus, are not available.

A-54 through 64
-·,,.

