electronic supplementary information electronic supplementary information design and...
TRANSCRIPT
1
Electronic Supplementary Information
Design and Characterization of Alkoxy-wrapped Push-pull
Porphyrins for Dye-sensitized Solar Cells
Teresa Ripolles-Sanchis,a Bo-Cheng Guo,
b Hui-Ping Wu,
c Tsung-Yu Pan,
c Hsuan-Wei
Lee,b Sonia R. Raga,
a Francisco Fabregat-Santiago,
a Juan Bisquert,*
a Chen-Yu Yeh,*
b
and Eric Wei-Guang Diau*c
a Photovoltaics and Optoelectronic Devices Group, Departament de Física, Universitat
Jaume I, 12071 Castelló, Spain. Tel: +34-964-38-7540; E-mail: [email protected]
b Department of Chemistry and Center of Nanoscience & Nanotechnology, National
Chung Hsing University, Taichung 402, Taiwan. Fax: +886-4-22862547; Tel: +886-4-
22852264; Email: [email protected]
c Department of Applied Chemistry and Institute of Molecular Science, National Chiao
Tung University, Hsinchu 30010, Taiwan. Fax: +886-3-5723764; Tel: +886-3-5131524;
E-mail: [email protected]
Electronic Supplementary Material (ESI) for Chemical CommunicationsThis journal is © The Royal Society of Chemistry 2012
2
Optical and Electrochemical Properties in Solution
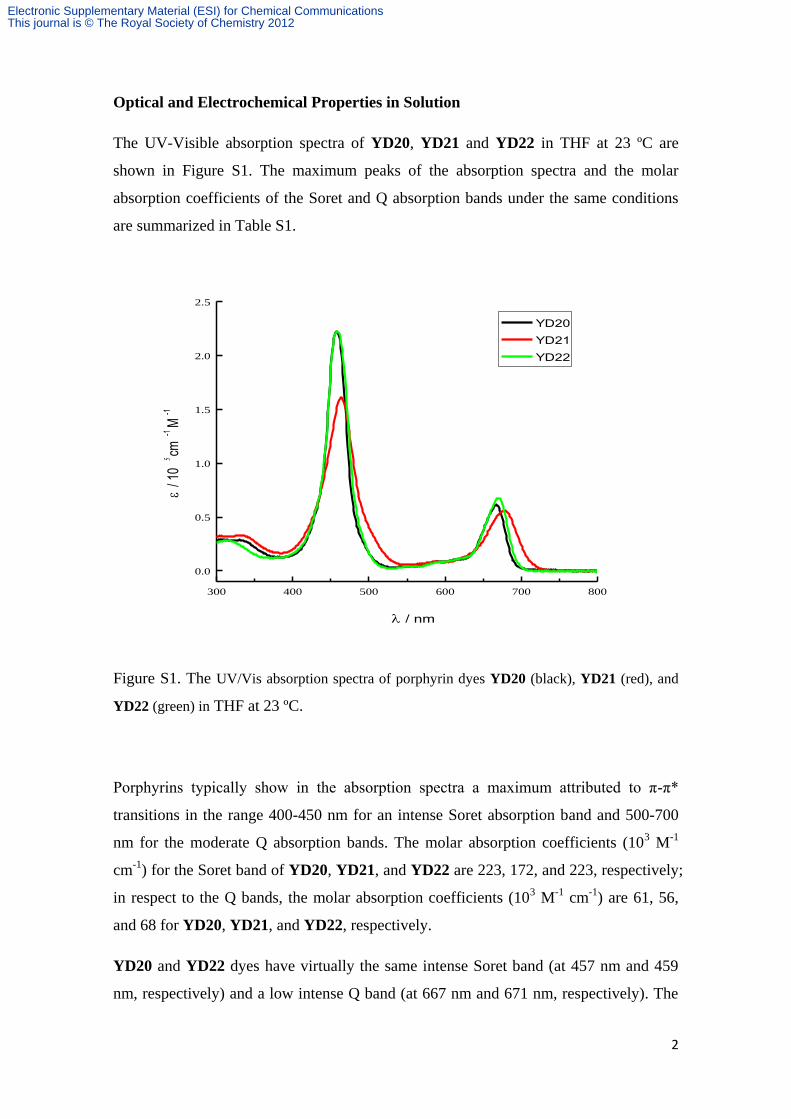
The UV-Visible absorption spectra of YD20, YD21 and YD22 in THF at 23 ºC are
shown in Figure S1. The maximum peaks of the absorption spectra and the molar
absorption coefficients of the Soret and Q absorption bands under the same conditions
are summarized in Table S1.
300 400 500 600 700 800
0.0
0.5
1.0
1.5
2.0
2.5
/ 1
0cm
-1M
-1
YD20
YD21
YD22
/ nm
Figure S1. The UV/Vis absorption spectra of porphyrin dyes YD20 (black), YD21 (red), and
YD22 (green) in THF at 23 ºC.
Porphyrins typically show in the absorption spectra a maximum attributed to π-π*
transitions in the range 400-450 nm for an intense Soret absorption band and 500-700
nm for the moderate Q absorption bands. The molar absorption coefficients (103 M
-1
cm-1
) for the Soret band of YD20, YD21, and YD22 are 223, 172, and 223, respectively;
in respect to the Q bands, the molar absorption coefficients (103 M
-1 cm
-1) are 61, 56,
and 68 for YD20, YD21, and YD22, respectively.
YD20 and YD22 dyes have virtually the same intense Soret band (at 457 nm and 459
nm, respectively) and a low intense Q band (at 667 nm and 671 nm, respectively). The
Electronic Supplementary Material (ESI) for Chemical CommunicationsThis journal is © The Royal Society of Chemistry 2012

3
molar absorption coefficients for YD20 and YD22 dyes are equal (223·103 M
-1 cm
-1) for
the Soret band and similar values for the Q band (61·103 M
-1 cm
-1 and 68·10
3 M
-1 cm
-1,
respectively). These results are due to the fact that both porphyrin-dyes have the same
acceptor group, an acid group which will attach itself into the TiO2 nanoparticles.
The Soret band for YD21 dye has low intensity absorption at 463 nm and the Q band for
YD21 dye is slightly red-shifted (677 nm) with respect to the other porphyrin sensitizers,
YD20 (667 nm) and YD22 (671 nm) dyes. The slightly red-shifted Q band for YD21
dye results are due to an elongation of the π-conjugation and loss of symmetry in the
porphyrin structure which is caused by the cyanoacrylic acid. Also, the YD21 dye has
the lowest molar absorption coefficient for the Soret and Q bands (172·103 M
-1 cm
-1 and
56·103 M
-1 cm
-1) compared with YD20 and YD22 dyes.
The emission data was measured in THF and the wavelengths for emission maxima are
shown in Table 1. Similar to the UV-Vis absorption spectra results, the emission is red-
shifted (703 nm) on the incorporation of a cyanoacrylic acid for the YD21 with respect
to the acid group for the YD20 (674 nm) and YD22 (676 nm) dyes.
Table S1. Spectral and electrochemical data for porphyrin dyes.a
Dye Absorption
max/nm (/103M-1cm-1)
Emissionb
max (nm) (φ)
Oxidation
E1/2 (V)
Reduction
E1/2 (V)
YD20 457(223), 667(61) 674 +0.84, +1.03 -1.19
YD21 463(172), 677(56) 703 +0.85, +1.03 -1.18
YD22 459(223), 671(68) 676 +0.78, +1.02 -1.21
a Absorption and emission data were measured in THF at 23oC. Electrochemical measurements were
performed at 23oC in THF containing TBAPF6 (0.1 M) as supporting electrolyte. Potentials measured vs.
ferrocene/ferrocenium (Fc/Fc+) couple were converted to a normal hydrogen electrode (NHE) by the
addition of +0.63 V. b The excitation wavelengths were 450 nm in THF.
Electronic Supplementary Material (ESI) for Chemical CommunicationsThis journal is © The Royal Society of Chemistry 2012
4
1.5 1.0 0.5 0.0 -0.5 -1.0 -1.5
E(V) vs. NHE
5I
YD20
YD21
YD22
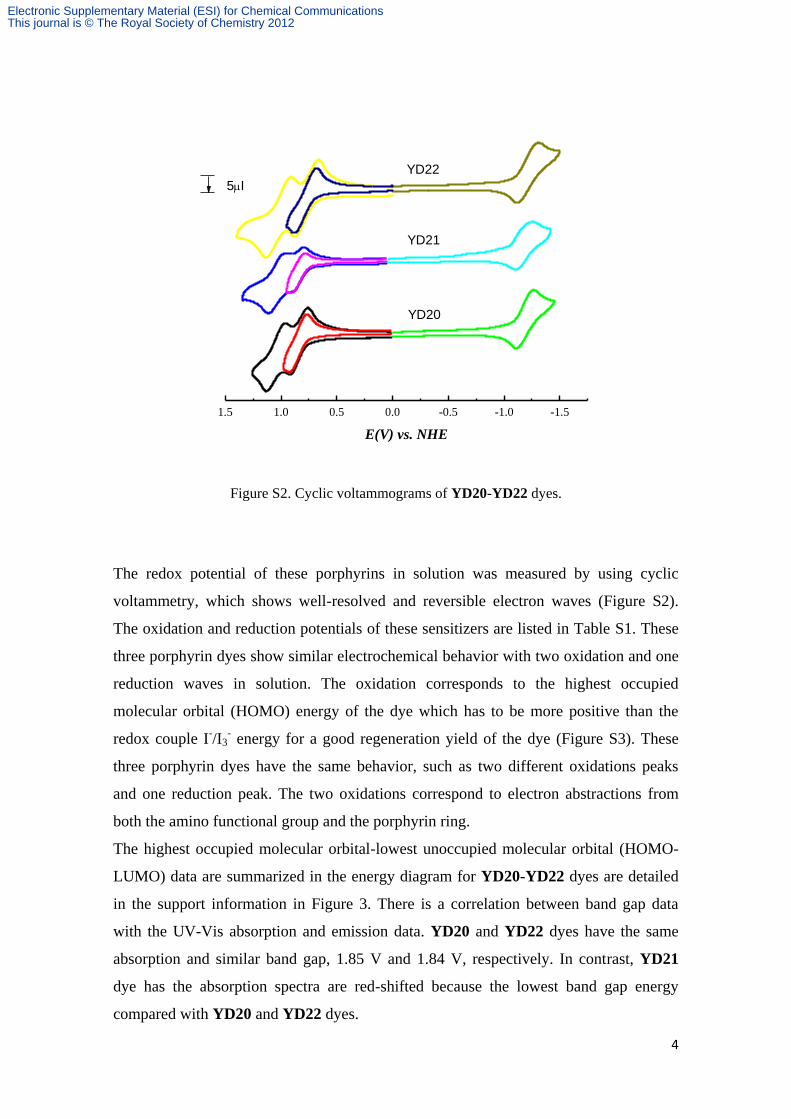
Figure S2. Cyclic voltammograms of YD20-YD22 dyes.
The redox potential of these porphyrins in solution was measured by using cyclic
voltammetry, which shows well-resolved and reversible electron waves (Figure S2).
The oxidation and reduction potentials of these sensitizers are listed in Table S1. These
three porphyrin dyes show similar electrochemical behavior with two oxidation and one
reduction waves in solution. The oxidation corresponds to the highest occupied
molecular orbital (HOMO) energy of the dye which has to be more positive than the
redox couple I-/I3
- energy for a good regeneration yield of the dye (Figure S3). These
three porphyrin dyes have the same behavior, such as two different oxidations peaks
and one reduction peak. The two oxidations correspond to electron abstractions from
both the amino functional group and the porphyrin ring.
The highest occupied molecular orbital-lowest unoccupied molecular orbital (HOMO-
LUMO) data are summarized in the energy diagram for YD20-YD22 dyes are detailed
in the support information in Figure 3. There is a correlation between band gap data
with the UV-Vis absorption and emission data. YD20 and YD22 dyes have the same
absorption and similar band gap, 1.85 V and 1.84 V, respectively. In contrast, YD21
dye has the absorption spectra are red-shifted because the lowest band gap energy
compared with YD20 and YD22 dyes.
Electronic Supplementary Material (ESI) for Chemical CommunicationsThis journal is © The Royal Society of Chemistry 2012

5
Figure S3. A schematic energy-level diagram of porphyrins YD20-YD22.
Electronic Supplementary Material (ESI) for Chemical CommunicationsThis journal is © The Royal Society of Chemistry 2012

6
Experimental Section
General
All reagents and solvents were obtained from commercial sources and used without
further purification unless otherwise noted. THF was dried over sodium/ benzophenone
and freshly distilled before use. Tetra-n-butylammonium hexafluorophosphate
(TBAPF6) was recrystallized twice from absolute ethanol and further dried for two days
under vacuum. Column chromatography was performed on silica gel (Merck, 70-230 Mesh
ASTM).
Spectral and electrochemical measurements
1H and 13C NMR spectra were recorded on a Varian 400 MHz. Chemical shifts for 1H NMR
spectra are referenced in the deuterated solvent (CHCl3 δ = 7.26 ppm for 1H and δ = 77 ppm for
13C). Spectra were recorded at room temperature, chemical shifts are written in ppm and
coupling constants in Hz. UV-visible spectra (Varian Cary 50), emission spectra (a JASCO FP-
6000 spectrofluorometer), ESI-MS mass spectra (Finnigan TSQ Ultra EMR, Tandem Mass
spectrometer, operating in the positive ion detection mode) was recorded on the indicated
instrument. Electrochemistry was performed with a three-electrode potentiostat (CH
Instruments, Model 750A) in THF deoxygenated by purging with prepurified N2 gas. Cyclic
voltammetry was conducted with the use of a home-made three-electrode cell equipped with
a BAS glassy carbon (0.07 cm2) disk as the working electrode, a platinum wire as the
auxiliary electrode, and a home-made Ag/AgCl (saturated) reference electrode. The reference
electrode is separated from the bulk solution by a double junction filled with electrolyte
solution. Potentials are reported vs Ag/AgCl (saturated) and referenced to the
ferrocene/ferrocenium (Fc/Fc+) couple which occurs at E1/2 = +0.63 V vs Ag/AgCl (saturated).
The working electrode was polished with 0.03 μm alumina on Buehler felt pads and washed
with deionized water prior to each experiment. The reproducibility of individual potential
values was within ±5 mV.
Electronic Supplementary Material (ESI) for Chemical CommunicationsThis journal is © The Royal Society of Chemistry 2012

7
Synthesis of compound 2:
In a round-bottom flask compound 11 (2.0 g, 2.05 mmol) and anhydrous
dichloromethane (1500 mL) were stirred. Then a solution of N-bromosuccinimide (0.73
g, 4.1 mmol) in dichloromethane (250 mL) was slowly added under nitrogen flow. After
2 hours, a solution of acetone (50 mL) was quickly added. Stirring was maintained for
30 min. The solution was passed a short column and then Zn(OAc)2.2H2O (2.25 g,
10.3 mmol) were added. The solution was stirred at room temperature for 24 hours and
then water was added. The mixture was extracted with dichloromethane and the organic
layer was collected. The solvent was removed under vacuum and the residue was
purified by column chromatography (silica gel) using dichloromethane/hexane (1/1) as
eluent. Recrystallization from dichloromethane/methanol to get compound 2 (2.23 g,
91%). 1H NMR (400 MHz, CDCl3) δ 9.64 (d, J = 4.2 Hz, 4H), 8.90 (d, J = 4.2 Hz, 4H),
7.71 (t, J = 7.8 Hz, 2H), 7.01 (d, J = 7.8 Hz, 4H), 3.85 (t, J = 5.4 Hz, 8H), 1.02 – 0.91
(m, 8H), 0.88 – 0.75 (m, 8H), 0.66 – 0.57 (m, 8H), 0.57 – 0.42 (m, 28H), 0.42 – 0.32 (m,
8H). 13
C NMR (101 MHz, CDCl3) δ 159.9, 151.4, 149.7, 132.8, 130.0, 120.7, 114.9,
105.1, 103.9, 68.6, 31.4, 28.6, 25.3, 22.3, 13.8. ESI: m/z: Calcd for C64H82Br2N4O4Zn:
1197 [M+H]+, Found: 1196.4 [M+H]
+
Electronic Supplementary Material (ESI) for Chemical CommunicationsThis journal is © The Royal Society of Chemistry 2012

8
Synthesis of compound 3:
In a round-bottom flask compound 2 (2.0 g, 2.05 mmol) and anhydrous THF (45 mL)
and (triisopropylsilyl)acetylene (0.75 ml, 3.34 mmol) and copper(I) iodide (31.8 mg,
0.167mmol) were stirred under nitrogen atmosphere. Triethylamine (12 mL) was then
added and the mixture was degassed by N2 bubbling. Pd(PPh3)2Cl2 (117 mg, 0.167mmol)
was added and the solution wasw heated at 85 °C overnight. The solvent was removed
under vacuum and the residue was purified by column chromatography (silica gel)
using dichloromethane/hexane (1/3) as eluent. Solvent were removed to afford
compound 3 (1637 mg, 70%) as purple solid. 1H NMR (400 MHz, CDCl3) δ 9.69 (d, J
= 4.4 Hz, 4H), 8.89 (d, J = 4.4 Hz, 4H), 7.68 (t, J = 8.4 Hz, 2H), 6.99 (d, J = 8.4 Hz,
4H), 3.83 (t, J = 6.4 Hz, 8H), 1.55 – 1.45 (m, 42H), 1.00 – 0.91 (m, 8H), 0.80 – 0.70 (m,
8H), 0.58 – 0.51 (m, 8H), 0.51 – 0.45 (m, 28H), 0.44 – 0.33 (m, 8H). 13
C NMR (101
MHz, CDCl3) δ 159.9, 152.0, 150.6, 131.7, 130.8, 129.7, 121.1, 114.9, 110.1, 105.4,
100.2, 96.5, 68.8, 31.3, 28.5, 25.2, 22.2, 19.1, 13.8, 11.9. ESI: m/z: Calcd for
C86H124N4O4Si2Zn: 1399 [M+H]+, Found: 1398.9 [M+H]
+
Electronic Supplementary Material (ESI) for Chemical CommunicationsThis journal is © The Royal Society of Chemistry 2012

9
Synthesis of YD20:
To a solution of compound 3 (100 mg, 0.071 mmol) in (5 mL) was added tetra-n-
butylammonium fluoride (0.715 mL, 0.71 mmol) at room temperature. Before water
was added, the mixture was stirred for 1 hr. The solution was extracted with
dichloromethane, the green organic layer was collected, and the solvent was evaporated
under reduced pressure to get the deprotected intermediate. To a solution of the
deprotected intermediate in a degassed mixture of THF (20 mL) and NEt3 (3 mL) was
added 4-iodobenzoic acid (21.8 mg, 0.085 mmol), and compound 42(37mg, 0.085
mmol) , Pd2(dba)3 (3.25 mg, 3.55 μmol), and AsPh3 (43 mg, 0.142 mmol). The mixture
was stirred at 85 °C for 5 hours. The solvent was removed under vacuum and the
residue was purified by column chromatography (silica gel) using CH2Cl2/CH3OH (19/1)
as eluent. Recrystallization from CH2Cl2/CH3OH gave YD20 (37 mg, 34%). 1H NMR
(400 MHz, CDCl3/CD3OD) δ 9.59 (dd, J = 7.5, 4.5 Hz, 4H), 8.81 (d, J = 4.5 Hz, 2H),
8.77 (d, J = 4.5 Hz, 2H), 8.19 (d, J = 8.2 Hz, 2H), 8.03 (d, J = 8.2 Hz, 2H), 7.77 (d, J =
8.8 Hz, 2H), 7.69 (t, J = 8.4 Hz, 2H), 7.16 (d, J = 9.0 Hz, 4H), 7.05 (d, J = 8.8 Hz, 2H),
7.01 (d, J = 8.4 Hz, 4H), 6.89 (d, J = 9.0 Hz, 4H), 3.86 (t, J = 6.5 Hz, 8H), 3.82 (s, 6H),
1.01 – 0.92 (m, 8H), 0.92 – 0.84 (m, 8H), 0.75 – 0.67 (m, 8H), 0.61 – 0.54 (m, 28H),
0.50 – 0.40 (m, 8H). 13
C NMR (101 MHz, CDCl3/CD3OD) δ 159.8, 156.1, 151.7, 151.3,
150.4, 150.3, 148.6, 140.4, 132.3, 130.5, 130.1, 129.6, 127.0, 121.2, 119.7, 115.5, 114.8,
105.3, 101.5, 97.3, 94.6, 92.3, 68.7, 31.4, 29.7, 28.7, 28.6, 28.5, 25.2, 22.3, 13.9. ESI:
m/z: Calcd for C95H105N5O8Zn: 1510 [M+H]+, Found: 1509.9 [M+H]
+
Electronic Supplementary Material (ESI) for Chemical CommunicationsThis journal is © The Royal Society of Chemistry 2012
10
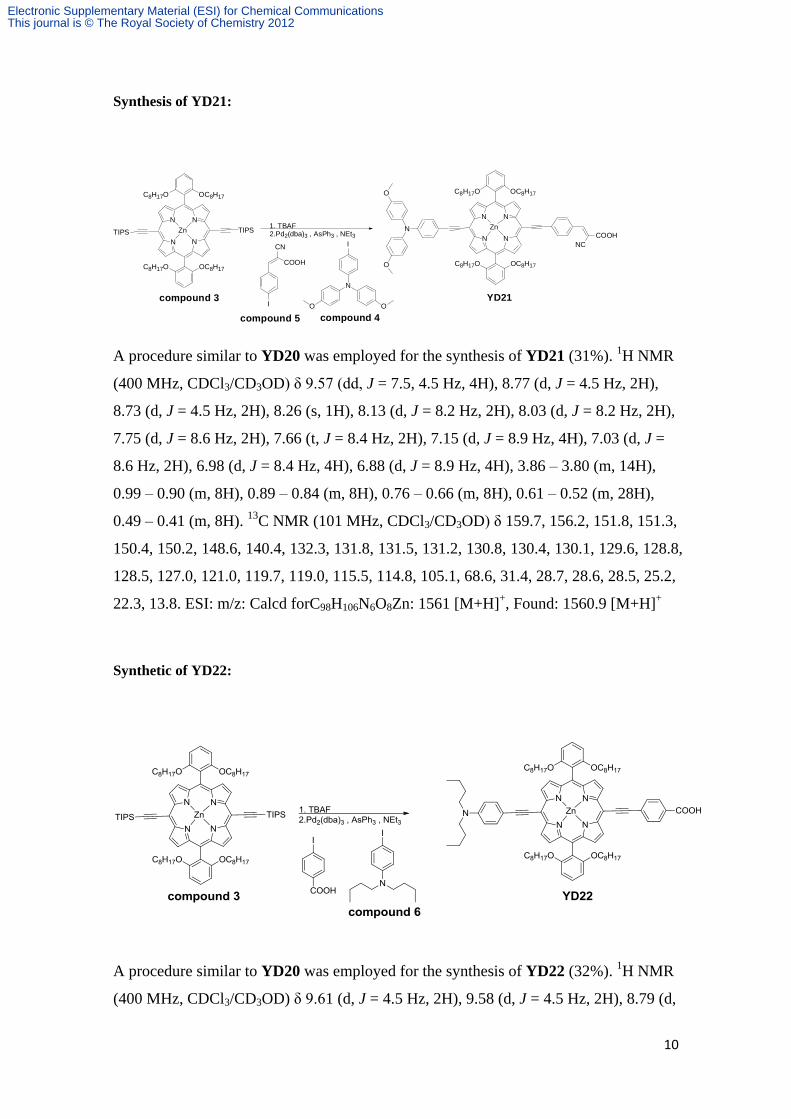
Synthesis of YD21:
N
N N
N
Zn
OC8H17C8H17O
C8H17O OC8H17
TIPS TIPS1. TBAF2.Pd2(dba)3 , AsPh3 , NEt3
I
I
N
O O
N
N N
N
Zn
OC8H17C8H17O
C8H17O OC8H17
N
O
O
YD21
COOH
CN
COOH
NC
compound 3
compound 4compound 5
A procedure similar to YD20 was employed for the synthesis of YD21 (31%). 1H NMR
(400 MHz, CDCl3/CD3OD) δ 9.57 (dd, J = 7.5, 4.5 Hz, 4H), 8.77 (d, J = 4.5 Hz, 2H),
8.73 (d, J = 4.5 Hz, 2H), 8.26 (s, 1H), 8.13 (d, J = 8.2 Hz, 2H), 8.03 (d, J = 8.2 Hz, 2H),
7.75 (d, J = 8.6 Hz, 2H), 7.66 (t, J = 8.4 Hz, 2H), 7.15 (d, J = 8.9 Hz, 4H), 7.03 (d, J =
8.6 Hz, 2H), 6.98 (d, J = 8.4 Hz, 4H), 6.88 (d, J = 8.9 Hz, 4H), 3.86 – 3.80 (m, 14H),
0.99 – 0.90 (m, 8H), 0.89 – 0.84 (m, 8H), 0.76 – 0.66 (m, 8H), 0.61 – 0.52 (m, 28H),
0.49 – 0.41 (m, 8H). 13
C NMR (101 MHz, CDCl3/CD3OD) δ 159.7, 156.2, 151.8, 151.3,
150.4, 150.2, 148.6, 140.4, 132.3, 131.8, 131.5, 131.2, 130.8, 130.4, 130.1, 129.6, 128.8,
128.5, 127.0, 121.0, 119.7, 119.0, 115.5, 114.8, 105.1, 68.6, 31.4, 28.7, 28.6, 28.5, 25.2,
22.3, 13.8. ESI: m/z: Calcd forC98H106N6O8Zn: 1561 [M+H]+, Found: 1560.9 [M+H]
+
Synthetic of YD22:
A procedure similar to YD20 was employed for the synthesis of YD22 (32%). 1H NMR
(400 MHz, CDCl3/CD3OD) δ 9.61 (d, J = 4.5 Hz, 2H), 9.58 (d, J = 4.5 Hz, 2H), 8.79 (d,
Electronic Supplementary Material (ESI) for Chemical CommunicationsThis journal is © The Royal Society of Chemistry 2012

11
J = 4.5 Hz, 2H), 8.74 (d, J = 4.5 Hz, 2H), 8.20 (d, J = 8.2 Hz, 2H), 8.02 (d, J = 8.2 Hz,
2H), 7.82 (d, J = 9.0 Hz, 2H), 7.69 (t, J = 8.4 Hz, 2H), 7.01 (d, J = 8.4 Hz, 4H), 6.77 (d,
J = 9.0 Hz, 2H), 3.85 (t, J = 6.4 Hz, 8H), 3.38 (t, J = 8 Hz, 4H), 1.70 – 1.62 (m, 4H),
1.46 – 1.39 (m, 4H), 1.01 – 0.95 (m, 14H), 0.92 – 0.85 (m, 8H), 0.77 – 0.68 (m, 8H),
0.64 – 0.55 (m, 28H), 0.51 – 0.45 (m, 8H). 13
C NMR (101 MHz, CDCl3/CD3OD) δ
159.8, 151.3, 150.3, 150.1, 147.9, 132.9, 131.8, 131.1, 131.0, 130.6, 130.0, 129.6, 121.2,
114.7, 111.4, 110.1, 105.3, 97.3, 94.6, 91.1, 68.7, 31.4, 29.7, 29.4, 28.7, 28.6, 28.5, 25.2,
22.3, 20.4, 14.0, 13.9. ESI: m/z: Calcd for C89H109N5O6Zn: 1410 [M+H]+, Found:
1409.9 [M+H]+
Device fabrication and characterization
The porphyrin-sensitized solar-cell (PSSC) devices were fabricated with a working electrode
based on TiO2 nanoparticles (NP) and a Pt-coated counter electrode. For the working electrode,
a paste composed of TiO2 NP (particle size ~25 nm) prepared with a sol-gel method for the
transparent nanocrystalline layer was coated on a TiCl4-treated FTO glass substrate (TEC 7,
Hartford) to obtain the required thickness (~15 µm) on repetitive screen printing. To improve
the performance of the PSSC, an additional scattering layer (particle size ~ 300 nm) was screen-
printed on the transparent active layer. The electrode was then immersed in a dye solution (0.2
mM) with EtOH/Toluene = 1/1 at 25 °C for 3 h for dye loading onto the TiO2 film. The dye-
sensitized electrode was rinsed with ethanol and dried by an air-gun. The Pt counter electrodes
were prepared on spin-coating drops of H2PtCl6 solution onto FTO glass and heating at 385 °C
for 15 min. The porphyrin working electrode and the thermally platinized counter electrode
were separated and sealed with a hot-melt film (Surlyn, Dupont, thickness 60 m). The internal
space was filled with a volatile electrolyte, which is a composition of 0.6 M
propylmethylimidazolium iodide (PMII), 50 mM I2, 10 mM LiI, 0.1 M Guanidinium thiocianate
(GuNCS), 0.5 M tert-butylpyridine (TBP) and a mixture of solvents acetonitrile:valeronitrile
(85:15 vol). The performance of a PSSC device was assessed through measurement of a J–V
curve with an AM-1.5 G solar simulator (XES-502S, SAN-EI), calibrated with a Si-based
reference cell (S1133, Hamamatsu). The incident monochromatic efficiencies for conversion
from photons to current (IPCE) spectra of the corresponding devices were measured with a
system comprising a Xe lamp (PTi A-1010, 150 W), monochromator (PTi, 1200 gr mm-1 blazed
at 500 nm), and source meter (Keithley 2400, computer controlled). A standard Si photodiode
(S1337-1012BQ, Hamamatsu) served as a reference to calibrate the power density of the light
source at each wavelength.
Electronic Supplementary Material (ESI) for Chemical CommunicationsThis journal is © The Royal Society of Chemistry 2012

12
Electrochemical Impedance Spectroscopy (EIS) measurements
Acquisition of the EIS measurements were carried out with a Zahner impedance analyzer
controlled from a computer with Thales software. The amplitude of the AC signal was 20 mV
and its frequency ranged between 1 MHz and 10 mHz. Bias potentials used were comprised
between 0 and 0.75 V. Illumination in impedance spectroscopy measurements was provided by
a LED source. The power of the LED lamp was adjusted to obtain the same VOC as in J-V curves
taken under illumination with a solar simulator at 1 sun irradiation (AM1.5G, 100 mW cm).
Reference:
1) Yella, A.; Lee, H.W.; Tsao, H. N.; Yi, C.; Chandiran, A. K.; Nazeeruddin, M. K.; Diau, E.W.
G.; Yeh, C. Y.; Zakeeruddin, S. M.; Grätzel, M. Science 2011, 334, 629.
2) Lin, J.-H.; Elangovan, A.; Ho, T.-I. J. Org. Chem. 2005, 70, 7397-7407
3) Lee, C. Y.; She, C.; Jeong, N. C.; Hupp, J. T. Chem. Commun. 2010, 46, 6090-6092.
Electronic Supplementary Material (ESI) for Chemical CommunicationsThis journal is © The Royal Society of Chemistry 2012