electronic supplementary information - the royal … · electronic supplementary information...
TRANSCRIPT
1
Electronic supplementary information
Fluorescent polymer prodrug nanoparticles with aggregation-
induced emission (AIE) properties from nitroxide-mediated
polymerization
Yinyin Bao,1 Elise, Guégain,1 Valérie Nicolas,2 Julien Nicolas1,*
1Institut Galien Paris-Sud, Université Paris-Sud, UMR CNRS 8612, Faculté de Pharmacie, 5
rue Jean-Baptiste Clément, F-92296 Châtenay-Malabry cedex, France.
2Institut Paris-Saclay d'Innovation Thérapeutique (IPSIT). UMS IPSIT Université Paris-Sud –
US 31 INSERM – UMS 3679 CNRS, Plate-forme d’imagerie cellulaire MIPSIT, 5 rue Jean-
Baptiste Clément, 92296 Châtenay-Malabry cedex, France.
*To whom correspondence should be addressed.
Tel.: +33 1 46 83 58 53
Electronic Supplementary Material (ESI) for ChemComm.This journal is © The Royal Society of Chemistry 2017

2
1. Materials 2
2. Analytical methods 3
3. Synthesis methods 4
4. Quantum yield 6
5. Nanoparticle preparation 6
6. Biological evaluation 7
7. Supplementary tables 9
8. Supplementary figures 10
9. Supplementary references 17
1. Materials
N-tert-butyl-N-[1-diethylphosphono-(2,2-dimethylpropyl)] nitroxide (SG1, 85%) was
obtained from Arkema (France). 2-[N-tert-butyl-N-(1-diethoxyphosphoryl-2,2-di-
methylpropyl)aminoxy] propionic acid (AMA-SG1)1 and 2-(2-hydroxyethyl)-6-(piperazin-1-
yl)benzo[de]-isoquinoline-1,3-dione (Napht-OH)2 were prepared according to published
methods. 4-Dimethylaminopyridine (DMAP, 99%) and Coumarin 153 were obtained from
Sigma. LysoTracker Red and Hoechst 33342 were purchased from Life Technologies.
DMEM and fetal bovine serum (FBS) were purchased from Dulbecco (Invitrogen, France).
Penicillin was purchased from Lonza (Verviers, Belgium). All other materials were purchased
from Sigma at the highest available purity and used as received.
2. Analytical methods
3
2.1 Nuclear Magnetic Resonance Spectroscopy (NMR). NMR spectroscopy was performed
in 5 mm diameter tubes in CDCl3 at 25 °C. 1H and 13C NMR spectroscopy was performed on
a Bruker Avance 300 spectrometer at 300 MHz (1H) or 75 MHz (13C). The chemical shift
scale was calibrated on the basis of the internal solvent signals.
2.2 Mass spectra. Mass spectra were recorded with a Bruker Esquire-LC instrument.
2.3 Size Exclusion Chromatography (SEC). SEC was performed at 30 °C with two columns
from Polymer Laboratories (PL-gel MIXED-D; 300 × 7.5 mm; bead diameter 5 mm; linear
part 400 to 4 × 10⁵ g.mol-1) and a differential refractive index detector (SpectraSystem RI-150
from Thermo Electron Corp.). The eluent was chloroform at a flow rate of 1 mL.min-1 and
toluene was used as a flow-rate marker. The calibration curve was based on polystyrene (PS)
standards (peak molar masses, Mp = 162–523 000 g.mol-1) from Polymer Laboratories. A
polyisoprene (PI) calibration curve was constructed by converting the PS standard peak
molecular weights, MPS, to PI molecular weights, MPI, using Mark-Houwink-Sakurada (MHS)
constants determined for both polymers in CCl4 at 25 °C. For PI, the MHS constants used
were KPI = 2.44 × 10⁴ and αPI = 0.712. For PS, KPS = 7.1 × 10⁴ and αPS = 0.54 (Mw < 16700
g.mol-1) or KPS = 1.44 × 10⁴ and αPS = 0.713 (Mw > 16 700 g.mol-1).3 This technique allowed
Mn (number-average molar mass), Mw (weight-average molar mass), and Mw/Mn (dispersity, Ð)
to be determined.
2.4 Dynamic light scattering (DLS) and zeta potential. Nanoparticle diameters (Dz) and
zeta potentials (ζ) were measured by dynamic light scattering (DLS) with a Nano ZS from
Malvern (173° scattering angle) at a temperature of 25 °C. The surface charge of the
nanoparticles was investigated by ζ-potential (mV) measurement at 25 °C after dilution with 1
4
mM NaCl, using the Smoluchowski equation.
2.5 UV-Vis spectroscopy. Absorbance spectra were recorded on a Lambda 25 UV/Vis
spectrometer from Perkin Elmer.
2.6 Fluorescence spectroscopy. Corrected steady-state excitation and emission spectra were
obtained using a LS 50B fluorescence spectrometer from Perkin Elmer. All measurements
were conducted at room temperature (~25 ºC) with a spectral bandwidth (ex, em) of 2.5 nm
and λex = 420 nm for emission spectra and λem,THF = 503 nm or λem,99% water = 517, 500 and 490
nm, respectively for Napht-AMA-SG1, P1 and P2, for excitation spectra.
2.7 Transmission electron microscopy (TEM). The morphology of the nanoparticles was
examined by cryogenic transmission electron microscopy (cryo-TEM). Briefly, 5 μL of the
nanoparticle suspension (2.5 mg.mL-1) was deposited on a Lacey Formvar/carbon 300 mesh
copper microscopy grid (Ted Pella). Most of the drop was removed with a blotting filter paper
and the residual thin film remaining within the holes was vitrified by plunging into liquid
ethane. Samples were then observed using a JEOL 2100HC microscope.
3. Synthesis methods
3.1 Synthesis of Napht-AMA-SG1. AMA-SG1 (0.27 g, 0.73 mmol), DMAP (0.09 g, 0.73
mmol), and EDC·HCl (0.14 g, 0.73 mmol) were dissolved in anhydrous dichloromethane, and
mixed in a reaction flask under Argon at room temperature. After 15 min, 1 mL of Napht-OH
(0.11g, 0.32 mmol) in DMF was added dropwise into the flask. After stirring at 30°C for 22 h,
the mixture was poured into 30 mL of EtOAc. The organic phase was washed with 1 M of
HCl, an aqueous solution of NaHCO3 and brine before being dried over MgSO4. The residue
5
was concentrated under reduced pressure and purified by flash chromatography (SiO2, from
CH2Cl2/MeOH = 20/1, v/v) to give 0.18 g of Napht-AMA-SG1 as a yellow solid. Yield =
82%. 1H NMR (300 MHz, CDCl3): δ = 8.52-8.56 (m, 1H), 8.49 (dd, 1H, J = 8.1 Hz), 8.37-
8.41 (m, 1H), 7.63-7.69 (m, 1H), 7.21 (dd, 1H, J = 8.1 Hz), 4.37-4.64 (m, 5H), 3.84-4.25 (m,
4H), 3.22-3.32 (m, 5H), 2.75 (m, 4H), 2.43 (s, 3H), 1.41-1.44 (m, 3H), 1.19-1.30 (m, 6H),
1.07 (s, 9H), 1.05 (s, 9H). 13C NMR (75 MHz, CDCl3): δ = 172.3, 164.3, 163.8, 156.0, 132.6,
131.1, 130.3, 129.9, 126.1, 125.6, 123.1, 116.5, 114.9, 70.1, 68.4, 61.9 (d), 61.4 (d), 59.0 (d),
55.1, 52.9, 46.1, 38.7, 35.2 (d), 30.2 (d), 29.6 (d), 27.9, 27.8, 17.6, 16.5, 16.4, 16.2, 16.1. MS
(ESI): 711.4 (M+Na)+. Calc. for C35H53N4O8P: 688.36.
3.2 Synthesis of Napht-PI (P1 and P2) from Napht-AMA-SG1. Napht-AMA-SG1 (38.7
mg, 0.056 mmol) was placed in a 15-mL capacity pressure tube (Ace Glass 8648-164) fitted
with a plunger valve and a thermowell. Isoprene (P1: 2.4 mL, 23.1 mmol; P2: 1.2 mL, 11.5
mmol) and dioxane (P1: 2.4 mL; P2: 1.2 mL) were added and the tube was subjected to three
freeze-pump-thaw cycles, and then backfilled with argon. The tube was placed in an oil bath
at 115°C for 18 h and then cooled down to room temperature by placing the tube in a cold
water a bath. The residue was concentrated under reduced pressure and precipitated in MeOH
to give Napht-PI as a yellow product. 1H NMR (300 MHz, CDCl3): δ = 8.59 (d, 1H, J = 6.6
Hz), 8.53 (d, 1H, J = 8.1 Hz), 8.43 (d, 1H, J = 8.4 Hz), 7.71 (t, 1H, J = 8.1 Hz), 7.23 (d, 1H, J
= 8.1 Hz), 4.70–5.78 (m, H from polyisoprene backbone –CH= or =CH2), 3.75–4.67 (m, 9H),
3.31 (br, 5H), 2.76 (br, 4H), 2.44 (s, 3H), 2.00–2.04 (br, H from polyisoprene backbone –
CH2– and –CH–), 1.60–1.68 (br, H from polyisoprene backbone –CH3), 1.31 (br, H from
polyisoprene backbone –CH2– based on 3,4-addition), 1.16-1.43 (m, 9H), 1.13 (s, 9H), 0.94
6
(br, 9H). P1: Mn = 2070 g.mol-1, Ð = 1.15; P2: Mn = 3710 g.mol-1, Ð = 1.20.
3.3 Synthesis of CdA-digly-PI (P3) from CdA-digly-AMA-SG1.4 CdA-digly-AMA-SG1
(54 mg, 0.06 mmol) was placed in a 15 mL capacity pressure tube (Ace Glass 8648-164)
fitted with plunger valves and a thermowell. Isoprene (2.4 mL, 24.0 mmol) and dioxane (0.6
mL) were added and the tubes were subjected to three freeze-pump-thaw cycles, and then
backfilled with argon. The tube was placed in an oil bath at 115 °C for 16 h and then cooled
down to room temperature by placing the tube in a cold water bath. The residue was
concentrated under reduced pressure and treated with TBAF to give CdA-digly-PI as a
colorless product after precipitation in MeOH. P3: Mn = 4980 g.mol-1, Ð = 1.20.
4. Quantum yield
Fluorescence quantum yields were relatively calculated using Coumarin 153 in 99% water as
standard reference (ϕC153 = 0.11).5 Only dilute solutions with an absorbance of less than 0.1 at
the absorption maximum were used. UV-vis absorbance spectra and fluorescence spectra
were recorded in 10 mm optical path length quartz cell. Integrated fluorescence intensities vs
absorbances at λex = 420 nm were plotted and quantum yields were calculated according to
the following equation: ϕx = ϕC153 (Slopex / SlopeC153). The quantum yields for P1 and P2 =
0.10 and the quantum yield for Napht-AMA-SG1 = 0.02.
5. Nanoparticle preparation
Nanoparticles were prepared by the nanoprecipitation technique. Briefly, 0.5 mg of Napht-PI
(P1 or P2) was dissolved in 0.5 mL of THF, and added dropwise to 1 mL MilliQ water under
7
stirring. THF was evaporated at ambient temperature using a Rotavapor. Average diameter
(Dz) and zeta potential measurements were carried out in triplicate. For the co-
nanoprecipitation of Napht-PI (P2)/CdA-digly-PI (P3), 2.23 mg CdA-digly-PI (P3) and 0.27
mg Napht-PI (P2) were dissolved in 0.5 mL of THF. A similar procedure was then applied.
The resulting P2/P3 nanoparticles had a composition of 10.8 wt.% P2 and 89.2 wt.% P3, thus
giving an overall drug loading of 5.3 wt.%.
6. Biological evaluation
6.1 Cell lines and cell culture. The lung cancer cell line A549 was obtained from the
American Type Culture Collection (Molsheim, France) and the murine leukemia cell line
L1210 was kindly provided by Dr. Lars Petter Jordheim (Univ Claude Bernard Lyon I, Lyon,
France). They were maintained as recommended. Briefly, A549 or L1210 cells were cultured
in Dulbecco′s minimal essential medium (DMEM). All media were supplemented with 10%
heat-inactivated FBS (56 °C, 30 min) and penicillin (100 U.mL−1). Cells were maintained in a
humid atmosphere at 37 °C with 5% CO2.
6.2 Cell imaging. A549 cells were cultured in a culture dish for 24 h to achieve confluence.
Cells were then incubated with Napht-PI nanoparticles, at the concentration of 20 μg.mL-1 at
37 °C for 24 h, then incubated with LysoTracker Red for 30 min and Hoechst 33342 for 20
min under the same incubation conditions. After treatment, the cells were washed with
Dulbecco’s phosphate buffered saline (PBS) and imaged using a confocal microscope (SP8
TCS Leica, Germany) with a 63X/1.4 oil-immersion objective. The fluorescence was
collected in the range of 410–440 m (λex = 405 nm), 450–560 nm (λex = 405 nm), and 569–

8
682 nm (λex = 543 nm), respectively, using a sequential acquisition mode. The pinhole
diameter was set to 1 Airy Unit.
L1210 cells were cultured on a coverslip in a culture dish for 24 h to achieve confluence.
Cells were then incubated with CdA-digly-PI/Napht-PI nanoparticles with 1 wt.% of dye, at
the concentration of 20 μg.mL-1 at 37 °C for 24 h, then incubated with LysoTracker Red for
30 min under same incubation conditions. After treatment, the cells were washed with
Dulbecco’s phosphate buffered saline (PBS) and imaged using a confocal (SP8 TCS Leica,
Germany) with a 63X/1.4 oil-immersion objective. The excitation wavelength was 405 nm
and 543 nm, and the fluorescence was collected in the range of 415–530 nm and 569–682 nm,
respectively. The pinhole diameter was set to 1 Airy Unit.
6.3 Cytotoxicity assay (MTT). MTT [3-(4,5-dimethylthiazol-2-yl)-2,5-diphenyl tetrazolium
bromide] was used to test cytotoxicity of the different nanoparticles via cell viability
measurement. Briefly, cells (5 × 10³/well) were seeded in 96-well plates. After 1 h incubation,
the cells were then exposed to a series of concentrations of nanoparticles for 72 h. The
medium was added with 20 μL of MTT solution (5 mg.mL-1 in PBS) for each well. The plates
were incubated for 1 h at 37 °C and the medium was removed after centrifugation. 200 μL of
DMSO were then added to each well to dissolve the precipitates. Absorbance was measured at
570 nm using a plate reader (Metertech Σ 960, Fisher Bioblock, Illkirch, France). The
percentage of surviving cells was calculated as the absorbance ratio of treated to untreated
cells. All experiments were set up in sextuplicate to determine means and SDs.
7. Supplementary tables
9
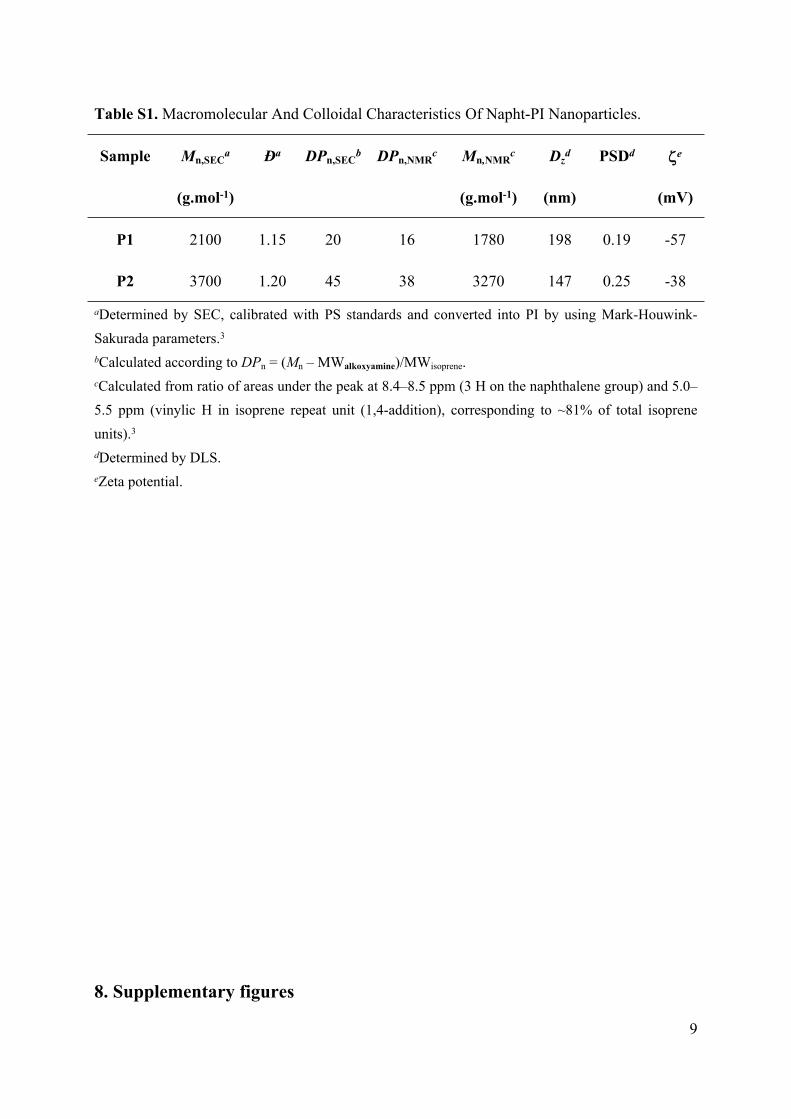
Table S1. Macromolecular And Colloidal Characteristics Of Napht-PI Nanoparticles.
Sample Mn,SECa
(g.mol-1)
Ða DPn,SECb DPn,NMR
c Mn,NMRc
(g.mol-1)
Dzd
(nm)
PSDd e
(mV)
P1 2100 1.15 20 16 1780 198 0.19 -57
P2 3700 1.20 45 38 3270 147 0.25 -38
aDetermined by SEC, calibrated with PS standards and converted into PI by using Mark-Houwink-Sakurada parameters.3bCalculated according to DPn = (Mn – MWalkoxyamine)/MWisoprene. cCalculated from ratio of areas under the peak at 8.4–8.5 ppm (3 H on the naphthalene group) and 5.0–5.5 ppm (vinylic H in isoprene repeat unit (1,4-addition), corresponding to ~81% of total isoprene units).3
dDetermined by DLS. eZeta potential.
8. Supplementary figures
10
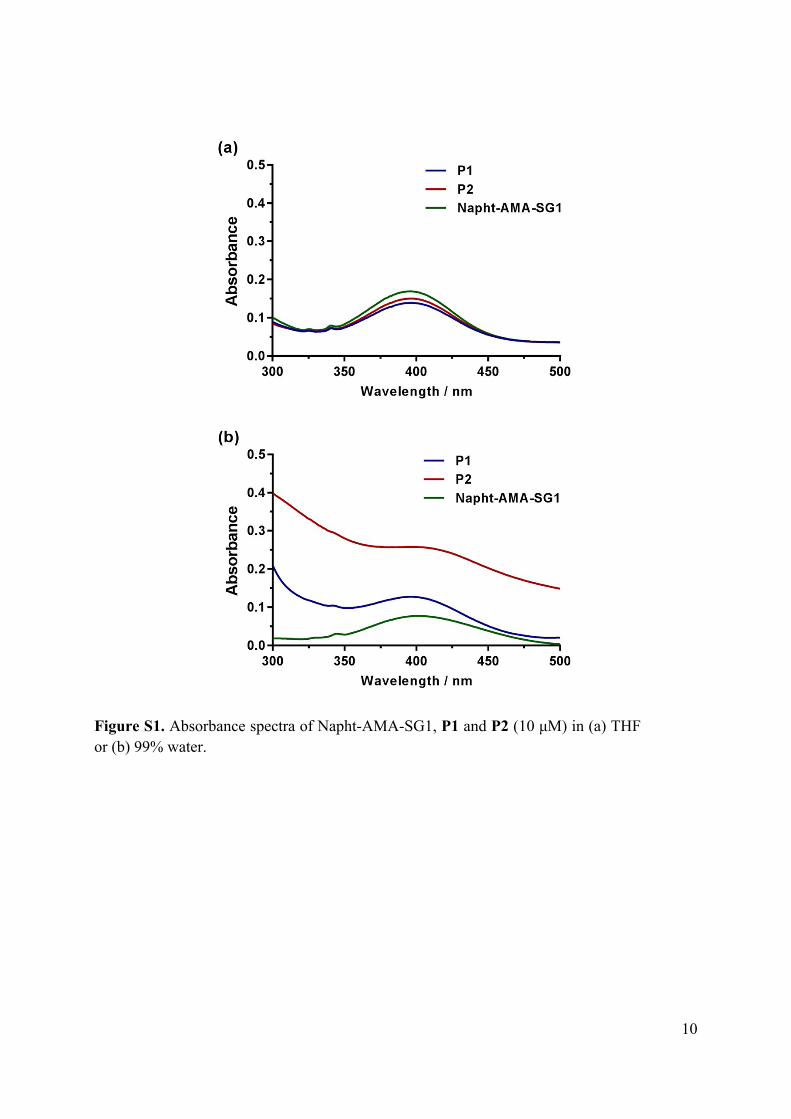
Figure S1. Absorbance spectra of Napht-AMA-SG1, P1 and P2 (10 μM) in (a) THF or (b) 99% water.
11
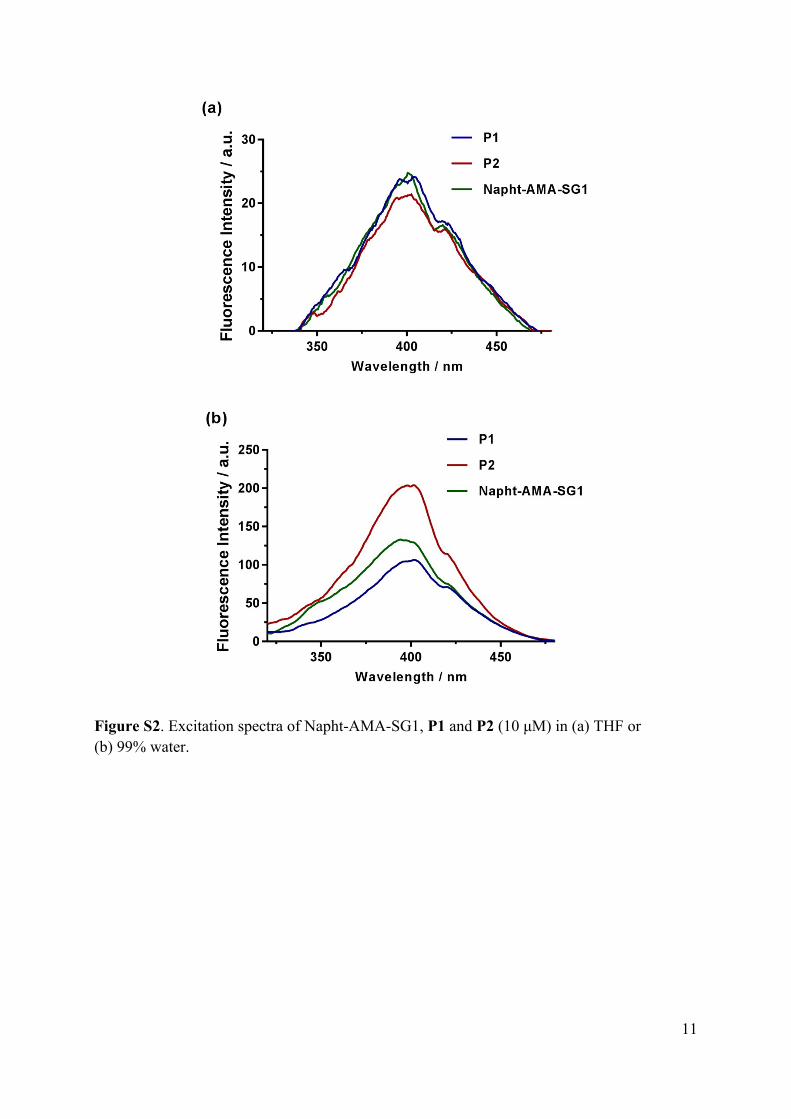
Figure S2. Excitation spectra of Napht-AMA-SG1, P1 and P2 (10 μM) in (a) THF or (b) 99% water.
12
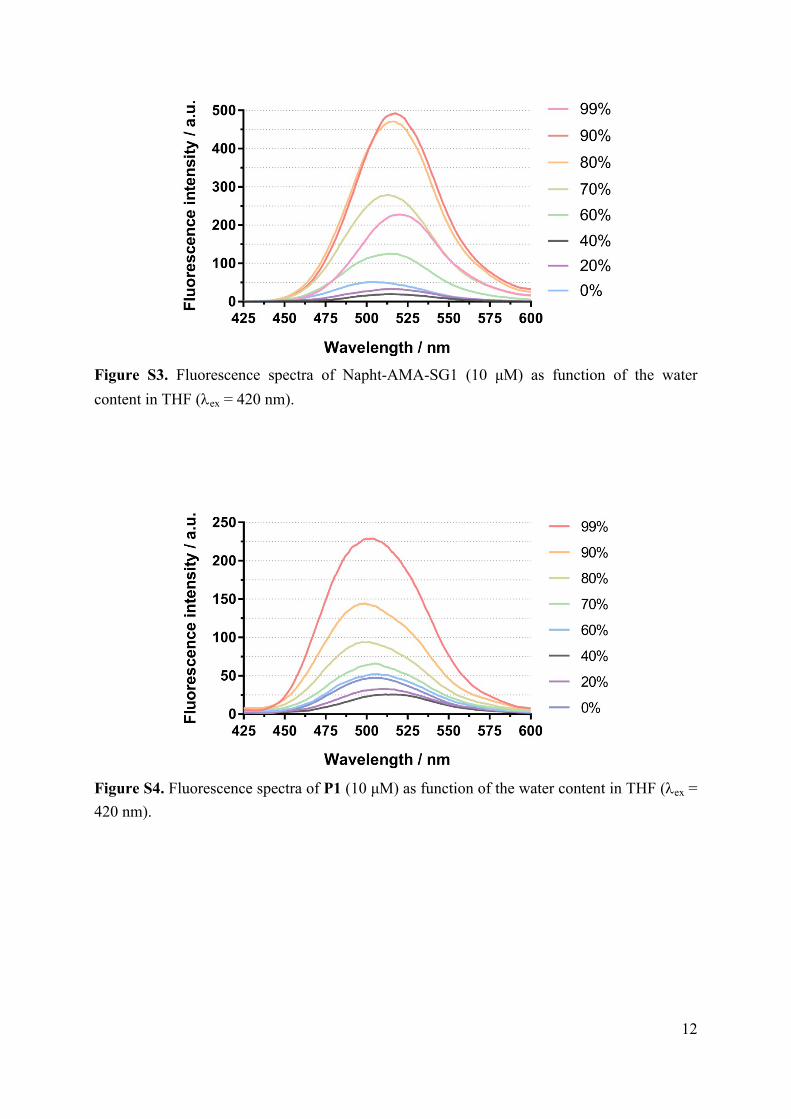
Figure S3. Fluorescence spectra of Napht-AMA-SG1 (10 μM) as function of the water content in THF (ex = 420 nm).
Figure S4. Fluorescence spectra of P1 (10 μM) as function of the water content in THF (ex = 420 nm).
13
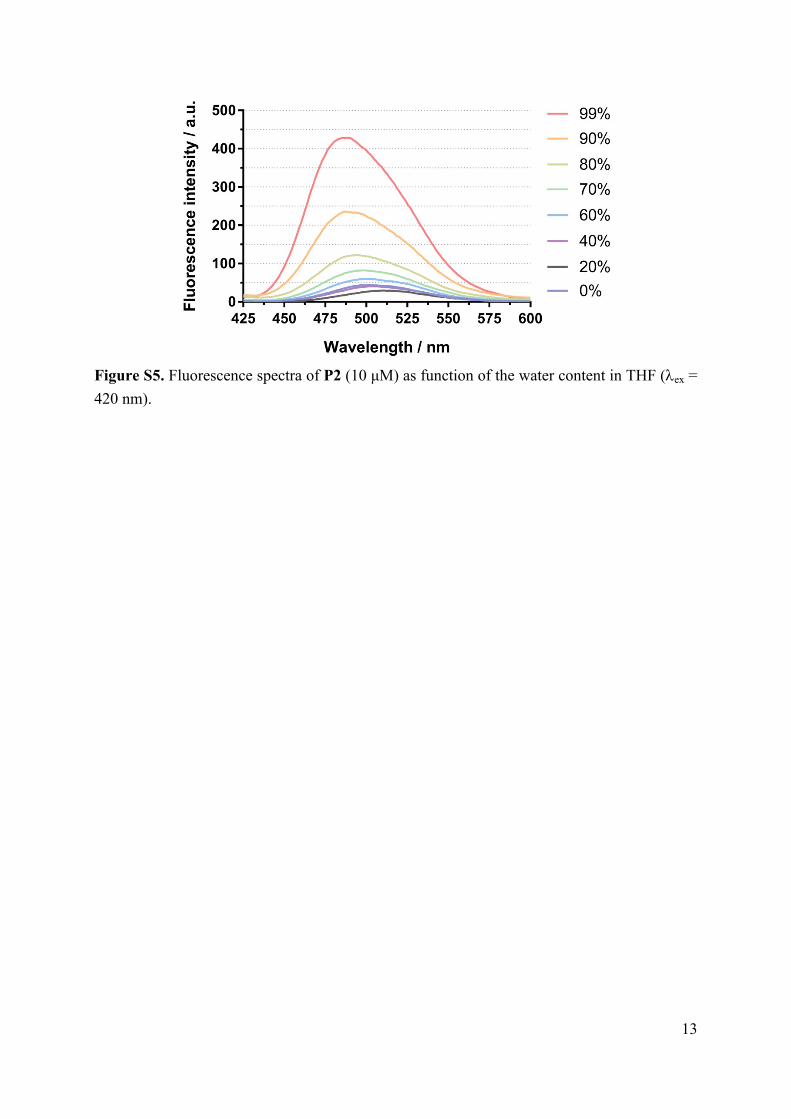
Figure S5. Fluorescence spectra of P2 (10 μM) as function of the water content in THF (ex = 420 nm).
14
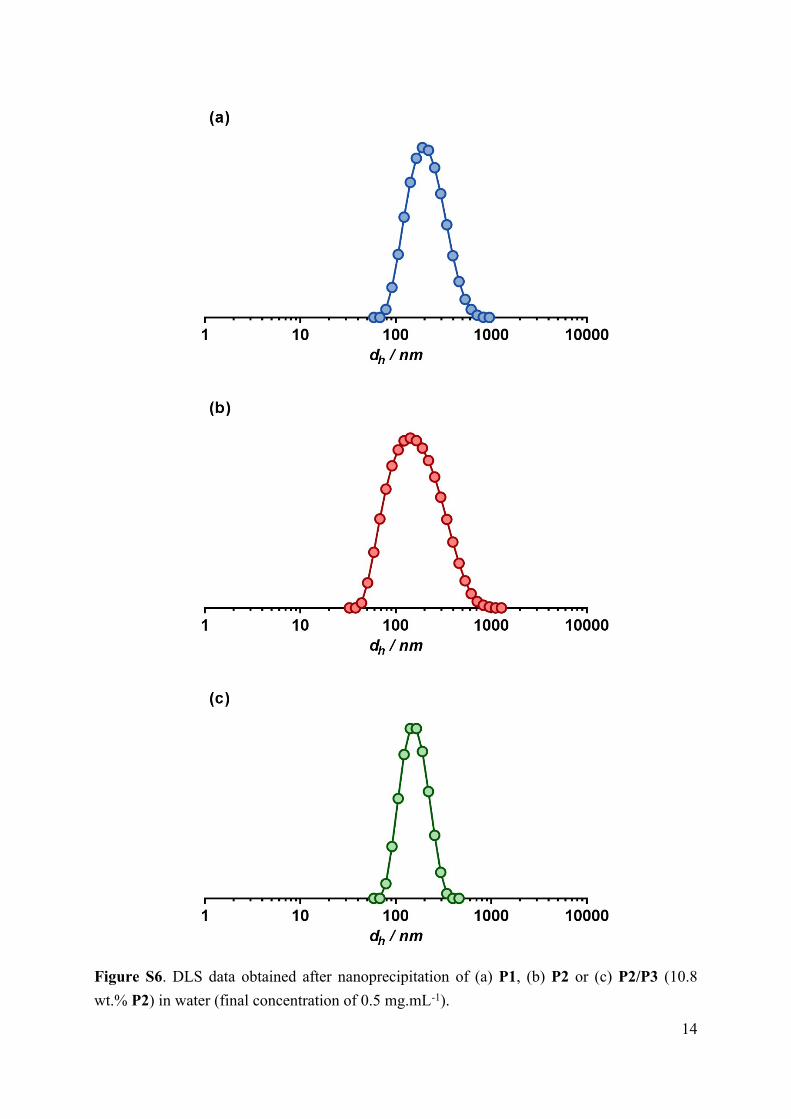
Figure S6. DLS data obtained after nanoprecipitation of (a) P1, (b) P2 or (c) P2/P3 (10.8 wt.% P2) in water (final concentration of 0.5 mg.mL-1).
15
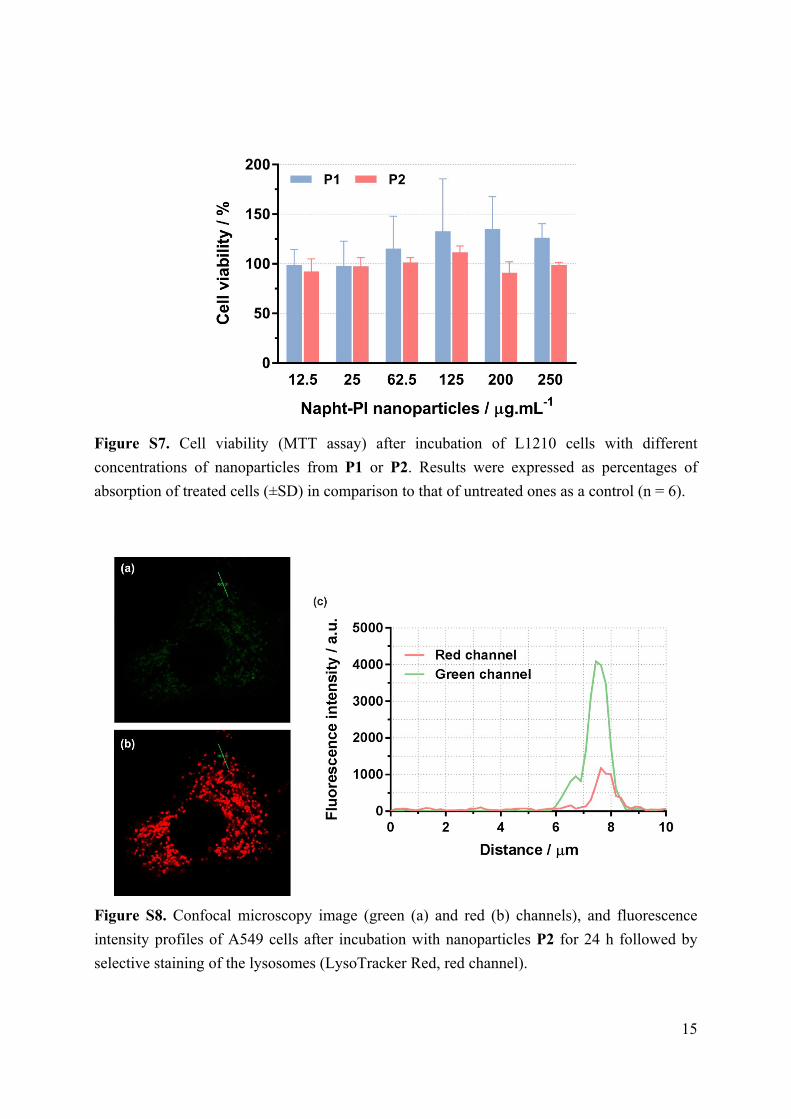
Figure S7. Cell viability (MTT assay) after incubation of L1210 cells with different concentrations of nanoparticles from P1 or P2. Results were expressed as percentages of absorption of treated cells (±SD) in comparison to that of untreated ones as a control (n = 6).
Figure S8. Confocal microscopy image (green (a) and red (b) channels), and fluorescence intensity profiles of A549 cells after incubation with nanoparticles P2 for 24 h followed by selective staining of the lysosomes (LysoTracker Red, red channel).
16
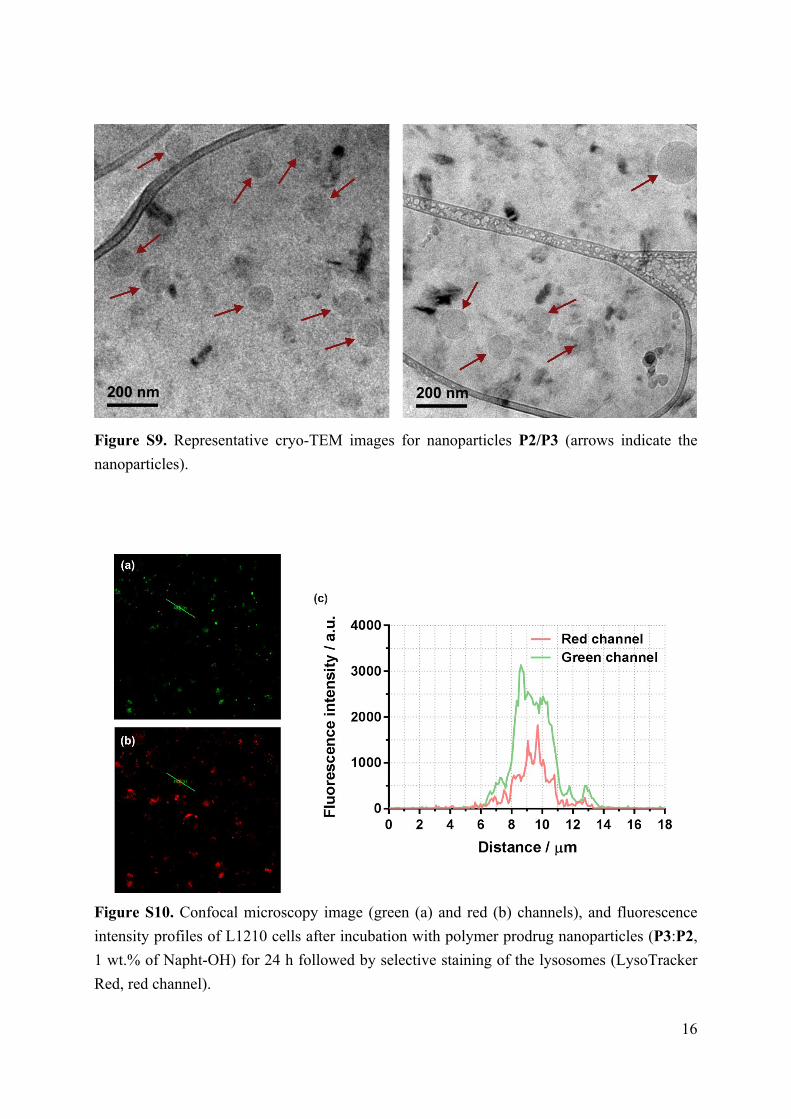
Figure S9. Representative cryo-TEM images for nanoparticles P2/P3 (arrows indicate the nanoparticles).
Figure S10. Confocal microscopy image (green (a) and red (b) channels), and fluorescence intensity profiles of L1210 cells after incubation with polymer prodrug nanoparticles (P3:P2, 1 wt.% of Napht-OH) for 24 h followed by selective staining of the lysosomes (LysoTracker Red, red channel).
17
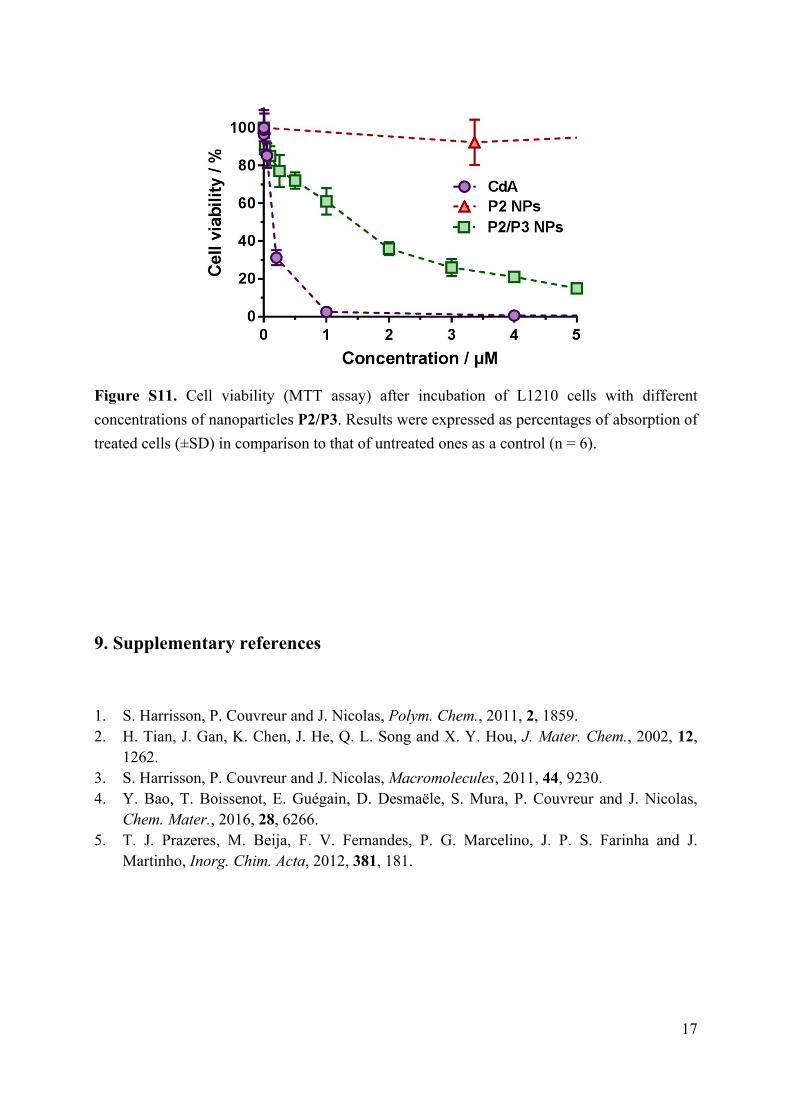
Figure S11. Cell viability (MTT assay) after incubation of L1210 cells with different concentrations of nanoparticles P2/P3. Results were expressed as percentages of absorption of treated cells (±SD) in comparison to that of untreated ones as a control (n = 6).
9. Supplementary references
1. S. Harrisson, P. Couvreur and J. Nicolas, Polym. Chem., 2011, 2, 1859.2. H. Tian, J. Gan, K. Chen, J. He, Q. L. Song and X. Y. Hou, J. Mater. Chem., 2002, 12,
1262.3. S. Harrisson, P. Couvreur and J. Nicolas, Macromolecules, 2011, 44, 9230.4. Y. Bao, T. Boissenot, E. Guégain, D. Desmaële, S. Mura, P. Couvreur and J. Nicolas,
Chem. Mater., 2016, 28, 6266.5. T. J. Prazeres, M. Beija, F. V. Fernandes, P. G. Marcelino, J. P. S. Farinha and J.
Martinho, Inorg. Chim. Acta, 2012, 381, 181.