electronic supplementary material spatio-temporal … · · 2017-01-23spatio-temporal...
TRANSCRIPT
1
ElectronicSupplementaryMaterial
Spatio-temporalenvironmentalvariationmediatesgeographicdifferencesin
phenotypicresponsestooceanacidification
JuanDiegoGaitán-Espitia1,2*,PaolaVillanueva3,JorgeLopez3,RodrigoTorres4,Jorge
Navarro3&LeonardoBacigalupe2
1CSIROOceans&Atmosphere,GPOBox1538,Hobart7001,TAS,Australia
2InstitutodeCienciasAmbientalesyEvolutivas,UniversidadAustraldeChile,
Casilla567Valdivia,Chile.
4InstitutodeCienciasMarinasyLimnologicas,UniversidadAustraldeChile,Casilla
567Valdivia,Chile.
5CentrodeInvestigaciónenEcosistemasdelaPatagonia,Coyhaique,Chile.
*Correspondingauthor:JuanDiegoGaitán-Espitia.Emailaddress:
2
Legendsofsupplementaryfiles
*Supplementarymethods:
a) Spawningandexperimentalset-up
b) Phenotypicanalyses
c) Metabolicrates
d) Developmentalprogressionandsurvival
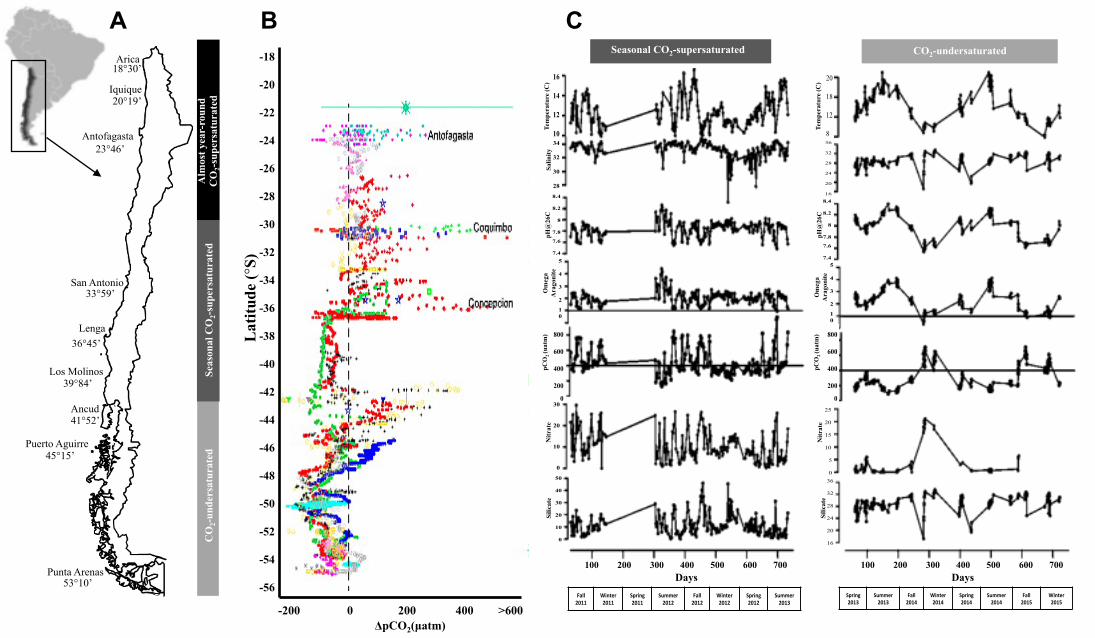
*FigureS1.A)PopulationsofLoxechinusalbusdistributedalongalatitudinal
gradientinthePacificcoastofChilecharacterizedbynaturalfluctuationsin
pCO2/pHconditions.Populationsaregroupedinthreemainregionsaccordingtothe
intensityanddurationofpCO2variability.B)Spatialvariabilityinsurfaceseawater
pCO2alongthecoastofChilebetween1995and2009.Dotsrepresenttheair-surface
waterCO2(ΔpCO2),estimatedasthedifferenceintheCO2partialpressurebetween
surfacewaterandair.Colorsrepresentsamplinglocations(Modifiedfrom[1]).C)
Carbonatesystemtimeseriesinintertidalwatersofanupwellingarea(24S)and
non-upwellingarea(46S)ofChile.CO2variabilityishigherwithintheupwelling
area,reachingshortperiodsofpCO2values>1000uatmduringtheAustralspring
andsummer(UnpublisheddataRodrigoTorres).
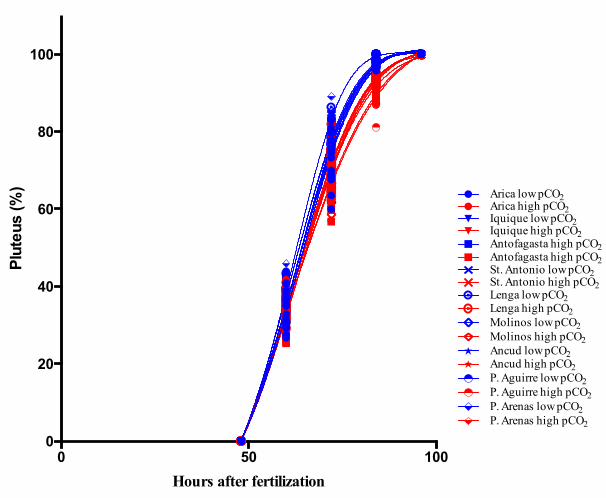
*FigureS2.Modelfittingofdevelopmentalprogressionuntilthe4-armspluteus
stageinLoxechinusalbus.
*TableS1.Seawatercarbonatechemistry(mean±SE)usedinexperimental
treatmentsofL.albus

3
inexperimental *TableS2.Seawatercarbonatechemistry(mean±SE)used
treatmentsofL.albus
*PhenotypicdatafromdifferentpopulationsofL.albus.
4
SupplementaryMethods
a)Animalcollection,spawningandexperimentalset-up
Adultseaurchinswerecollectedfromninelocalities(~80animalspersite)
alongtheupwellingsystemandfjordsofthePacificcoastofChileduringthe
spawningseason(JulytoSeptember2014)reportedforthisspeciesalongits
geographicdistribution[2].Gameteswereobtainedbystandardmethodswithin2-3
daysaftercollection.Weinducedspawningviacoelomicinjectionof0.5MKCl.The
eggswerecollectedin0.35µmfiltered,UV-sterilizedseawateratambient
conditions(13°Cand390μatmpCO2).Thespermwascollecteddry,andkeptonice
untilfertilization.Fromeachlocality,20independentcrossesofasinglemalewith
pooledeggsofthreefemalesweredevelopedtoavoidmale-femaleincompatibility.
Eggswerefertilizedusingfiltered(0.1μm)seawateratambientconditions(13°C
and390μatmpCO2)inordertoeliminateconfoundingeffectsofhighpCO2on
spermmobility.Embryoswereequallyandrandomlydistributedbetweentwo
replicatebucketsintheexperimentalpCO2treatments(currentglobal:390μatm;
andprojectedOA:1200μatm)withcontrolledtemperature(13-14°C)ata
concentrationofapproximately0.7embryosml-1.Embryosweremaintainedunder
experimentalconditionsuntilcompletetransitiontolarvalstage(4-armspluteus,
~96h).Larvaewerenotfedduringtheexperimentalperiodtoavoidchangesin
developmentandphysiologyinducedbydiet[3],aswellaschangesinexperimental
conditionsproducedbyrespirationandphotosynthesisofmicroalgae.Asamodeof
separatingthermalenvironmentaleffectsfromlocaldifferentiationamong
populations,common-gardenexperimentsarethegold-standarddesign.Weapplied
5
thisapproachwithhomogeneouslaboratoryacclimationtoourninepopulationsof
L.albus.Hence,anyobservedphenotypicdifferencewillbeattributabletothe
geneticsofthesourcepopulations[4].
Seawatercarbonatechemistrywasmaintainedusingasemi-automaticflow-
throughCO2-mixingsystem.Thesystemwasmodifiedbypumpingtheappropriate
CO2–gasmixforthetreatmentdirectlyintotheheadspaceoftheculturevessels,
usingtheA-1experimentaldesign(Sensu[5]).Simultaneouswatersampleswere
collectedtodeterminepHvariationstroughthepotentiometricmethod.pHwas
measuredinaclosed25-mLcellthermo-staticallycontrolledat25.0°Cusinga
Metrohm713pHmeter(inputresistanceN1013Ohm,0.1mVsensitivity,and
nominalresolution0.001pHunits)andaglasscombineddoublejunctionAg/AgCl
electrode(Metrohmmodel6.0219.100)calibratedwith8.089Trisbuffer(25°C).pH
isreportedonthetotalhydrogenionscale.Totalalkalinity(TA)wasmeasured
everythreedayswhereastemperature,pHandsalinityweremonitoredeveryday.
TA,pH,phosphatesanddissolvedsilicateswereusedtocalculatetherestofthe
carbonatesystemparametersandthesaturationstageofOmega,Aragoniteand
CalciteusingCO2calc[6]withthedissociationconstantsofMehrbach,refittedby
DicksonandMillero(1987).
b)Phenotypicanalyses
Morphometrictraitssuchastotallarvallengthandpostoralarmlengthwere
analyzedatthe4-armspluteusstage.Fromeachcrossineachexperimental
condition,20larvaewerecollectedandimmediatelyfixedin2%formalinsaturated
6
withsodiumboratetopreventacidityanddissolutionoftheskeleton.Photographs
formorphometricanalysesweretakenwithintwoweeksoffixation,usingadigital
cameraattachedtoacompoundmicroscopeatamagnificationof×10,withlarvae
orientateddorsalsidedown.Totallarvallengthandpostoralarmlengthwere
estimatedfollowing[7].Morphometricvalueswereestimatedusingtheimage
analysissoftwareImage-ProPlus.DifferencesinTLandPOLwereanalyzedusing
lmerfunctioninthe‘lme4’packageofRv.3.3(RCoreTeam,2016),withCO2
treatmentandregionasfixedfactorsandlocalityasrandomfactor.Significance
testswereperformedwiththe‘lmerTest’package.Post-hoccomparisonsformixed
effectsmodelsweredonewiththe‘multcomp’and‘lsmeans’packages.
c)Metabolicrates
Ratesofoxygenconsumptionwereobtainedinearlypluteuslarvae
accordingto[7].Inbrief,differentdensitiesoflarvae(50–1000individuals)were
placedinrespiratorychambers(1000μlvials)andincubatedfor4–7hinorderto
generateastandardcurvefromwhichwecouldestimatetherateofoxygen
consumptionperindividual(expressedaspmolO2/hr/larva)underexperimental
conditions.Twocontrolvialscontainingonlyfreshseawaterwereincubated
simultaneouslytoaccountforbackgroundrespiration.Afterincubation,larvaewere
removedandO2measuredusinganopticfiberoxygen-meter(MicroxTX3,PreSens,
Germany),withdiametertipsof20–50um.Zerocalibrationwasperformedusinga
Na2O3Ssolution(0%saturation)and100%wascalibratedusingair-bubbled
seawater.Temperaturewasstabilizedusingatemperature-controlledwaterbath
7
(JioTech,Co).Inordertotestforthepotentialeffectoflarvalsizeonrespiration,we
performedalinearregressionanalysisusingtheaveragerespirationrateandthe
averagelarvalsizeforeachcrosswithineachtreatment.Duetothesignificant
correlationbetweenthesetwovariables(r=0.75;P<0.001),residualswereusedto
removetheeffectofsize.Differencesinrespirationrate(aproxyofmetabolicrate)
wereanalyzedusinglmerfunctioninthe‘lme4’packageofRv.3.3(RCoreTeam,
2016),withCO2treatmentandregionasfixedfactorsandlocalityasrandomfactor.
Significancetestswereperformedwiththe‘lmerTest’package.Post-hoc
comparisonsformixedeffectsmodelsweredonewiththe‘multcomp’and‘lsmeans’
packages.
d)Developmentalprogressionandlarvalsurvival
Developmentwastrackedbyrecordingtheproportionofembryosthat
reachedblastula,gastrula,prismandearlypluteusstagesundereachexperimental
condition.Culturesweremonitoredbyremoving50larvaeevery12handscoring
eachlarvalstage.Theexperimentwasterminatedwhen100%ofthecollected
larvaereachedthe4-armspluteusstage.Developmentalprogressioncurveswere
fittedandanalysedwithGraphPadPrismsoftware(GraphPad,SanDiego,CA).
Comparisonsoffits(Gompertz,logistic,exponentialandWeibull)wereperformed
usingAkaike’sinformativecriteria(AICc)andtheExtrasum-of-squaresFtest.Inall
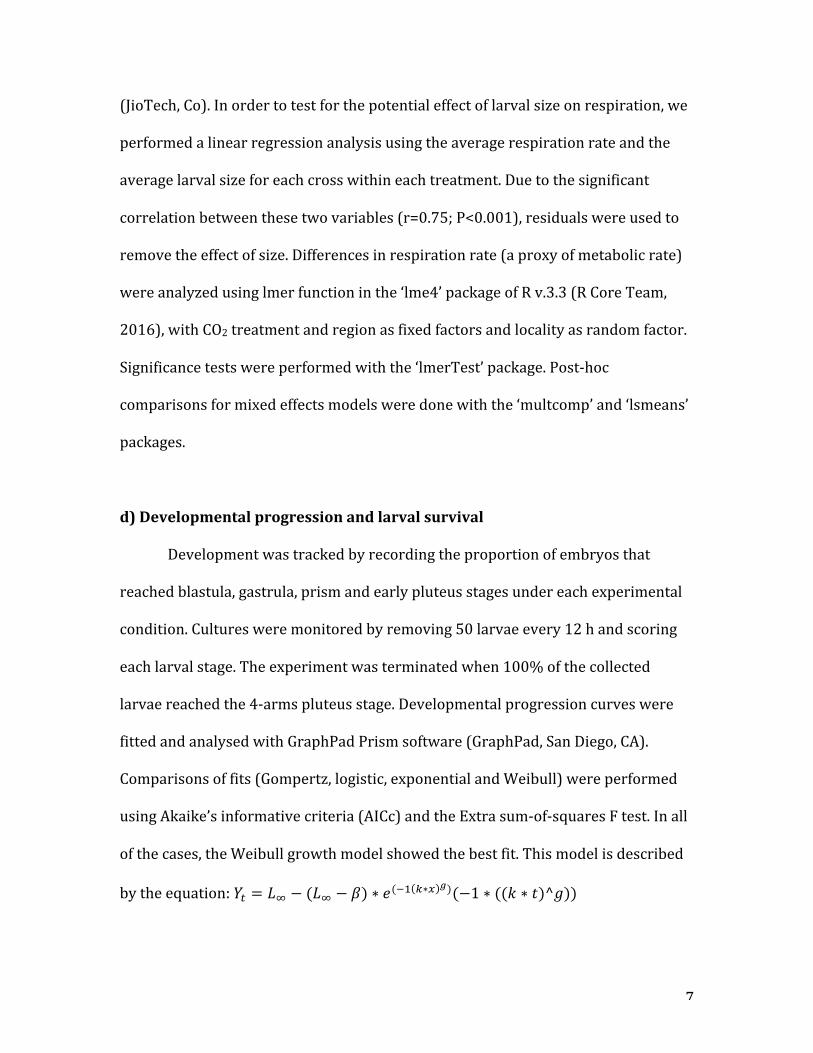
ofthecases,theWeibullgrowthmodelshowedthebestfit.Thismodelisdescribed
bytheequation:𝑌! = 𝐿! − (𝐿! − 𝛽) ∗ 𝑒(!! !∗! !)(−1 ∗ ((𝑘 ∗ 𝑡)^𝑔))
8
WhereYisthelength(orweight,height,size)atatimet,𝛽isthelowerasymptote,L
istheupperasymptote,kisthegrowthrateandgisaparameterthatcontrolsthex-
ordinateforthepointofinflectioninthexaxis.Comparisonsamongpopulations
andexperimentaltreatmentswerebasedontheparameterkasaproxyoftheshape
ofthedevelopmentalprogression.
Larvalsurvivalwasestimateddailybyaspiringthebottomofthe
experimentalbuckets.Differencesinsurvivalat4-armspluteusstagewereanalyzed
usingglmerfunctionwithbinomialdistributioninthe‘lme4’packageofRv.3.3(R
CoreTeam,2016),withCO2treatmentandregionasfixedfactorsandlocalityas
randomfactor.Significancetestswereperformedwiththe‘lmerTest’package.Post-
hoccomparisonsformixedeffectsmodelsweredonewiththe‘multcomp’and
‘lsmeans’packages.
Seasonal CO2-supersaturated CO2-undersaturated
pH@
26C
Salin
ityTe
mpe
ratu
re (C
)pC
O2 (u
atm
) 800
600
400
200
0
Om
ega
Ara
goni
te
5
4
3
2
1 0
8.4
8.2
8
7.8
7.6
7.4
30
20
10
0
Nitr
ate
Silic
ate
50
40
30
20
10
0
16
14
12
10 34
32
30
28
pH@
26C
Tem
pera
ture
(C)
pCO
2 (u
atm
) 800
600
400
200
0
Om
ega
Ara
goni
te
5
4
3
2
1 0
8.4
8.2
8
7.8
7.6
7.4
Nitr
ate
Silic
ate
36
32 28 24
20
16
25
20
15
10
5
0
36
32
28
24
20
16
20
18
12
8
100 200 300 400 500 600 700
Fall$2011$
Winter$2011$
Spring$2011$
Summer$2012$
Fall$2012$
Winter$2012$
Spring$2012$
Summer$2013$
Spring'2013'
Summer'2013'
Fall'2014'
Winter'2014'
Spring'2014'
Summer'2014'
Fall'2015'
Winter'2015'
100 200 300 400 500 600 700
Lat
itude
(°S)
-18
-20
-22
-24
-26
-28
-30
-32 -34 -36 -38
-40
-42
-44
-46
-48
-50
-52
-54
-56
-200 0 200 400 >600 ΔpCO2(µatm)
Iquique
Antofagasta
San Antonio
Lenga
Los Molinos
Ancud
Arica
Puerto Aguirre
Punta Arenas
41°52’
45°15’
53°10’
Seas
onal
CO
2-su
pers
atur
ated
A
lmos
t yea
r-ro
und
C
O2-
supe
rsat
urat
ed
CO
2-un
ders
atur
ated
39°84’
36°45’
33°59’
23°46’
20°19’
18°30’
A B C
Days Days
0 50 1000
20
40
60
80
100
Hours after fertilization
Plut
eus
(%) Arica low pCO2
Iquique low pCO2
Arica high pCO2
Iquique high pCO2
Antofagasta high pCO2
St. Antonio high pCO2
Lenga high pCO2
Molinos high pCO2
Ancud high pCO2
P. Aguirre high pCO2
P. Arenas high pCO2
Antofagasta high pCO2
St. Antonio low pCO2
P. Aguirre low pCO2
Ancud low pCO2
Lenga low pCO2
Molinos low pCO2
P. Arenas low pCO2
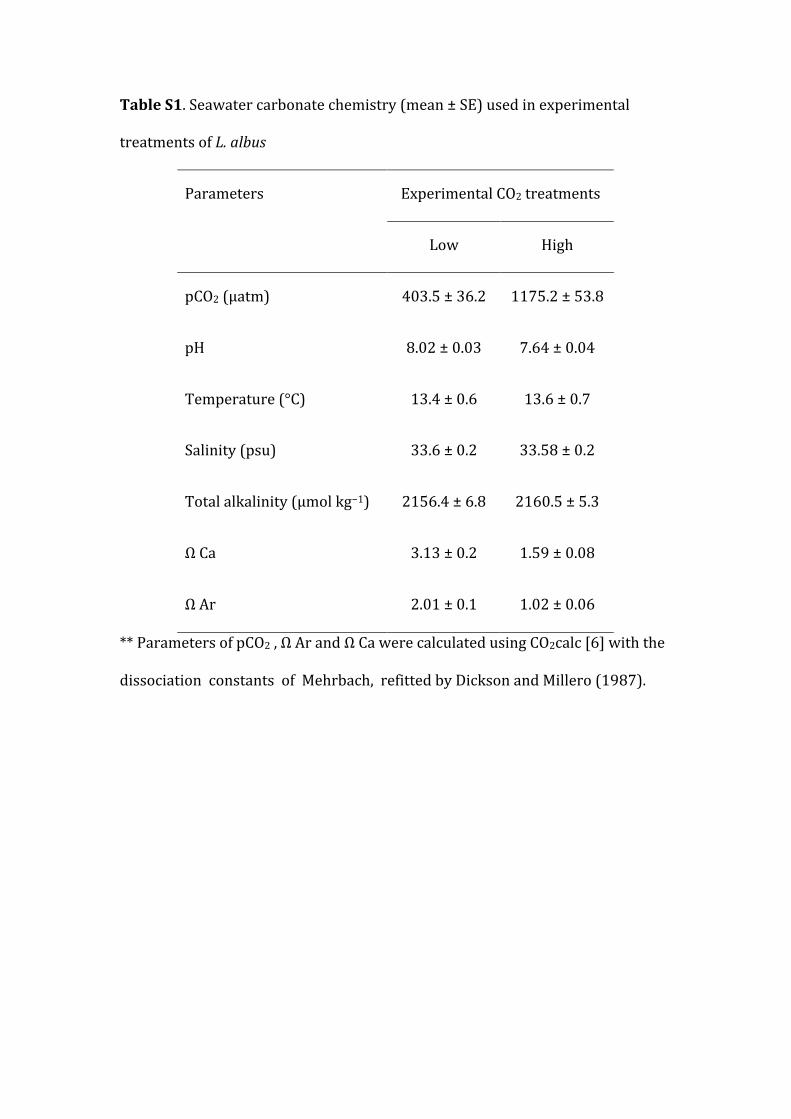
TableS1.Seawatercarbonatechemistry(mean±SE)usedinexperimental
treatmentsofL.albus
Parameters ExperimentalCO2treatments
Low High
pCO2(μatm) 403.5±36.2 1175.2±53.8
pH 8.02±0.03 7.64±0.04
Temperature(°C) 13.4±0.6 13.6±0.7
Salinity(psu) 33.6±0.2 33.58±0.2
Totalalkalinity(μmolkg−1) 2156.4±6.8 2160.5±5.3
ΩCa 3.13±0.2 1.59±0.08
ΩAr 2.01±0.1 1.02±0.06
**ParametersofpCO2,ΩArandΩCawerecalculatedusingCO2calc[6]withthe
dissociationconstantsofMehrbach,refittedbyDicksonandMillero(1987).
References1. Torres,R.etal.2011Air-seaCO2fluxesalongthecoastofChile:FromCO
2outgassingincentralnorthernupwellingwaterstoCO2uptakein
southernPatagonianfjords.J.Geophys.Res.116,C09006.
(doi:10.1029/2010JC006344)
2. Vásquez,J.2007EcologyofLoxechinusalbus.InEdibleSeaUrchins:
BiologyandEcology(edJ.M.Lawrence),pp.227–241.Elsevier.
(doi:http://dx.doi.org/10.1016/S0167-9309(01)80012-0)
3. Stumpp,M.,Wren,J.,Melzner,F.,Thorndyke,M.&Dupont,S.2011CO2
inducedseawateracidificationimpactsseaurchinlarvaldevelopmentI:
elevatedmetabolicratesdecreasescopeforgrowthandinduce
developmentaldelay.Comp.Biochem.Physiol.PartAMol.Integr.Physiol.
160,331–40.(doi:10.1016/j.cbpa.2011.06.022)
4. Lindgren,B.&Laurila,A.2009Physiologicalvariationalongageographical
gradient:isgrowthratecorrelatedwithroutinemetabolicrateinRana
temporariatadpoles?Biol.J.Linn.Soc.98,217–224.(doi:10.1111/j.1095-
8312.2009.01255.x)
5. Cornwall,C.E.&Hurd,C.L.2015Experimentaldesigninocean
acidificationresearch:problemsandsolutions.ICESJ.Mar.Sci.2015,177–
202.
6. Robbins,L.,Hansen,M.,Kleypas,J.&Meylan,S.2010CO2calc—auser-
friendlyseawatercarboncalculatorforWindows,MaxOSX,andiOS
(iPhone).
7. Padilla-Gamiño,J.,Kelly,M.,Evans,T.&Hofmann,G.2013Temperature
andCO2additivelyregulatephysiology,morphologyandgenomic

responsesoflarvalseaurchins,Strongylocentrotuspurpuratus.Proc.R.
Soc.BBiol.Sci.280,20130155.