electronic supporting information (esi) · 2010-04-06 · electronic supporting information (esi)...
TRANSCRIPT

Supplementary Material (ESI) for Soft Matter This journal is © The Royal Society of Chemistry 2010
1
Electronic Supporting Information (ESI)
Microfluidic Contact Printing: a Versatile Printing Platform for
Patterning Biomolecules on Hydrogel Substrates
Huaibin Zhang1, Jennifer N. Hanson Shepherd2, Ralph G. Nuzzo1,2*
1 Department of Chemistry, University of Illinois, Urbana-Champaign, 505 South Mathews Ave., Urbana, IL 61801 2 Department of Material Science and Engineering, University of Illinois, Urbana-Champaign, 1304 W Green St., Urbana, IL 61801
*Corresponding author: (tel) 1-217-244-0809; (fax) 1-217-244-2278; email: [email protected]
Content:
• Membrane modification
• Silicon master fabrication
• Softly cured PDMS
• Selective membrane exposure
• Image background fluorescent intensity correction
• Hippocampal neuron culture and imaging
• Testing the device reusability and pattern reproducibility
• Testing the time dependence relationship on transferred pattern intensity and size
• Fig. S1: Comparison of a PCTE membrane before and after Ti/SiO2 deposition
• Fig. S2: Micrographs and line scans highlighting differences in pattern resolution
related to streptavidin concentration
• Fig. S3: Micrographs and line scans showing the initial patterning of PDL and the
orthogonal exposure of BSA
• Fig. S4: Top view of device, after being wet with IPA using a cotton swab
• Fig. S5: Experimental setup of a writing station for selective membrane wetting
• Fig. S6: Sequence of images highlighting selective wetting of the PCTE membrane
with IPA
• Fig. S7: Time dependence of the fluorescence intensity and diameter of the printed
pattern

Supplementary Material (ESI) for Soft Matter This journal is © The Royal Society of Chemistry 2010
2
Membrane modification
Polyvinylpyrrolidone (PVP) or PVP-free (PVPF) PCTE membranes (0.22 μm pore, GE
Osmonics Labstore, Minnetonka, MN) were carefully placed in conformal contact with 1
mm thick PDMS slabs, which act as sacrificial support layers during surface
modification. Care was taken to minimize scratches and deformation on the membranes
throughout every step of the modification procedure, as small scratches detrimentally affect
future patterning attempts. A 50 Å adhesion layer of titanium, followed by 100 Å of SiO2
were evaporated onto the surface of the membranes, at a rate of approximately 0.1 Å/s to
provide a uniform surface coverage (Temescal FC-1800 electron beam evaporator). This
coverage, given the ballistic nature of the deposition method, is not conformal to the high
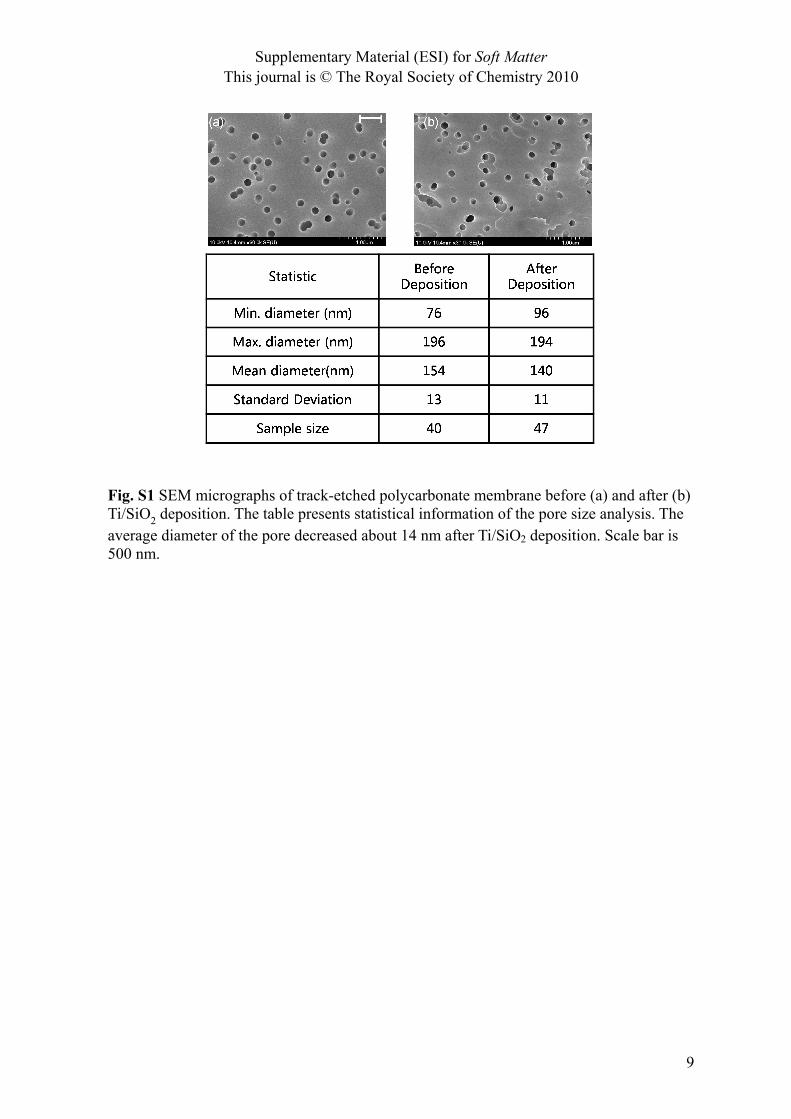
aspect ratio pore interiors, which remain hydrophobic. Scanning electron microscopy
(JEOL 6060LV General Purpose SEM, Tokyo, Japan) was used to image the membrane
before and after deposition. Membrane pore sizes were measured using Image Pro Express
(Media Cybernetics, Inc., Bethesda, MD) and analyzed by Microsoft Excel (Fig. S1).
Silicon master fabrication
Silicon wafers were scored into desired sizes, cleaned with piranha solution, rinsed with
deionized water (Milli-Q, Millipore, Billerica, MA) and then blown dry with nitrogen.
SU8-50 (MicroChem Corp., Newton, MA) was spun-coated onto the wafer pieces at 2900
rpm, with a ramping of 100 rpm/sec, for 30 seconds. The wafers were pre-baked for 5
minutes at 120 ºC and patterned by exposing to UV (MJB3 Mask Aligner, Suss Microtech,
Garching, Germany) for 45 seconds. Exposed wafers were then post-baked for 5 minutes
at 120 ºC and cooled, before being developed with SU8 developer (Microchem Corp.). All
patterned wafers were treated with tridecafluoro-1,1,2,2-tetrahydrooctyl trichlorosilane

Supplementary Material (ESI) for Soft Matter This journal is © The Royal Society of Chemistry 2010
3
(Sigma Aldrich, St. Louis, MO) for two hours in a dessicator under vacuum, to prevent
adhesion of PDMS to the fabricated masters.
Softly cured PDMS channel
Irreversible interfacing between the PDMS microchannels and supporting substrate was
significantly improved when the PDMS was soft or slightly-under cured. In the fabrication
process described here, the PDMS is cured long enough to be removed from the master, but
can still be deformed when gently manipulated with a tweezers (i.e. a small indent on the
surface can be seen versus fully cured PDMS, which cannot be deformed in such a manner).
To quantitatively characterize the experimental condition of the soft-cure, the curing ratio
first proposed by Go and Shoji was used.1 The curing ratio, R, is defined as R= ts/tf, where
ts is the soft cure time and tf is the full cure time. The full cure time, in minutes, can be
calculated based on the experimental equation log10(tf)= 3.4710 - 0.0158Ts, where Ts is the
soft cure temperature in degrees Celsius. For this system, samples were cured for 22
minutes at 70 °C, which gives a curing ratio, R, of 0.1. It should be noted that the soft cure
time depends on the amount of PDMS being cured, so longer soft cure times may be
required for larger samples.
Selective membrane exposure
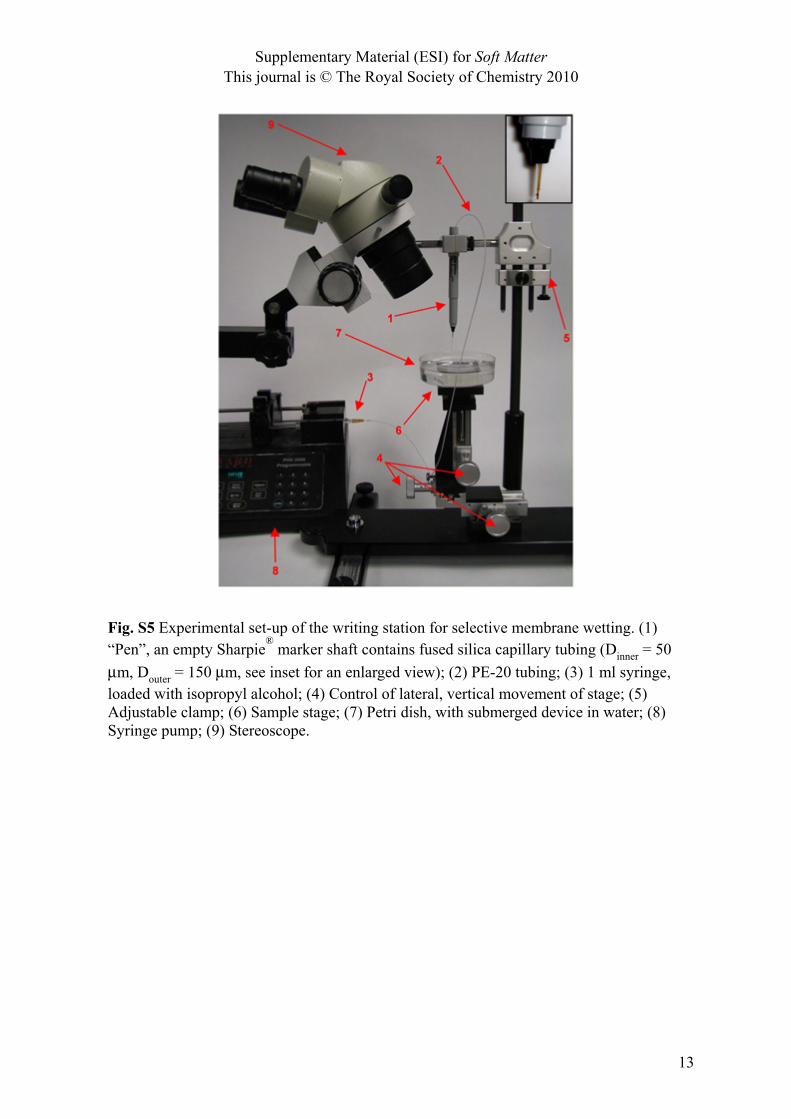
A ‘pen’ was created to ‘write’ solvent in discrete places across the channel system covered
by the PCTE membrane. As highlighted in Fig. S4, the ‘pen’ in this setup was made by
connecting fused silica capillary tubing (Dinner = 50 μm, Douter = 150 μm, Polymicro
Technologies, Phoenix, AZ) to a syringe (1 ml Norm-Ject® Luer syringes, Henke Sass
Wolf, Germany) loaded into a syringe pump (PHD 2000 programmable pump, Harvard
Apparatus, Holliston, Massachusetts) using polyethylene tubing (PE-20, Intramedic Clay
Adams® Brand, Diagnostic Systems, Sparks, MD). The capillary tubing was housed inside
Supplementary Material (ESI) for Soft Matter This journal is © The Royal Society of Chemistry 2010
4
an empty Sharpie marker (Sharpie®, Oak Brook, IL) shaft to facilitate handling. Prior to
use, the syringe was filled with isopropyl alcohol (IPA), which served as the ‘ink’.
A PDMS channel device, fabricated as described above, was submerged in a petri dish of
deionized water. Submerging the device in water while ‘writing’ allows for a greater working time
to pattern the device, as the ‘ink’ will quickly evaporate when exposed to air. The submerged
device was placed on a sample stage that can be precisely controlled laterally and vertically. A
stereoscope (SZX7, Olympus, Melville, NY) mounted on an articulating arm boom stand was used
to observe the writing process.
Before the writing process, the syringe pump was set to 1 μl/min, while flow was allowed to
stabilize. The stage was slowly brought up until the water covered the tip of the capillary tubing.
At this point, the stereoscope was used to observe the progress of IPA through the ‘pen’ tip. When
the IPA reached a steady perfusion state through the tip, a change in the refractive index between
the IPA and the water can be observed. At this time, the dish was slowly brought up further, until
an interface formed between the surface of the device and tip. It is important that the capillary tip
not touch the top of device, as it will tear and/or deform the membrane as it rasters along the
surface. Once the interface has formed, the desired pattern can be written on the PDMS device, by
carefully moving the stage in the x- and y-directions. After drawing is complete, devices are
submerged in deionized water. A sequence of images that demonstrates this process can be seen in
Fig. S6.
Image background correction
All images used, either in the text or for image analysis, were background corrected in the
following manner, modified from method described by Model et al.2 A standard slide was
created by placing 0.1 mM fluorescein solution between a coverslip and a microscope slide,

Supplementary Material (ESI) for Soft Matter This journal is © The Royal Society of Chemistry 2010
5
which was subsequently imaged using fluorescence microscopy. These images could then
be used to highlight fluorescent intensity heterogeneity related to the microscope and
camera. Matlab (The MathWorks, Natick, MA) was used to background correct the raw
images. Using this software, RGB images were first converted to gray scale and then each
was divided by an image of the reference; corrected images were then outputted with false
coloring.
Hippocampal neuron culture and imaging
Prior to use in culture, patterned polylysine gel slabs were sterilized by exposure to 0.1%
Gentamicin (Invitrogen) PBS solution for 2 hours 3 before being transferred to a petri dish
of fresh sterile PBS, where they were stored overnight at 4 ºC.
The cell plating procedure used is similar to one published previously.4 Hippocampal
neurons were isolated from post-natal day one (P1) Long-Evans rats. All experiments were
conducted under protocols approved by the UIUC Institutional Animal Care and Use
Committee of the Vice Chancellor for Research, and under continuous supervision of the
campus veterinarian staff. The gels were plated at an initial density of approximately 150
cells/mm2. Neuronal samples were maintained in a humidified environment at 37 ºC with
5% CO2 and supplemented with Neurobasal media twice weekly for one week.
After 7 days in culture, neuronal samples were prepared for fluorescent imaging using the
same method presented previously.4 Samples were treated with DAPI (Invitrogen) to stain
the DNA in the nucleus blue, while rhodamine-phalloidin (Invitrogen) was used to stain the
actin in the cytoskeleton red. All fluorescent microscopy was carried out using a Zeiss
Axiovert 200M inverted research-grade microscope. A Dapi/Hoechts/AMCA filter
(Chroma Technology, Rockingham, VT) was used for the DAPI imaging, a Special Yellow

Supplementary Material (ESI) for Soft Matter This journal is © The Royal Society of Chemistry 2010
6
Rhodamine/Cy3/Texas Red filter (Chroma Technology) was used for the rhodamine
imaging, and a Piston/GFP filter (Chroma Technology) was used to image the fluorescein.
Testing the device reusability and pattern reproducibility
The reusability of the device was demonstrated by patterning gels using the same device at
different time points over several days. The device, in this case, was based on serpentine
channel (width = 50 µm) that connected nine dots (diameter = 350 μm), forming a 3x3
array as shown in Fig. 1d. Fluorescein labeled biotinylated dextran (i.e., mini-emerald)
was injected at 1 μl/min and the stamping time between the hydrogel and the device was
held constant at 5 minutes. Using the same device, 11 patterned gels were created. The
first 5 gels were printed on day 1, while the following 6 were printed three days later (day
4). In between printing cycles on day 1 and 4, the device was stored at 4 ºC in deionized
water. Patterned gels were imaged, background corrected, and analyzed using Image Pro
Express. For each image, the pixels in nine representative areas, corresponding to the nine
dots patterned directly from the underlying channel design, were sampled. The mean
intensity of pixels within each circular area was measured to represent the area intensity.
Typically, in a microfluidic channel, there is a drop in pressure as the distance from the
channel inlet increases.5 Thus, it might be expected that the intensity of a transferred
pattern would be directly related to the underlying location in the microchannel. In an
effort to address this phenomenon, the nine circular areas were analyzed separately by
grouping corresponding areas of the 11 consecutively printed patterns together (so there
were 9 groups in total). For each group, the mean intensity of the 11 circular areas was
determined to attain a normalization factor. This factor was then used to generate a
normalized mean intensity for the corresponding area of the pattern. The plot given in Fig.
Supplementary Material (ESI) for Soft Matter This journal is © The Royal Society of Chemistry 2010
7
S8 gives the normalized mean intensity for each of the 9 regions of the pattern; standard
deviation of the intensity for each region was used to generate error bars.
Testing the time dependence relationship on transferred pattern intensity and size
The printed pattern fidelity, in terms of diameter in comparison to the original channel
design, was investigated using the channel design (Fig. 1d) and setup described in the
pattern transfer reproducibility/device reusability section. In this analysis, the only
parameter that was changed was the stamping time which ranged from 0.5 to 10 minutes. .
Specifically, the relationship between printing time and pattern intensity and diameter were
considered. The AOI (Area of Interest) function was used to fit the 9 transferred dots. The
normalization factor that was generated for the pattern reproducibility study (overall mean
intensity for dots 1-9 printed at 5 minutes) was used as a baseline. The 5 minute overall
intensity was used as a baseline, as this time was most often used for dextran patterning.
The individual mean intensity for each dot was divided by this normalization factor, to
allow for strict comparison between time and intensity. Using this ratio, the percent change
from the baseline or the most typically used printing parameters can be visualized. This
data is presented in Fig. S7, with error bars representing the standard deviation. As can be
seen from the highlighted plot, the intensity of the transferred pattern increases
approximately linearly with stamping time.
The dependence of time on the size of the resulting patterns (in relation to the original
channel design) was investigated similarly. The AOI function was used to determine the
area in pixels of each of the 9 dots. An optical image of the original channel design was
loaded into Image Pro, the actual radius determined (~35 pixels) which was used to
determine the area. The determined area was subsequently used as a normalization factor.

Supplementary Material (ESI) for Soft Matter This journal is © The Royal Society of Chemistry 2010
8
Each individually measured area was divided by the normalization factor, to get a ratio of
the actual dot size in relation to the transferred dot. These data are plotted in Fig. S7, with
error bars representing the standard deviation. We found that the diameter of the printed
circles increased linearly with printing ranging from 0.5 to 10 minutes. For example, the
diameter of the 10 minute transfer is almost twice as large as that of 5 minute transfer. The
size of the transferred pattern depends on the diffusion kinetics of the dextran inside the gel,
the capture efficiency of the streptavidin for the biotinylated dextran, as well as the size and
conformation of the dextran itself.
References
1. J. S. Go and S. Shoji, Sensor Actuat. A-Phys., 2004, 114, 438-444. 2. M. A. Model and J. K. Burkhardt, Cytometry, 2001, 44, 309-316. 3. M. R. Hynd, J. P. Frampton, N. Dowell-Mesfin, J. N. Turner and W. Shain, J.
Neurosci. Meth., 2007, 162, 255-263. 4. J. N. Hanson, M. J. Motola, M. L. Heien, M. Gillette, J. V. Sweedler and R. G.
Nuzzo, Lab Chip, 2009, 9, 122-131. 5. S. K. Sia and G. M. Whitesides, Electrophoresis 2003, 24, 3563–3576.
Supplementary Material (ESI) for Soft Matter This journal is © The Royal Society of Chemistry 2010
9
Fig. S1 SEM micrographs of track-etched polycarbonate membrane before (a) and after (b) Ti/SiO2 deposition. The table presents statistical information of the pore size analysis. The average diameter of the pore decreased about 14 nm after Ti/SiO2 deposition. Scale bar is 500 nm.

Supplementary Material (ESI) for Soft Matter This journal is © The Royal Society of Chemistry 2010
10
Line Profile
Distance (Pixel)0 200 600 1000
0
2000030000400005000060000
Line Profile
Distance (Pixel)0 200 600 1000
0
2000030000400005000060000
Low Streptavidin Conc.
High Streptavidin Conc.
Inte
nsity
(a. u
.)In
tens
ity (a
. u.)
(a) (b)
(c) (d)
Fig. S2 Initial printing results for biotin-polylysine-FITC on polyacrylamide hydrogels. Hydrogels in (a) and (c) were made with prepolymer solution containing 50 μg/ml and 1mg/ml streptavidin acrylamide, respectively. Line scans in (b), (d) highlight differences in pattern resolution related to streptavidin concentration. Scale bars are 500 μm.

Supplementary Material (ESI) for Soft Matter This journal is © The Royal Society of Chemistry 2010
11
(a)
(b)
(c)
(d)
Inte
nsity
(a. u
.)
Distance (pixel)
Inte
nsity
(a. u
.)
0
21
34
Distance (pixel)0
1
Fig. S3 (a) Fluorescent micrograph highlights initial patterning of biotin-PDL-FITC, while (c) shows secondary exposure of biotin-BSA-Rhodamine. The line scans in (b) and (d) quantitatively describe the initial patterning and the orthogonal exposure, respectively. Scale bars are 500 μm.

Supplementary Material (ESI) for Soft Matter This journal is © The Royal Society of Chemistry 2010
12
Fig. S4 The underlying channel design was wetted with isopropyl alcohol using a cotton swab. The wetted device was immediately submerged in water to prevent solvent evaporation. The color of the PCTE membrane changed from white to translucent after wetting. Scale bar is 500 μm.
Supplementary Material (ESI) for Soft Matter This journal is © The Royal Society of Chemistry 2010
13
Fig. S5 Experimental set-up of the writing station for selective membrane wetting. (1) “Pen”, an empty Sharpie
® marker shaft contains fused silica capillary tubing (Dinner = 50
μm, Douter = 150 μm, see inset for an enlarged view); (2) PE-20 tubing; (3) 1 ml syringe, loaded with isopropyl alcohol; (4) Control of lateral, vertical movement of stage; (5) Adjustable clamp; (6) Sample stage; (7) Petri dish, with submerged device in water; (8) Syringe pump; (9) Stereoscope.

Supplementary Material (ESI) for Soft Matter This journal is © The Royal Society of Chemistry 2010
14
Fig. S6 Image sequences highlights selective wetting of the PCTE membrane with isopropyl alcohol using a capillary ‘pen’, gently rastered across the membrane surface. Membrane color changes from white to translucent after IPA exposure. Scale bar is 300 μm.

Supplementary Material (ESI) for Soft Matter This journal is © The Royal Society of Chemistry 2010
15
Fig. S7 The fluorescence intensity (a) and diameter (b) of the printed pattern linearly increases, through a stamping time range of 0.5-10 minutes. In (c) a micrograph of the printed pattern at 5 minutes is given, while the printed pattern after 10min is given in (d). Scale bar is 500 μm.