electrophysiologicalcharacterizationofspino-sciatic ... male cd-1 mice (n 116; weight, 35–40 g)...
TRANSCRIPT
Development/Plasticity/Repair
Electrophysiological Characterization of Spino-Sciaticand Cortico-Sciatic Associative Plasticity: Modulation byTrans-Spinal Direct Current and Effects on Recovery afterSpinal Cord Injury in Mice
Zaghloul Ahmed1,2
1Department of Physical Therapy, College of Staten Island for Developmental Neuroscience, College of Staten Island, Staten Island, New York 10314, and2Graduate Center/The City University of New York, New York, New York 10016
Associative stimulation causes enduring changes in the nervous system based on the Hebbian concept of spike-timing-dependentplasticity. The present study aimed to characterize the immediate and long-term electrophysiological effects of associative stimulation atthe level of spinal cord and to test how trans-spinal direct current stimulation (tsDC) modulates associative plasticity. The effect ofcombined associative stimulation and tsDC on locomotor recovery was tested in a unilateral model of spinal cord injury (SCI). Twoassociative protocols were tested: (1) spino-sciatic associative (SSA) protocol, in which the first stimulus originated from the sciatic nerveand the second from the spinal cord; and (2) cortico-sciatic associative (CSA) protocol, in which the first stimulus originated from thesciatic nerve and the second from the motor cortex. In addition, those two protocols were repeated in combination with cathodal tsDCapplication. SSA and CSA stimulation produced immediate enhancement of spinal and cortical outputs, respectively, depending on theduration of the interstimulus interval. Repetitive SSA or CSA stimulation produced long-term potentiation of spinal and cortical outputs,respectively. Applying tsDC during SSA or CSA stimulation markedly enhanced their immediate and long-term effects. In behaving micewith unilateral SCI, four consecutive 20 min sessions of CSA � tsDC markedly reduced error rate in a horizontal ladder-walking test.Thus, this form of artificially enhanced associative connection can be translated into a form of motor relearning that does not depend onpractice or experience.
IntroductionPairing stimulation of presynaptic and postsynaptic cells inducesassociative plasticity via synaptic mechanisms (Levy and Steward,1983). Associative stimulation can modify synaptic efficacy in abidirectional manner depending on the timing of the presynapticinput relative to the postsynaptic input (Li et al., 2004): enhance-ment occurs when the presynaptic input precedes the postsynap-tic input, whereas depression occurs when the order of inputs isreversed. This form of plasticity is called spike-timing-dependentplasticity (Song et al., 2000) and has been studied intensively bymonitoring single-cell in vitro preparations (for review, see Danand Poo, 2004) and in vivo models (Jacob et al., 2007; An et al.,2012). Paired associative stimulation (PAS) is a technique thatsynchronizes brain stimulation with peripheral nerve input,which has been shown to induce enduring plasticity in humans(Stefan et al., 2000). Although spike-timing-dependent plasticity
and PAS-induced plasticity differ procedurally, both are based onthe Hebbian principle of associative plasticity (Hebb, 1949), andsimilar mechanisms probably mediate their induction. In addi-tion to PAS, other stimulation protocols can induce enduringchanges in neuronal excitability, such as direct current (DC)stimulation, which polarizes the neuronal tissue. There are twoknown applications of DC: transcranial DC stimulation (Priori etal., 1998; Nitsche and Paulus, 2000; Fregni et al., 2005) and trans-spinal DC stimulation (tsDC) (Cogiamanian et al., 2008; Aguilaret al., 2011; Ahmed, 2011; Cogiamanian et al., 2011; Ahmed andWieraszko, 2012; Lamy et al., 2012). Simultaneous cathodaltranscranial DC stimulation and PAS have been shown to en-hance motor cortex excitability in humans (Nitsche et al., 2007).However, the effect of simultaneous cathodal tsDC and PAS isnot known.
The spinal cord has remarkable potential for neuroplasticityto be induced by many interventions (Rossignol et al., 2007),especially activity-dependent interventions that improve func-tion after spinal cord injury (SCI) (Carmel et al., 2010; Ahmedand Wieraszko, 2012; van den Brand et al., 2012). PAS inducesneuroplastic changes at the level of the spinal cord (Meunier etal., 2007; Taylor and Martin, 2009), suggesting that changes inspinal cord excitability mediate PAS-induced plasticity. How-ever, the effect of pairing spinal and peripheral nerve (e.g., sciatic)
Received Oct. 21, 2012; revised Jan. 24, 2013; accepted Jan. 31, 2013.Author contributions: Z.A. designed research; Z.A. performed research; Z.A. analyzed data; Z.A. wrote the paper.This study was supported by Grant 64727-00 42 from Professional Staff Congress of the City University of New
York.Correspondence should be addressed to Z. Ahmed, Department of Physical Therapy, 2800 Victory Boulevard,
Staten Island, NY 10314. E-mail: [email protected]:10.1523/JNEUROSCI.4930-12.2013
Copyright © 2013 the authors 0270-6474/13/334935-12$15.00/0
The Journal of Neuroscience, March 13, 2013 • 33(11):4935– 4946 • 4935

stimulation on spinal excitability is unknown. In the currentstudy, I hypothesized that pairing sciatic nerve stimulation witheither spinal (spino-sciatic) or cortical (cortico-sciatic) stimula-tion in a mouse model would enhance spinal or cortical outputs,respectively. I reported previously that cathodal tsDC enhancesspinal excitability (Ahmed, 2011; Ahmed and Wieraszko, 2012).Therefore, I hypothesized that tsDC would further enhance PAS-induced plasticity. I also hypothesized that combined cathodaltsDC and cortico-PAS would improve skilled locomotor recoveryafter unilateral SCI.
The results indicated the following: (1) associative stimulationat particular interstimulus intervals (ISIs) enhances evoked po-tentials; (2) associative plasticity can be induced at the spinalcord; (3) cathodal tsDC modulates associative plasticity; and (4)combined cortical and peripheral associative stimulation, ac-companied by cathodal tsDC, improves skilled locomotor recov-ery after unilateral SCI.
Materials and MethodsAnimalsAdult male CD-1 mice (n � 116; weight, 35– 40 g) were used for thisstudy. Experiments were performed in accordance with the NationalInstitutes of Health Guidelines for the Care and Use of Laboratory Animals.Protocols were approved by the Institutional Animal Care and Use Com-mittee of the College of Staten Island. Animals were housed under a 12 hlight/dark cycle with access to food and water ad libitum.
Acute electrophysiological experimentsSurgical proceduresThe surgical procedure was performed as described previously (Ahmed,2011). Figure 1, A and B, illustrates experimental arrangements. Briefly,animals were anesthetized using ketamine/xylazine (90/10 mg/kg, i.p.).Throughout experiments, anesthesia was monitored online by observingmuscle and nerve activity and was kept at a steady level as shown in Figure1C (top). The aim was to maintain a moderate level of anesthesiathroughout all experiments. To accomplish this, stimulation protocolswere started 30 min after the first injection of anesthetic. In most exper-
iments, a second injection was not needed; however, if needed, a smalldose (5% of the first injection) was given subcutaneously to producegradual changes in the level of anesthesia. Subcutaneous anestheticboosters did not significantly affect the evoked potentials in these studies.
Animals were placed in a mouse stereotaxic apparatus, which wasplaced in a custom-made clamping spinal column system. The bone atthe base of the tail was fixed to the base of the system with surgical pins toimmobilize the head, vertebral column, and base of the tail. Incisionswere made in the skin covering the head, vertebral column (frommidthoracic to sacral region), and both hindlimbs, and the skin wasmoved to the side and held with clips. In experiments testing spino-sciatic associative (SSA) protocol, a laminectomy was performed at ver-tebral column level T9 –T10 to expose spinal level T13 to L1 (Fig. 1A). Inexperiments testing cortico-sciatic associative (CSA) protocol, no lami-nectomy was made. A craniotomy was made over the right primary mo-tor cortex (M1) without breaching the dura (Fig. 1B). To monitor muscleactivity during anesthesia, muscle isometric tension was recorded fromthe triceps muscles (TS). TS were carefully separated from the surround-ing tissue. The tendon of each of TS was threaded with a hook-shaped 0-3surgical silk, which was then connected to force transducers. Tissue sur-rounding the distal part of the sciatic nerve was removed. Both the sciaticnerve and TS muscle were soaked in warm mineral oil.
ElectrodesA stainless steel electrode (thickness, 50 �m; width, 5 mm; length, 7 mm)was used to deliver tsDC stimulation. This active electrode was placedover the vertebral column covering the area between vertebral level T13and L4, corresponding to spinal level L3–L6, which contains motoneu-rons within sciatic nerve axons that innervate the crural muscle groups(Kobbert and Thanos, 2000; Watson et al., 2009). The reference electrodewas an alligator clip attached to a flap of abdominal skin. Concentricbipolar stimulating electrodes (tip, 250 �m) were used to stimulate thesciatic nerve at its main trunk as it exits from the pelvis and the spinalcord at the junction between spinal level T13 and L1. The bipolar elec-trode was situated on the dorsal median sulcus of the spinal cord, aposition that evokes bilateral responses with a mean latency of 6.96 �0.19 ms. The cortex was stimulated with a monopolar electrode (tip, 150�m), and an active electrode was situated on M1 (1 mm posterior tobregma and 1 mm lateral to midline). In previous experiments, stimula-tion at these coordinates had the lowest threshold to evoke a response ofcrural muscles. The reference electrode was an alligator clip attached to aflap of scalp skin on the frontal aspect of the skull. Extracellular record-ings were made from the TS branch of the sciatic nerve with pure iridiummicroelectrodes (shaft diameter, 180 �m; tip, 1–2 �m; resistance, 5.0M�; World Precision Instruments).
StimulationA Grass S88X stimulator (Grass Technologies) in DC mode was used togenerate tsDC, which was delivered through a stimulus-isolated unit(Grass Technologies). The present experiments used cathodal tsDC withan intensity of �0.8 mA. Based on the area of the tsDC electrode, thecurrent density at the electrode surface was 2.29 A/m 2.
Sciatic nerve stimulation was performed using a Digitimer DS7AHconstant-current stimulator (Digitimer). Spinal and cortical stimulationwas performed using a PowerLab stimulator (ADInstruments). Thestimulators were controlled by LabChart software (ADInstruments),which was used to adjust stimulus intensity and ISI.
Stimulation protocolsSSA protocol (experiment 1). Experimental protocols started �5 min aftersurgery. The SSA stimulation protocol was performed by pairingtwo stimuli, delivered to the sciatic nerve and spinal cord. The spinal cordstimulus was delayed relative to sciatic nerve stimulus by 0, 2, 4, 6, 8, 10,12, 16, 24, 48, 84, 120, or 200 ms. At the beginning of each experiment,the spinal stimulus strength that produced maximal muscle contractionwas determined; spinal stimulation was then kept at �50% of maximalresponse during the SSA protocol. Sciatic nerve stimulus was also ad-justed to give 50% of maximal muscle and nerve responses. This was keptthroughout the SSA protocols. Before the SSA protocol, baseline single-pulse-induced compound action potentials (CAP) were sampled. Three
Figure 1. Schematic diagram of the acute experimental setup illustrating two stimulationarrangements. A, SSA stimulation setup, in which spinal cord level L1 was stimulated at thedorsal column (bipolar needle electrode). B, CSA stimulation setup, in which the M1 area of thecrural muscles was stimulated. In both arrangements, the sciatic nerve was stimulated on oneside, usually the left. Evoked potentials were recorded from both sciatic nerves (R, recording).DC was applied over the lumbar spine. C, Level of anesthesia was monitored by observing thespontaneous activity of nerve (blue) and muscle (red). The top shows the desired level at whichall recording and stimulation is performed; the bottom shows a level when anesthesia wasstarting to wear off. D, Schematic illustration showing part of the ISI stimulation protocol. Theprotocol consisted of baseline (trains of 5 shocks at 0.5 Hz, repeated every 10 s), a block ofSSA-only (train of 5 single shocks at 0.5 Hz, 10 s break, train of 5 SSA at 0.5 Hz), and postteststimulation identical to baseline. Bottom shows a block of SSA � tsDC, which consisted of atrain of five single shocks with no tsDC, a train of five single shocks during tsDC, SSA with no tsDC,and SSA during tsDC. This paradigm was repeated to test all ISIs and to test CSA.
4936 • J. Neurosci., March 13, 2013 • 33(11):4935– 4946 Ahmed • Associative Stimulation Combined with Transpinal DC

trains of five single shocks at fixed stimulus strength were delivered to thespinal cord at 0.5 Hz, repeated every 10 s. Responses to this stimulationwere averaged and used as a baseline for additional analysis.
SSA testing was divided into blocks containing a train of five singleshocks and a train of five SSA shocks (Fig. 1D), each at 0.5 Hz, performedin a pseudorandom order every 10 s. The SSA protocol consisted of 13blocks (one for each ISI). At the end of the protocol, single-pulse testingsimilar to baseline testing was performed. Exploratory experimentsshowed that this protocol design did not cause response facilitation ordepression.
Next, in a different group of animals (n � 6), tsDC (�0.8 mA) wasapplied during a similar SSA protocol (SSA � tsDC). The only differencewas that blocks included four trains of five shocks at 0.5 Hz: (1) singleshocks without tsDC; (2) single shocks with tsDC; (3) SSA without tsDC;and (4) SSA with tsDC (Fig. 1D). Trains were presented in a pseudoran-dom order every 10 s. Here single shocks were delivered to the spinalcord. Data from SSA-only in these six animals and the previous 10 de-scribed above were combined for analysis.
Protocols inducing long-term enhancement of spinally evoked potentials(experiment 2). To evaluate persistent aftereffects of SSA and SSA �tsDC, pretest recordings to establish a baseline consisted of trains of fivesingle shocks delivered at 0.5 Hz, repeated every 30 s for 3 min. CSA (n �7) and SSA (n � 10) were performed by pairing a spinal stimulus with asciatic stimulus with an ISI of 12 ms. Given the duration of cortical-evoked (cCAP) (�20 ms), sciatic-nerve-evoked (nCAP) (�15 ms), andspinal-evoked (sCAP) (�9 ms) potentials, a 12 ms ISI was selected ashaving the best potential to maximize synchronization, allowing com-parison of the induction of long-lasting effects by CSA and SSA. A total of90 associative stimuli were applied at 1 Hz. In SSA � tsDC (n � 5)protocol, tsDC was turned on (ramped up, 10 s) at the same time SSAbegan and turned off (ramped down, 10 s) when SSA ended. This wasfollowed by 80 min of posttest recording, which demonstrated that stim-uli pattern and intensity were identical during posttest and baseline.
CSA protocol (experiment 3). The CSA stimulation protocol was per-formed by pairing two stimuli, delivered to M1 and the sciatic nerve. Thesame stimulation design that was used during the SSA protocol was alsoused to test CSA (n � 8) and CSA � tsDC (n � 6) but in a different groupof animals.
Protocols inducing long-term enhancement of cCAP (experiment 4). Toevaluate persisted aftereffects of CSA, a similar procedure as the one usedto induce long-term enhancement of sCAP was used (see above). CSA(n � 7) was performed by pairing a cortical stimulus with a sciatic stim-ulus with an ISI of 12 ms.
Control experiments for repetitive protocol. Basic stimulation protocolswere tested using the experimental setup described above. Repetitivesingle-pulse stimulation alone was tested by applying 90 pulses at 1 Hz toM1 (n � 3), spinal cord (n � 3), or nerve (n � 4). The effect of shortexposure to tsDC only (�0.8 mA, 1.3 min) was tested on sCAP (n � 3)and cCAP (n � 4). The effect of combining tsDC with repetitive cortical(n � 5) and spinal (n � 5) single-pulse stimulation was tested by apply-ing single-pulse stimulation (90 pulses, 1 Hz) during tsDC (�0.8 mA).
Testing the specificity of tsDC (experiment 5). Using a similar setup asdescribed above, a different group of animals (n � 5) had the DC elec-trode placed at two locations: over the abdominal muscles 1.5 cm lateralto the lumbar spine ipsilateral to the stimulated nerve and over the spinalcolumn. Five single cortical stimuli were delivered without DC, duringtsDC, and during abdominal DC (Abd-DC). In addition, the CSA pro-tocol at 12, 24, and 48 ms ISI was delivered without DC, during tsDC, andduring Abd-DC.
Measuring latencies of spinal potentials (experiment 6). To measure thelatency of spinal potentials, one metal microelectrode (shaft diameter,180 �m; tip, 1–2 �m; World Precision Instruments) was inserted into theventral horn at the L4 level, and another electrode was inserted into thedorsal column of L4 (see Fig. 11). Stimulating electrodes were situated asdescribed above: the cortical stimulating electrode was on the motorcortex area (1 mm posterior to bregma, 1 mm lateral to midline), thespinal stimulating electrode was on the dorsal column at L1, and thesciatic nerve stimulating electrode was situated on the sciatic nerve as itexits the pelvis.
Latency was measured as the time from the onset of stimulus artifact tothe onset of the first deflection of the potential. Potential duration wasmeasured as the period starting from the onset of the stimulus artifact tothe end of the potential, at which the trace returns to baseline.
Nature of spinal responses and effect of glutamate blockers on SSA-induced changes (experiment 7). To differentiate between synaptic andfiber potentials recorded from the spinal cord, one of two glutamateantagonists was injected at the recording site: kynurenic acid (glutama-tergic antagonist, 2.5 mM) (Ganong et al., 1983; Elmslie and Yoshikami,1985; Schneider and Perl, 1988) or 6-cyano-7-nitroquinoxaline-2,3-dione (CNQX; AMPA/kainate receptor antagonist, 200 �M) (Hunanyanet al., 2012). The effect of each inhibitor was tested in different group ofanimals (n � 3 per group). For each of the inhibitors, two intraspinalinjections (5 �l/each) over 5 min were made at L4 using a Hamiltonsyringe (33 gauge needle). Recording from the spinal cord was performedas described above in the experiment to measure latencies. The effect ofSSA (ISIs of 0, 4, 8, 12, and 16 ms) on spinal responses was tested after theinjection of kynurenic acid. Recordings during this experiment wereconducted at spinal cord level L4, because kynurenic acid blocked neu-rotransmission below this level.
Acute experiments: data analysesResults from baseline, tests, and posttest were calculated as the average offive responses evoked at 0.5 Hz. Comparing averages of single-pulse-induced CAP at baseline, during, and after the ISI testing procedureshowed no significant difference. Therefore, a composite average ofsingle-pulse-induced CAP during baseline was used to test changes dur-ing the perspective intervention protocol. To standardize changes acrossanimals, all sCAP and cCAP were expressed as a percentage change oftheir respective baseline single-pulse-induced CAP. For conditions ofSSA � tsDC and CSA � tsDC, the sCAP and cCAP were expressed in twoways: as a percentage of their single-pulse-induced CAP without tsDCand during tsDC. Similarly, posttest recordings after the repetitive inter-vention protocol were expressed as a percentage of their respective base-line recordings. Statistical analyses were performed using SigmaPlot(SPSS). The differences between groups over time were assessed usingrepeated-measures ANOVA with a Holm–Sidak method post hoc correc-tion for testing differences between results at different time points.
Chronic stimulation experiments (experiment 8)OverviewOne week before surgery, mice were trained to walk over a horizontalladder until a baseline error rate was established (see below). Hemisec-tion injury at spinal cord level T13-L1 was performed on the left side.Three days later, the stimulation delivery system was implanted (Fig. 1A),and mice were randomly assigned to either the control or stimulatedgroup. After implantation, behavioral evaluations were performed atdays 6, 12, 15, 17, 24, and 31. The combined stimulation protocol wasapplied for 4 consecutive days (20 min/session) starting at day 13 afterhemisection injury.
Hemi-transection SCIAnimals were anesthetized under ketamine/xylazine (100/10 mg/kg,i.p.), and a laminectomy was performed to expose the junction of the T13and L1 spinal cord segments. A one-side transverse cut was made with anangled microsurgical probe (Fine Science Tools) to produce hemi-transection (Fig. 2). The wound was sutured closed, and animals wereallowed to recover over a heating pad at 37°C.
Electrode implantation and stimulationMice were anesthetized and placed in a stereotactic frame. Two incisionswere made, one at the skull and another on the thoracolumbar skin. Theskin between the cranium and lower trunk was separated with forceps topass the spinal electrodes underneath the skin from cranium to mid-spine. To improve bonding between dental acrylic and bone, the craniumsurface was cleaned with 30% H2O2. Cranial electrodes were situatedover the hindpaw representation within the left and right motor corticesfrom 0.5 to �1.5 mm from bregma and 0.5 to 1.5 mm from the midline(Franklin and Paxinos, 2007; Tennant et al., 2010). Cranial electrodes
Ahmed • Associative Stimulation Combined with Transpinal DC J. Neurosci., March 13, 2013 • 33(11):4935– 4946 • 4937

were self-tapping stainless steel screws (shaftdiameter, 0.85 mm; length, 4 mm) (Fine Sci-ence Tools). Those screws were attached to fe-male miniature pin connectors (A-M Systems)by 22 gauge wires (Fig. 3A). The two electrodeswere 2.5 mm apart. Relative to bregma, the an-odal electrode was 0.5 mm posterior and 1 mmlateral, and the cathodal electrode was 3 mmposterior and 0.5 mm lateral. Screws were im-planted on the right side of the cranium, whichcovers the motor cortex contralateral to the he-misection injury of the spinal cord. Screwswere attached only to the skull bone and didnot breach the dura, as confirmed by lack offluid leaking from the insertion site and bypostmortem inspection. This electrode mon-tage was chosen because it resembles montagesused to stimulate the motor cortex in humans(Burke et al., 1993; Di Lazzaro et al., 2001;Brocke et al., 2005). A third screw was fastenedinto the frontal bone to stabilize the implant,but it was not attached to the pedestal. Dentalacrylic was used to secure the electrodes andthe pedestal to the skull (Fig. 1C). A stainlesssteel spinal electrode (thickness, 50 �m; width,5 mm; length, 10 mm) was placed on the spinalcolumn covering the injured area and attachedto muscle tissue by suture thread through twoholes made in the electrode. The reference elec-trode (identical to the spinal electrode) wasplaced on the side of the abdomen subcutane-ously and sutured to the skin. Stranded stain-less steel wires (0.25 mm; resistance, 12.5 �;insulation material, nylon) were used to attachthe female pin connector to the spinal and reference electrodes at thepedestal.
Beginning 12 d after implantation, injury � stimulation mice (n � 10)underwent stimulation (20 min/d for 4 consecutive days). Stimulationoccurred in a mouse restraining box (Fig. 3 A, C) via a connector cableattached to the pedestal mounted on the mouse skull. Steady current wasdelivered using a DC stimulator (tsDC was ramped up to be steady at�0.8 mA). Cortical stimulation was performed using PowerLab stimu-lation (ADInstruments), and intensity was adjusted to elicit visiblemovement of the hindlimbs (typically 200 –300 �A; duration, 200 �s).Peripheral stimulation was accomplished using ring electrodes (Fig. 3).Electrodes were brushed with electrode conductive paste, and the anodewas fastened to the right (affected) hindpaw and the cathode to the tail(Fig. 3C). The stimulus to the paw was adjusted to elicit visible limbmovement (1 Hz). In a treatment session, all three stimulations (cortical,peripheral, and tsDC) were synchronized using a customized stimulationprotocol in LabChart software (ADInstruments). Cortical and peripheralstimuli were delivered at 1 Hz and 12 ms ISI. Thus, the cortical stimuluswas delayed by 12 ms relative to peripheral stimuli. Before the cortico-peripheral stimulation started, the tsDC stimulation was ramped up tomaximum of �0.8 mA. All stimulations were continued for 20 min. Afterstimulation, animals were returned to their cages. The injury-onlygroup (n � 7) received the same experimental manipulations exceptthat no stimulation was delivered. The tsDC group (n � 5) receivedtsDC (�0.8 mA) without peripheral or cortical stimulation. Thecortico-peripheral group (n � 4) received cortical and peripheralstimulation but no tsDC.
Behavioral testingOne week before SCI, animals were acclimated to the test environmentand procedures for 30 min/d for 6 d. Animals were behaviorally tested 1 dbefore injury (baseline) and then at days 6, 12, 15, 17, 24, and 31 after SCI.When testing and stimulation were performed on the same day (day 15),testing proceeded stimulation.
Horizontal ladder-walking testThe horizontal ladder-walking test has been shown to be sensitive toplacing impairments of hindlimbs caused by lesions in the corticospinalsystem (Metz and Whishaw, 2002; Carmel et al., 2010). I used a horizon-tal ladder that was made from Plexiglas sidings (1 m long, 5 cm wide)with variable rung spacing (adjusted from 1 to 3 cm; 3 mm rung diame-ter). The procedure was modified from Metz and Whishaw (2002). At thestart, a platform was placed at one end of the ladder. To encourage themice to cross, a bright lamp was placed close to the starting site, and adark box was placed at the other end of the ladder. A different template ofirregular rung spacing was used in every test session to prevent learning,but the same template was used across groups to standardize the diffi-culty of the test. Mice were required to cross the whole length of theladder four times. The time of each run was recorded using a stopwatch.Runs were also video recorded and analyzed in slow motion. An errorwas defined as any miss or slip off the rung. Errors were counted for eachhindlimb and were calculated as a percentage of the total number of stepsduring that trial.
Lesion verificationVertebral columns containing SCI sites were removed and stored over-night in paraformaldehyde (4%). Spinal cords were then carefully dis-sected out, and a 1-cm-long segment containing the injury site was gluedto the base of a Cryomold. Longitudinal sections (30-�m-thick) were cutwith a cryostat, placed sequentially on the glass slides, and stained usingCrystal violet. The extent of damage was evaluated using a light micro-scope (Fig. 2).
ResultsAssociative stimulationThe latency of sCAP recorded from the sciatic nerves has a me-dian of 7 ms (range, 6.00 –7.75 ms), and the latency of cCAPrecorded from the sciatic nerves has a median of 26.75 ms (range,22.25–29.50 ms). Thus, sCAP and cCAP with shorter than min-imal latency were rejected from the analysis to control for current
Figure 2. Lesion verification. A, Nissl staining of a longitudinal section of the dorsal aspect of the spinal cord at the level of thespinal canal and at ventral aspects. Red arrows indicate the injury site. B, A transverse section of the spinal cord constructed fromthe longitudinal slices. Numbers correspond to the photographs shown in A. Note that the lower part of the spinal cord on the injuryside, which mainly contains spinothalamic tracts, was not damaged by the injury. This injury was similar in all animals.
4938 • J. Neurosci., March 13, 2013 • 33(11):4935– 4946 Ahmed • Associative Stimulation Combined with Transpinal DC
spread and ensure that the same site of generation, at either thespinal cord or cortex, was used.
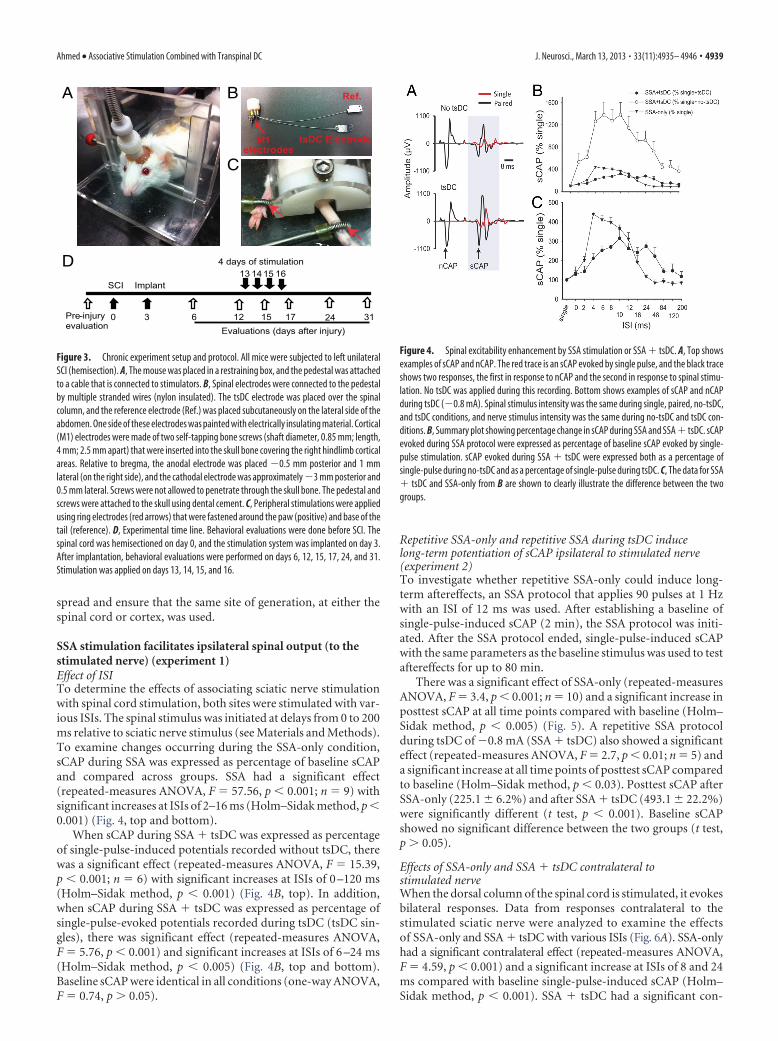
SSA stimulation facilitates ipsilateral spinal output (to thestimulated nerve) (experiment 1)Effect of ISITo determine the effects of associating sciatic nerve stimulationwith spinal cord stimulation, both sites were stimulated with var-ious ISIs. The spinal stimulus was initiated at delays from 0 to 200ms relative to sciatic nerve stimulus (see Materials and Methods).To examine changes occurring during the SSA-only condition,sCAP during SSA was expressed as percentage of baseline sCAPand compared across groups. SSA had a significant effect(repeated-measures ANOVA, F � 57.56, p � 0.001; n � 9) withsignificant increases at ISIs of 2–16 ms (Holm–Sidak method, p �0.001) (Fig. 4, top and bottom).
When sCAP during SSA � tsDC was expressed as percentageof single-pulse-induced potentials recorded without tsDC, therewas a significant effect (repeated-measures ANOVA, F � 15.39,p � 0.001; n � 6) with significant increases at ISIs of 0 –120 ms(Holm–Sidak method, p � 0.001) (Fig. 4B, top). In addition,when sCAP during SSA � tsDC was expressed as percentage ofsingle-pulse-evoked potentials recorded during tsDC (tsDC sin-gles), there was significant effect (repeated-measures ANOVA,F � 5.76, p � 0.001) and significant increases at ISIs of 6 –24 ms(Holm–Sidak method, p � 0.005) (Fig. 4B, top and bottom).Baseline sCAP were identical in all conditions (one-way ANOVA,F � 0.74, p � 0.05).
Repetitive SSA-only and repetitive SSA during tsDC inducelong-term potentiation of sCAP ipsilateral to stimulated nerve(experiment 2)To investigate whether repetitive SSA-only could induce long-term aftereffects, an SSA protocol that applies 90 pulses at 1 Hzwith an ISI of 12 ms was used. After establishing a baseline ofsingle-pulse-induced sCAP (2 min), the SSA protocol was initi-ated. After the SSA protocol ended, single-pulse-induced sCAPwith the same parameters as the baseline stimulus was used to testaftereffects for up to 80 min.
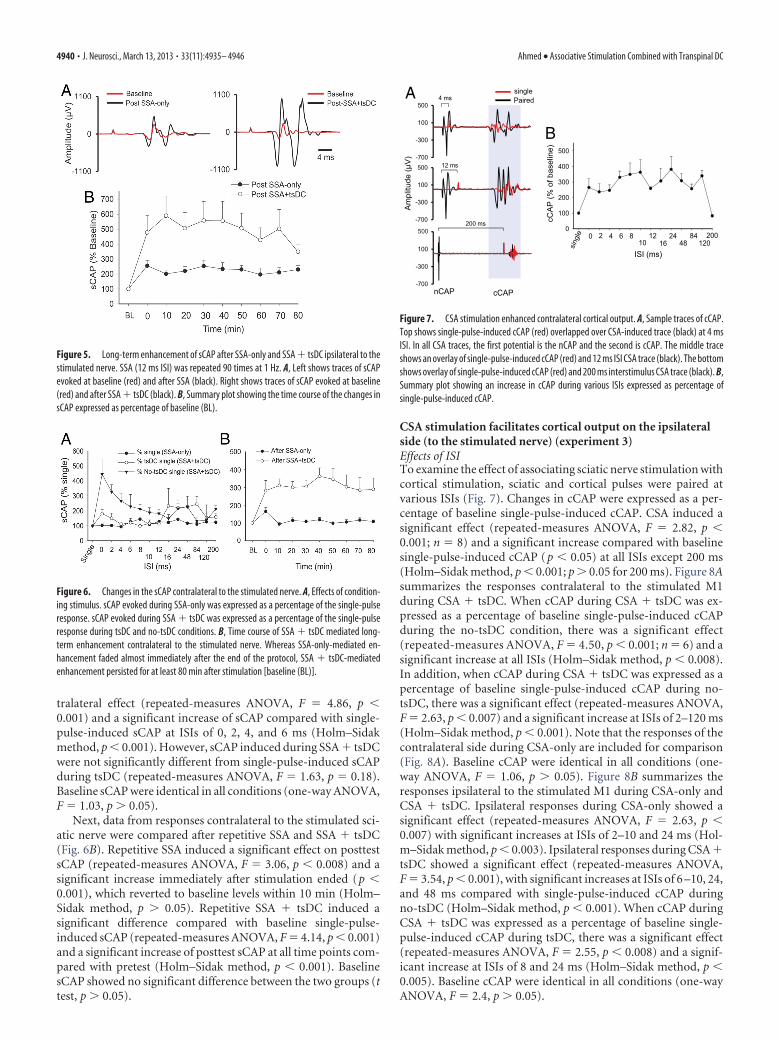
There was a significant effect of SSA-only (repeated-measuresANOVA, F � 3.4, p � 0.001; n � 10) and a significant increase inposttest sCAP at all time points compared with baseline (Holm–Sidak method, p � 0.005) (Fig. 5). A repetitive SSA protocolduring tsDC of �0.8 mA (SSA � tsDC) also showed a significanteffect (repeated-measures ANOVA, F � 2.7, p � 0.01; n � 5) anda significant increase at all time points of posttest sCAP comparedto baseline (Holm–Sidak method, p � 0.03). Posttest sCAP afterSSA-only (225.1 � 6.2%) and after SSA � tsDC (493.1 � 22.2%)were significantly different (t test, p � 0.001). Baseline sCAPshowed no significant difference between the two groups (t test,p � 0.05).
Effects of SSA-only and SSA � tsDC contralateral tostimulated nerveWhen the dorsal column of the spinal cord is stimulated, it evokesbilateral responses. Data from responses contralateral to thestimulated sciatic nerve were analyzed to examine the effectsof SSA-only and SSA � tsDC with various ISIs (Fig. 6A). SSA-onlyhad a significant contralateral effect (repeated-measures ANOVA,F � 4.59, p � 0.001) and a significant increase at ISIs of 8 and 24ms compared with baseline single-pulse-induced sCAP (Holm–Sidak method, p � 0.001). SSA � tsDC had a significant con-
C
A B
D 4 days of stimulation
SCI Implant
3 Pre-injuryevaluation
6 12 15 17 24 31Evaluations (days after injury)
13 1415 16
0
tsDC Electrode
Ref.
M1 electrodes
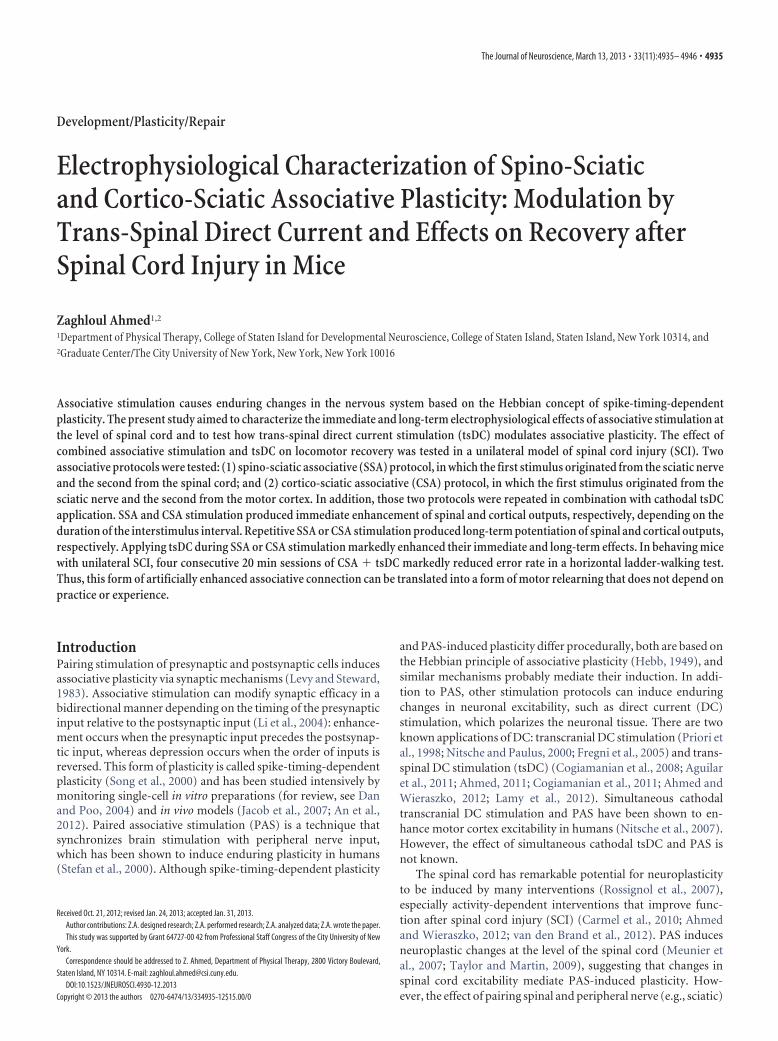
Figure 3. Chronic experiment setup and protocol. All mice were subjected to left unilateralSCI (hemisection). A, The mouse was placed in a restraining box, and the pedestal was attachedto a cable that is connected to stimulators. B, Spinal electrodes were connected to the pedestalby multiple stranded wires (nylon insulated). The tsDC electrode was placed over the spinalcolumn, and the reference electrode (Ref.) was placed subcutaneously on the lateral side of theabdomen. One side of these electrodes was painted with electrically insulating material. Cortical(M1) electrodes were made of two self-tapping bone screws (shaft diameter, 0.85 mm; length,4 mm; 2.5 mm apart) that were inserted into the skull bone covering the right hindlimb corticalareas. Relative to bregma, the anodal electrode was placed �0.5 mm posterior and 1 mmlateral (on the right side), and the cathodal electrode was approximately �3 mm posterior and0.5 mm lateral. Screws were not allowed to penetrate through the skull bone. The pedestal andscrews were attached to the skull using dental cement. C, Peripheral stimulations were appliedusing ring electrodes (red arrows) that were fastened around the paw (positive) and base of thetail (reference). D, Experimental time line. Behavioral evaluations were done before SCI. Thespinal cord was hemisectioned on day 0, and the stimulation system was implanted on day 3.After implantation, behavioral evaluations were performed on days 6, 12, 15, 17, 24, and 31.Stimulation was applied on days 13, 14, 15, and 16.
Figure 4. Spinal excitability enhancement by SSA stimulation or SSA � tsDC. A, Top showsexamples of sCAP and nCAP. The red trace is an sCAP evoked by single pulse, and the black traceshows two responses, the first in response to nCAP and the second in response to spinal stimu-lation. No tsDC was applied during this recording. Bottom shows examples of sCAP and nCAPduring tsDC (�0.8 mA). Spinal stimulus intensity was the same during single, paired, no-tsDC,and tsDC conditions, and nerve stimulus intensity was the same during no-tsDC and tsDC con-ditions. B, Summary plot showing percentage change in sCAP during SSA and SSA � tsDC. sCAPevoked during SSA protocol were expressed as percentage of baseline sCAP evoked by single-pulse stimulation. sCAP evoked during SSA � tsDC were expressed both as a percentage ofsingle-pulse during no-tsDC and as a percentage of single-pulse during tsDC. C, The data for SSA� tsDC and SSA-only from B are shown to clearly illustrate the difference between the twogroups.
Ahmed • Associative Stimulation Combined with Transpinal DC J. Neurosci., March 13, 2013 • 33(11):4935– 4946 • 4939
tralateral effect (repeated-measures ANOVA, F � 4.86, p �0.001) and a significant increase of sCAP compared with single-pulse-induced sCAP at ISIs of 0, 2, 4, and 6 ms (Holm–Sidakmethod, p � 0.001). However, sCAP induced during SSA � tsDCwere not significantly different from single-pulse-induced sCAPduring tsDC (repeated-measures ANOVA, F � 1.63, p � 0.18).Baseline sCAP were identical in all conditions (one-way ANOVA,F � 1.03, p � 0.05).
Next, data from responses contralateral to the stimulated sci-atic nerve were compared after repetitive SSA and SSA � tsDC(Fig. 6B). Repetitive SSA induced a significant effect on posttestsCAP (repeated-measures ANOVA, F � 3.06, p � 0.008) and asignificant increase immediately after stimulation ended (p �0.001), which reverted to baseline levels within 10 min (Holm–Sidak method, p � 0.05). Repetitive SSA � tsDC induced asignificant difference compared with baseline single-pulse-induced sCAP (repeated-measures ANOVA, F � 4.14, p � 0.001)and a significant increase of posttest sCAP at all time points com-pared with pretest (Holm–Sidak method, p � 0.001). BaselinesCAP showed no significant difference between the two groups (ttest, p � 0.05).
CSA stimulation facilitates cortical output on the ipsilateralside (to the stimulated nerve) (experiment 3)Effects of ISITo examine the effect of associating sciatic nerve stimulation withcortical stimulation, sciatic and cortical pulses were paired atvarious ISIs (Fig. 7). Changes in cCAP were expressed as a per-centage of baseline single-pulse-induced cCAP. CSA induced asignificant effect (repeated-measures ANOVA, F � 2.82, p �0.001; n � 8) and a significant increase compared with baselinesingle-pulse-induced cCAP (p � 0.05) at all ISIs except 200 ms(Holm–Sidak method, p � 0.001; p � 0.05 for 200 ms). Figure 8Asummarizes the responses contralateral to the stimulated M1during CSA � tsDC. When cCAP during CSA � tsDC was ex-pressed as a percentage of baseline single-pulse-induced cCAPduring the no-tsDC condition, there was a significant effect(repeated-measures ANOVA, F � 4.50, p � 0.001; n � 6) and asignificant increase at all ISIs (Holm–Sidak method, p � 0.008).In addition, when cCAP during CSA � tsDC was expressed as apercentage of baseline single-pulse-induced cCAP during no-tsDC, there was a significant effect (repeated-measures ANOVA,F � 2.63, p � 0.007) and a significant increase at ISIs of 2–120 ms(Holm–Sidak method, p � 0.001). Note that the responses of thecontralateral side during CSA-only are included for comparison(Fig. 8A). Baseline cCAP were identical in all conditions (one-way ANOVA, F � 1.06, p � 0.05). Figure 8B summarizes theresponses ipsilateral to the stimulated M1 during CSA-only andCSA � tsDC. Ipsilateral responses during CSA-only showed asignificant effect (repeated-measures ANOVA, F � 2.63, p �0.007) with significant increases at ISIs of 2–10 and 24 ms (Hol-m–Sidak method, p � 0.003). Ipsilateral responses during CSA �tsDC showed a significant effect (repeated-measures ANOVA,F � 3.54, p � 0.001), with significant increases at ISIs of 6 –10, 24,and 48 ms compared with single-pulse-induced cCAP duringno-tsDC (Holm–Sidak method, p � 0.001). When cCAP duringCSA � tsDC was expressed as a percentage of baseline single-pulse-induced cCAP during tsDC, there was a significant effect(repeated-measures ANOVA, F � 2.55, p � 0.008) and a signif-icant increase at ISIs of 8 and 24 ms (Holm–Sidak method, p �0.005). Baseline cCAP were identical in all conditions (one-wayANOVA, F � 2.4, p � 0.05).
Figure 5. Long-term enhancement of sCAP after SSA-only and SSA � tsDC ipsilateral to thestimulated nerve. SSA (12 ms ISI) was repeated 90 times at 1 Hz. A, Left shows traces of sCAPevoked at baseline (red) and after SSA (black). Right shows traces of sCAP evoked at baseline(red) and after SSA � tsDC (black). B, Summary plot showing the time course of the changes insCAP expressed as percentage of baseline (BL).
Figure 6. Changes in the sCAP contralateral to the stimulated nerve. A, Effects of condition-ing stimulus. sCAP evoked during SSA-only was expressed as a percentage of the single-pulseresponse. sCAP evoked during SSA � tsDC was expressed as a percentage of the single-pulseresponse during tsDC and no-tsDC conditions. B, Time course of SSA � tsDC mediated long-term enhancement contralateral to the stimulated nerve. Whereas SSA-only-mediated en-hancement faded almost immediately after the end of the protocol, SSA � tsDC-mediatedenhancement persisted for at least 80 min after stimulation [baseline (BL)].
-700
-300
100
500
-700
-300
100
500
0
100
200
300
400
500
-700
-300
100
12 ms
200 ms
4 ms
2 610 16
2448
84120
2000 8 124
cCA
P (%
of b
asel
ine)
B
A
Am
plitu
de (µ
V)
ISI (ms)
nCAP cCAP
singlePaired
500
Figure 7. CSA stimulation enhanced contralateral cortical output. A, Sample traces of cCAP.Top shows single-pulse-induced cCAP (red) overlapped over CSA-induced trace (black) at 4 msISI. In all CSA traces, the first potential is the nCAP and the second is cCAP. The middle traceshows an overlay of single-pulse-induced cCAP (red) and 12 ms ISI CSA trace (black). The bottomshows overlay of single-pulse-induced cCAP (red) and 200 ms interstimulus CSA trace (black). B,Summary plot showing an increase in cCAP during various ISIs expressed as percentage ofsingle-pulse-induced cCAP.
4940 • J. Neurosci., March 13, 2013 • 33(11):4935– 4946 Ahmed • Associative Stimulation Combined with Transpinal DC
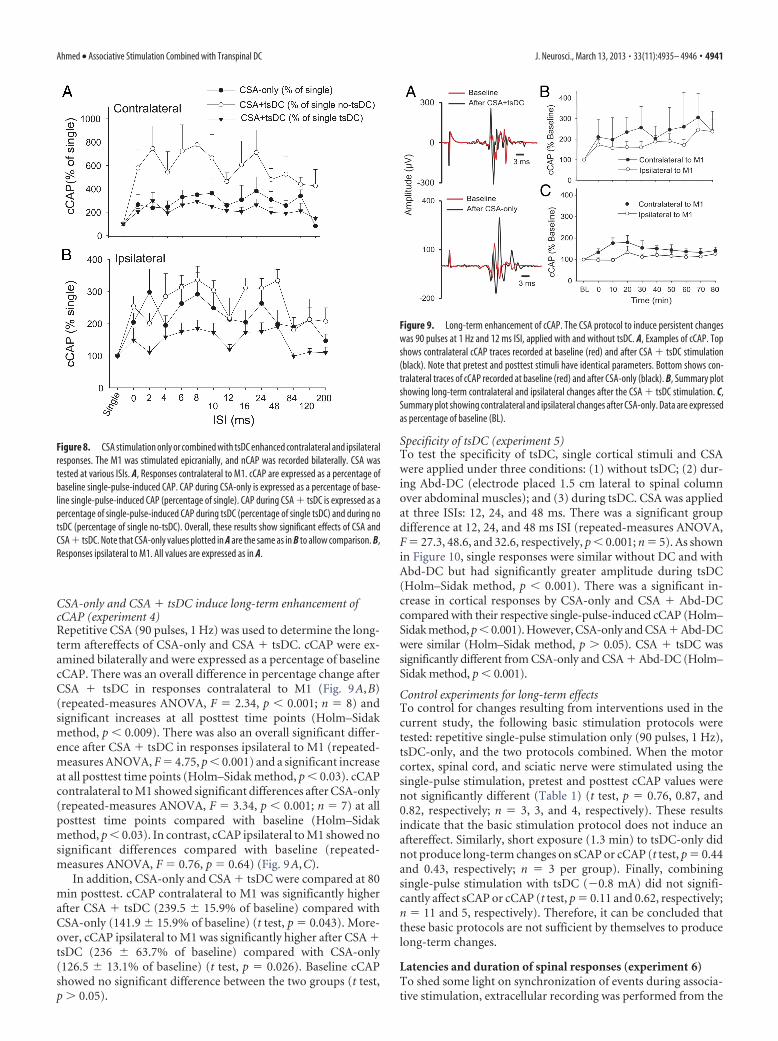
CSA-only and CSA � tsDC induce long-term enhancement ofcCAP (experiment 4)Repetitive CSA (90 pulses, 1 Hz) was used to determine the long-term aftereffects of CSA-only and CSA � tsDC. cCAP were ex-amined bilaterally and were expressed as a percentage of baselinecCAP. There was an overall difference in percentage change afterCSA � tsDC in responses contralateral to M1 (Fig. 9A,B)(repeated-measures ANOVA, F � 2.34, p � 0.001; n � 8) andsignificant increases at all posttest time points (Holm–Sidakmethod, p � 0.009). There was also an overall significant differ-ence after CSA � tsDC in responses ipsilateral to M1 (repeated-measures ANOVA, F � 4.75, p � 0.001) and a significant increaseat all posttest time points (Holm–Sidak method, p � 0.03). cCAPcontralateral to M1 showed significant differences after CSA-only(repeated-measures ANOVA, F � 3.34, p � 0.001; n � 7) at allposttest time points compared with baseline (Holm–Sidakmethod, p � 0.03). In contrast, cCAP ipsilateral to M1 showed nosignificant differences compared with baseline (repeated-measures ANOVA, F � 0.76, p � 0.64) (Fig. 9A,C).
In addition, CSA-only and CSA � tsDC were compared at 80min posttest. cCAP contralateral to M1 was significantly higherafter CSA � tsDC (239.5 � 15.9% of baseline) compared withCSA-only (141.9 � 15.9% of baseline) (t test, p � 0.043). More-over, cCAP ipsilateral to M1 was significantly higher after CSA �tsDC (236 � 63.7% of baseline) compared with CSA-only(126.5 � 13.1% of baseline) (t test, p � 0.026). Baseline cCAPshowed no significant difference between the two groups (t test,p � 0.05).
Specificity of tsDC (experiment 5)To test the specificity of tsDC, single cortical stimuli and CSAwere applied under three conditions: (1) without tsDC; (2) dur-ing Abd-DC (electrode placed 1.5 cm lateral to spinal columnover abdominal muscles); and (3) during tsDC. CSA was appliedat three ISIs: 12, 24, and 48 ms. There was a significant groupdifference at 12, 24, and 48 ms ISI (repeated-measures ANOVA,F � 27.3, 48.6, and 32.6, respectively, p � 0.001; n � 5). As shownin Figure 10, single responses were similar without DC and withAbd-DC but had significantly greater amplitude during tsDC(Holm–Sidak method, p � 0.001). There was a significant in-crease in cortical responses by CSA-only and CSA � Abd-DCcompared with their respective single-pulse-induced cCAP (Holm–Sidak method, p � 0.001). However, CSA-only and CSA � Abd-DCwere similar (Holm–Sidak method, p � 0.05). CSA � tsDC wassignificantly different from CSA-only and CSA � Abd-DC (Holm–Sidak method, p � 0.001).
Control experiments for long-term effectsTo control for changes resulting from interventions used in thecurrent study, the following basic stimulation protocols weretested: repetitive single-pulse stimulation only (90 pulses, 1 Hz),tsDC-only, and the two protocols combined. When the motorcortex, spinal cord, and sciatic nerve were stimulated using thesingle-pulse stimulation, pretest and posttest cCAP values werenot significantly different (Table 1) (t test, p � 0.76, 0.87, and0.82, respectively; n � 3, 3, and 4, respectively). These resultsindicate that the basic stimulation protocol does not induce anaftereffect. Similarly, short exposure (1.3 min) to tsDC-only didnot produce long-term changes on sCAP or cCAP (t test, p � 0.44and 0.43, respectively; n � 3 per group). Finally, combiningsingle-pulse stimulation with tsDC (�0.8 mA) did not signifi-cantly affect sCAP or cCAP (t test, p � 0.11 and 0.62, respectively;n � 11 and 5, respectively). Therefore, it can be concluded thatthese basic protocols are not sufficient by themselves to producelong-term changes.
Latencies and duration of spinal responses (experiment 6)To shed some light on synchronization of events during associa-tive stimulation, extracellular recording was performed from the
Figure 8. CSA stimulation only or combined with tsDC enhanced contralateral and ipsilateralresponses. The M1 was stimulated epicranially, and nCAP was recorded bilaterally. CSA wastested at various ISIs. A, Responses contralateral to M1. cCAP are expressed as a percentage ofbaseline single-pulse-induced CAP. CAP during CSA-only is expressed as a percentage of base-line single-pulse-induced CAP (percentage of single). CAP during CSA � tsDC is expressed as apercentage of single-pulse-induced CAP during tsDC (percentage of single tsDC) and during notsDC (percentage of single no-tsDC). Overall, these results show significant effects of CSA andCSA � tsDC. Note that CSA-only values plotted in A are the same as in B to allow comparison. B,Responses ipsilateral to M1. All values are expressed as in A.
Figure 9. Long-term enhancement of cCAP. The CSA protocol to induce persistent changeswas 90 pulses at 1 Hz and 12 ms ISI, applied with and without tsDC. A, Examples of cCAP. Topshows contralateral cCAP traces recorded at baseline (red) and after CSA � tsDC stimulation(black). Note that pretest and posttest stimuli have identical parameters. Bottom shows con-tralateral traces of cCAP recorded at baseline (red) and after CSA-only (black). B, Summary plotshowing long-term contralateral and ipsilateral changes after the CSA � tsDC stimulation. C,Summary plot showing contralateral and ipsilateral changes after CSA-only. Data are expressedas percentage of baseline (BL).
Ahmed • Associative Stimulation Combined with Transpinal DC J. Neurosci., March 13, 2013 • 33(11):4935– 4946 • 4941

dorsal horn or ventral horn of the L4 spinal cord segment. Stim-ulation of contralateral M1 (1 mm posterior to bregma and 1 mmlateral from midline) produced CAP in the dorsal horn of thespinal cord that included three volleys with latencies at 1.4 �0.05, 2.3 � 0.1, and 4.1 � 0.1 ms. In addition to these threevolleys, another volley with a latency of 9.9 � 0.3 ms was recordedfrom the L4 ventral horn (Fig. 11A). The duration of the firstthree volleys was 6.7 � 0.3 ms, and the duration of the delayedfourth volley was 20.5 � 1.4 ms. These waves show some similar-ity to D- and I-waves characterized by Rothwell et al. (1994).Sciatic stimulation produced CAP recorded from the ventralhorn with two distinct waves with latencies of 0.9 � 0.03 and3.1 � 0.1 ms with a duration of 14.7 � 0.6 ms (Fig. 11B). Spinalcord stimulation at the L1 segment produced CAP recorded fromL4 ventral horn with a latency of 0.6 � 0.1 ms and duration of8.7 � 0.6 ms (Fig. 11C). These findings allow estimation of syn-
chronization between volleys generated by stimulation at differ-ent sites (cortical or spinal and sciatic nerve).
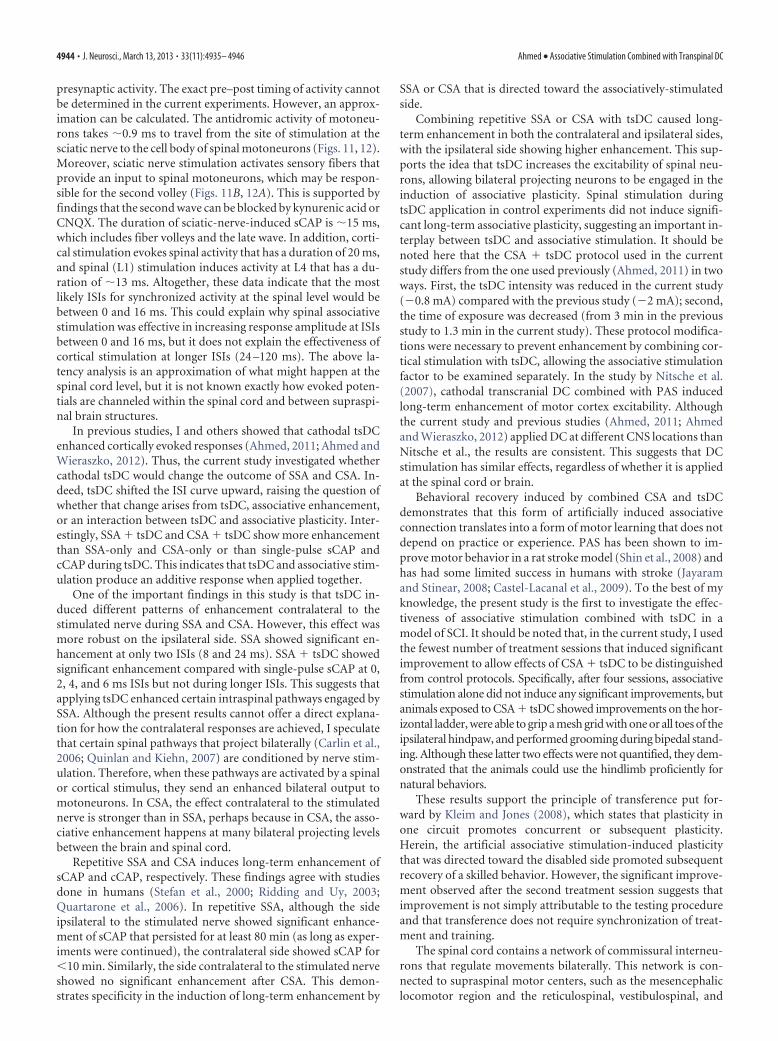
The nature of spinal potentials (experiment 7)To study the nature of spinal potentials and their contributions tothe immediate effects of SSA, two glutamatergic antagonists wereused to block synaptic transmission. Kynurenic acid (nonselec-tive glutamatergic antagonist, 10 �l; 2.5 mM) or CNQX (AMPAreceptor antagonist, 10 �l; 200 �M) was injected to the spinalcord L4 level, and sciatic or spinal stimulation-evoked biphasicpotentials were recorded from the L4 ventral horn area (Fig.12A). Both antagonists completely blocked the second wave ofsciatic or spinal stimulation-induced spinal potential (Fig. 12B).Similarly, both antagonists blocked effects of the SSA protocol onspinally recorded potentials at all of the ISIs (0, 4, 8, 12, 16 ms; Fig.12C,D) (repeated-measures ANOVA, F � 1.5, p � 0.18). Thesedata suggest that glutamatergic synaptic transmission was neces-sary for induction of concurrent associative plasticity in the pres-ent study.
CSA � tsDC improves skilled locomotion afterhemisectioned SCI (experiment 8)Unilateral injury was confirmed to be confined to the left side ofthe spinal cord in each of the animals (Fig. 2). A small portion ofthe ventral column of the spinal cord was not injured, probablybecause the angled microsurgical probe did not reach far enoughto cut the ventral aspect. However, the injury was enough to causesignificant impairment of skilled locomotion.
To test whether combined CSA � tsDC can efficiently restoreskilled locomotion after hemisection SCI, injured mice were im-planted with a stimulation system (see Materials and Methods)
Figure 10. The effect of tsDC is specific. CSA stimulation was performed during tsDC andAbd-DC. CSA was tested at ISIs of 12, 24, and 48 ms. Abd-DC was applied by a DC electrodeplaced on the abdominal muscles 1.5 cm lateral to the lumber spinal column (see Materials andMethods). Five animals were used in these experiments. A, Traces recorded under differentconditions in the same animal. The top shows cCAP recorded under two conditions: without DCand during Abd-DC (�0.8 �A). The middle shows CSA (ISI of 24 ms) without DC (red) andduring Abd-DC (black). The bottom shows responses to a single stimulation of M1 (red) and CSAduring tsDC (�0.8 �A) (black). B, Summary plot showing that CSA at ISI of 12 ms was signifi-cantly increased by tsDC but not Abd-DC. C, Summary plot showing that CSA at ISI of 24 ms wassignificantly increased by tsDC but not Abd-DC. D, Summary plot showing that CSA at ISI of 48ms was significantly increased by tsDC but not Abd-DC. Overall, these findings show that tsDC isspecific in its effect on the spinal cord. *p � 0.001 relative to respective single potential; �p �0.001 relative to without tsDC.
Table 1. Control experiments testing aftereffects of basic protocols
Protocol (evoked CAP)Pretest(�V) (mean � SEM)
Posttest (�V)(mean � SEM)
Significance(paired t test) n
Spinal-only (sCAP) 847.0 � 55.8 880.0 � 188.8 p � 0.81 3Nerve-only (sCAP) 1068.0 � 229.1 1002.1 � 188.6 p � 0.82 4Cortical-only (cCAP) 944.4 � 184.9 979.4 � 82.7 p � 0.76 3tsDC-only (cCAP) 1248.4 � 172.8 1013.8 � 168.1 p � 0.43 3tsDC-only (sCAP) 1295.6 � 250.9 1075.8 � 173.7 p � 0.44 3Spinal � tsDC (sCAP) 686.0 � 174.0 1009.0 � 132.3 p � 0.11 5Cortical � tsDC (cCAP) 1160.4 � 98.7 1214.6 � 98.5 p � 0.62 5
Figure 11. Extracellular responses recorded from L4 level. Insets show the recording sites. A,M1 stimulation. At L4 spinal level, extracellular responses were recorded from dorsal corticospi-nal tract (dCST, left) and from ventral horn (right). Three volleys were recorded from dCST (seeasterisks) with latencies of 1.25, 2.25, and 3.00 ms. Responses recorded from the ventral hornshowed dCST volleys with a delayed response (11 ms). B, Sciatic nerve stimulation. At the L4spinal level, extracellular recording showed two main responses (marked with asterisks), a fastfirst response with 0.8 ms latency and a delayed second response with 2.6 ms latency. C, Spinalcord stimulation. The spinal cord was stimulated at the level of L1, and recording was obtainedfrom the L4 ventral horn, which showed an onset latency of 1 ms. Arrow marks the deflectioncaused by stimulus artifact. Asterisks mark the two spinal responses.
4942 • J. Neurosci., March 13, 2013 • 33(11):4935– 4946 Ahmed • Associative Stimulation Combined with Transpinal DC
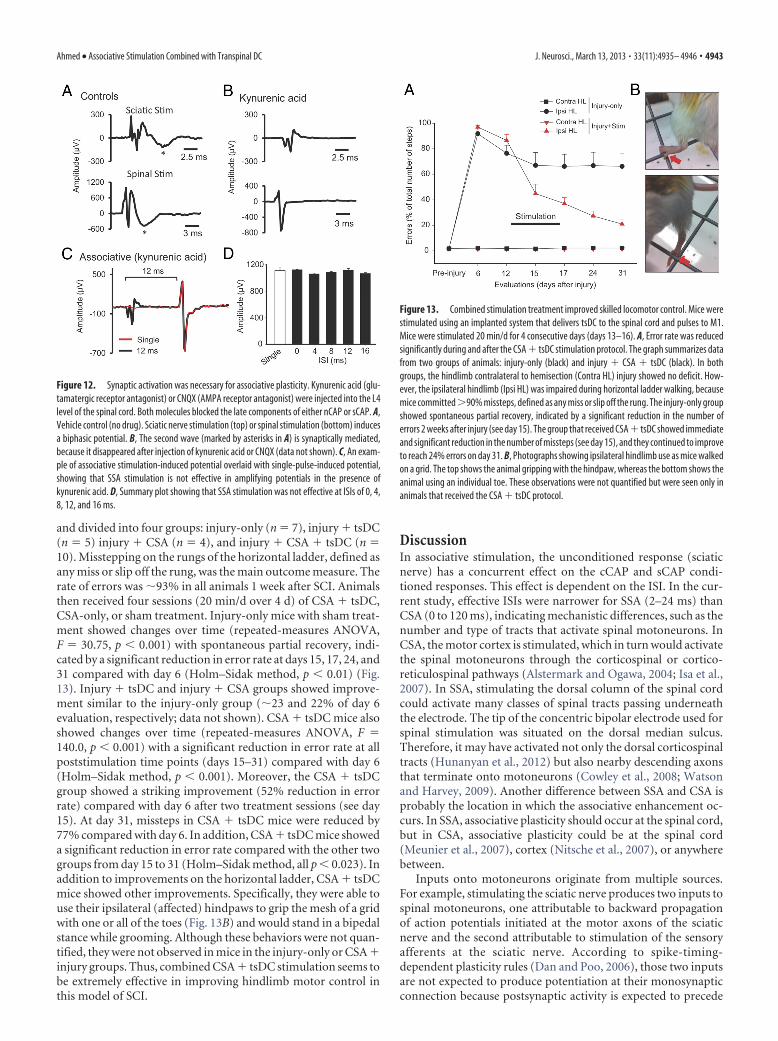
and divided into four groups: injury-only (n � 7), injury � tsDC(n � 5) injury � CSA (n � 4), and injury � CSA � tsDC (n �10). Misstepping on the rungs of the horizontal ladder, defined asany miss or slip off the rung, was the main outcome measure. Therate of errors was �93% in all animals 1 week after SCI. Animalsthen received four sessions (20 min/d over 4 d) of CSA � tsDC,CSA-only, or sham treatment. Injury-only mice with sham treat-ment showed changes over time (repeated-measures ANOVA,F � 30.75, p � 0.001) with spontaneous partial recovery, indi-cated by a significant reduction in error rate at days 15, 17, 24, and31 compared with day 6 (Holm–Sidak method, p � 0.01) (Fig.13). Injury � tsDC and injury � CSA groups showed improve-ment similar to the injury-only group (�23 and 22% of day 6evaluation, respectively; data not shown). CSA � tsDC mice alsoshowed changes over time (repeated-measures ANOVA, F �140.0, p � 0.001) with a significant reduction in error rate at allpoststimulation time points (days 15–31) compared with day 6(Holm–Sidak method, p � 0.001). Moreover, the CSA � tsDCgroup showed a striking improvement (52% reduction in errorrate) compared with day 6 after two treatment sessions (see day15). At day 31, missteps in CSA � tsDC mice were reduced by77% compared with day 6. In addition, CSA � tsDC mice showeda significant reduction in error rate compared with the other twogroups from day 15 to 31 (Holm–Sidak method, all p � 0.023). Inaddition to improvements on the horizontal ladder, CSA � tsDCmice showed other improvements. Specifically, they were able touse their ipsilateral (affected) hindpaws to grip the mesh of a gridwith one or all of the toes (Fig. 13B) and would stand in a bipedalstance while grooming. Although these behaviors were not quan-tified, they were not observed in mice in the injury-only or CSA �injury groups. Thus, combined CSA � tsDC stimulation seems tobe extremely effective in improving hindlimb motor control inthis model of SCI.
DiscussionIn associative stimulation, the unconditioned response (sciaticnerve) has a concurrent effect on the cCAP and sCAP condi-tioned responses. This effect is dependent on the ISI. In the cur-rent study, effective ISIs were narrower for SSA (2–24 ms) thanCSA (0 to 120 ms), indicating mechanistic differences, such as thenumber and type of tracts that activate spinal motoneurons. InCSA, the motor cortex is stimulated, which in turn would activatethe spinal motoneurons through the corticospinal or cortico-reticulospinal pathways (Alstermark and Ogawa, 2004; Isa et al.,2007). In SSA, stimulating the dorsal column of the spinal cordcould activate many classes of spinal tracts passing underneaththe electrode. The tip of the concentric bipolar electrode used forspinal stimulation was situated on the dorsal median sulcus.Therefore, it may have activated not only the dorsal corticospinaltracts (Hunanyan et al., 2012) but also nearby descending axonsthat terminate onto motoneurons (Cowley et al., 2008; Watsonand Harvey, 2009). Another difference between SSA and CSA isprobably the location in which the associative enhancement oc-curs. In SSA, associative plasticity should occur at the spinal cord,but in CSA, associative plasticity could be at the spinal cord(Meunier et al., 2007), cortex (Nitsche et al., 2007), or anywherebetween.
Inputs onto motoneurons originate from multiple sources.For example, stimulating the sciatic nerve produces two inputs tospinal motoneurons, one attributable to backward propagationof action potentials initiated at the motor axons of the sciaticnerve and the second attributable to stimulation of the sensoryafferents at the sciatic nerve. According to spike-timing-dependent plasticity rules (Dan and Poo, 2006), those two inputsare not expected to produce potentiation at their monosynapticconnection because postsynaptic activity is expected to precede
Figure 12. Synaptic activation was necessary for associative plasticity. Kynurenic acid (glu-tamatergic receptor antagonist) or CNQX (AMPA receptor antagonist) were injected into the L4level of the spinal cord. Both molecules blocked the late components of either nCAP or sCAP. A,Vehicle control (no drug). Sciatic nerve stimulation (top) or spinal stimulation (bottom) inducesa biphasic potential. B, The second wave (marked by asterisks in A) is synaptically mediated,because it disappeared after injection of kynurenic acid or CNQX (data not shown). C, An exam-ple of associative stimulation-induced potential overlaid with single-pulse-induced potential,showing that SSA stimulation is not effective in amplifying potentials in the presence ofkynurenic acid. D, Summary plot showing that SSA stimulation was not effective at ISIs of 0, 4,8, 12, and 16 ms.
Figure 13. Combined stimulation treatment improved skilled locomotor control. Mice werestimulated using an implanted system that delivers tsDC to the spinal cord and pulses to M1.Mice were stimulated 20 min/d for 4 consecutive days (days 13–16). A, Error rate was reducedsignificantly during and after the CSA � tsDC stimulation protocol. The graph summarizes datafrom two groups of animals: injury-only (black) and injury � CSA � tsDC (black). In bothgroups, the hindlimb contralateral to hemisection (Contra HL) injury showed no deficit. How-ever, the ipsilateral hindlimb (Ipsi HL) was impaired during horizontal ladder walking, becausemice committed �90% missteps, defined as any miss or slip off the rung. The injury-only groupshowed spontaneous partial recovery, indicated by a significant reduction in the number oferrors 2 weeks after injury (see day 15). The group that received CSA � tsDC showed immediateand significant reduction in the number of missteps (see day 15), and they continued to improveto reach 24% errors on day 31. B, Photographs showing ipsilateral hindlimb use as mice walkedon a grid. The top shows the animal gripping with the hindpaw, whereas the bottom shows theanimal using an individual toe. These observations were not quantified but were seen only inanimals that received the CSA � tsDC protocol.
Ahmed • Associative Stimulation Combined with Transpinal DC J. Neurosci., March 13, 2013 • 33(11):4935– 4946 • 4943
presynaptic activity. The exact pre–post timing of activity cannotbe determined in the current experiments. However, an approx-imation can be calculated. The antidromic activity of motoneu-rons takes �0.9 ms to travel from the site of stimulation at thesciatic nerve to the cell body of spinal motoneurons (Figs. 11, 12).Moreover, sciatic nerve stimulation activates sensory fibers thatprovide an input to spinal motoneurons, which may be respon-sible for the second volley (Figs. 11B, 12A). This is supported byfindings that the second wave can be blocked by kynurenic acid orCNQX. The duration of sciatic-nerve-induced sCAP is �15 ms,which includes fiber volleys and the late wave. In addition, corti-cal stimulation evokes spinal activity that has a duration of 20 ms,and spinal (L1) stimulation induces activity at L4 that has a du-ration of �13 ms. Altogether, these data indicate that the mostlikely ISIs for synchronized activity at the spinal level would bebetween 0 and 16 ms. This could explain why spinal associativestimulation was effective in increasing response amplitude at ISIsbetween 0 and 16 ms, but it does not explain the effectiveness ofcortical stimulation at longer ISIs (24 –120 ms). The above la-tency analysis is an approximation of what might happen at thespinal cord level, but it is not known exactly how evoked poten-tials are channeled within the spinal cord and between supraspi-nal brain structures.
In previous studies, I and others showed that cathodal tsDCenhanced cortically evoked responses (Ahmed, 2011; Ahmed andWieraszko, 2012). Thus, the current study investigated whethercathodal tsDC would change the outcome of SSA and CSA. In-deed, tsDC shifted the ISI curve upward, raising the question ofwhether that change arises from tsDC, associative enhancement,or an interaction between tsDC and associative plasticity. Inter-estingly, SSA � tsDC and CSA � tsDC show more enhancementthan SSA-only and CSA-only or than single-pulse sCAP andcCAP during tsDC. This indicates that tsDC and associative stim-ulation produce an additive response when applied together.
One of the important findings in this study is that tsDC in-duced different patterns of enhancement contralateral to thestimulated nerve during SSA and CSA. However, this effect wasmore robust on the ipsilateral side. SSA showed significant en-hancement at only two ISIs (8 and 24 ms). SSA � tsDC showedsignificant enhancement compared with single-pulse sCAP at 0,2, 4, and 6 ms ISIs but not during longer ISIs. This suggests thatapplying tsDC enhanced certain intraspinal pathways engaged bySSA. Although the present results cannot offer a direct explana-tion for how the contralateral responses are achieved, I speculatethat certain spinal pathways that project bilaterally (Carlin et al.,2006; Quinlan and Kiehn, 2007) are conditioned by nerve stim-ulation. Therefore, when these pathways are activated by a spinalor cortical stimulus, they send an enhanced bilateral output tomotoneurons. In CSA, the effect contralateral to the stimulatednerve is stronger than in SSA, perhaps because in CSA, the asso-ciative enhancement happens at many bilateral projecting levelsbetween the brain and spinal cord.
Repetitive SSA and CSA induces long-term enhancement ofsCAP and cCAP, respectively. These findings agree with studiesdone in humans (Stefan et al., 2000; Ridding and Uy, 2003;Quartarone et al., 2006). In repetitive SSA, although the sideipsilateral to the stimulated nerve showed significant enhance-ment of sCAP that persisted for at least 80 min (as long as exper-iments were continued), the contralateral side showed sCAP for�10 min. Similarly, the side contralateral to the stimulated nerveshowed no significant enhancement after CSA. This demon-strates specificity in the induction of long-term enhancement by
SSA or CSA that is directed toward the associatively-stimulatedside.
Combining repetitive SSA or CSA with tsDC caused long-term enhancement in both the contralateral and ipsilateral sides,with the ipsilateral side showing higher enhancement. This sup-ports the idea that tsDC increases the excitability of spinal neu-rons, allowing bilateral projecting neurons to be engaged in theinduction of associative plasticity. Spinal stimulation duringtsDC application in control experiments did not induce signifi-cant long-term associative plasticity, suggesting an important in-terplay between tsDC and associative stimulation. It should benoted here that the CSA � tsDC protocol used in the currentstudy differs from the one used previously (Ahmed, 2011) in twoways. First, the tsDC intensity was reduced in the current study(�0.8 mA) compared with the previous study (�2 mA); second,the time of exposure was decreased (from 3 min in the previousstudy to 1.3 min in the current study). These protocol modifica-tions were necessary to prevent enhancement by combining cor-tical stimulation with tsDC, allowing the associative stimulationfactor to be examined separately. In the study by Nitsche et al.(2007), cathodal transcranial DC combined with PAS inducedlong-term enhancement of motor cortex excitability. Althoughthe current study and previous studies (Ahmed, 2011; Ahmedand Wieraszko, 2012) applied DC at different CNS locations thanNitsche et al., the results are consistent. This suggests that DCstimulation has similar effects, regardless of whether it is appliedat the spinal cord or brain.
Behavioral recovery induced by combined CSA and tsDCdemonstrates that this form of artificially induced associativeconnection translates into a form of motor learning that does notdepend on practice or experience. PAS has been shown to im-prove motor behavior in a rat stroke model (Shin et al., 2008) andhas had some limited success in humans with stroke (Jayaramand Stinear, 2008; Castel-Lacanal et al., 2009). To the best of myknowledge, the present study is the first to investigate the effec-tiveness of associative stimulation combined with tsDC in amodel of SCI. It should be noted that, in the current study, I usedthe fewest number of treatment sessions that induced significantimprovement to allow effects of CSA � tsDC to be distinguishedfrom control protocols. Specifically, after four sessions, associativestimulation alone did not induce any significant improvements, butanimals exposed to CSA � tsDC showed improvements on the hor-izontal ladder, were able to grip a mesh grid with one or all toes of theipsilateral hindpaw, and performed grooming during bipedal stand-ing. Although these latter two effects were not quantified, they dem-onstrated that the animals could use the hindlimb proficiently fornatural behaviors.
These results support the principle of transference put for-ward by Kleim and Jones (2008), which states that plasticity inone circuit promotes concurrent or subsequent plasticity.Herein, the artificial associative stimulation-induced plasticitythat was directed toward the disabled side promoted subsequentrecovery of a skilled behavior. However, the significant improve-ment observed after the second treatment session suggests thatimprovement is not simply attributable to the testing procedureand that transference does not require synchronization of treat-ment and training.
The spinal cord contains a network of commissural interneu-rons that regulate movements bilaterally. This network is con-nected to supraspinal motor centers, such as the mesencephaliclocomotor region and the reticulospinal, vestibulospinal, and
4944 • J. Neurosci., March 13, 2013 • 33(11):4935– 4946 Ahmed • Associative Stimulation Combined with Transpinal DC

contralateral and ipsilateral corticospinal systems (Jankowska,2008). Therefore, in the current study, the most obvious mecha-nism by which behavioral improvement could occur is directstrengthening by tsDC � PAS of spared or newly sprouted de-scending motor connections contralateral to the injury. In addi-tion, sensory information from the limb plays a vital role inmaintaining postural control during locomotion and modifiesongoing gait patterns (Thibaudier and Hurteau, 2012). Interrup-tion or loss of proprioceptive information from limbs disruptsgait (Sudarsky and Ronthal, 1983; Ferrell et al., 1985). BecausetsDC was shown to strengthen the sensory pathway responses(Aguilar et al., 2011), strengthening the descending pathwaycould also contribute to the improvements observed in animalsin the current study.
ReferencesAguilar J, Pulecchi F, Dilena R, Oliviero A, Priori A, Foffani G (2011)
Spinal direct current stimulation modulates the activity of gracile nu-cleus and primary somatosensory cortex in anesthetized rats. J Physiol589:4981– 4996. CrossRef Medline
Ahmed Z (2011) Trans-spinal direct current stimulation modulates mo-tor cortex-induced muscle contraction in mice. J Appl Physiol 110:1414 –1424. CrossRef Medline
Ahmed Z, Wieraszko A (2012) Trans-spinal direct current enhances corti-cospinal output and stimulation-evoked release of glutamate analog,D-2,3-(3)H-aspartic acid. J Appl Physiol 112:1576 –1592. CrossRefMedline
Alstermark B, Ogawa J (2004) In vivo recordings of bulbospinal excitationin adult mouse forelimb motoneurons. J Neurophysiol 92:1958 –1962.CrossRef Medline
An S, Yang JW, Sun H, Kilb W, Luhmann HJ (2012) Long-term potentia-tion in the neonatal rat barrel cortex in vivo. J Neurosci 32:9511–9516.CrossRef Medline
Brocke J, Irlbacher K, Hauptmann B, Voss M, Brandt SA (2005) Transcra-nial magnetic and electrical stimulation compared: does TES activate in-tracortical neuronal circuits? Clin Neurophysiol 116:2748 –2756.CrossRef Medline
Burke D, Hicks R, Gandevia SC, Stephen J, Woodforth I, Crawford M (1993)Direct comparison of corticospinal volleys in human subjects to transcra-nial magnetic and electrical stimulation. J Physiol 470:383–393. Medline
Carlin KP, Dai Y, Jordan LM (2006) Cholinergic and serotonergic excita-tion of ascending commissural neurons in the thoraco-lumbar spinalcord of the neonatal mouse. J Neurophysiol 95:1278 –1284. Medline
Carmel JB, Berrol LJ, Brus-Ramer M, Martin JH (2010) Chronic electricalstimulation of the intact corticospinal system after unilateral injury re-stores skilled locomotor control and promotes spinal axon outgrowth.J Neurosci 30:10918 –10926. CrossRef Medline
Castel-Lacanal E, Marque P, Tardy J, de Boissezon X, Guiraud V, Chollet F,Loubinoux I, Moreau MS (2009) Induction of cortical plastic changes inwrist muscles by paired associative stimulation in the recovery phase ofstroke patients. Neurorehabil Neural Repair 23:366 –372. CrossRefMedline
Cogiamanian F, Vergari M, Pulecchi F, Marceglia S, Priori A (2008) Effect ofspinal transcutaneous direct current stimulation on somatosensoryevoked potentials in humans. Clin Neurophysiol 119:2636 –2640.CrossRef Medline
Cogiamanian F, Vergari M, Schiaffi E, Marceglia S, Ardolino G, Barbieri S,Priori A (2011) Transcutaneous spinal cord direct current stimulationinhibits the lower limb nociceptive flexion reflex in human beings. Pain152:370 –375. CrossRef Medline
Cowley KC, Zaporozhets E, Schmidt BJ (2008) Propriospinal neurons aresufficient for bulbospinal transmission of the locomotor command signalin the neonatal rat spinal cord. J Physiol 586:1623–1635. CrossRefMedline
Dan Y, Poo MM (2004) Spike timing-dependent plasticity of neural cir-cuits. Neuron 44:23–30. CrossRef Medline
Dan Y, Poo MM (2006) Spike timing-dependent plasticity: from synapse toperception. Physiol Rev 86:1033–1048. CrossRef Medline
Di Lazzaro V, Oliviero A, Profice P, Meglio M, Cioni B, Tonali P, Rothwell JC(2001) Descending spinal cord volleys evoked by transcranial magnetic
and electrical stimulation of the motor cortex leg area in conscious hu-mans. J Physiol 537:1047–1058. CrossRef Medline
Elmslie KS, Yoshikami D (1985) Effects of kynurenate on root potentialsevoked by synaptic activity and amino acids in the frog spinal cord. BrainRes 330:265–272. CrossRef Medline
Ferrell WR, Baxendale RH, Carnachan C, Hart IK (1985) The influence ofjoint afferent discharge on locomotion, proprioception and activity inconscious cats. Brain Res 347:41– 48. CrossRef Medline
Fregni F, Boggio PS, Nitsche M, Pascual-Leone A (2005) Transcranial directcurrent stimulation. Br J Psychiatry 186:446 – 447. CrossRef Medline
Franklin K, Paxinos G (2007) The mouse brain in stereotaxic coordinates,3rd edition. San Diego: Academic.
Ganong AH, Lanthorn TH, Cotman CW (1983) Kynurenic acid inhibitssynaptic and acidic amino acid-induced responses in the rat hippocampusand spinal cord. Brain Res 273:170 –174. CrossRef Medline
Hebb DO (1949) The organization of behavior: a neuropsychological the-ory. New York: Wiley.
Hunanyan AS, Petrosyan HA, Alessi V, Arvanian VL (2012) Repetitivespinal electromagnetic stimulation opens a window of synaptic plas-ticity in damaged spinal cord: role of NMDA receptors. J Neurophysiol107:3027–3039. CrossRef Medline
Isa T, Ohki Y, Alstermark B, Pettersson LG, Sasaki S (2007) Direct andindirect cortico-motoneuronal pathways and control of hand/arm move-ments. Physiology (Bethesda) 22:145–152. CrossRef Medline
Jacob V, Brasier DJ, Erchova I, Feldman D, Shulz DE (2007) Spike timing-dependent synaptic depression in the in vivo barrel cortex of the rat.J Neurosci 27:1271–1284. CrossRef Medline
Jankowska E (2008) Spinal interneuronal networks in the cat: elementarycomponents. Brain Res Rev 57:46 –55. CrossRef Medline
Jayaram G, Stinear JW (2008) Contralesional paired associative stimulationincreases paretic lower limb motor excitability post-stroke. Exp Brain Res185:563–570. CrossRef Medline
Kleim JA, Jones TA (2008) Principles of experience-dependent neural plas-ticity: implications for rehabilitation after brain damage. J Speech LangHear Res 51:S225–S239. CrossRef Medline
Kobbert C, Thanos S (2000) Topographic representation of the sciatic nervemotor neurons in the spinal cord of the adult rat correlates to region-specific activation patterns of microglia. J Neurocytol 29:271–283.CrossRef Medline
Lamy JC, Ho C, Badel A, Arrigo RT, Boakye M (2012) Modulation of soleusH reflex by spinal DC stimulation in humans. J Neurophysiol 108:906 –914. CrossRef Medline
Levy WB, Steward O (1983) Temporal contiguity requirements for long-term associative potentiation/depression in the hippocampus. Neurosci-ence 8:791–797. CrossRef Medline
Li CY, Lu JT, Wu CP, Duan SM, Poo MM (2004) Bidirectional modificationof presynaptic neuronal excitability accompanying spike timing-dependent synaptic plasticity. Neuron 41:257–268. CrossRef Medline
Metz GA, Whishaw IQ (2002) Cortical and subcortical lesions impairskilled walking in the ladder rung walking test: a new task to evaluate fore-and hindlimb stepping, placing, and co-ordination. J Neurosci Methods115:169 –179. CrossRef Medline
Meunier S, Russmann H, Simonetta-Moreau M, Hallett M (2007) Changesin spinal excitability after PAS. J Neurophysiol 97:3131–3135. CrossRefMedline
Nitsche MA, Paulus W (2000) Excitability changes induced in the humanmotor cortex by weak transcranial direct current stimulation. J Physiol527:633– 639. CrossRef Medline
Nitsche MA, Roth A, Kuo MF, Fischer AK, Liebetanz D, Lang N, Tergau F,Paulus W (2007) Timing-dependent modulation of associative plastic-ity by general network excitability in the human motor cortex. J Neurosci27:3807–3812. CrossRef Medline
Priori A, Berardelli A, Rona S, Accornero N, Manfredi M (1998) Polariza-tion of the human motor cortex through the scalp. Neuroreport 9:2257–2260. CrossRef Medline
Quartarone A, Rizzo V, Bagnato S, Morgante F, Sant’Angelo A, Girlanda P,Siebner HR (2006) Rapid-rate paired associative stimulation of the me-dian nerve and motor cortex can produce long-lasting changes in motorcortical excitability in humans. J Physiol 575:657– 670. CrossRef Medline
Quinlan KA, Kiehn O (2007) Segmental, synaptic actions of commissuralinterneurons in the mouse spinal cord. J Neurosci 27:6521– 6530.CrossRef Medline
Ahmed • Associative Stimulation Combined with Transpinal DC J. Neurosci., March 13, 2013 • 33(11):4935– 4946 • 4945
Ridding MC, Uy J (2003) Changes in motor cortical excitability induced bypaired associative stimulation. Clin Neurophysiol 114:1437–1444.CrossRef Medline
Rossignol S, Schwab M, Schwartz M, Fehlings MG (2007) Spinal cord in-jury: time to move? J Neurosci 27:11782–11792. CrossRef Medline
Rothwell J, Burke D, Hicks R, Stephen J, Woodforth I, Crawford M (1994)Transcranial electrical stimulation of the motor cortex in man: furtherevidence for the site of activation. J Physiol 481:243–250. Medline
Schneider SP, Perl ER (1988) Comparison of primary afferent and gluta-mate excitation of neurons in the mammalian spinal dorsal horn. J Neu-rosci 8:2062–2073. Medline
Shin HI, Han TR, Paik NJ (2008) Effect of consecutive application of pairedassociative stimulation on motor recovery in a rat stroke model: a prelim-inary study. Int J Neurosci 118:807– 820. CrossRef Medline
Song S, Miller KD, Abbott LF (2000) Competitive Hebbian learning throughspike-timing-dependent synaptic plasticity. Nat Neurosci 3:919–926.CrossRef Medline
Stefan K, Kunesch E, Cohen LG, Benecke R, Classen J (2000) Induction ofplasticity in the human motor cortex by paired associative stimulation.Brain 123:572–584. CrossRef Medline
Sudarsky L, Ronthal M (1983) Gait disorders among elderly patients. A sur-vey study of 50 patients. Arch Neurol 40:740 –743. CrossRef Medline
Taylor JL, Martin PG (2009) Voluntary motor output is altered by spike-timing-dependent changes in the human corticospinal pathway. J Neuro-sci 29:11708 –11716. CrossRef Medline
Tennant KA, Adkins DL, Donlan NA, Asay AL, Thomas N, Kleim JA, JonesTA (2010) The organization of the forelimb representation of theC57BL/6 mouse motor cortex as defined by intracortical microstimula-tion and cytoarchitecture. Cereb Cortex 21:865– 876. CrossRef Medline
Thibaudier Y, Hurteau MF (2012) Sensory regulation of quadrupedal loco-motion: a top-down or bottom-up control system? J Neurophysiol 108:709 –711. CrossRef Medline
van den Brand R, Heutschi J, Barraud Q, DiGiovanna J, Bartholdi K, Huerlimann M,Friedli L, Vollenweider I, Moraud EM, Duis S, Dominici N, Micera S, MusienkoP, Courtine G (2012) Restoring voluntary control of locomotion after paralyz-ing spinal cord injury. Science 336:1182–1185. CrossRef Medline
Watson C, Harvey AR (2009) Projections from the brain to the spinal cord.In: The spinal cord (Watson C, Paxinos G, Kayalioglu G, eds), pp 168 –179. San Diego: Academic.
Watson C, Paxinos G, Kayalioglu G, Heise C (2009) Atlas of the mousespinal cord. In: The spinal cord (Watson C, Paxinos G, Kayalioglu G, eds),pp 308 –379. San Diego: Academic.
4946 • J. Neurosci., March 13, 2013 • 33(11):4935– 4946 Ahmed • Associative Stimulation Combined with Transpinal DC