electroscience laboratory 1 e. k. walton*(1), t-h lee(1), g. paynter(1), j. snow(2), and c....
TRANSCRIPT

1
ElectroScience Laboratory
E. K. Walton*(1), T-H Lee(1), G. Paynter(1),
J. Snow(2), and C. Buxton(3)
(1) The Ohio State University, Columbus, OH
(2) Naval Surf. Weapons Ctr., Crane Div.(3) FBI Academy, Quantico, VA
APS MEETING 11 - 15 JUNE 2007
Development of a Hemispherical Near Field Antenna Measurement Range
for use on a Realistic Ground

ElectroScience Laboratory
2
SUMMARY / INTRODUCTION
•BUILD A NEAR FIELD ANTENNA MEASUREMENT RANGE OPTIMIZED FOR GROUND VEHICLES
•Hemispherical scanning system•Over a realistic roadway/ground surface.
•THE CHAMBER•12.2 m high by 17.7 m wide by 21.3 m long•Absorber covered walls and ceiling•Concrete floor over damp sand pit•VHF to S-band.
NF RANGE WITH REALISTIC GROUND

ElectroScience Laboratory
3
NF RANGE WITH REALISTIC GROUND
•Normal spherical mode expansion techniques will not work in such an environment.• So … A plane wave synthesis algorithm will be used along with an “outside the sphere” ground reflection term.
H-FRAME(no turntable)
12.2 m high by 17.7 m wide by 21.3 m long

ElectroScience Laboratory
4
HISTORY:HISTORY:
• Probe corrected near-field scanning on a spherical surface was first solved in 1970 by Jensen in a doctoral dissertation at Technical University of Denmark.
• Much of the history of near field scanning and transformation development is given in a 1988 special issue of the IEEE AP-S Transactions (V. 36, No. 6, June 1988).
GROUND REFLECTIONS IN NF MEASUREMENTSGROUND REFLECTIONS IN NF MEASUREMENTS

ElectroScience Laboratory
5
Radius = 4 m; Freq. = 0.7 GHz
NF RANGE WITH REALISTIC GROUND – YR 1

ElectroScience Laboratory
6
GROUND REFLECTIONS IN NF MEASUREMENTSGROUND REFLECTIONS IN NF MEASUREMENTS
Transformation SoftwareTransformation Software
•The classical method of transforming from the near field to the far field consists of taking advantage of the efficiency of the Fourier transform.•The data are transformed into a spectrum of plane waves in the geometrical system to be used.
•plane wave spectral components; •cylindrical wave components•spherical waves
•But we have a problem because we can only scan the upper hemisphere and the ground surface is penetrable.
YR-1

ElectroScience Laboratory
7
GROUND REFLECTIONS IN NF MEASUREMENTSGROUND REFLECTIONS IN NF MEASUREMENTS
RAY PATHS
PROPAGATION TO FAR FIELD
YR-1
RAY PATHS TO USE IN SYNTHESIS
……

ElectroScience Laboratory
8
Radius = 3 m; Freq. = 0.7 GHz
NF RANGE WITH REALISTIC GROUND YR-1
Early results, note various mechanisms.

ElectroScience Laboratory
9
ARM INTERACTION3-Element X-Directed Dipole Array
Element Spacing: 0.29 Excitations: (0.5,104.4o),(1.04,0.0o),(0.5,-104.4o)
Phi = 0 Degree Cut, Er ComponentFrequency = 150 MHz, Dipole Length=1.1m, Center Element Height=28'
Theta (Degrees)
-90 -75 -60 -45 -30 -15 0 15 30 45 60 75 90
Nea
r F
ield
Pat
tern
(dB
)
-70
-65
-60
-55
-50
-45
-40
-35
-30
-25
-20
-15
-10
Er, Dipole OnlyEr, Scattered Field
3-Element X-Directed Dipole ArrayElement Spacing: 0.29
Excitations: (0.5,104.4o),(1.04,0.0o),(0.5,-104.4o)Phi = 0 Degree Cut, EComponent
Frequency = 150 MHz, Dipole Length=1.1m, Center Element Height=28'
Theta (Degrees)
-90 -75 -60 -45 -30 -15 0 15 30 45 60 75 90
Nea
r F
ield
Pa
ttern
(dB
)
-70
-65
-60
-55
-50
-45
-40
-35
-30
-25
-20
-15
-10
E, Dipole Only
E, Scattered Field
3-element x-directed dipole array located 28’ above the ground plane at 150 MHz. Phi=0 (x-z) plane cut.
•Studies involved various probe types and arm shapes.•Spurious signals can be reduced to better than 25 dB below the direct signals even at the lowest frequencies. Performance is better at the higher frequencies.
3 ele. array
NF RANGE WITH REALISTIC GROUND YR-2

ElectroScience Laboratory
10
DAMP SAND IS VERY LOSSY:
Dielectric constants of sands with various moisture content.
AS SHOWN BY BOREHOLE DATA
YR-2

ElectroScience Laboratory
11
PLANE WAVE SYNTHESIS
AUT
SynthesizedWavefront
Radiatingelements
Surface of ground
Individual spatial displacements
Synthesized below-ground elements(green)
Sketch of plane wave synthesis geometry.

ElectroScience Laboratory
12
FF
Ptp
tf
fpff
delf
Ft
Pt
FfPf
X
Z
Y
Geometry for the near field to far field transformation
PLANE WAVE SYNTHESIS

ElectroScience Laboratory
13
(a) (b)
(c)
Result of transformation to the far field; E-theta and E-phi vs. Theta(a) Phi = 0 deg.; Phi = 45 deg., Phi = 90 deg.)
φ=0º
φ=90º
φ=45º
YR-2
• single horz. dipole (NEC-BSC) • 500 MHz• 1.2 feet (0.366 meters) above ground• ground is a lossy dielectric half space• radius is 12 feet (3.66 meters)• MATLAB code

ElectroScience Laboratory
14
CRANEBENCH (by Frank Paynter)
YR-2
GUI-BASED C++ PACKAGE“CRANE BENCH”

ElectroScience Laboratory
15INTERESTING EXAMPLE(probe data)
E-theta E-phi E-r
• H-dipole; 1.2 ft. above realistic gnd; • 7 ft. offset in x direction• 12 ft. radius scanner; 500 MHz;
(note non-zero r-component)
YR-2

ElectroScience Laboratory
16
INTERESTING EXAMPLEC:\Documents and Settings\Sharon\Desktop\05-CRANE\CRANEBENCH_3-7-05\1hdipole-zd-x7_0-y0_0-z1_2_ra12ft_0500mhz_sphere_1.oaa
0 90 180 270 360Phi (Deg) at Theta = 80.00
10
20
30
40
50
60
Mag
nitu
de (d
B)E-THgE-PHgE-THuE-PHuE-THtE-PHt
Maximum = 57.264999C:\Documents and Settings\Sharon\Desktop\05-CRANE\CRANEBENCH_3-7-05\1hdipole-zd-x7_0-y0_0-z1_2_ra12ft_0500mhz_sphere_2.oaa
0 90 180 270 360Phi (Deg) at Theta = 50.00
10
20
30
40
50
60M
agni
tude
(dB
)
E-THgE-PHgE-THuE-PHuE-THtE-PHt
Maximum = 56.317501
FAR ZONE CONICAL CUTS
NOTE THE RECOVERED SYMMETRY
RESULT OF TRANSFORMATION
YR-2

ElectroScience Laboratory
17
Two measurement points representing half the associated area each
Conservation of energy requires that the power per unit area (Sterradian) must be the same in both cases.
area EE
SAME AREA …DIFFERENT # POINTS
YR-3
• Multiply each voltage by square root of the associated point area in Sterradians.
• Thus, as points crowd together, their power per unit area remains the same.
• Modify the raw data file to make this change and then feed modified data file to CraneBench.
• IT IS COMMON TO BUILD A SCANNER THAT SCANS IN EFFICIENT INCREMENTS OF THETA AND PHI•BUT NOT IN EQUAL INCREMENTS OF SOLID ANGLE SPACE (NOT IN EQUAL STERRADIAN “PIXELS”)• MOST REAL DATA MUST THUS BE COMPENSATED BEFORE BEING PASSED TO CRANEBENCH

ElectroScience Laboratory
18
SPECIFIC EXAMPLE - YR-3
1 m DIAMETER DISK5 CM THICK
2.338 GHzMONOPOLE
ANTENNA UNDER TEST
We obtained data from:Hemispherical range with
5.8 m Radius Arch
Absorber floor
EDGE DIFFRACTIONIS STRONG

ElectroScience Laboratory
19
STERRADIAN COMPENSATIONEXAMPLE
YR-3
COMPARE NEC-BSC FF EXACT VS. P-WAVE SYN FF COMPUTATION BASED ON NEC-BSC NF SYNTHESIZED DATA
THE NEC-BSC NF DATA WERE DONE ON A SPIRAL CUT
BOTTOM LINE; IT WORKS VERY WELL
exact

ElectroScience Laboratory
20
COMPARE OSU PLANE WAVE SYNTHESIS WITH COMMERCIAL SPHERICAL MODE EXPANSION
OSU @ 4.71 = R, DELTA = 1 DEG.Sph. Mode @ 4.28 = R, DELTA = 1 DEG.
F= 2.338 GHZ
Blue = NEC-BSC model Red = OSU – plane wave expansionGreen = Commercial Spherical Mode Expansion
WE DON’T KNOW WHICH ONE IS “BEST”YR-3
STERRADIAN COMPENSATION EXAMPLE
DATA FROM A NF CHAMBER WITH ANABSORBER-COVERED FLOOR

ElectroScience Laboratory
21DOES THE 5.8 VS. THE 4.7 RADIUS
MAKE MUCH DIFFERENCE?
THE DIFFERENT R VALUES MAKE A DIFFERENCE, BUT IT IS UNCLEAR WHICH ONE IS “BETTER”
OSU PLANE WAVE SYNTHESIS OF MEASURED DATA YR-3

ElectroScience Laboratory
22TRANSFORMATION ALGORITHMS: CONCLUSIONS
•DISAGREEMENT BETWEEN SPH MODE EXPANSION AND THE OSU PLANE WAVE SYNTHESIS RESULTS ARE +/- 1.5 DB OR LESS
•MEASURED DATA HAS SMALL GROUND REFLECTIONS NOT MODELED IN NEC-BSC
•THE NEC-BSC THEORY IS NOT QUITE EXACT
•NEC-BSC MODELS AN INFINITELY THIN DISK (ACTUAL DISK WAS ~5 CM THICK)
•NEC-BSC DISK IS MADE OF SHORT SEGMENTS, IS NOT A CIRCLE
•THERE ARE NO GROUND REFLECTIONS IN THIS NEC-BSC FF RESULT
•IN AREAS OF DISAGREEMENT, WE DON’T KNOW WHICH ONE IS “BEST”
•THE 1 DEG. DELTA DATA IS VERY CLOSE TO ALIASING AT THE RADIUS USED (BUT THE “MINIMUM SPHERE” IS SMALLER THAN THE PROBED SPHERE)
•THE RIPPLE (PERHAPS TRUNCATION EFFECTS) IN THE SYNTHESIZED RESULTS CAN BE SUPPRESSED BY FILTERING.
•IT WOULD BE GOOD TO SEE SOME OTHER DATA IN ORDER TO EXPLORE THE DETAILS OF THE TEST RANGE BEHAVIOR AND COMPARE THE PERFORMANCE OF THE SPHERICAL MODE EXPANSION TECHNIQUE TO THE PLANE WAVE SYNTHESIS TECHNIQUE.
(WHO CAN HELP! ANYONE WITH SOME NF SCANNER DATA?)

ElectroScience Laboratory
23
WE WILL USE 2 PROBE ANTENNAS:
• LOG PERIODIC (Commercial)• Low freq.• EDO Corp. AS-48315 (dual polarized)• Has been fully characterized
• DIELECTRIC ROD ANTENNA (in-house design)•1 – 6 GHz•Designed at the OSU/ESL by Chi-Chih Chen•Build at the OSU/ESL by Chi-Chih Chen•Will be characterized fully by end of Oct. 2006
YR-3

ElectroScience Laboratory
24
Dielectric Probe Antenna Progress - YR 3
THE 2-LAYER ROD IS READY FOR ANTENNA PATTERN MEASUREMENT.
NEW PROBE

25
ElectroScience Laboratory
05/21/06
Two-layer-rod, er=6(1”)+er4(2”).
Gain measurement in compact range.
Dielectric Probe Antenna Progress
THE TWO-LAYER ROD WITH THE EXTENDED TIP TESTED IN THE ANTENNA MEASUREMENT CHAMBER.
NEW PROBE
YR-3

ElectroScience Laboratory
26
LOG PERIODIC MEASUREMENT SETUP
ESL BLDG
Instrumentation
antennaFiberglass pole
Nylon
Guys
Nylon & Steel Deployment Cable
30 ft.
45 feet
Counterweight
Rotator
& tilt base
Thrust Bearing
1,200 lb.
Brake Winch
•entire pole rotates
•driven by the bottom rotator
•stabilized at the mid-pole thrust bearing.
YR-3

ElectroScience Laboratory
27
COMMERCIAL LOG PERIODIC
INSTRUMENTATIONANTENNA THRUST BEARING
ANDGUY LINES
ROTOR
FIBERGLASSPOLE
WINCH
YR-3
LOG PERIODIC MEASUREMENT SETUP
ElectroScience Laboratory
28
NF RANGE WITH REALISTIC GROUND
NOW LETS TALK ABOUTMECHANICAL OFFSET COMPENSATIONS.
YR-3

ElectroScience Laboratory
29
SUMMARY OF PROBLEM - YR 3
1. GIVEN CARTESIAN (x-y-z; room based) LASER TRACKING COORDINATES FOR ARM AND TURNTABLE (with respect to encoder readouts)
2. GIVEN PHASE CENTER SHIFT OF PROBE ANTENNA AS A FUNCTION OF FREQUENCY
3. MEASURE RECEIVED SIGNAL AMPLITUDE AND PHASE AS A FUNCTION OF ARM AND TURNTABLE ENCODER OUTPUTS
4. CONVERT ENCODER ANGLE DATA INTO TRUE PROBE ANTENNA COORDINATES WITH RESPECT TO ANTENNA UNDER TEST

ElectroScience Laboratory
30
SUMMARY OF PROBLEM
xroom yroom
zroom
otpPP ˆ
ottt txRx ˆ
ottt tyRy ˆ
ottt tzRz ˆ
AUT
ottRT ˆ
Turntabletrajectory
Probe trajectory
Mechanical errors exaggerated for clarity
Turntableoffset
Turntable axis offset by ot
YR-3

ElectroScience Laboratory
31
SUMMARY OF PROBLEM
• ASSUME TURNTABLE DOES NOT “WOBBLE” ON ITS BEARING. (CENTER POINT OF ROTATION AND AXIS OF ROTATION ARE FIXED)
• WE MAKE NO SUCH ASSUMPTION FOR THE ARM. It may sag and bend.
• ASSUME TURNTABLE AND ARM LOCATIONS ARE REPEATABLE WITH RESPECT TO ENCODER READOUTS.
BUT
• ASSUME TURNTABLE AND ARM CENTERS OF ROTATION ARE OFFSET FROM ROOM COORDINATE AXIS CENTER.
• ASSUME AXIS OF ROTATION OF ARM AND TURNTABLE ARE NOT ALIGNED WITH ROOM COORDINATE NOR WITH EACH OTHER.
• ASSUME AXES OF ROTATION OF ARM AND TURNTABLE DO NOT INTERSECT.
• ASSUME AXES OF ROTATION OF ARM AND TURNTABLE ARE NOT ORTHOGONAL TO EACH OTHER (NOT AT 90 DEG. ANGLE).
• ASSUME PHASE CENTER OF PROBE ANTENNA VARIES WITH FREQUENCY.
YR-3

ElectroScience Laboratory
32
APPROACH TO PROBLEM
1. USE LASER TRACKER TO PROVIDE ROOM-COORDINATES (xyz) OF POINT ON TURNTABLE WITH RESPECT TO ITS ENCODER READOUT
2. USE LASER TRACKER TO PROVIDE ROOM-COORDINATES (xyz) OF TWO (or more) POINTS ON PROBE SUPPORT (points along the probe antenna support extension; under load)
3. FIT FOURIER SERIES TO TRACKS OF TURNTABLE TARGET POINTS AND ARM TARGET POINTS.
4. THE DC VALUES GIVE THE OFFSET
5. THE 2ND COEFFICIENT PERMITS DETERMINATION OF THE TILTS
6. USE THE FOURIER COEFFICIENTS TO GIVE THE ROOM COORDINATES OF THE PROBE PHASE CENTER AND THE TURNTABLE VECTOR COORDINATES BASED ON THE ENCODER VALUES.
AT THIS POINT, WE CAN COMPUTE THE TURNTABLE ROTATION AXIS AND CENTER OFFSET.
YR-3
ElectroScience Laboratory
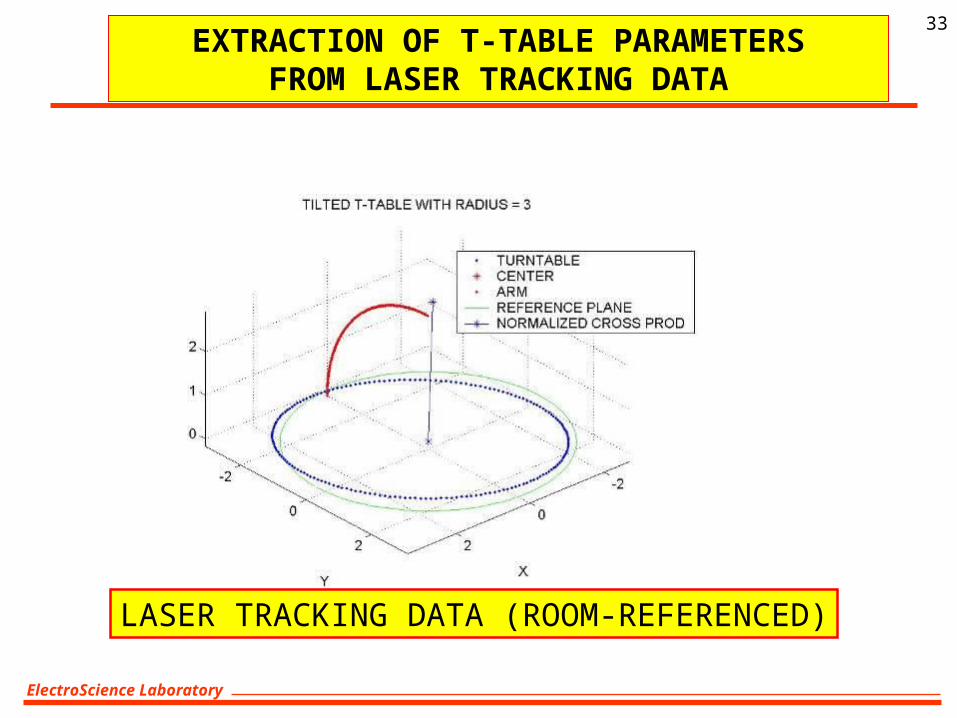
33EXTRACTION OF T-TABLE PARAMETERS
FROM LASER TRACKING DATA
LASER TRACKING DATA (ROOM-REFERENCED)

ElectroScience Laboratory
34EXTRACTION OF T-TABLE PARAMETERS
FROM LASER TRACKING DATA

ElectroScience Laboratory
35
NF RANGE WITH REALISTIC GROUND - YR 3
WE WILL SOON HAVE AN OPERATIONAL HEMISPHERICAL NF RANGE FOR ANTENNAS ON A
REALISTIC GROUND
• WE WILL USE A DIRECT FAR FIELD COMPUTATION
• WE WILL COMPENSATE THE INPUT DATA FOR:
• Known reflection coefficient of the ground
• Scanning in non-uniform solid angle increments
• Offset in scanning axes;
• turntable offset and axis angle
• arm offset, axis angle and sag
• polarization rotation due to arm sag
• antenna phase center offset vs. frequency

ElectroScience Laboratory
36
PROGRESSPROGRESS2004 WORK
Develop a NF to FF algorithm that separately computes the direct signal, the ground reflected signal and the sum signal.
Use external ground reflections to obtain accurate FF patterns from NF probe data.
Use measurements of the ground reflection coefficient in order to compute the FF patterns (of course this is in the case where there is significant ground reflection outside the domain of the probe hemisphere)
2005 WORK Complete the NF to FF algorithm development for the probe data and explore the behavior of the algorithm Characterize the sand pit using borehole measurements of dielectric properties Compute the interaction effects of the metallic support arm Include full polarization development work in the algorithm development work. Code a user-friendly algorithm using C++
2006 WORK Characterize the low band log periodic probe antenna (gain, phase, beam pattern, phase center vs. freq.) Design and characterize the high band probe antenna (dielectric rod design) Begin the derivation of the turntable and arm offset and sag compensation technique
2007 WORK Finish the turntable and arm offset compensation algorithms (offset and polarization) Incorporate the turntable and arm compensation algorithms in a C++ user friendly “package” Test the computer systems using new near field data.

ElectroScience Laboratory
37
Dr. Eric K. WaltonDr. Eric K. Walton, The Ohio State Univ.
Dr. Teh Hong Lee, The Ohio State Univ.
G. Frank Paynter, The Ohio State Univ.
Carey Buxton, FBI Academy
Jeff Snow, NSWC/Crane
HEY !IS THAT
A HEMI ?