electrosys 400 kw rf station site acceptance test
TRANSCRIPT
Department of
Physics and Astronomy
Uppsala University
P.O. Box 516
SE – 751 20 Uppsala
Sweden
FREIA Report 2017/01
January 2017
DB Science 400 kW RF Station
Site Acceptance Test
DEPARTMENT OF PHYSICS AND ASTRONOMY
UPPSALA UNIVERSITY
M. Jobs, R. Wedberg, K. Gajewski
Uppsala University, Uppsala, Sweden
Department of Physics and Astronomy Uppsala University P.O. Box 516 SE – 751 20 Uppsala Sweden
Papers in the FREIA Report Series are published on internet in PDF- formats.
Download from http://uu.diva-portal.org
FREIA
Department of Physics and Astronomy
Uppsala University
- 2 / 46 -
DB Science 400 kW RF Station Site Acceptance Test
M. Jobs, R. Wedberg, K. Gajewski
Uppsala University, Uppsala, Sweden
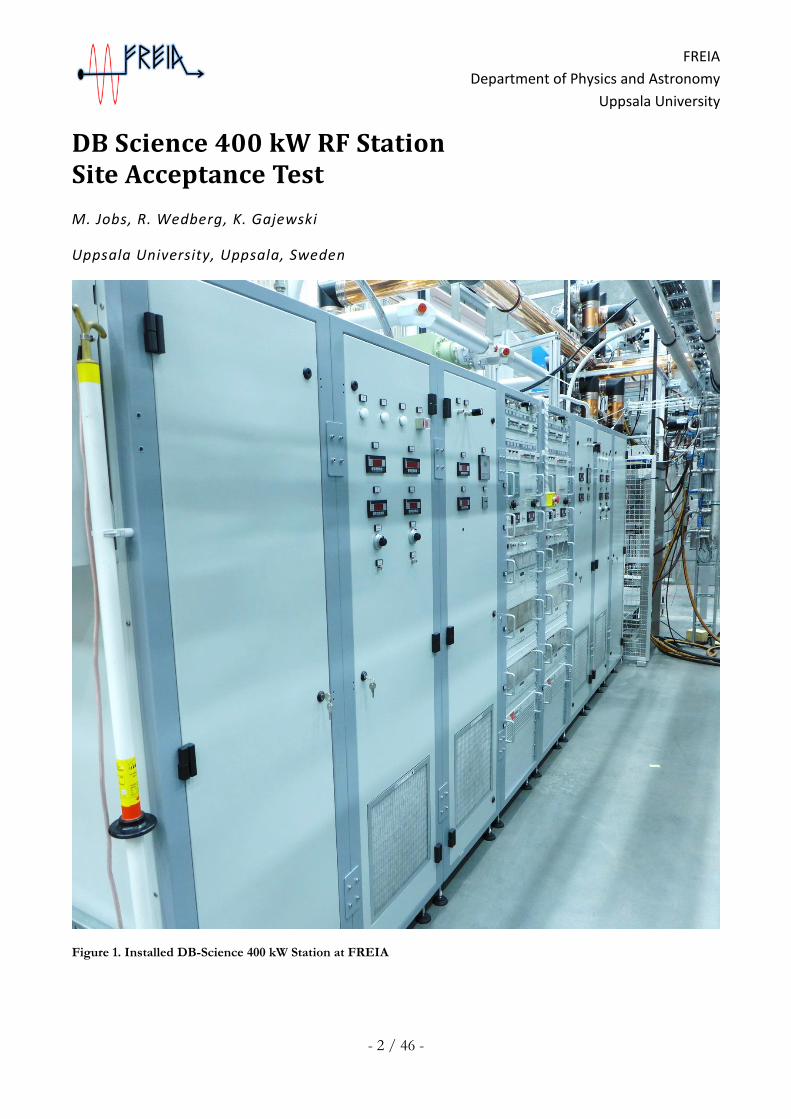
Figure 1. Installed DB-Science 400 kW Station at FREIA
FREIA
Department of Physics and Astronomy
Uppsala University
- 3 / 46 -
Abstract
The manufactured and delivered DB-Science 400 kW RF station was tested on site at FREIA during
2016. The station can successfully deliver continuous pulse-trains with a power-level up to 400 kW,
however during most of the on-site measurements and testing the total combiner output power was
limited to 360 kW due to unusually high G2 currents measured in one of the spare TH595 tetrode tubes
used in the station. The tube performance worries were later explained by Thales and each tube should
have no issues running at full output power, however, at the time the tests were performed this was not
yet fully clarified and as such the tubes were limited at 180 kW each during SAT. Each of the stations
200 kW tetrode based amplifier sections were mounted with TH595 tetrode tubes from Thales and
tuned for optimal performance. The gain of the tetrode amplifiers were roughly 15 dB with some
variation between the two amplifier sections and the overall gain was approximately 74 dB maximum.
Amplitude and phase pulse variations were within the specified levels.
FREIA
Department of Physics and Astronomy
Uppsala University
- 4 / 46 -
1. 0Introduction The following section includes some general characteristics and remarks. The data presented within this
report provides the test results for acceptance of the Site Acceptance Test of the DB-Science RF -
station.
1.1 General station characteristics
1. Dimensions of the power station: 4800 mm long 1200 mm width 2268 mm high (to centre of top combiner)
2. Documentation: 1 Massive folder. 1.2 Response to FAT remarks
The following remarks were made during factory acceptance test and the corresponding actions prior to
shipping the station noted below. The list below are only action taken prior site delivery, for a complete
list of actions required post-delivery see section 3.
1. “CE/EMC certification is currently absent and is required to be performed prior to shipment of station to Uppsala.” a. Station was certified by external company prior delivery
2. “Several of the stations built in voltage and current meters give erroneous readings. This is partly because some meters are lacking sample synchronization with the RF pulse and partly because some meters show an excessive amount of noise at high power levels. Meters must be setup in such a way that they give proper readings ” a. Voltage measurements were better synchronized with pulses and the current
readings improved 3. “The built in conductivity meters used to monitor the coolant waters conductivity are not
calibrated. The meters must be calibrated to give correct readings as in order to provide proper protection to the tubes. ” a. Recalibration of meters prior delivery.
4. “The current filament ramping procedure is currently not linear as recommended by Thales but instead possess an exponential capacitor charge curve. If the current filament ramping procedure is used a verification by Thales that the used ramping sequence is acceptable should be provided. ” a. Added linearization of filament voltage ramping.
5. “The station does not have way to adjust the phase or amplitude of the two amplifier signals to the final combiner. As such there is no straightforward way to adjust the balancing in the hybrid. Previous RF block diagrams provided by DB Electronica showed the presence of such tuners and the final station should have some phase-shifter/variable attenuator installed in such a way that any unbalance of the RF signals into the final hybrid combiner can be compensated.” a. Variable attenuators and phase shifters installed.
6. “The built-in mechanical switches which allow the power supplies for the tetrode to be put in local or remote mode should be labelled so it is clearly indicated which state they are currently set in.” a. Marked prior delivery
FREIA
Department of Physics and Astronomy
Uppsala University
- 5 / 46 -
7. “The dummy load connected to the final hybrid combiner used to dissipate unbalanced power into the hybrid does currently not possess any mechanical water leakage protection between the load and the RF station. Due to the position of the dummy load on top of the station any water leakage will run down into the station possibly damaging the station. Some mechanical protection should be present below the dummy load in order to make sure that any water leakage does not run directly into the station” a. Leakage protection installed
8. “The station currently possesses 4 independent emergency stop buttons each connected separately to parts of the station. The station must have one 3 phase PEN 5 wire mains connection with a common emergency stop button which shuts down the entire station. a. Additional common emergency button installed
9. “The station is fully equipped to run in CW mode but during factory inspection the CW mode was not working properly. If the option to run the station in CW mode is to be included it should also be shown to work properly. a. DB got CW mode working prior delivery, was an error in the relative phase of the
two CW drivers 10. “During the factory the stations scaling factors and calibration values used to both set the
power supplies and read out RF forward and reflected power between sections were adjusted several times to different values. This does not give a lot of confidence in the accuracy of the read values. As such all scaling factors and calibration values must be properly calibrated so all values actually read from the station can be trusted to be correct. a. Recalibration performed by DB
11. “As specified in the Tender Technical Specification 5.1.2 the anode power supplies are to be mounted with a current pulse transformer for anode current monitoring. One suggestion for pulse transformer is Stangenes CT2-0.1W” a. New pulse transformers ordered by DB to be installed
12. “Control System: CW mode not tested a. Tested by DB prior delivery
13. “Control System: Missing the possibility to change the scaling factors for the acquisition values for Anode Voltage, Anode Voltage (CW), G1 Voltage, G2 Voltage, Filament current “ a. Function added prior delivery
14. “Control System: Grid 2 voltage measurement show 0 in system 1 and 2 a. Fixed prior delivery
FREIA
Department of Physics and Astronomy
Uppsala University
- 6 / 46 -
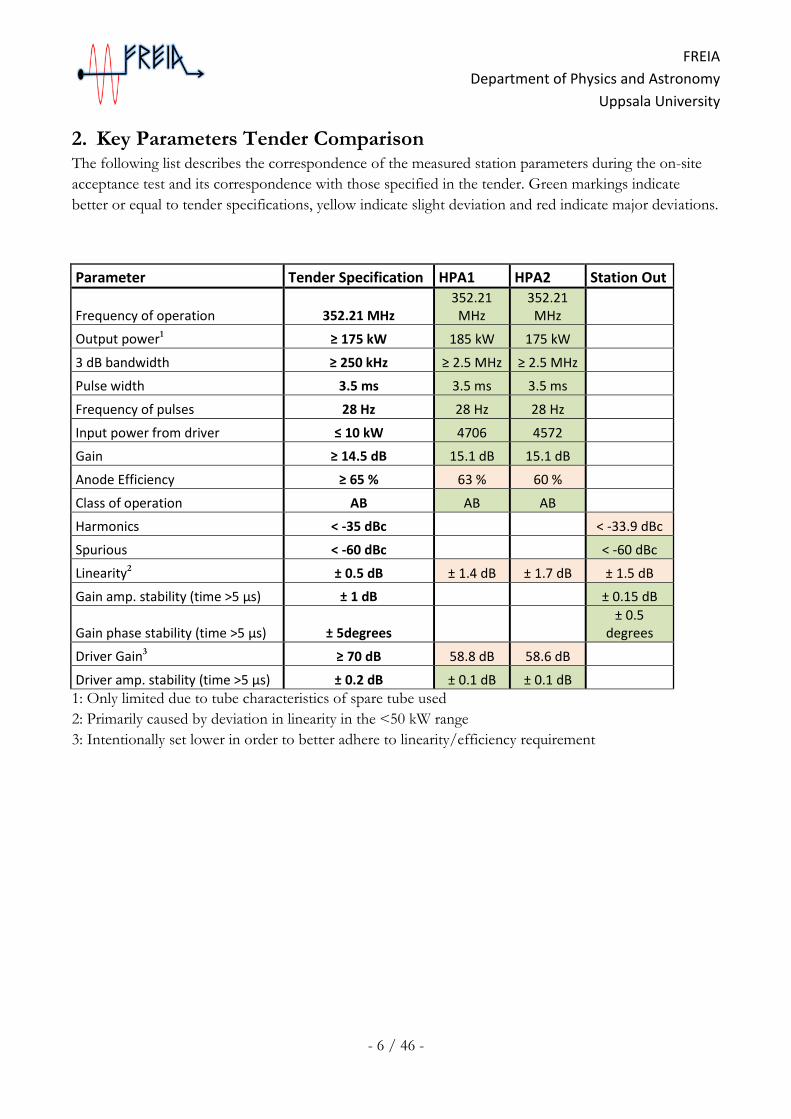
2. 0Key Parameters Tender Comparison The following list describes the correspondence of the measured station parameters during the on-site
acceptance test and its correspondence with those specified in the tender. Green markings indicate
better or equal to tender specifications, yellow indicate slight deviation and red indicate major deviations.
Parameter Tender Specification HPA1 HPA2 Station Out
Frequency of operation 352.21 MHz 352.21
MHz 352.21
MHz
Output power1 ≥ 175 kW 185 kW 175 kW
3 dB bandwidth ≥ 250 kHz ≥ 2.5 MHz ≥ 2.5 MHz
Pulse width 3.5 ms 3.5 ms 3.5 ms
Frequency of pulses 28 Hz 28 Hz 28 Hz
Input power from driver ≤ 10 kW 4706 4572
Gain ≥ 14.5 dB 15.1 dB 15.1 dB
Anode Efficiency ≥ 65 % 63 % 60 %
Class of operation AB AB AB
Harmonics < -35 dBc < -33.9 dBc
Spurious < -60 dBc < -60 dBc
Linearity2 ± 0.5 dB ± 1.4 dB ± 1.7 dB ± 1.5 dB
Gain amp. stability (time >5 μs) ± 1 dB ± 0.15 dB
Gain phase stability (time >5 μs) ± 5degrees ± 0.5
degrees
Driver Gain3 ≥ 70 dB 58.8 dB 58.6 dB
Driver amp. stability (time >5 μs) ± 0.2 dB ± 0.1 dB ± 0.1 dB
1: Only limited due to tube characteristics of spare tube used
2: Primarily caused by deviation in linearity in the <50 kW range
3: Intentionally set lower in order to better adhere to linearity/efficiency requirement
FREIA
Department of Physics and Astronomy
Uppsala University
- 7 / 46 -
3. On-Site Station Modifications Although the station was reported complete and the required key issues during FAT listed to DB the
station still exhibited several significant issues once delivered to Uppsala. Some of these were related to
prior required actions which had not been fully remedied and several were issues which were
encountered once the station started first operation in Uppsala. Listed below are all the required
modifications performed to the station before full Site-Acceptance could be made.
The modifications listed caused large delays in the final acceptance of the station. Between most of the
issues encountered the station meters had to be recalibrated and function tests performed on the station.
Also, at several occasions the final acceptance measurements had been started when the emergence of
additional issues forced recalibration and restart of acceptance measurements.
3.1 Tetrode Damaged During Shipping
Although the party at fault here was the shipping company and not DB one of the tubes had been
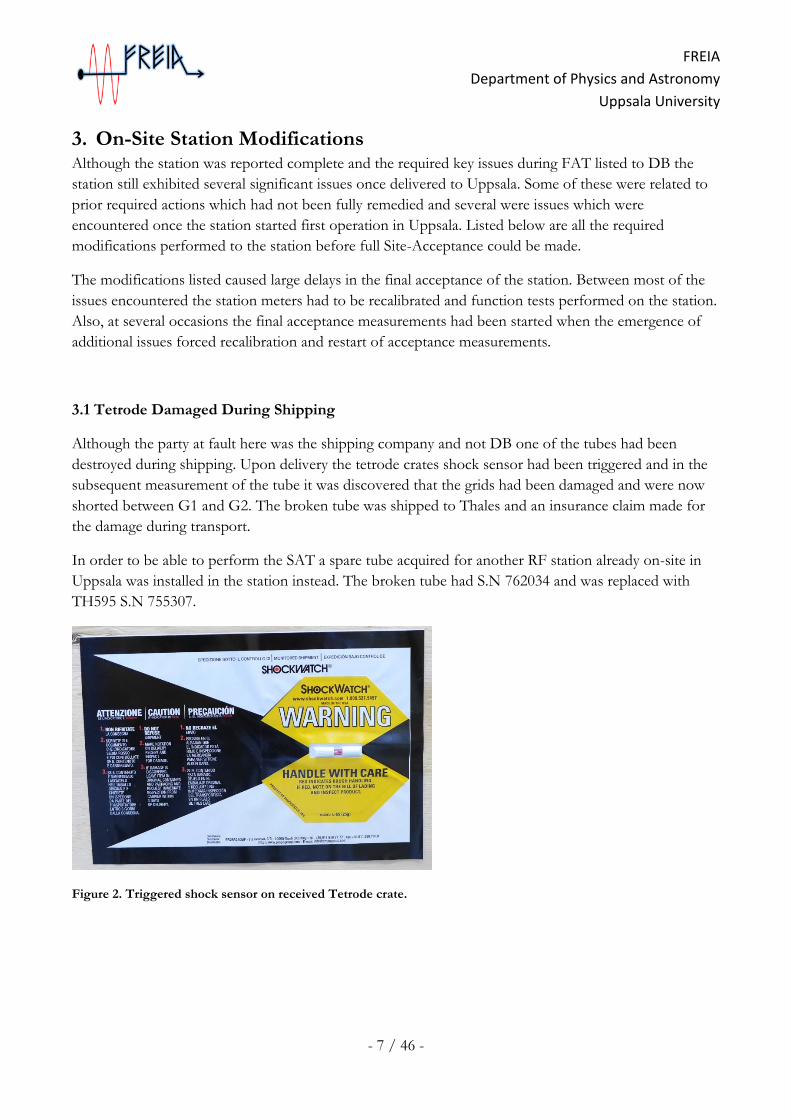
destroyed during shipping. Upon delivery the tetrode crates shock sensor had been triggered and in the
subsequent measurement of the tube it was discovered that the grids had been damaged and were now
shorted between G1 and G2. The broken tube was shipped to Thales and an insurance claim made for
the damage during transport.
In order to be able to perform the SAT a spare tube acquired for another RF station already on-site in
Uppsala was installed in the station instead. The broken tube had S.N 762034 and was replaced with
TH595 S.N 755307.
Figure 2. Triggered shock sensor on received Tetrode crate.
FREIA
Department of Physics and Astronomy
Uppsala University
- 8 / 46 -
3.2 Initial Sporadic Tube Discharges
During initial runs of the station several small discharge event were experienced. These triggered the
station interlocks causing the station to shut-down momentarily. The cause of the discharges was
believed by DB to be initial conditioning of the tube grids. Another possible explanation was at a much
later stage discovered which was related to the stations built in filters in the pressure reducing valves. See
Section 3.20.
3.3 APS Capacitor Charger Crowbar Shutdown Issue
In the station configuration disabling the APS capacitor charger upon a crowbar event is controlled by
the stations control system. In the case of a crowbar event the control system turns off the capacitor
charger. However, the time required by the control system to shut down the capacitor charger was to
large which caused the APS to blow multiple 3-Phase fuses upon each crowbar event. This issue was
discovered early on when performing the short-circuit wire tests at which multiple fuses were blown and
required replacement. Sporadic crowbar events due to other sources also damaged the APS fuses.
In order to protect the station fuses a fast acting switch was installed for the 3-Phase supply which
triggered automatically in the case of an APS short circuit and removed input power immediately thus
preventing damage to the station fuses.
3.4 Loss of Communication Between PLC Modules
During initial start-up of the station there were communications issues between the two station-sections.
After some debugging it was found that one of the internal Ethernet cables in the control module was
damaged and had to be replaced.
3.5 Built-In Meters Failed To Show Any Reading
Initially some interconnection issues due to faulty cabling to the built in meters were present which
prevented the start-up of the station. The faulty cabling was quickly identified and repaired.
FREIA
Department of Physics and Astronomy
Uppsala University
- 9 / 46 -
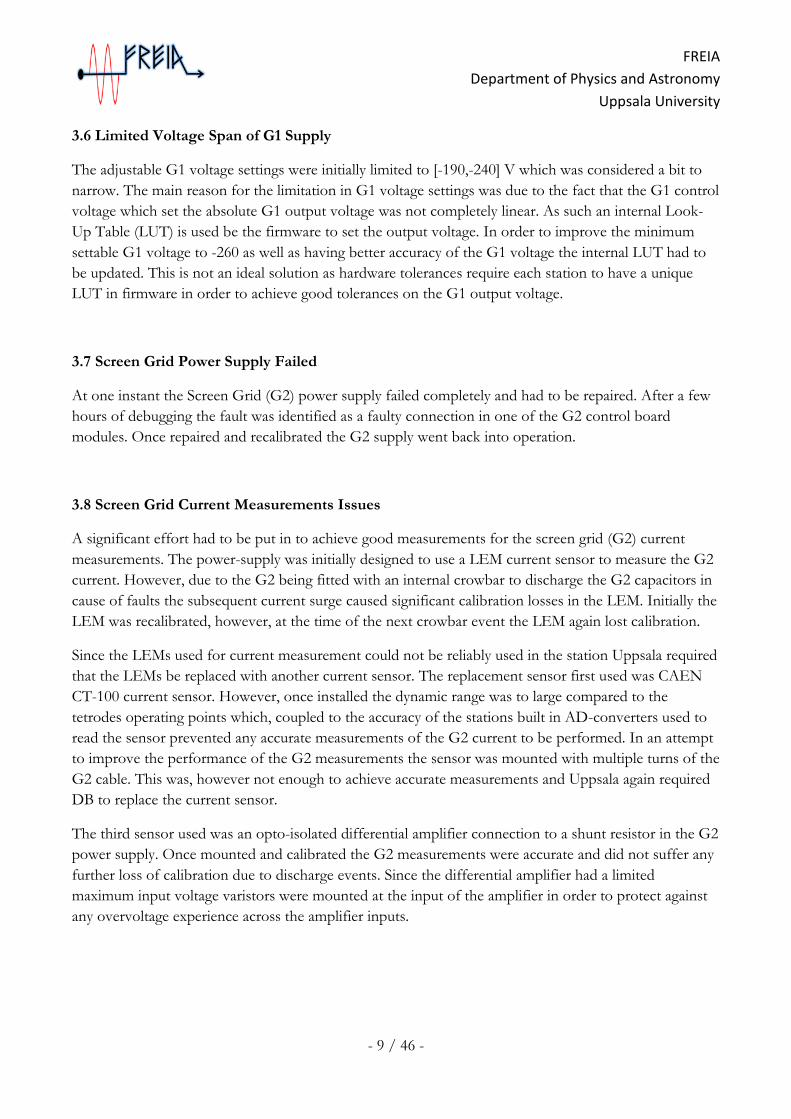
3.6 Limited Voltage Span of G1 Supply
The adjustable G1 voltage settings were initially limited to [-190,-240] V which was considered a bit to
narrow. The main reason for the limitation in G1 voltage settings was due to the fact that the G1 control
voltage which set the absolute G1 output voltage was not completely linear. As such an internal Look-
Up Table (LUT) is used be the firmware to set the output voltage. In order to improve the minimum
settable G1 voltage to -260 as well as having better accuracy of the G1 voltage the internal LUT had to
be updated. This is not an ideal solution as hardware tolerances require each station to have a unique
LUT in firmware in order to achieve good tolerances on the G1 output voltage.
3.7 Screen Grid Power Supply Failed
At one instant the Screen Grid (G2) power supply failed completely and had to be repaired. After a few
hours of debugging the fault was identified as a faulty connection in one of the G2 control board
modules. Once repaired and recalibrated the G2 supply went back into operation.
3.8 Screen Grid Current Measurements Issues
A significant effort had to be put in to achieve good measurements for the screen grid (G2) current
measurements. The power-supply was initially designed to use a LEM current sensor to measure the G2
current. However, due to the G2 being fitted with an internal crowbar to discharge the G2 capacitors in
cause of faults the subsequent current surge caused significant calibration losses in the LEM. Initially the
LEM was recalibrated, however, at the time of the next crowbar event the LEM again lost calibration.
Since the LEMs used for current measurement could not be reliably used in the station Uppsala required
that the LEMs be replaced with another current sensor. The replacement sensor first used was CAEN
CT-100 current sensor. However, once installed the dynamic range was to large compared to the
tetrodes operating points which, coupled to the accuracy of the stations built in AD-converters used to
read the sensor prevented any accurate measurements of the G2 current to be performed. In an attempt
to improve the performance of the G2 measurements the sensor was mounted with multiple turns of the
G2 cable. This was, however not enough to achieve accurate measurements and Uppsala again required
DB to replace the current sensor.
The third sensor used was an opto-isolated differential amplifier connection to a shunt resistor in the G2
power supply. Once mounted and calibrated the G2 measurements were accurate and did not suffer any
further loss of calibration due to discharge events. Since the differential amplifier had a limited
maximum input voltage varistors were mounted at the input of the amplifier in order to protect against
any overvoltage experience across the amplifier inputs.
FREIA
Department of Physics and Astronomy
Uppsala University
- 10 / 46 -
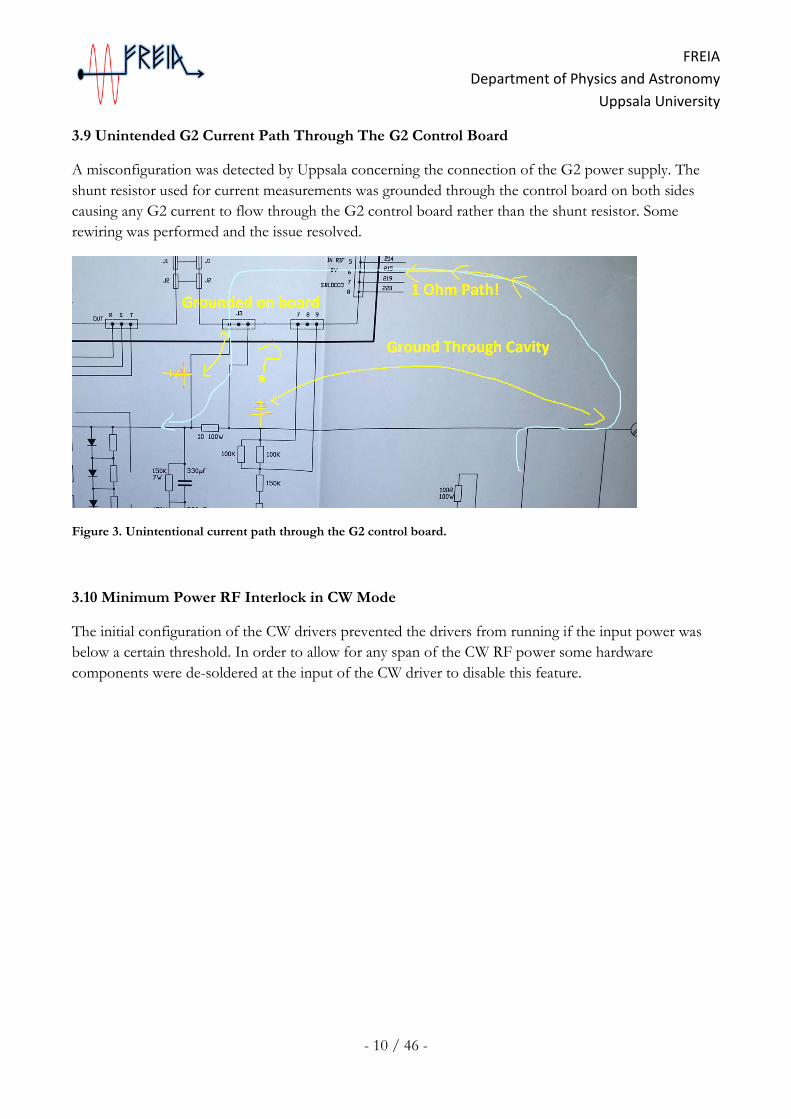
3.9 Unintended G2 Current Path Through The G2 Control Board
A misconfiguration was detected by Uppsala concerning the connection of the G2 power supply. The
shunt resistor used for current measurements was grounded through the control board on both sides
causing any G2 current to flow through the G2 control board rather than the shunt resistor. Some
rewiring was performed and the issue resolved.
Figure 3. Unintentional current path through the G2 control board.
3.10 Minimum Power RF Interlock in CW Mode
The initial configuration of the CW drivers prevented the drivers from running if the input power was
below a certain threshold. In order to allow for any span of the CW RF power some hardware
components were de-soldered at the input of the CW driver to disable this feature.
FREIA
Department of Physics and Astronomy
Uppsala University
- 11 / 46 -
3.11 High Voltage Fast Acting Switches Triggers
The fast acting switches used to prevent damage to the APS regular fuses triggered upon multiple
occasions if the RF output power level was ramped up to fast. One example could be going from 40 kW
total output power to 200 kW total output power causing the switch to trigger and the APS to go offline.
In order to prevent this error from occurring two actions were performed. The first action was to
replace the switches to a slightly less sensitive type in order to avoid the increase in current when
ramping up the output power to trigger the switches. However, this again caused the fuses to be
damaged in case of crowbar events which forced the usage of the prior faster switches.
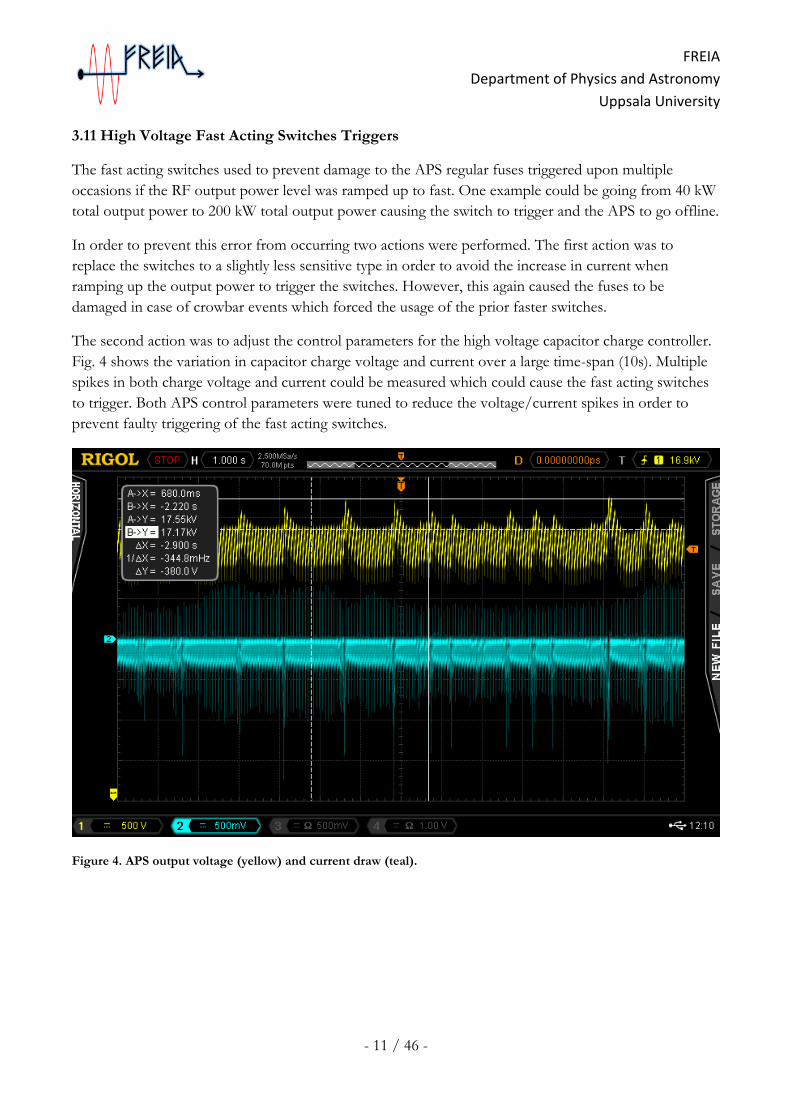
The second action was to adjust the control parameters for the high voltage capacitor charge controller.
Fig. 4 shows the variation in capacitor charge voltage and current over a large time-span (10s). Multiple
spikes in both charge voltage and current could be measured which could cause the fast acting switches
to trigger. Both APS control parameters were tuned to reduce the voltage/current spikes in order to
prevent faulty triggering of the fast acting switches.
Figure 4. APS output voltage (yellow) and current draw (teal).
FREIA
Department of Physics and Astronomy
Uppsala University
- 12 / 46 -
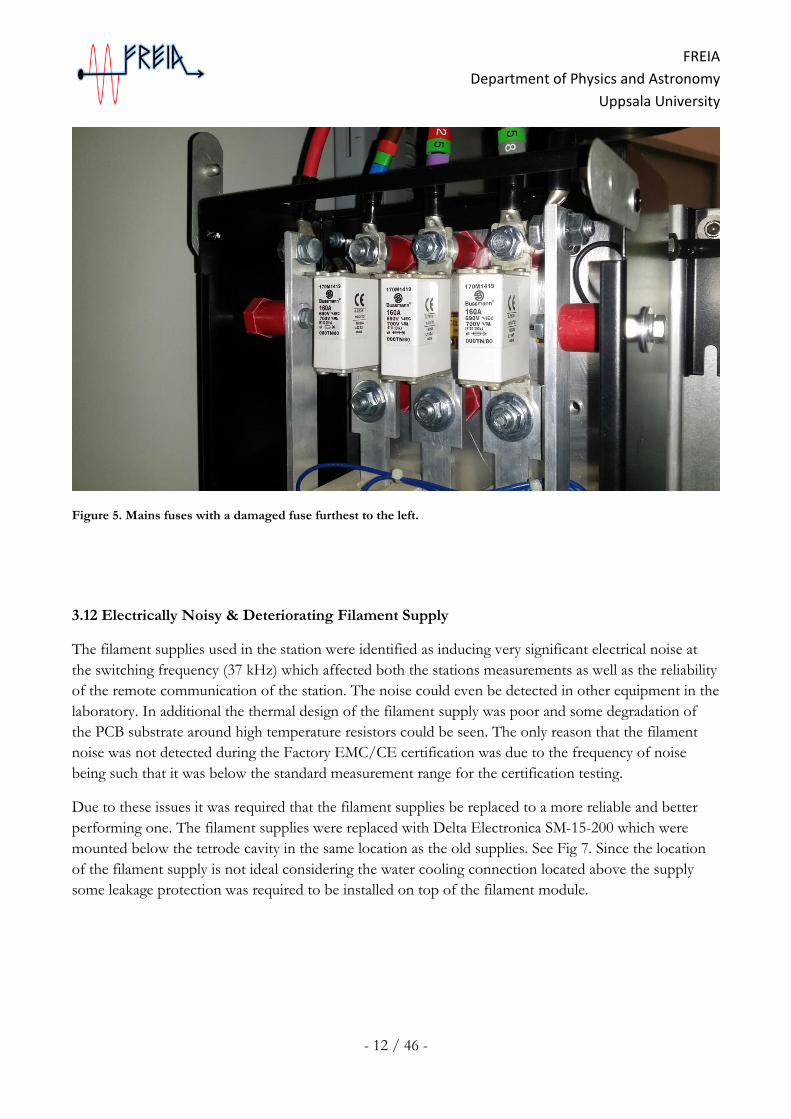
Figure 5. Mains fuses with a damaged fuse furthest to the left.
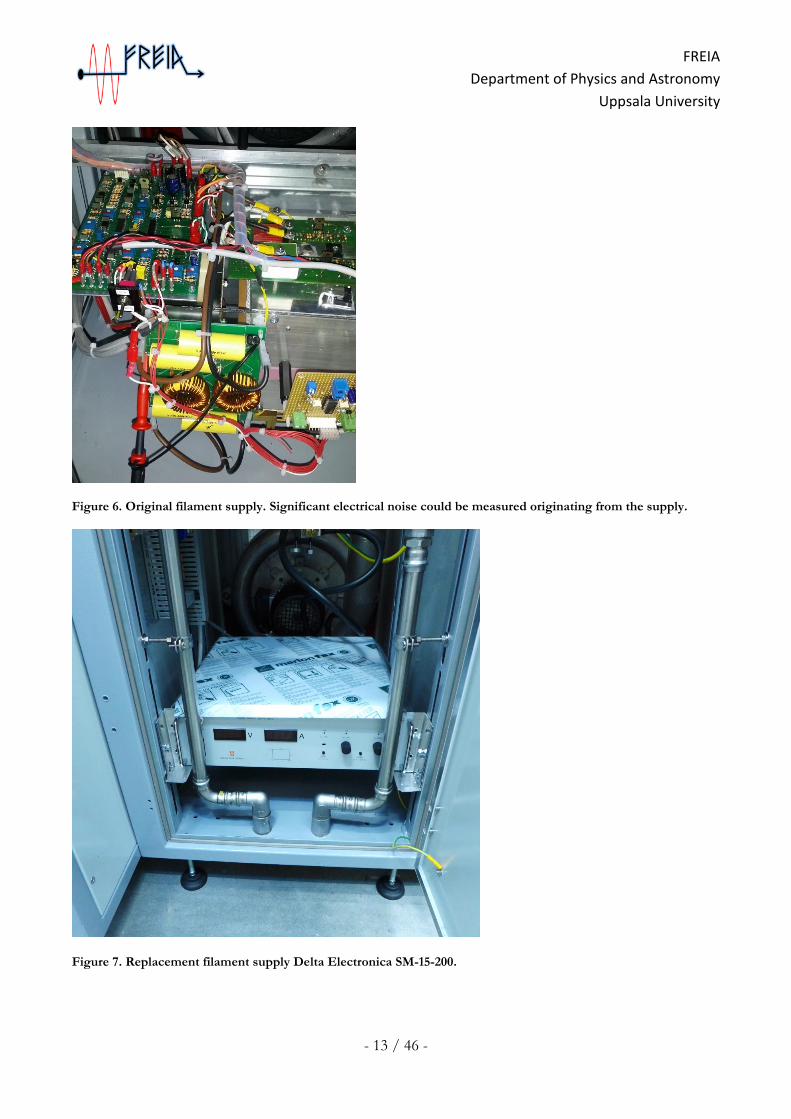
3.12 Electrically Noisy & Deteriorating Filament Supply
The filament supplies used in the station were identified as inducing very significant electrical noise at
the switching frequency (37 kHz) which affected both the stations measurements as well as the reliability
of the remote communication of the station. The noise could even be detected in other equipment in the
laboratory. In additional the thermal design of the filament supply was poor and some degradation of
the PCB substrate around high temperature resistors could be seen. The only reason that the filament
noise was not detected during the Factory EMC/CE certification was due to the frequency of noise
being such that it was below the standard measurement range for the certification testing.
Due to these issues it was required that the filament supplies be replaced to a more reliable and better
performing one. The filament supplies were replaced with Delta Electronica SM-15-200 which were
mounted below the tetrode cavity in the same location as the old supplies. See Fig 7. Since the location
of the filament supply is not ideal considering the water cooling connection located above the supply
some leakage protection was required to be installed on top of the filament module.
FREIA
Department of Physics and Astronomy
Uppsala University
- 13 / 46 -
Figure 6. Original filament supply. Significant electrical noise could be measured originating from the supply.
Figure 7. Replacement filament supply Delta Electronica SM-15-200.
FREIA
Department of Physics and Astronomy
Uppsala University
- 14 / 46 -
3.13 Faulty Measurements of SSA Modules Water Temperature
One of the SSA modules had an error in the internal measurement of the output cooling water
temperature. This however, could be quickly repaired by DB.
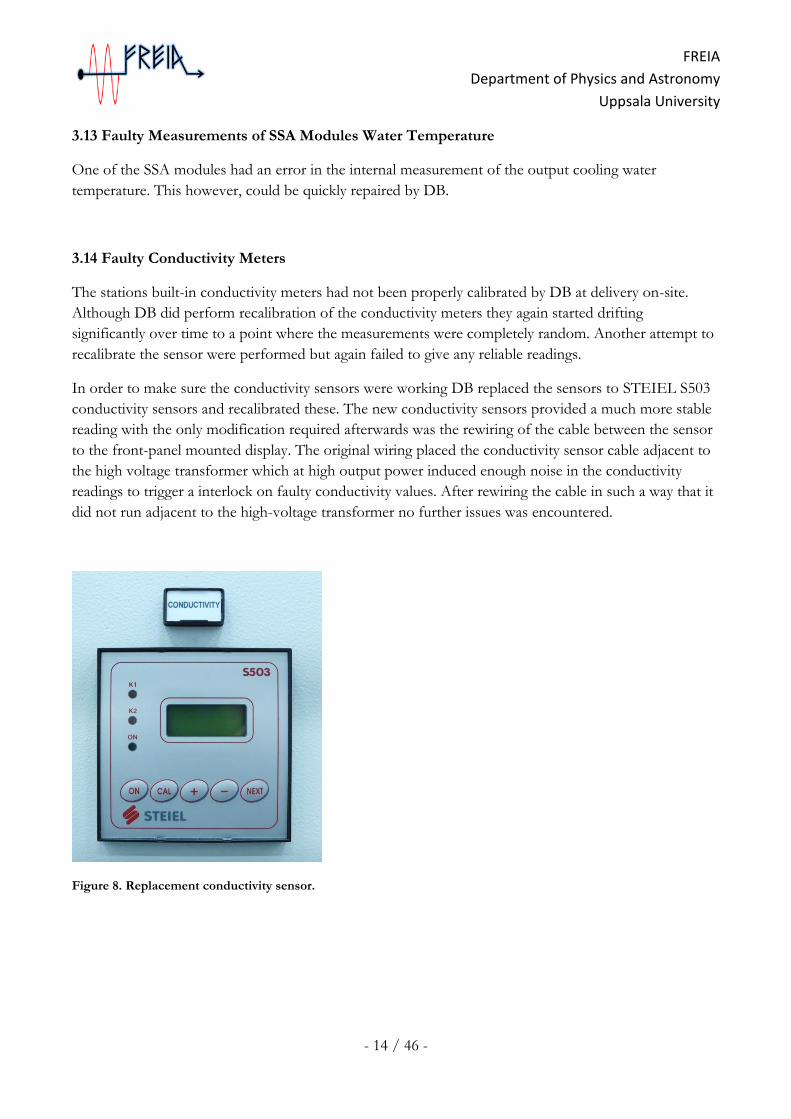
3.14 Faulty Conductivity Meters
The stations built-in conductivity meters had not been properly calibrated by DB at delivery on-site.
Although DB did perform recalibration of the conductivity meters they again started drifting
significantly over time to a point where the measurements were completely random. Another attempt to
recalibrate the sensor were performed but again failed to give any reliable readings.
In order to make sure the conductivity sensors were working DB replaced the sensors to STEIEL S503
conductivity sensors and recalibrated these. The new conductivity sensors provided a much more stable
reading with the only modification required afterwards was the rewiring of the cable between the sensor
to the front-panel mounted display. The original wiring placed the conductivity sensor cable adjacent to
the high voltage transformer which at high output power induced enough noise in the conductivity
readings to trigger a interlock on faulty conductivity values. After rewiring the cable in such a way that it
did not run adjacent to the high-voltage transformer no further issues was encountered.
Figure 8. Replacement conductivity sensor.

FREIA
Department of Physics and Astronomy
Uppsala University
- 15 / 46 -
3.15 Station Used Shunt Meters for External Anode Current Readings
The stations initially used shunt meters for external reading of the anode current. These shunts exhibited a much too high noise ratio making external anode current measurements close to impossible. By replacing the shunt meters with CAEN CT-100 much better quality measurement values could be acquired. 3.16 Preamplifier in CW Amplifier Module Broken
After significant debugging of the CW amplifiers one of the preamplifiers used in the CW amplifier modules turned out to be broken which caused one of the two halves of the stations CW stages to operate with reduced gain. This in turn made balancing the output from the tetrodes into the final hybrid combiner very difficult. DB brought a new pre-amplifier board and replaced the broken one in the CW amplifier to achieve equal gain of the two drivers. 3.17 Arcing in HV Grounding Switch
The initial HV grounding switch mounted in the APS door and used to ground/discharge the capacitors when opening the cabinet door was not designed with large enough spacing in open state. As a result the first time the HV power supplies were operated in excess of 15 kV a high voltage arc occurred in both switches. The HV switches used were deemed unfit and Uppsala required a replacement of these. DB provided a bulkier version of the HV switch which was then installed in the station. Although the HV switch used is not ideal in the sense that the switch state is not visible from the outside the solution was considered good enough since it had already been cleared by the EMC certification.
Figure 9. Replacement capacitor grounding switch.
FREIA
Department of Physics and Astronomy
Uppsala University
- 16 / 46 -
3.18 Recalibration of station meters
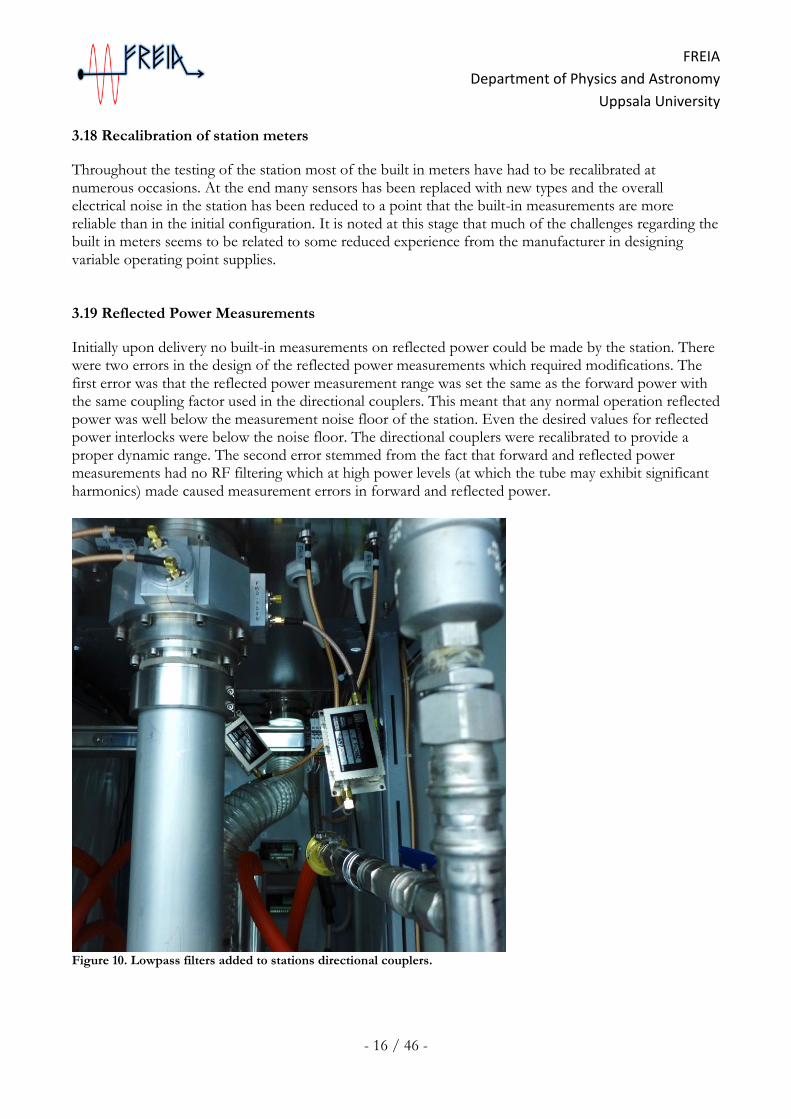
Throughout the testing of the station most of the built in meters have had to be recalibrated at numerous occasions. At the end many sensors has been replaced with new types and the overall electrical noise in the station has been reduced to a point that the built-in measurements are more reliable than in the initial configuration. It is noted at this stage that much of the challenges regarding the built in meters seems to be related to some reduced experience from the manufacturer in designing variable operating point supplies. 3.19 Reflected Power Measurements
Initially upon delivery no built-in measurements on reflected power could be made by the station. There were two errors in the design of the reflected power measurements which required modifications. The first error was that the reflected power measurement range was set the same as the forward power with the same coupling factor used in the directional couplers. This meant that any normal operation reflected power was well below the measurement noise floor of the station. Even the desired values for reflected power interlocks were below the noise floor. The directional couplers were recalibrated to provide a proper dynamic range. The second error stemmed from the fact that forward and reflected power measurements had no RF filtering which at high power levels (at which the tube may exhibit significant harmonics) made caused measurement errors in forward and reflected power.
Figure 10. Lowpass filters added to stations directional couplers.
FREIA
Department of Physics and Astronomy
Uppsala University
- 17 / 46 -
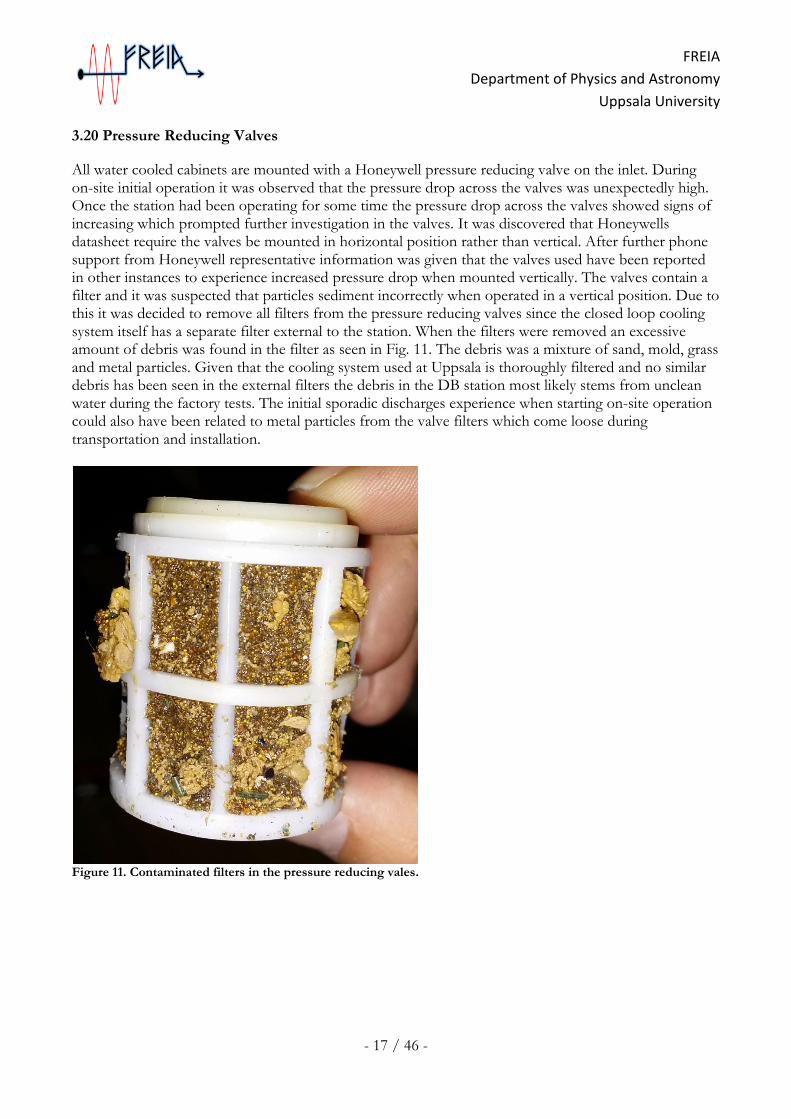
3.20 Pressure Reducing Valves
All water cooled cabinets are mounted with a Honeywell pressure reducing valve on the inlet. During on-site initial operation it was observed that the pressure drop across the valves was unexpectedly high. Once the station had been operating for some time the pressure drop across the valves showed signs of increasing which prompted further investigation in the valves. It was discovered that Honeywells datasheet require the valves be mounted in horizontal position rather than vertical. After further phone support from Honeywell representative information was given that the valves used have been reported in other instances to experience increased pressure drop when mounted vertically. The valves contain a filter and it was suspected that particles sediment incorrectly when operated in a vertical position. Due to this it was decided to remove all filters from the pressure reducing valves since the closed loop cooling system itself has a separate filter external to the station. When the filters were removed an excessive amount of debris was found in the filter as seen in Fig. 11. The debris was a mixture of sand, mold, grass and metal particles. Given that the cooling system used at Uppsala is thoroughly filtered and no similar debris has been seen in the external filters the debris in the DB station most likely stems from unclean water during the factory tests. The initial sporadic discharges experience when starting on-site operation could also have been related to metal particles from the valve filters which come loose during transportation and installation.
Figure 11. Contaminated filters in the pressure reducing vales.
FREIA
Department of Physics and Astronomy
Uppsala University
- 18 / 46 -
3.21 Anode RF Leakage Shielding
The original coaxial cabling used to connect the high-voltage capacitor bank to the tetrode anode had issues with the RF isolation of the outer conductor (ground). As such moderately high RF leakage levels were measured around the station in the range of +20 dBm which was considered a bit high due to the risk of high peak power in standing waves in the area around the station as well as potential leakage back into the station causing additional noise on the output. Therefor an additional shielded sleeve was installed around the anode conductor which reduced the RF leakage. It should be noted that the use of an additional RF shielding on the anode cable was already in use in the other 400 kW RF station in use in Freia (manufactured by Itelco-Electrosys) and in the latter case the choice to install additional RF shielding had already been made during manufacturing. 3.22 Final Documentation Took Long Time To Complete
The delivery of the final documentation for the station took almost one year from the time of the Factory Acceptance Test. One reason was that the multiple modifications performed to the station also required updates to be made to the documentation and another reason was due to the manufacturer had not clearly understood the tender specifications for the documentation which forced several iterations of additional work in order to complete the final documentation. Since the other modifications required for the acceptance of the station induced significant delays until the time of acceptance the final documentation was available at the same time as the station was finalized. 3.23 Excessive G2 Current in Station B
Significant debugging effort has went in trying to resolve an issue with excessive G2 current measured in the tetrode in station B which were running the spare tube S.N 755307. Given the large issues with measurement calibrations careful recalibration was performed multiple times in order to verify that no calibration error was present. Once the G2 current measurements were confirmed the cavity was re-tuned to verify the tuning state on both the input and output matching, however only small gains could be made by readjusting the calibration. All supply voltages were then checked for errors in calibration or set values and it was confirmed that all supply readings and set values were correct. Finally the spare tube used were replaced with the second TH595 spare tube S.N 751465 and baked for about 12 hours before being taken into operation. The new tube exhibited similar excessive G2 current. Whilst the original tube were running about 250 mA G2 current at 180 kW output power the spare tube was around 400 mA. Further readjustment of cavity tuning, supply voltages and hybrid balancing only had minor impact on the G2 current values. At this stage it was decided that the only way to be 100% certain that the issue lies in the spare tube and is not related to the station was to swap the position of tube 1 and 2. Both tubes were extracted from the cavities and the location exchanged. After the position had been swapped and tuning/operating points checked the spare tube, now being operated in the other amplifier section, still exhibited excessive G2 current. Further discussion with Thales regarding the performance of the tube were underway at the writing of the SAT report but until a solution had been found the total output of the station was limited to 360 kW. The maximum output power of the spare tube is 180 kW which puts the G2 power dissipation at the maximum value specified in the datasheet. Since the hybrid requires balanced input power the original tetrode must also be limited to 180 kW in order to have maximum output.
FREIA
Department of Physics and Astronomy
Uppsala University
- 19 / 46 -
After the SAT was completed and the report had been finalized Thales clarified the worries regarding the tube performance and it was found that the maximum limitations given in the datasheet for short pulses are mainly concerning pulse lengths in the order of 100 ms or longer. For very short pulses in the range of 3 ms slightly different requirements can be considered and for the maximum G2 power dissipation this means that the limiting factor is the RF dissipation in the screen-grid and the impact of the G2 DC current is negligible. The main contributions for the measured differences in the screen-grid currents between the different tubes are mechanical tolerances and the range of the variations measured were considered by Thales to be expected. 3.24 Filament Fan Switching Noise
In the original state the station experienced large electrical spikes when the filament fans were switched on. The induced noise from the fans as well as from the relays for the fans was severe enough to disrupt the remote connection to the station. This caused an outage in remote contact with the station each time the filaments power supplies were turned on to start ramping up the filament voltage. In order to prevent any communication losses with the station additional filters were installed on the fan engines and a better relays for engaging the fan engines were installed as well. Once these two modifications were performed no further loss of communication caused by engaging the filament fans could be detected.
FREIA
Department of Physics and Astronomy
Uppsala University
- 20 / 46 -
4. 0Power Supplies The RF station power supplies were thoroughly evaluated as part of the on-site acceptance test. The
performance both during idle operation as well as in the output power range 40kW to 360kW were
recorded and are presented in the following sections. Maximum output power was limited to 360 kW
due to the G2 currents mentioned in section 3.23.
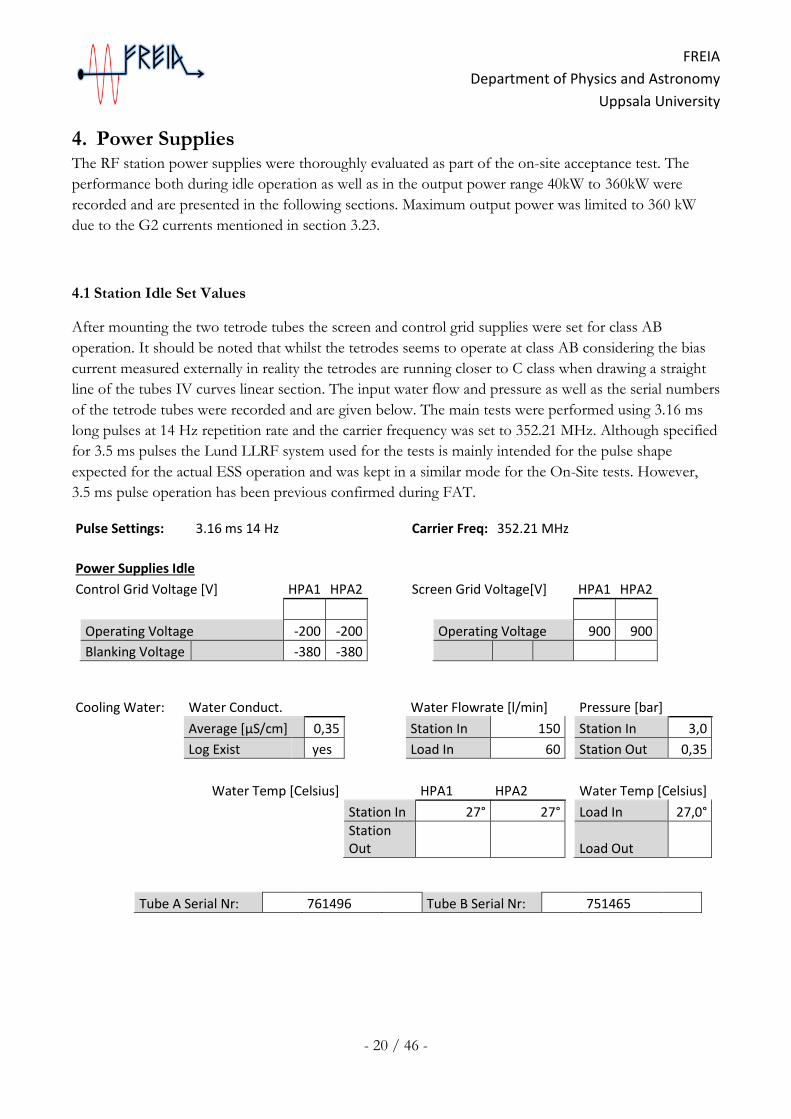
4.1 Station Idle Set Values
After mounting the two tetrode tubes the screen and control grid supplies were set for class AB
operation. It should be noted that whilst the tetrodes seems to operate at class AB considering the bias
current measured externally in reality the tetrodes are running closer to C class when drawing a straight
line of the tubes IV curves linear section. The input water flow and pressure as well as the serial numbers
of the tetrode tubes were recorded and are given below. The main tests were performed using 3.16 ms
long pulses at 14 Hz repetition rate and the carrier frequency was set to 352.21 MHz. Although specified
for 3.5 ms pulses the Lund LLRF system used for the tests is mainly intended for the pulse shape
expected for the actual ESS operation and was kept in a similar mode for the On-Site tests. However,
3.5 ms pulse operation has been previous confirmed during FAT.
Pulse Settings: 3.16 ms 14 Hz
Carrier Freq: 352.21 MHz
Power Supplies Idle Control Grid Voltage [V] HPA1 HPA2
Screen Grid Voltage[V] HPA1 HPA2
Operating Voltage -200 -200
Operating Voltage 900 900
Blanking Voltage -380 -380
Cooling Water: Water Conduct.
Water Flowrate [l/min] Pressure [bar]
Average [μS/cm] 0,35
Station In 150
Station In 3,0
Log Exist yes
Load In 60
Station Out 0,35
Water Temp [Celsius]
HPA1 HPA2
Water Temp [Celsius]
Station In 27° 27°
Load In 27,0°
Station Out
Load Out
Tube A Serial Nr: 761496 Tube B Serial Nr: 751465
FREIA
Department of Physics and Astronomy
Uppsala University
- 21 / 46 -
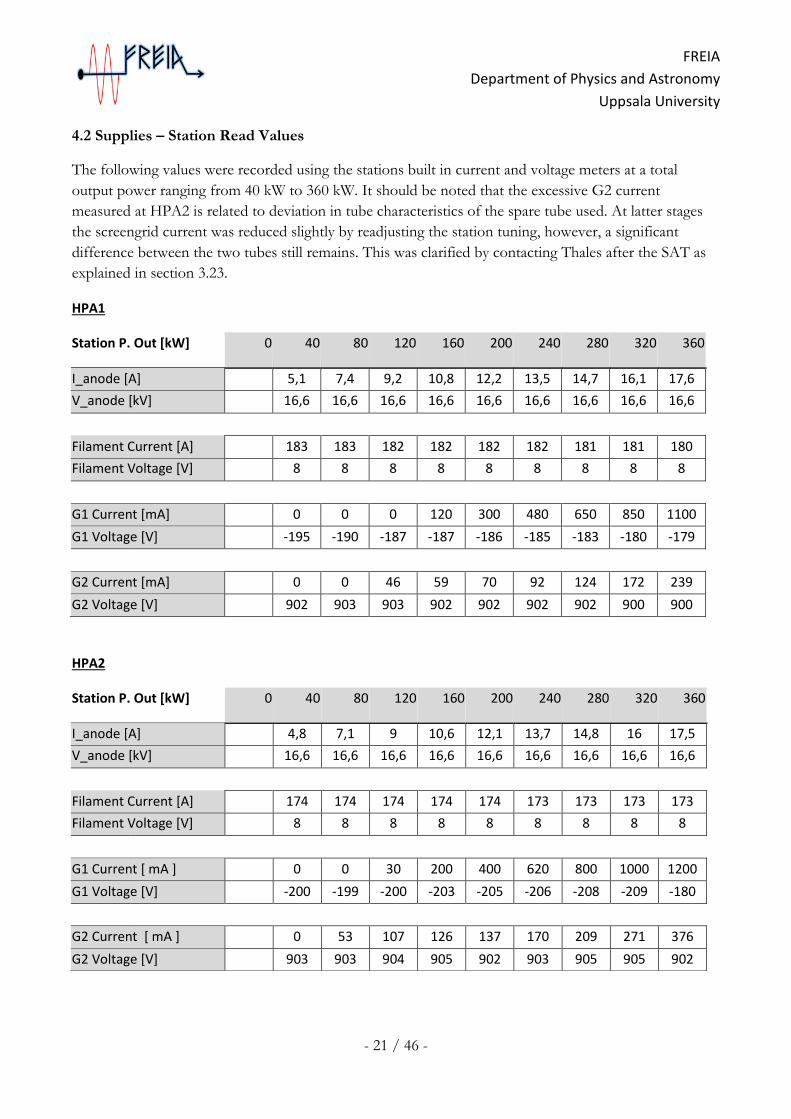
4.2 Supplies – Station Read Values
The following values were recorded using the stations built in current and voltage meters at a total
output power ranging from 40 kW to 360 kW. It should be noted that the excessive G2 current
measured at HPA2 is related to deviation in tube characteristics of the spare tube used. At latter stages
the screengrid current was reduced slightly by readjusting the station tuning, however, a significant
difference between the two tubes still remains. This was clarified by contacting Thales after the SAT as
explained in section 3.23.
HPA1
Station P. Out [kW] 0 40 80 120 160 200 240 280 320 360
I_anode [A] 5,1 7,4 9,2 10,8 12,2 13,5 14,7 16,1 17,6
V_anode [kV] 16,6 16,6 16,6 16,6 16,6 16,6 16,6 16,6 16,6
Filament Current [A] 183 183 182 182 182 182 181 181 180
Filament Voltage [V] 8 8 8 8 8 8 8 8 8
G1 Current [mA] 0 0 0 120 300 480 650 850 1100
G1 Voltage [V] -195 -190 -187 -187 -186 -185 -183 -180 -179
G2 Current [mA] 0 0 46 59 70 92 124 172 239
G2 Voltage [V] 902 903 903 902 902 902 902 900 900
HPA2
Station P. Out [kW] 0 40 80 120 160 200 240 280 320 360
I_anode [A] 4,8 7,1 9 10,6 12,1 13,7 14,8 16 17,5
V_anode [kV] 16,6 16,6 16,6 16,6 16,6 16,6 16,6 16,6 16,6
Filament Current [A] 174 174 174 174 174 173 173 173 173
Filament Voltage [V] 8 8 8 8 8 8 8 8 8
G1 Current [ mA ] 0 0 30 200 400 620 800 1000 1200
G1 Voltage [V] -200 -199 -200 -203 -205 -206 -208 -209 -180
G2 Current [ mA ] 0 53 107 126 137 170 209 271 376
G2 Voltage [V] 903 903 904 905 902 903 905 905 902
FREIA
Department of Physics and Astronomy
Uppsala University
- 22 / 46 -
4.3 Control Grid Voltage and Current
The voltage and current variation of both control grid supplies were measured during the pulse for the
complete power range of 40 kW to 360 kW. In order to measure the voltage and current of the control
grid power supplies a Rigol DS4054 scope was connected to the stations BNC connectors included for
measurements of control grid voltages. Once measurement sensor had been calibrated no significant
issues with the G1 performance could be seen.
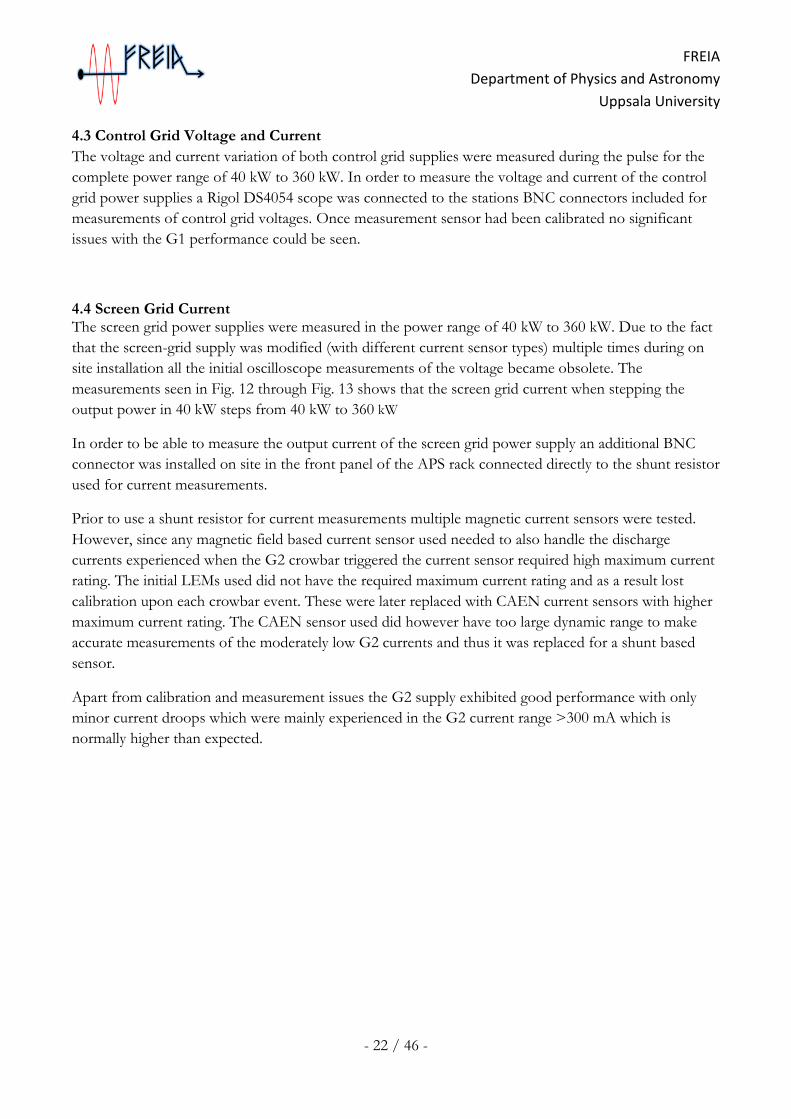
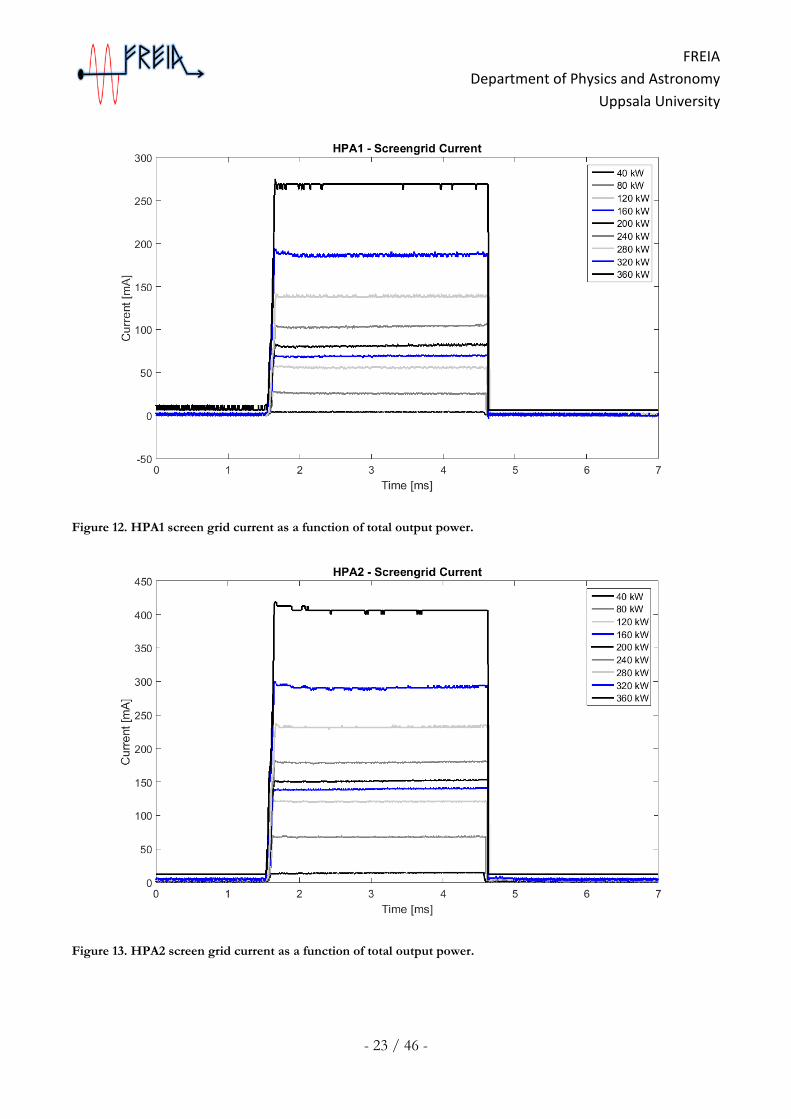
4.4 Screen Grid Current The screen grid power supplies were measured in the power range of 40 kW to 360 kW. Due to the fact
that the screen-grid supply was modified (with different current sensor types) multiple times during on
site installation all the initial oscilloscope measurements of the voltage became obsolete. The
measurements seen in Fig. 12 through Fig. 13 shows that the screen grid current when stepping the
output power in 40 kW steps from 40 kW to 360 kW
In order to be able to measure the output current of the screen grid power supply an additional BNC
connector was installed on site in the front panel of the APS rack connected directly to the shunt resistor
used for current measurements.
Prior to use a shunt resistor for current measurements multiple magnetic current sensors were tested.
However, since any magnetic field based current sensor used needed to also handle the discharge
currents experienced when the G2 crowbar triggered the current sensor required high maximum current
rating. The initial LEMs used did not have the required maximum current rating and as a result lost
calibration upon each crowbar event. These were later replaced with CAEN current sensors with higher
maximum current rating. The CAEN sensor used did however have too large dynamic range to make
accurate measurements of the moderately low G2 currents and thus it was replaced for a shunt based
sensor.
Apart from calibration and measurement issues the G2 supply exhibited good performance with only
minor current droops which were mainly experienced in the G2 current range >300 mA which is
normally higher than expected.
FREIA
Department of Physics and Astronomy
Uppsala University
- 23 / 46 -
Figure 12. HPA1 screen grid current as a function of total output power.
Figure 13. HPA2 screen grid current as a function of total output power.
FREIA
Department of Physics and Astronomy
Uppsala University
- 24 / 46 -
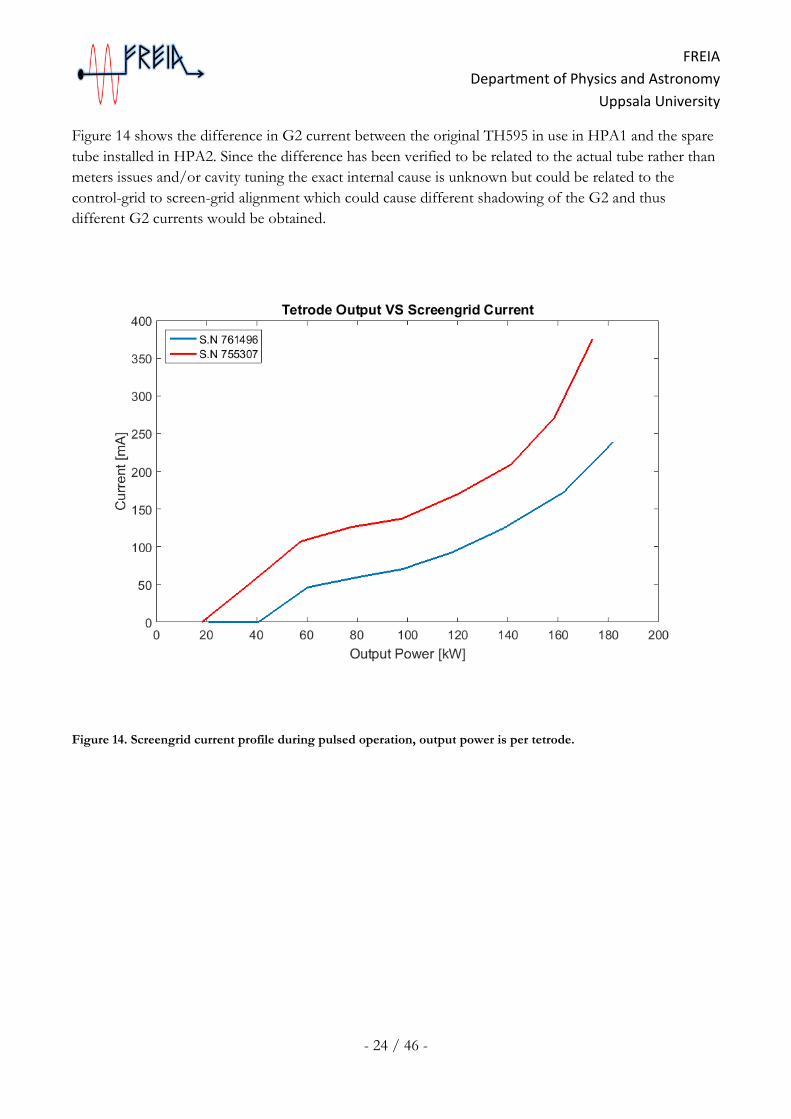
Figure 14 shows the difference in G2 current between the original TH595 in use in HPA1 and the spare
tube installed in HPA2. Since the difference has been verified to be related to the actual tube rather than
meters issues and/or cavity tuning the exact internal cause is unknown but could be related to the
control-grid to screen-grid alignment which could cause different shadowing of the G2 and thus
different G2 currents would be obtained.
Figure 14. Screengrid current profile during pulsed operation, output power is per tetrode.
FREIA
Department of Physics and Astronomy
Uppsala University
- 25 / 46 -
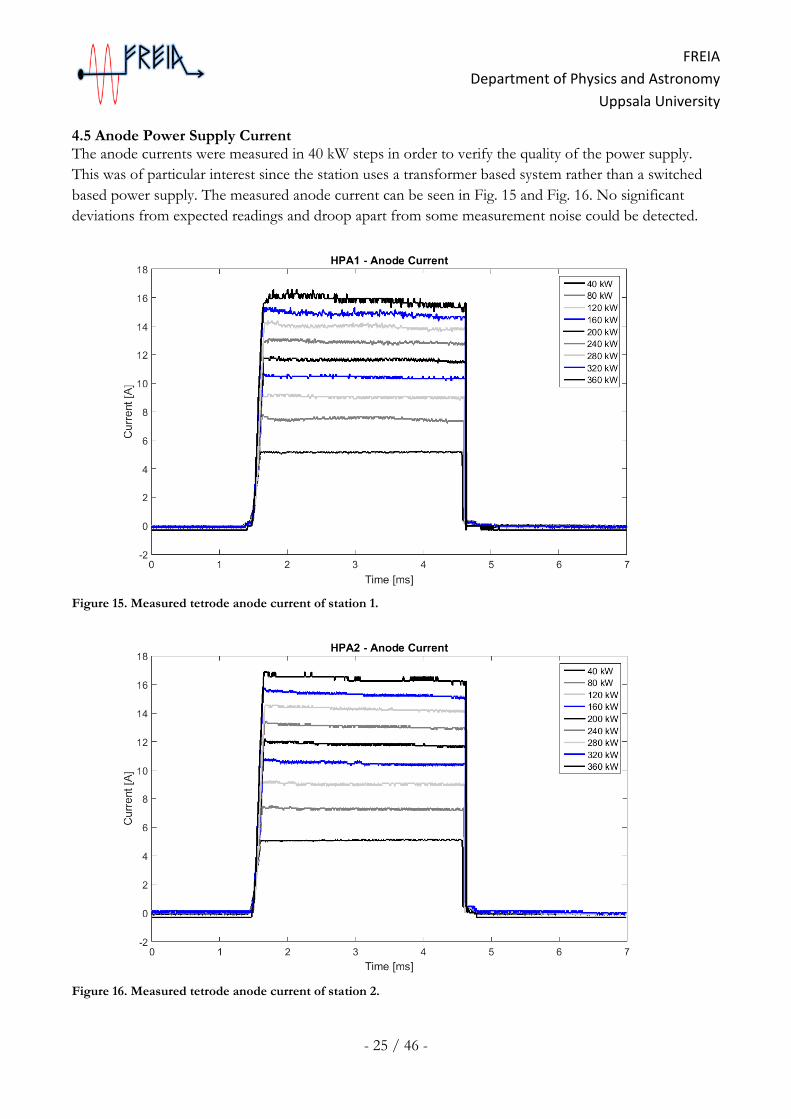
4.5 Anode Power Supply Current The anode currents were measured in 40 kW steps in order to verify the quality of the power supply.
This was of particular interest since the station uses a transformer based system rather than a switched
based power supply. The measured anode current can be seen in Fig. 15 and Fig. 16. No significant
deviations from expected readings and droop apart from some measurement noise could be detected.
Figure 15. Measured tetrode anode current of station 1.
Figure 16. Measured tetrode anode current of station 2.
FREIA
Department of Physics and Astronomy
Uppsala University
- 26 / 46 -
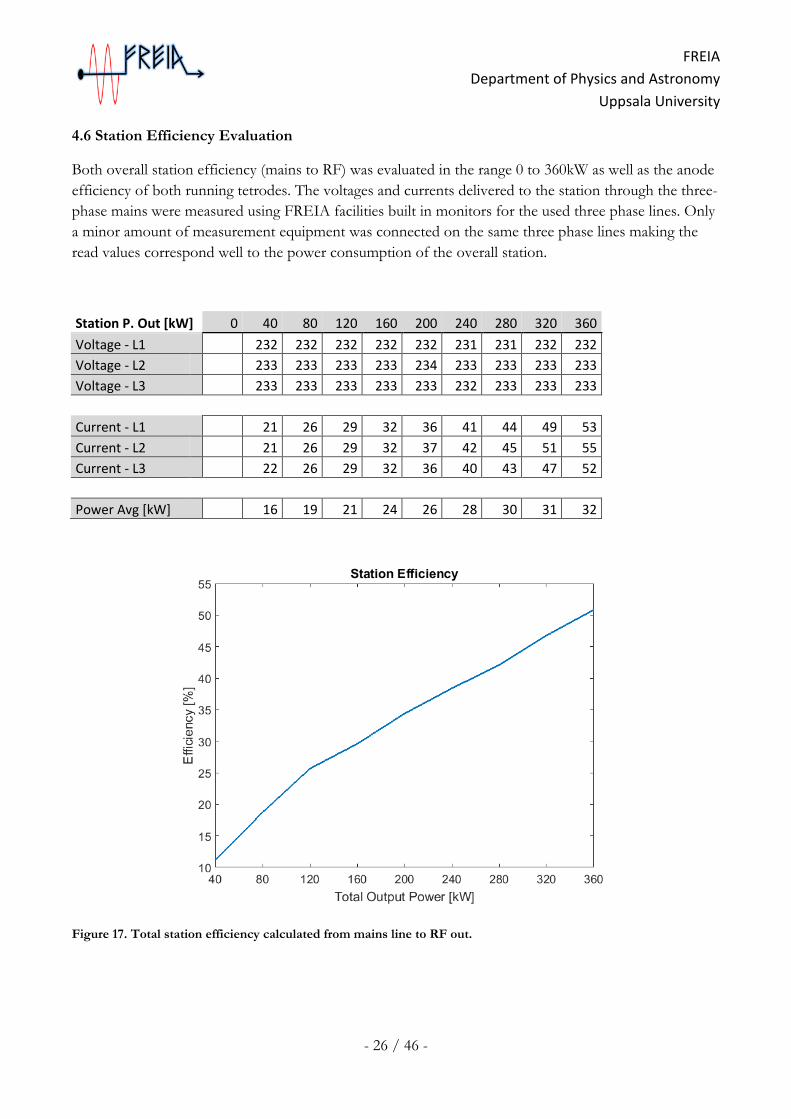
4.6 Station Efficiency Evaluation
Both overall station efficiency (mains to RF) was evaluated in the range 0 to 360kW as well as the anode
efficiency of both running tetrodes. The voltages and currents delivered to the station through the three-
phase mains were measured using FREIA facilities built in monitors for the used three phase lines. Only
a minor amount of measurement equipment was connected on the same three phase lines making the
read values correspond well to the power consumption of the overall station.
Station P. Out [kW] 0 40 80 120 160 200 240 280 320 360
Voltage - L1 232 232 232 232 232 231 231 232 232
Voltage - L2 233 233 233 233 234 233 233 233 233
Voltage - L3 233 233 233 233 233 232 233 233 233
Current - L1 21 26 29 32 36 41 44 49 53
Current - L2 21 26 29 32 37 42 45 51 55
Current - L3 22 26 29 32 36 40 43 47 52
Power Avg [kW] 16 19 21 24 26 28 30 31 32
Figure 17. Total station efficiency calculated from mains line to RF out.
FREIA
Department of Physics and Astronomy
Uppsala University
- 27 / 46 -
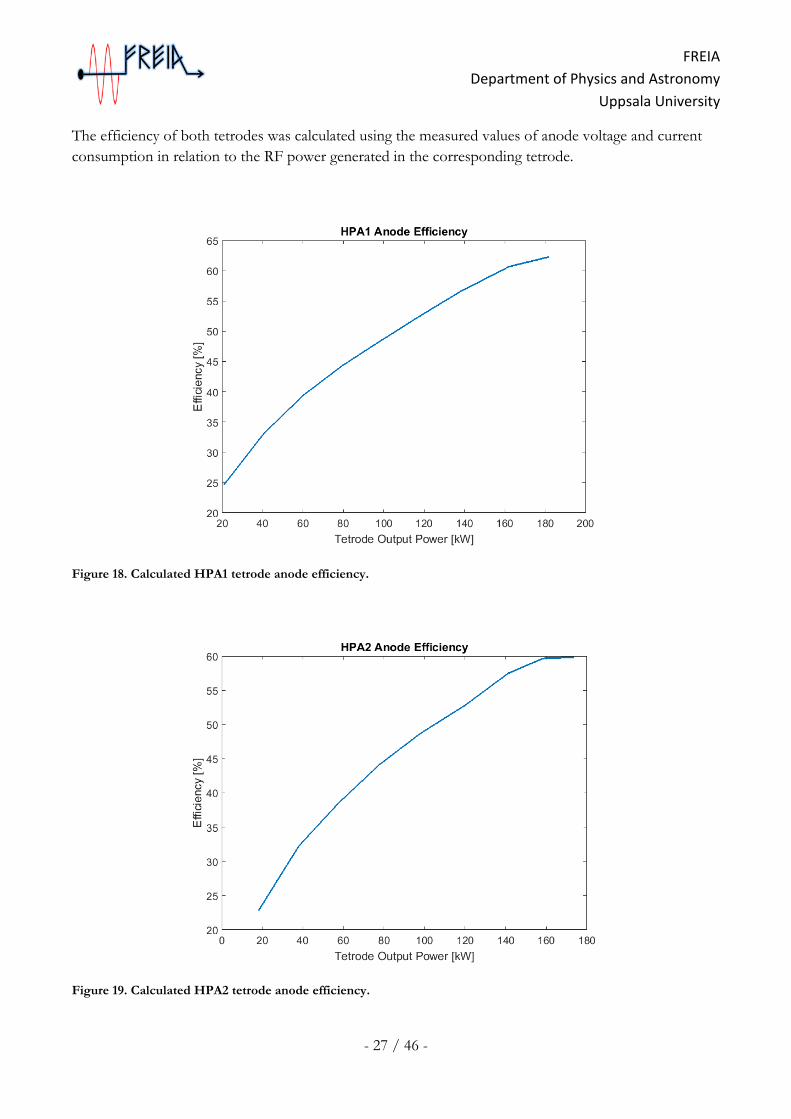
The efficiency of both tetrodes was calculated using the measured values of anode voltage and current
consumption in relation to the RF power generated in the corresponding tetrode.
Figure 18. Calculated HPA1 tetrode anode efficiency.
Figure 19. Calculated HPA2 tetrode anode efficiency.
FREIA
Department of Physics and Astronomy
Uppsala University
- 28 / 46 -
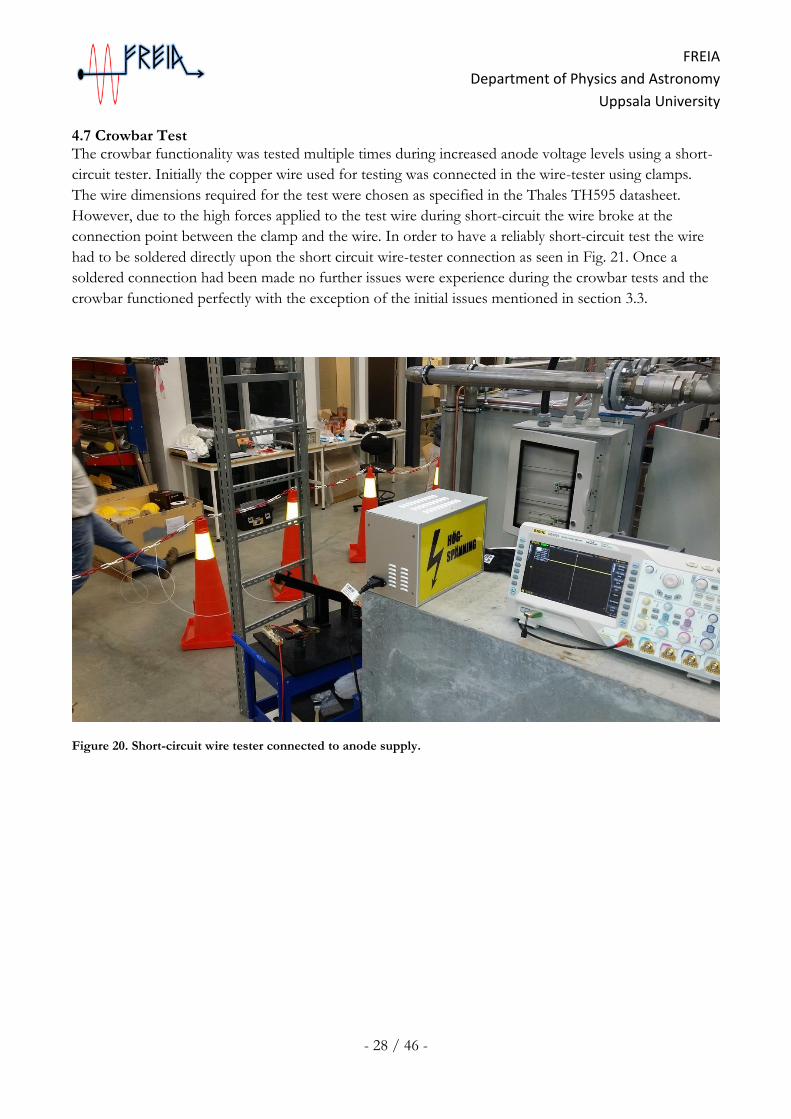
4.7 Crowbar Test The crowbar functionality was tested multiple times during increased anode voltage levels using a short-
circuit tester. Initially the copper wire used for testing was connected in the wire-tester using clamps.
The wire dimensions required for the test were chosen as specified in the Thales TH595 datasheet.
However, due to the high forces applied to the test wire during short-circuit the wire broke at the
connection point between the clamp and the wire. In order to have a reliably short-circuit test the wire
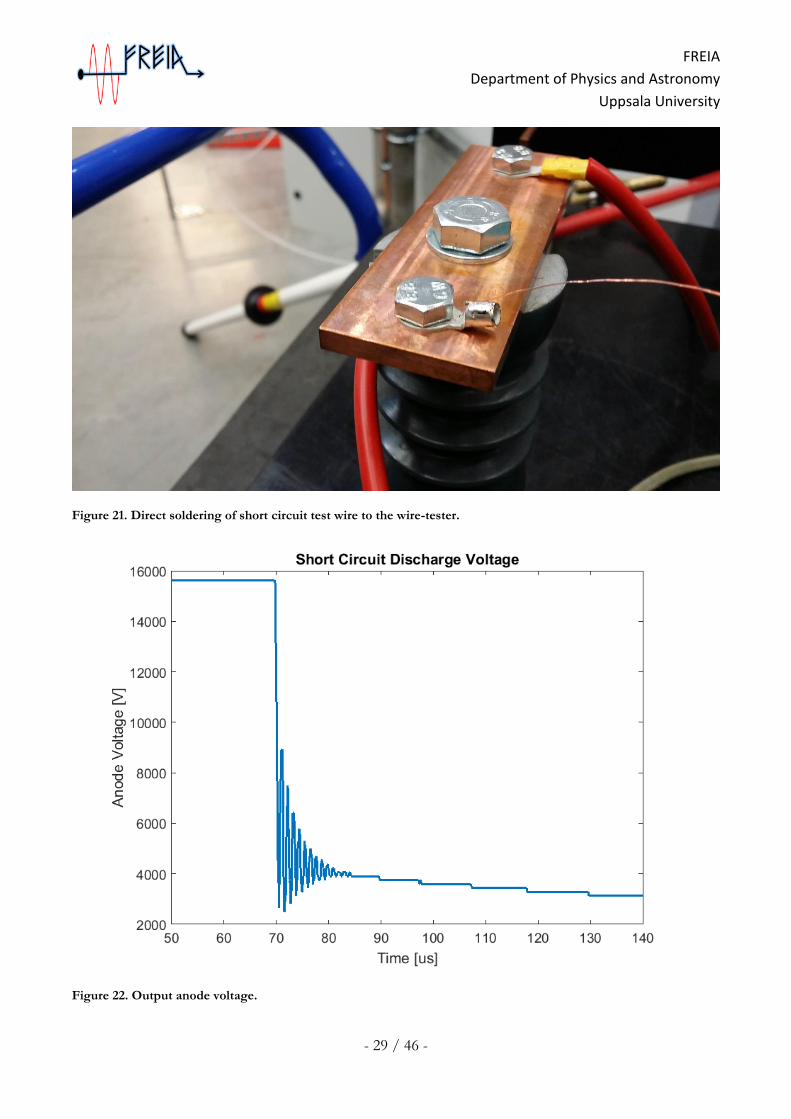
had to be soldered directly upon the short circuit wire-tester connection as seen in Fig. 21. Once a
soldered connection had been made no further issues were experience during the crowbar tests and the
crowbar functioned perfectly with the exception of the initial issues mentioned in section 3.3.
Figure 20. Short-circuit wire tester connected to anode supply.
FREIA
Department of Physics and Astronomy
Uppsala University
- 29 / 46 -
Figure 21. Direct soldering of short circuit test wire to the wire-tester.
Figure 22. Output anode voltage.
FREIA
Department of Physics and Astronomy
Uppsala University
- 30 / 46 -
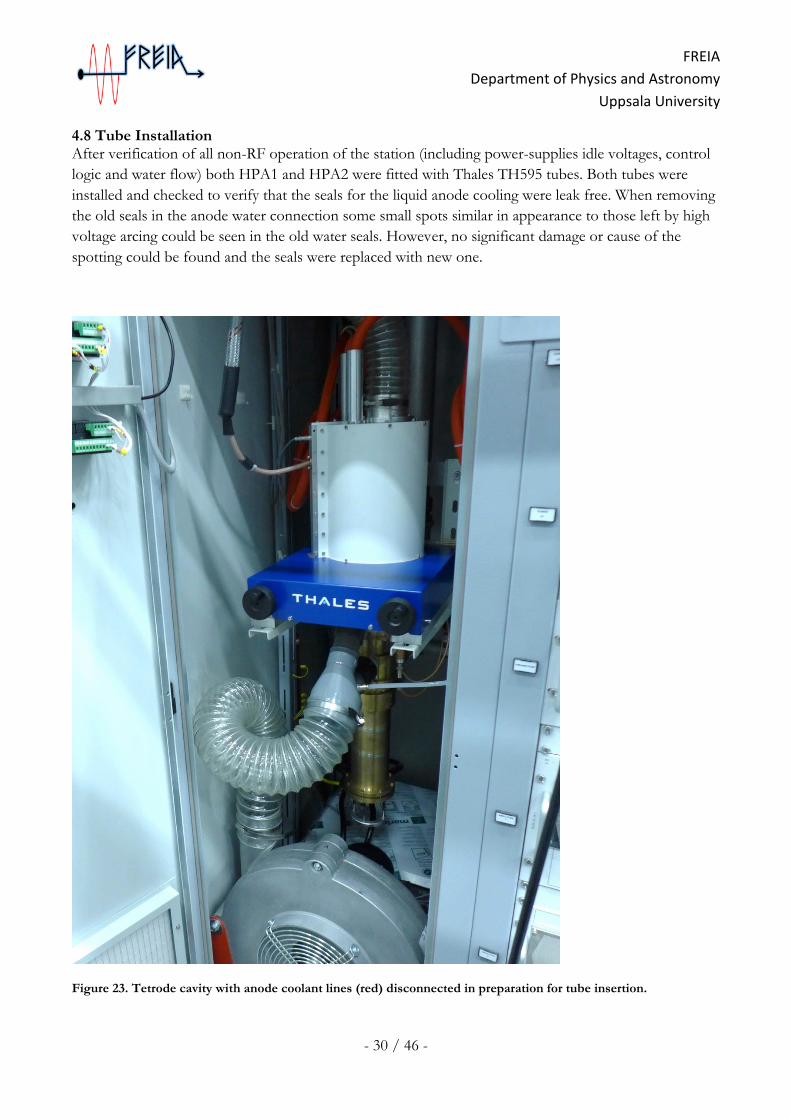
4.8 Tube Installation After verification of all non-RF operation of the station (including power-supplies idle voltages, control
logic and water flow) both HPA1 and HPA2 were fitted with Thales TH595 tubes. Both tubes were
installed and checked to verify that the seals for the liquid anode cooling were leak free. When removing
the old seals in the anode water connection some small spots similar in appearance to those left by high
voltage arcing could be seen in the old water seals. However, no significant damage or cause of the
spotting could be found and the seals were replaced with new one.
Figure 23. Tetrode cavity with anode coolant lines (red) disconnected in preparation for tube insertion.
FREIA
Department of Physics and Astronomy
Uppsala University
- 31 / 46 -
4.9 LLRF System
In order to run the station in pulsed mode a blanking pulse synchronized to the input RF pulse was
required as well. For all on-site measurements a LLRF system in development for ESS was being used.
By design this system supported a maximum pulse width of 3.16 ms and as a result all test measurements
were performed using this pulse width.
FREIA
Department of Physics and Astronomy
Uppsala University
- 32 / 46 -
5. RF Characteristics The RF characteristics of the station were evaluated for the complete total power range of 40 kW to
360 kW. Measured parameters were primarily measured using a Rigol DS4045 Oscilloscope , Rigol
DSA815 spectrum analyzer and Agilent XX power-meter. Measurement cable calibrations were
performed using a Keysight Fieldfox network analyzer. The measured results are presented below.
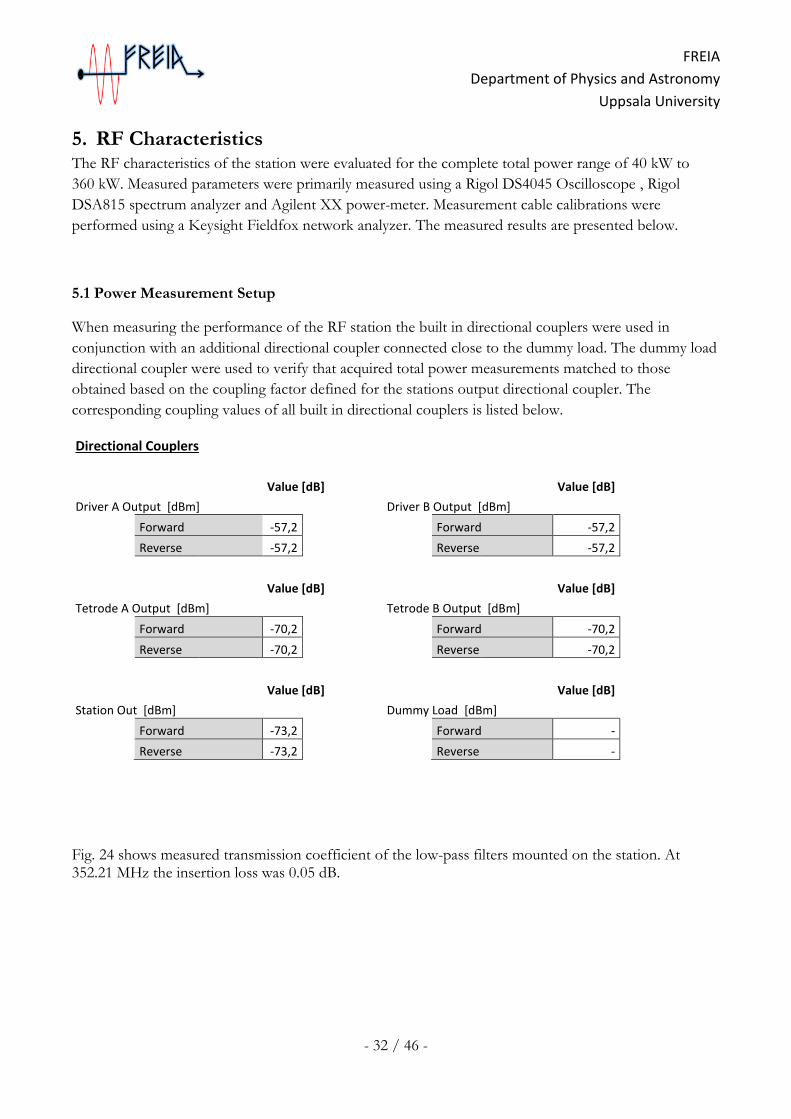
5.1 Power Measurement Setup
When measuring the performance of the RF station the built in directional couplers were used in
conjunction with an additional directional coupler connected close to the dummy load. The dummy load
directional coupler were used to verify that acquired total power measurements matched to those
obtained based on the coupling factor defined for the stations output directional coupler. The
corresponding coupling values of all built in directional couplers is listed below.
Directional Couplers
Value [dB]
Value [dB]
Driver A Output [dBm]
Driver B Output [dBm]
Forward -57,2
Forward -57,2
Reverse -57,2
Reverse -57,2
Value [dB]
Value [dB]
Tetrode A Output [dBm]
Tetrode B Output [dBm]
Forward -70,2
Forward -70,2
Reverse -70,2
Reverse -70,2
Value [dB]
Value [dB]
Station Out [dBm]
Dummy Load [dBm]
Forward -73,2
Forward -
Reverse -73,2
Reverse -
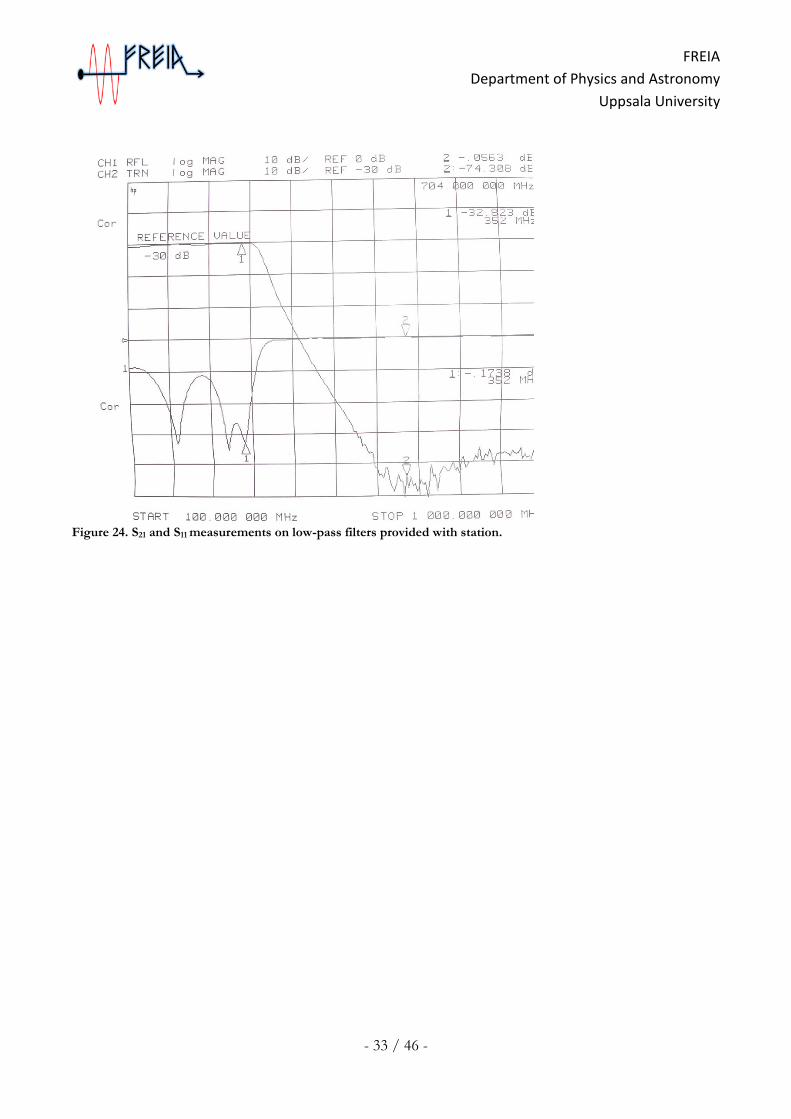
Fig. 24 shows measured transmission coefficient of the low-pass filters mounted on the station. At 352.21 MHz the insertion loss was 0.05 dB.
FREIA
Department of Physics and Astronomy
Uppsala University
- 33 / 46 -
Figure 24. S21 and S11 measurements on low-pass filters provided with station.
FREIA
Department of Physics and Astronomy
Uppsala University
- 34 / 46 -
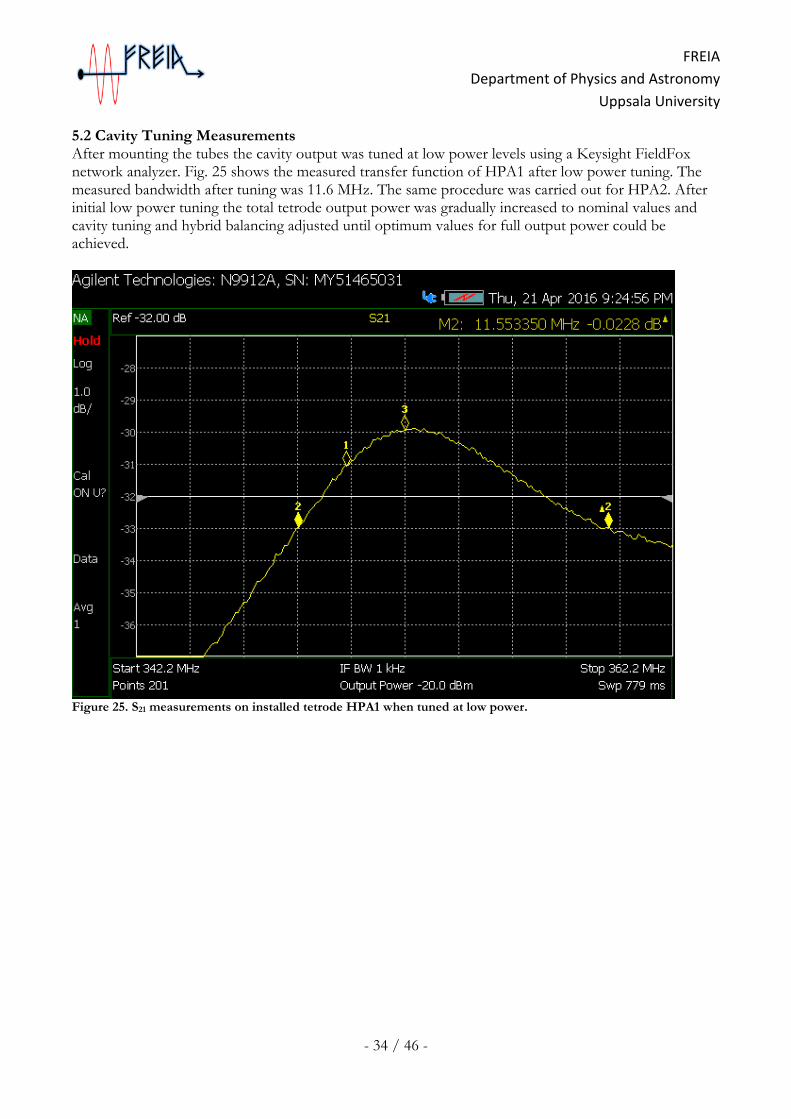
5.2 Cavity Tuning Measurements After mounting the tubes the cavity output was tuned at low power levels using a Keysight FieldFox network analyzer. Fig. 25 shows the measured transfer function of HPA1 after low power tuning. The measured bandwidth after tuning was 11.6 MHz. The same procedure was carried out for HPA2. After initial low power tuning the total tetrode output power was gradually increased to nominal values and cavity tuning and hybrid balancing adjusted until optimum values for full output power could be achieved.
Figure 25. S21 measurements on installed tetrode HPA1 when tuned at low power.
FREIA
Department of Physics and Astronomy
Uppsala University
- 35 / 46 -
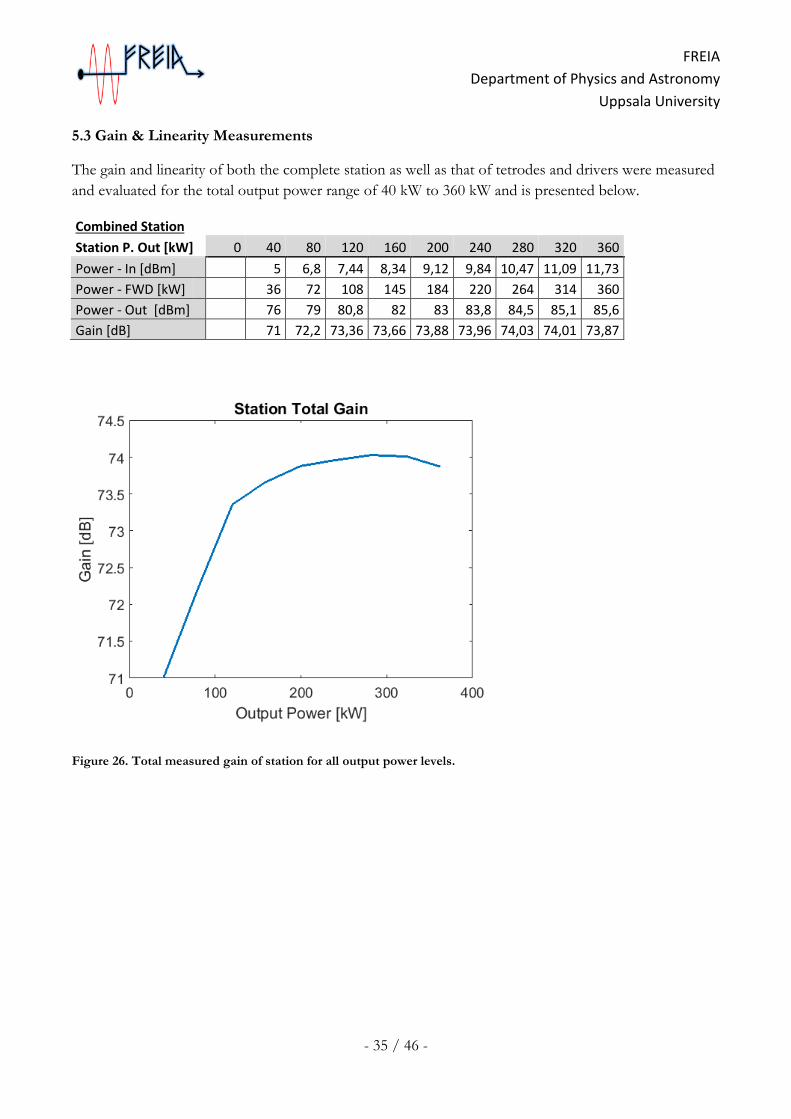
5.3 Gain & Linearity Measurements
The gain and linearity of both the complete station as well as that of tetrodes and drivers were measured
and evaluated for the total output power range of 40 kW to 360 kW and is presented below.
Combined Station Station P. Out [kW] 0 40 80 120 160 200 240 280 320 360
Power - In [dBm]
5 6,8 7,44 8,34 9,12 9,84 10,47 11,09 11,73
Power - FWD [kW] 36 72 108 145 184 220 264 314 360
Power - Out [dBm] 76 79 80,8 82 83 83,8 84,5 85,1 85,6
Gain [dB] 71 72,2 73,36 73,66 73,88 73,96 74,03 74,01 73,87
Figure 26. Total measured gain of station for all output power levels.
FREIA
Department of Physics and Astronomy
Uppsala University
- 36 / 46 -
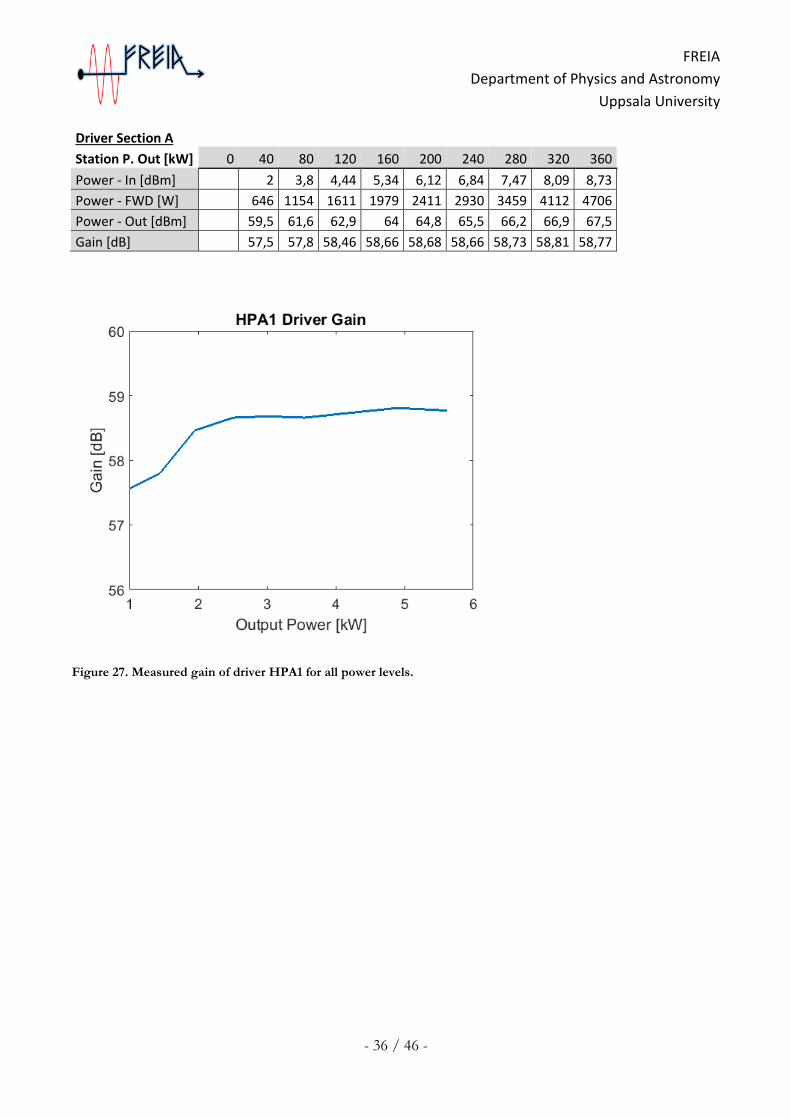
Driver Section A Station P. Out [kW] 0 40 80 120 160 200 240 280 320 360
Power - In [dBm] 2 3,8 4,44 5,34 6,12 6,84 7,47 8,09 8,73
Power - FWD [W] 646 1154 1611 1979 2411 2930 3459 4112 4706
Power - Out [dBm] 59,5 61,6 62,9 64 64,8 65,5 66,2 66,9 67,5
Gain [dB] 57,5 57,8 58,46 58,66 58,68 58,66 58,73 58,81 58,77
Figure 27. Measured gain of driver HPA1 for all power levels.
FREIA
Department of Physics and Astronomy
Uppsala University
- 37 / 46 -
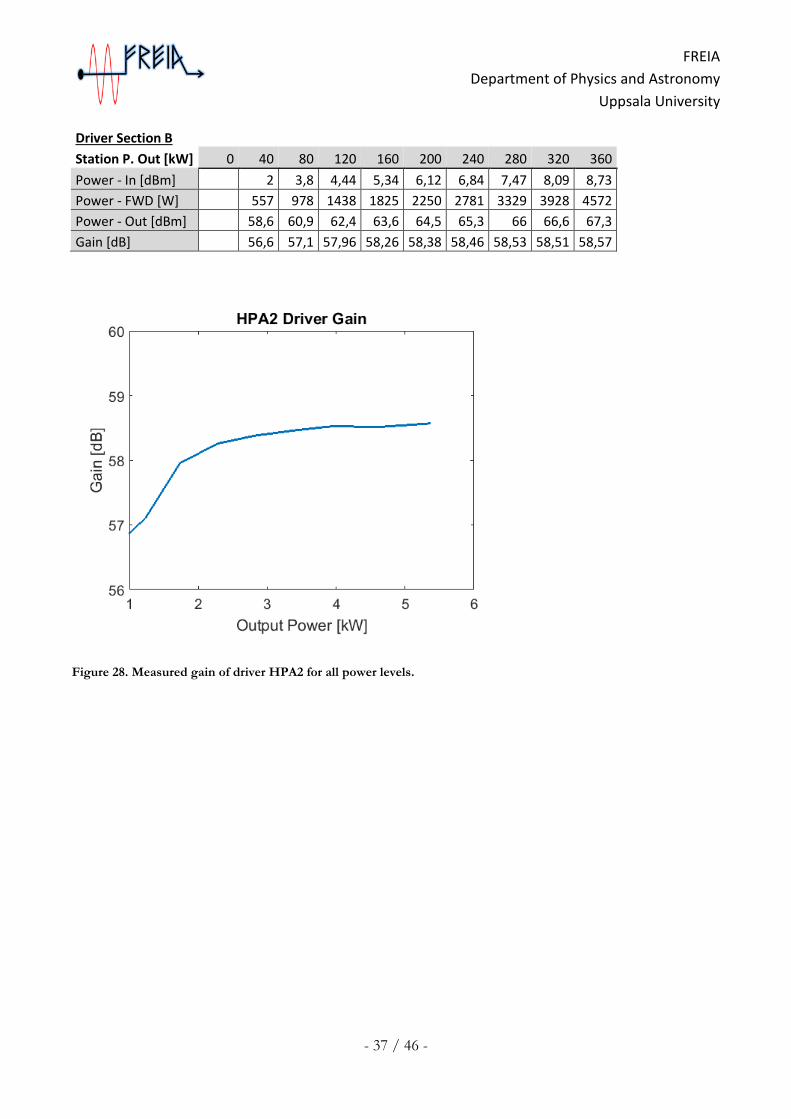
Driver Section B Station P. Out [kW] 0 40 80 120 160 200 240 280 320 360
Power - In [dBm] 2 3,8 4,44 5,34 6,12 6,84 7,47 8,09 8,73
Power - FWD [W] 557 978 1438 1825 2250 2781 3329 3928 4572
Power - Out [dBm] 58,6 60,9 62,4 63,6 64,5 65,3 66 66,6 67,3
Gain [dB] 56,6 57,1 57,96 58,26 58,38 58,46 58,53 58,51 58,57
Figure 28. Measured gain of driver HPA2 for all power levels.
FREIA
Department of Physics and Astronomy
Uppsala University
- 38 / 46 -
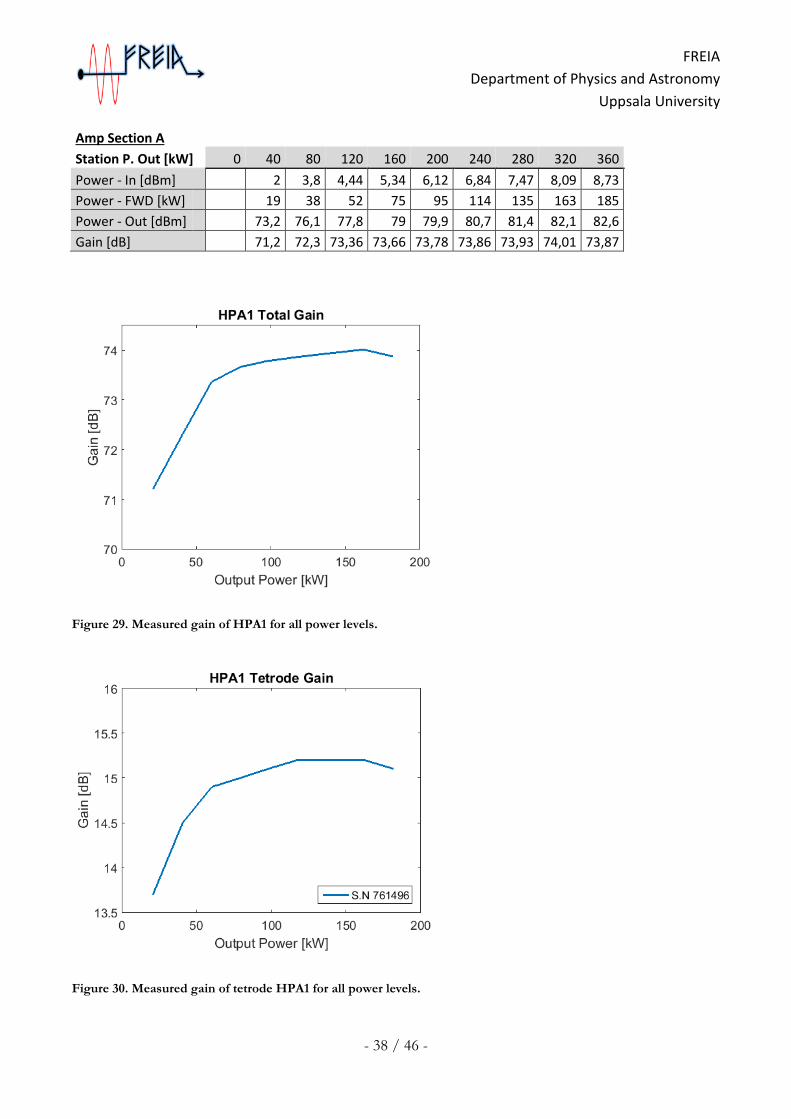
Amp Section A Station P. Out [kW] 0 40 80 120 160 200 240 280 320 360
Power - In [dBm] 2 3,8 4,44 5,34 6,12 6,84 7,47 8,09 8,73
Power - FWD [kW] 19 38 52 75 95 114 135 163 185
Power - Out [dBm] 73,2 76,1 77,8 79 79,9 80,7 81,4 82,1 82,6
Gain [dB] 71,2 72,3 73,36 73,66 73,78 73,86 73,93 74,01 73,87
Figure 29. Measured gain of HPA1 for all power levels.
Figure 30. Measured gain of tetrode HPA1 for all power levels.
FREIA
Department of Physics and Astronomy
Uppsala University
- 39 / 46 -
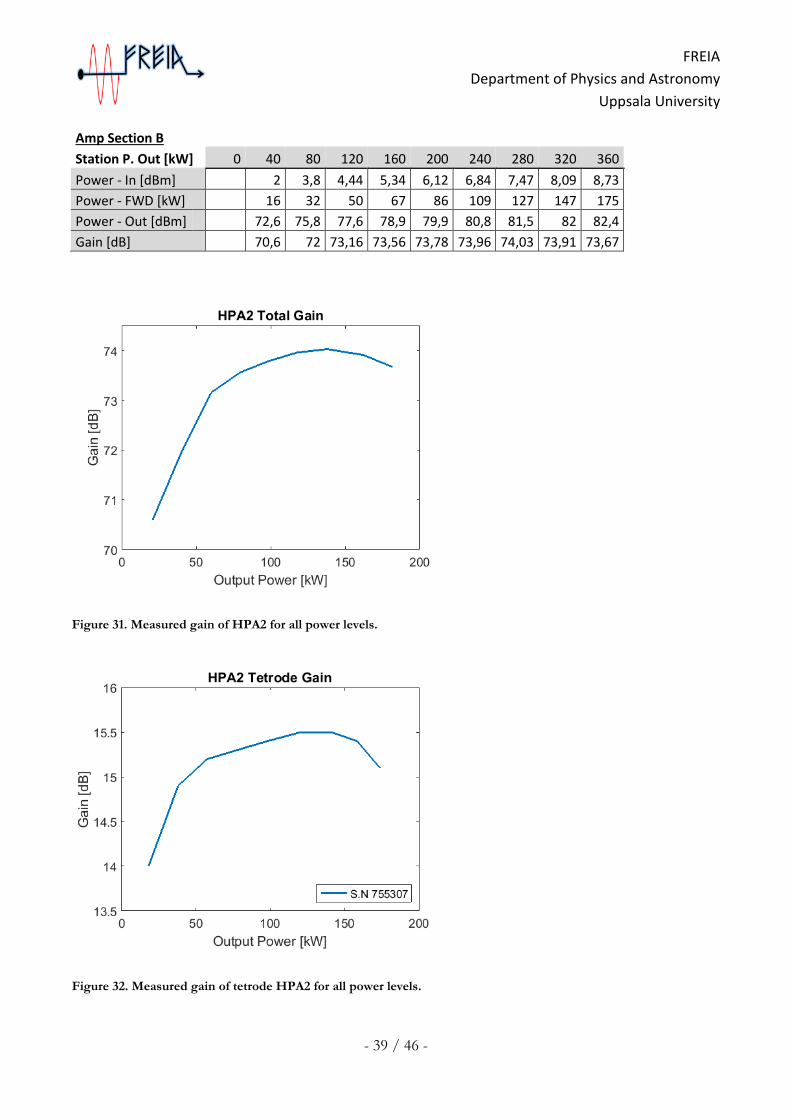
Amp Section B Station P. Out [kW] 0 40 80 120 160 200 240 280 320 360
Power - In [dBm] 2 3,8 4,44 5,34 6,12 6,84 7,47 8,09 8,73
Power - FWD [kW] 16 32 50 67 86 109 127 147 175
Power - Out [dBm] 72,6 75,8 77,6 78,9 79,9 80,8 81,5 82 82,4
Gain [dB] 70,6 72 73,16 73,56 73,78 73,96 74,03 73,91 73,67
Figure 31. Measured gain of HPA2 for all power levels.
Figure 32. Measured gain of tetrode HPA2 for all power levels.
FREIA
Department of Physics and Astronomy
Uppsala University
- 40 / 46 -
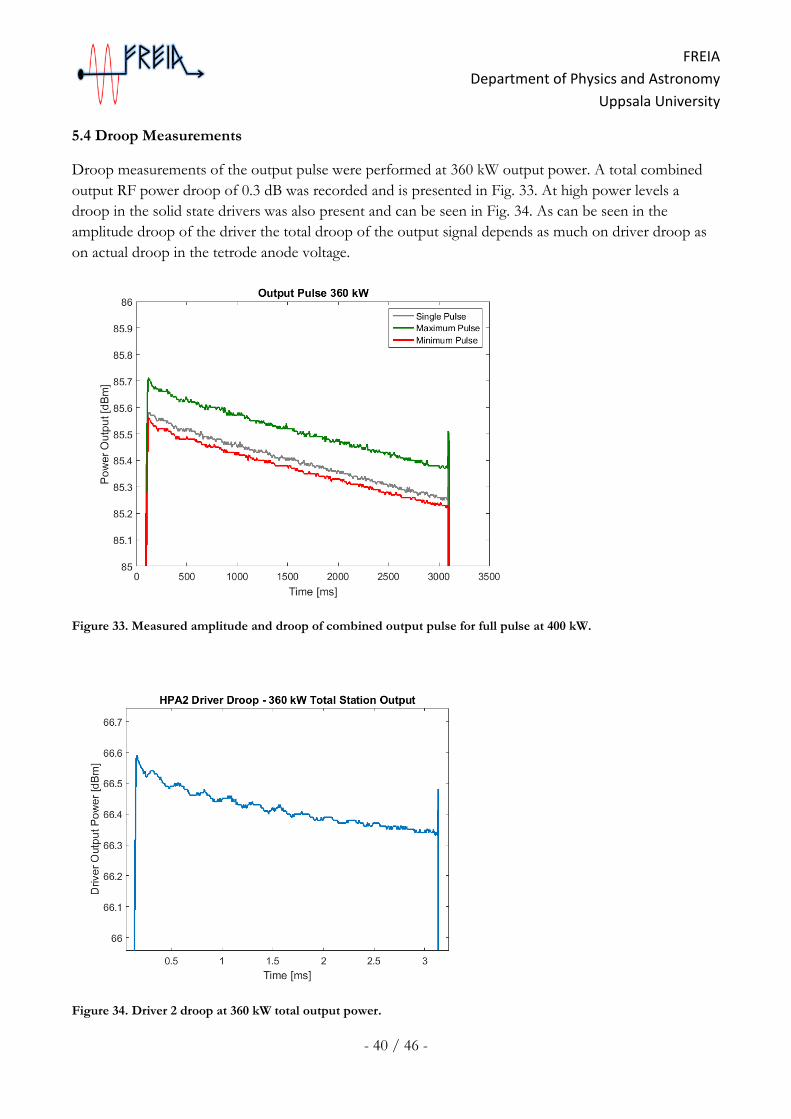
5.4 Droop Measurements
Droop measurements of the output pulse were performed at 360 kW output power. A total combined
output RF power droop of 0.3 dB was recorded and is presented in Fig. 33. At high power levels a
droop in the solid state drivers was also present and can be seen in Fig. 34. As can be seen in the
amplitude droop of the driver the total droop of the output signal depends as much on driver droop as
on actual droop in the tetrode anode voltage.
Figure 33. Measured amplitude and droop of combined output pulse for full pulse at 400 kW.
Figure 34. Driver 2 droop at 360 kW total output power.
FREIA
Department of Physics and Astronomy
Uppsala University
- 41 / 46 -
5.5 Bandwidth at 360 kW
Since the LLRF system used to carry out all on-site tests did not have a straight forward way to do
frequency sweep measurements no additional bandwidth measurements were performed on-site.
However, bandwidth has been verified both during factory tests and on the other station delivered to
Uppsala by Itelco-Electrosys which uses the exact same tetrode and tetrode-cavity as the DB station and
as such any deviations possible in the DB station would be minor deviations caused by differences in
cavity tuning. If the tuning state of the cavities is such that any application would have issues with
bandwidth limitations retuning of the tetrode cavities will be able to compensate over any foreseeable
output frequency.
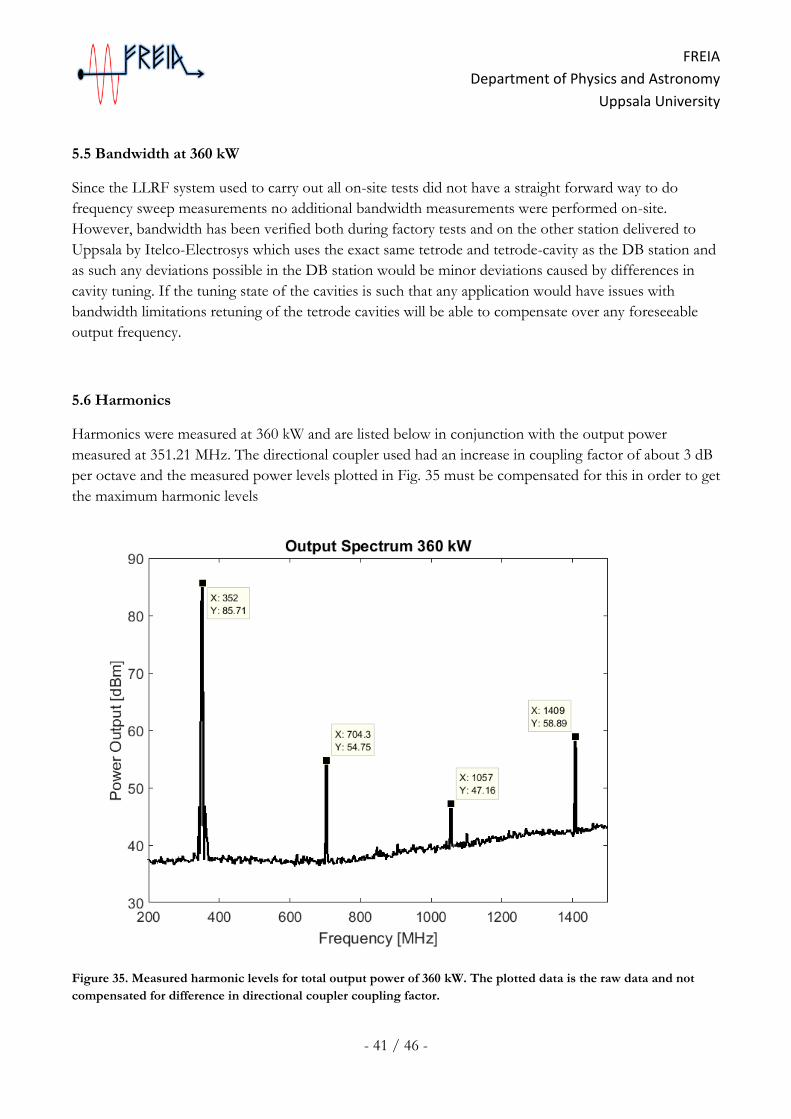
5.6 Harmonics
Harmonics were measured at 360 kW and are listed below in conjunction with the output power
measured at 351.21 MHz. The directional coupler used had an increase in coupling factor of about 3 dB
per octave and the measured power levels plotted in Fig. 35 must be compensated for this in order to get
the maximum harmonic levels
Figure 35. Measured harmonic levels for total output power of 360 kW. The plotted data is the raw data and not
compensated for difference in directional coupler coupling factor.
FREIA
Department of Physics and Astronomy
Uppsala University
- 42 / 46 -
The measured harmonic levels adjusted for the change in coupling factor of the directional coupler are
listed below
Frequency [MHz] 352,2 704,4 1057 1409
Power [dBm] 85,7 51,8 41,2 49,9
5.7 Spurious
Using the Rigol DSA815 spectrum analyzer with the maximum frequency span of 1.5 GHz no spurious
signals in excess if the tender specified -60 dBc was recorded.
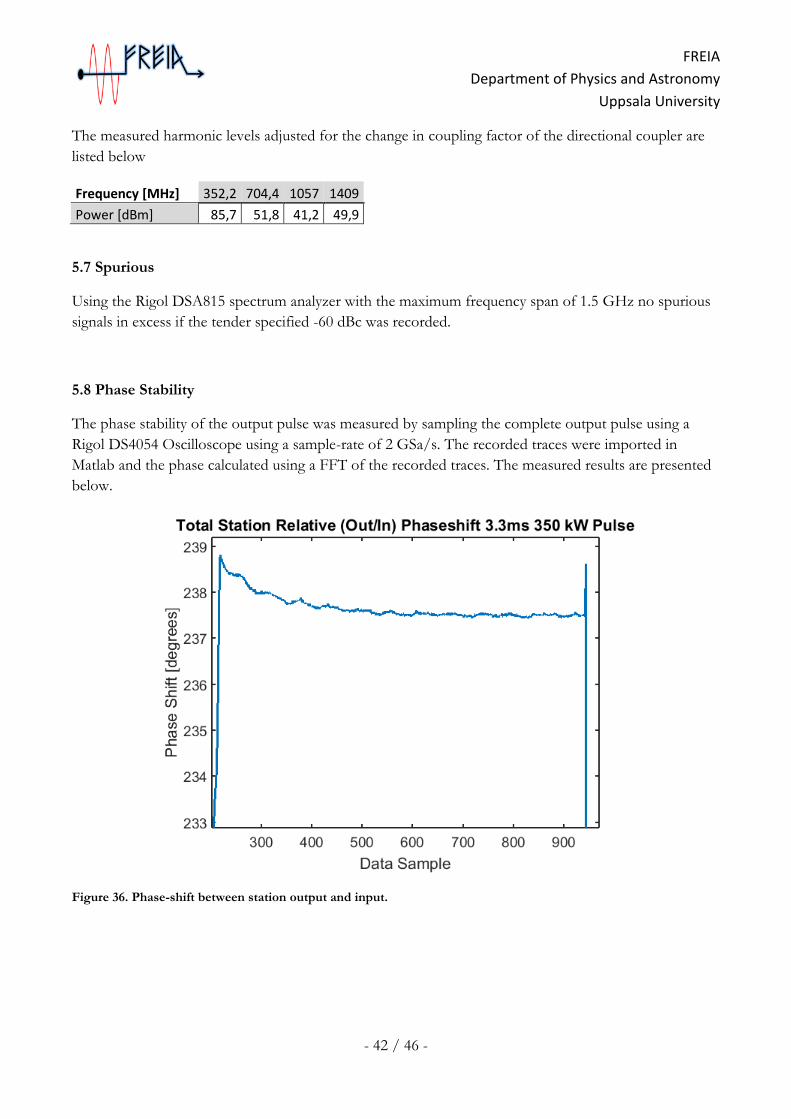
5.8 Phase Stability
The phase stability of the output pulse was measured by sampling the complete output pulse using a
Rigol DS4054 Oscilloscope using a sample-rate of 2 GSa/s. The recorded traces were imported in
Matlab and the phase calculated using a FFT of the recorded traces. The measured results are presented
below.
Figure 36. Phase-shift between station output and input.
FREIA
Department of Physics and Astronomy
Uppsala University
- 43 / 46 -
5.9 Short Pulse Test
Although not stated in the tender specifications tests were also performed on short-duration pulses. During normal operation the station will be used to provide short duration pulses to condition the coupler to the superconducting spoke cavity. Down to 10 us pulses were tested with an output power level of 360 kW. The rise time was around 100 ns and no issues with pulse distortion could be seen. The station thus has no issues in being operated with short duration pulses. The only limitation is the built in meters since at that short pulse duration there is not enough time to do accurate measurements of the station meters which means that at high output power levels maximum grid currents may have to be monitored using external equipment in order to adhere to the specifications of the TH595. However, the tender did not have any specifications for operation at such short pulses so full operation of built in meters was not expected and is not considered a fault in the station design.
FREIA
Department of Physics and Astronomy
Uppsala University
- 44 / 46 -
6. 0Open Issues & Remarks During on-site commissioning multiple issues had to be resolved as discussed in Section 3. However,
once remedied the only major issue still not fully resolved is the difference in tetrode performance
between the original and spare tubes used in the station. This, however, is mainly an issue related to the
tube manufacturer (Thales) and not DB-Science. There were some minor software bugs detected which
remains open at the time of writing the report but the cause of these has been identified in the control
system firmware and an update is planned to remove these. The software bugs detected does not in any
way impedance running or the safety of the station and are not considered urgent.
FREIA
Department of Physics and Astronomy
Uppsala University
- 45 / 46 -
7. 0Conclusions The 400 kW RF station delivered by DB-Science to FREIA, Uppsala University required substantial
modifications before on-site acceptance could be approved. However, DB-Science put significant effort
into making sure that any modifications required were performed and did not try to object these
modifications in any way. Once all the modifications were completed the station was running much
more reliably and is now ready to start normal operation in FREIA.
Due to some issues with spare tetrodes the total output power of the station was reduced to 360 kW in
order not to risk any damage to the tetrodes. If the station were to be run at higher output powers in the
current configuration there were some initial worries of risk of damaging the tetrode screen grids due to
too high power dissipation. This limitation, however, is not contributed to DB-Science since it is caused
by the actual behavior of the tetrode rather than the station. This was later given an explanation by
Thales and was confirmed not be any real risk to the tubes since some of the maximum specifications in
the TH595 datasheet is not fully considering very short pulse lengths and at intended pulse lengths and
powers the G2 DC current is not a limiting factor. Instead the limiting G2 factor would be the internal
RF dissipation. This means that, although the G2 DC current seems a bit high in comparison with the
datasheet specifications there should be no risk in damaging the tubes when operating the screen-grid
with slightly high DC power dissipation. The station has been proved to run 400 kW as well during FAT
in which both original tubes were run and a total output power of 400 kW could be achieved.
The station was also performance tested with very short pulses (10 us) which would be required for
conditioning of the coupler for the superconducting cavity which the station is designed to drive. The
performance at short pulses was very good and should pose no issues.
Overall the station has been considered to pass the on-site acceptance test and start operations within
FREIA.
FREIA
Department of Physics and Astronomy
Uppsala University
- 46 / 46 -