elemental analysis of bonanza ores of the ryosen veins ... · 2-and ag(hs) 2-after the formation of...
TRANSCRIPT

− 1−
Bulletin of the Geological Survey of Japan, vol. 66 (1/2), p. 1 - 14, 2015
Elemental analysis of bonanza ores of the Ryosen veins, Hishikari epithermal Au–Ag deposit, Japan, using micro X-ray fluorescence (µ-XRF)
Toru Shimizu
Toru Shimizu (2015) Elemental analysis of bonanza ores of the Ryosen veins, Hishikari epithermal Au–Ag deposit, Japan, using micro X-ray fluorescence (µ-XRF). Bull. Geol. Surv. Japan, vol. 66 (1/2), p. 1-14, 10 figures, 3 tables.
Abstract: Micro X-ray fluorescence (µ-XRF) instrumentation (Bruker M4 TORNADO) was used to investigate the elemental distribution in hand specimen and at microscopic scale of the surface of bonanza ores from the Ryosen veins in the Hishikari epithermal Au–Ag deposit. The X-ray mapping results show that the metallic elements (Au, Ag, Cu, Fe, Zn, and Se) and sulfur are correlated. However these elements are negatively correlated with potassium with a spatial resolution of tens of micrometers. Microscopic observations indicate that the following vein minerals correspond to the enrichment of elements in X-ray images: electrum for Au and Ag, naumannite for Ag and Se, chalcopyrite for Cu, Fe, and S, sphalerite for Zn and S, and adularia for K. Combined with the previous studies of reaction path modeling and experiments regarding Au and Ag precipitations from bisulfide complexes in boiling fluids, the negative correlation between Au and K is interpreted as being the result of a kinetic effect on electrum deposition. Electrum precipitates as a result of the concurrent decomposition of the bisulfide complexes Au(HS)2- and Ag(HS)2- after the formation of adularia when the influence of H2S gas loss becomes dominant over that of the initial increase in pH that favors adularia precipitation.
Keywords: elemental analysis, X-ray mapping, µ-XRF, bonanza ore, Hishikari, epithermal Au-Ag deposit, electrum, adularia, boiling, kinetic effect
Article
AIST, Geological Survey of Japan, Institute of Geology and Geoinformation (Present affiliation: Research Institute of Earthquake and Volcano Geology)
Corresponding author: T. Shimizu,Central 7,1-1-1 Higashi, Tsukuba, Ibaraki 305-8567, Japan. Email: @aist.go.jp
1. Introduction
The Hishikari deposit in southern Kyushu is the most produc-tive gold mine in Japanese mining history. The deposit currently produces about 0.25 million metric tons of ore per year with an average grade of 37 g Au/metric ton (Sumitomo Metal Mining Co., Ltd., Hishikari mine, 2012).
Metal distribution of ore samples has been examined across different vein locations using major and trace element chemical analyses of bulk samples (Izawa et al., 1990; Ibaraki et al., 1991; Takahashi et al., 2002). These studies showed that Au and other metals (e.g., Ag, Cu, and Se) generally increase at the higher levels and have a positive correlation with K and REE, although there are some variations among different veins. However, one important question remains: how are these elements distributed in individual Au–Ag ores from hand specimen to microscopic scale?
Micro X-ray fluorescence (µ-XRF) is the method of choice
for non-destructive elemental analysis of the surface of diverse samples, including inhomogeneous and irregular-shaped geological samples, both in hand specimen and at microscopic scale with a spatial resolution of tens of micrometers (Bruker Nano GmbH, 2013). The analyzed sample requires little or no preparation. There is no need to coat or even polish the sample; an approximately flat surface will normally suffice (Wiedenbeck, 2014). A wide area, up to 100 × 100 mm of the sample, can be analyzed during a single analytical run.
In comparison with the results of geochemical bulk analysis and microscopic observations, the author demonstrates the characteristics of two-dimensional distribution of Au, Ag, Cu, Fe, Zn, Se, S, and K, with special attention to the relationship between Au and K on bonanza Au–Ag ores of the Ryosen veins, Hishikari, using the µ-XRF spectrometer (Bruker M4 TOR-NADO). This is followed by a discussion on the depositional mechanism of electrum (Au, Ag) and adularia (KAlSi3O8) in the Hishikari hydrothermal system, mainly based on the previous

− 2−
Bulletin of the Geological Survey of Japan, vol. 66 (1/2), 2015
reaction path modeling and experiments on the gold and silver depositions.
2. Outline of geology, ore deposit, and mineralogy
The Hishikari deposit belongs to the Pleistocene (0.61–1.25 Ma, Izawa et al., 1990; Sanematsu et al., 2005; Tohma et al., 2010) within basement sedimentary rocks of the Cretaceous Shimanto Supergroup and Quaternary volcanic rocks that unconformably overlie the basement rocks (Fig. 1). The deposit consists of three ore zones: Honko (Main), Sanjin, and Yamada, within which the Honko and Sanjin zones are relatively enriched in Au, especially in the upper half of the ore zones (Ibaraki, 1990; Ibaraki and Suzuki, 1993). The Honko ore zone contains five major vein groups: Ryosen, Hosen, Zuisen, Daisen, and Kinsen, in addition to numerous veinlets (Fig. 2). The veins generally strike N50°E by 300 to 400 m in length, and dip 70° to 90° northwest, ranging from 1 to 3 m in width (Izawa et al., 1990).
The bonanza zones at the Honko ore zone are located between 130 and -20 m above sea level (Fig. 1, Izawa et al., 1990). The gold grade tends to be higher in the upper part of the veins and decreases abruptly downwards (Ibaraki and Suzuki, 1993). The extremely high-grade ore (644.5–73,400 g/metric ton Au), characterized by the presence of a Au–Ag-rich black band (ginguro, “silver black”), at the Ryosen veins (Ryosen No. 1, 2, 5, and 6 veins) is restricted to between 85 and 100 m above the sea level, which is located above the unconformity between the Shimanto basement rocks and the overlying volcanic rocks (Abe et al., 1986; Shikazono et al., 1993; Ibaraki and Suzuki, 1993; Takahashi et al., 2002). The extremely high-grade ore in the Daisen veins is also restricted to above the unconformity
(Ibaraki and Suzuki, 1993). In other veins at the Honko ore zone, however, the extremely high-grade ore occurs immediately be-low and/or above the unconformity (Ibaraki and Suzuki, 1993). The economic veins terminate at 110 m above sea level in the Ryosen vein group (Abe et al., 1986).
The gangue minerals at Honko ore zone consist mainly of quartz, adularia, and smectite with minor amounts of kaolinite, illite, chlorite, calcite, and zeolites (Izawa et al., 1990; Sekine et al., 2002). The ore minerals consist of electrum, chalcopyrite, pyrite, and marcasite with minor constituents: naumannite, sphalerite, galena, and stibnite (Sekine et al., 2002).
3. Sample description
Field and macroscopic observationsThe petrographic characteristics of the bonanza ore samples in
field and hand-specimen observations are summarized in Table 1. The samples were collected from two different locations at the Honko ore zone: Loc. R1 from Ryosen No. 1 vein and Loc. R2 from Ryosen No. 6 vein (Figs. 1 and 2), where veins com-monly show rhythmic crustiform banding with a symmetrical structure (Figs. 3a, 3b, and 4a). The vein is mainly composed of quartz–adularia bands with a white porcellaneous appearance, including ginguro and local dissemination of ore minerals. The analyzed sample from Loc. R1 includes ginguro, as shown in Fig. 3b.
Microscopic observations
The petrographic characteristics of bonanza ore samples in microscopic observations are also summarized in Table 1. The sample from Loc. R1 includes large amounts of ore minerals,
Fig. 1 Schematic cross section of the geology around the Honko and Sanjin deposits, Hishikari epithermal Au–Ag deposit (Sekine et al., 2002). ‘ML’ denotes the mine meter level. Meter (m) in italic is the elevation above sea level. Locs. R1 and R2 correspond to the sampling locations for elemental analysis.

− 3−
EMicro X-ray fluorescence mapping of Hishikari Au-Ag bonanza ores (Shimizu)
Fig. 2 Vein distribution and sampling locations at the Honko ore zone (Sumitomo metal Mining Co., Ltd., Hishikari Mine, 2012). The vein distribution is projected to 40ML (40 m mine level = 40 m above sea level). Vein groups, DA: Daisen, HO: Hosen, KI: Kinsen, RY: Ryosen, ZU: Zuisen. Numbers in italics correspond vein numbers of Ryosen vein group. Sampling locations: Loc. R1, Ryosen No. 1 vein (100ML E20B), Loc. R2, Ryosen No. 6 vein (10ML-2SL E42B).
whereas the sample from Loc. R2 includes only small amounts of ore minerals. Electrum, chalcopyrite, and naumannite with anhedral shapes are the principal ore minerals with chalcopyrite being the most abundant in each sample. Adularia and quartz are the principal gangue minerals.
Three types of adularia have been identified on the basis of their morphological characteristics: columnar (tabular), granular and rhombic. Columnar adularia, elongating up to 1.6 mm, oc-curs as parallel or sub-parallel crystals oriented perpendicular to the vein wall, forming a monomineralic band along the wall rock (Fig. 5a). Granular adularia is generally fine-grained (10–100 µm) with anhedral shapes, but with local sub-rhombic shapes (Fig. 5b, 5d, and 6a). Granular adularia coexists with ore minerals and anhedral quartz (Fig. 5b, 5c, 5d, 5e, 6a, and 6b). Rhombic adularia displays a fine grain size (15–100 µm) and is commonly associated with anhedral quartz, but rarely with ore minerals (Fig. 5g and 5h).
There is a variation in mineral associations among the granular adularia, anhedral quartz and ore minerals as follows. In the sample from Loc. R1, the granular adularia that formed im-mediately after the columnar adularia is scarcely associated with anhedral quartz, but with small amounts of ore minerals (Fig. 5b and 5c). As the mineralization progresses, not only granular adularia, but also anhedral quartz is commonly associated with fair amounts of ore minerals (Fig. 5d and 5e). These observations indicate that there is a trend for granular adularia to decrease with an increase in anhedral quartz and ore minerals. Another characteristic is that when ore minerals are extremely populated, euhedral quartz is the dominant associated gangue mineral (Fig. 5f); some quartz crystals are doubly terminated.
4. Sample preparation and analytical methods
Geochemical bulk analysisEach analytical sample, weighing between four and ten grams,
was separated from a slab, the surface of which was parallel to the sample surface with mirror symmetry, for petrographic observations, as shown in Fig. 3b and 4c. The analyzed sample from Loc. R1 includes the entire vein sequence between the wall rocks (Fig. 3b). The sample from Loc. R2 is from the outermost band, as shown in Fig. 4b.
The analysis was carried out commercially at Actlabs Ltd., Ontario, Canada, using FA-GRA (Fire assay – gravimetric analy-sis), INAA (Instrumental neutron activation analysis), ICP-OES (Inductively coupled plasma-optical emission spectroscopy) and ICP-MS (Inductively coupled plasma-mass spectroscopy) tech-niques. All the samples were crushed and milled at ActLabs, Ltd.
X-ray mapping analysisThe analytical area includes the whole surface of the thin
section (Fig. 3d) and the slab (Fig. 4c) for petrographic observa-tions. The surface of the thin section was polished using 1 µm diamond abrasives, while that of the slab was grinded using 40µm (400-mesh) silicon carbide. The measurements were performed with a micro-X-ray fluorescence (µ-XRF) analytical instrument (Bruker, M4 TORNADO in GSJ-Lab, AIST, Fig. 7). The instrument uses an EDX detector that allows the entire energy spectra from all elements between Na to U to be simul-taneously collected. The analytical conditions for each sample are summarized in Table 2.

− 4−
Bulletin of the Geological Survey of Japan, vol. 66 (1/2), 2015
5. Results
The concentration values of Au, Ag, Cu, Fe, Zn, Se, S, and K by geochemical bulk analysis are listed in Table 3. The concentrations of each element are variable between the two samples (Table 3). Au concentrations are distinct between the samples and are positively correlated with those of Ag, Cu, Fe, Zn, Se, S, and K.
The X-ray images of the elements (Au, Ag, Cu, Fe, Zn, Se, S, and K) for the samples from Loc. R1 are shown in Fig. 8. The distribution of Au is nearly concordant with the other metallic elements (Ag, Cu, Fe, Zn, Se) and with S. This is consistent with the data from the geochemical bulk analysis. However, the distribution of these elements is largely not concordant with K, and they are apparently negatively correlated with K.
The X-ray images of Cu, Fe, and K for the sample from Loc. R2 are shown in Fig. 9. The distribution of Cu tends to be negatively correlated with K. Elements Au, Ag, Zn, and Se were not detected in the sample owing to their low concentrations below the detection limit.
A superposition of Au and K mapped images with traverses of line analyses of each element in the Loc. R1 sample is shown in Figs. 10a, 10b, and 10c. There are three distinct mineraliza-tion zones, I, II, and III, in order of formation, where Au and K concentrate. Au sequentially concentrates in zones I and II, whereas Au sporadically concentrates in zone III.
6. Discussion
The microscopic observation indicates that the enrichment of Au, Ag, Cu, Zn, Fe, Se, and S, as shown in the geochemical bulk analysis (Table 3) and X-ray maps (Figs. 8 and 9), reflects the distribution of the ore minerals: electrum for Au and Ag, nau-mannite for Ag and Se, chalcopyrite for Cu, Fe, and S, sphalerite for Zn and S, and adularia for K (Figs. 5 and 6). The enrichment of K in each mineralized zone (I, II, and III in Fig. 10) in the sample from Loc. R1 is related to the presence of adularia with the following morphological characteristics: columnar adularia attached to the vein wall and the subsequent granular adularia (zone I), granular adularia (zone II) and rhombic adularia (zone
Table 1 Petrographic characteristics of the veins and analyzed samples in field, hand specimen and microscopic observations
Location Sample name Petrographic characteristicsLoc. R1 (Ryosen
No. 1 vein, 100ML, E20B)
M12212-1(Collection of
Geological Museum, GSJ no. M12212)
The vein generally strikes N45°–70°E by 60 m in length, dips 70° to the northwest to 85° to the southeast, ranges up to 0.38 m in width (Abe et al., 1986). The vein at this level is hosted by altered andesitic pyroclastic rock. Au and Ag were extremely concentrated at the margin of the vein, forming thick ginguro, which is commonly seen in the mine level 100ML (Fig. 3a). Theginguro is followed by porcellaneous white bands (quartz and adularia), which are subsequently overprinted by druzy quartz and calcite in the center (Fig. 3b and 3c). Under the microscope, the ginguro can be seen to mainly consist of various ore minerals (chalcopyrite, electrum, naumannite and sphalerite in the decreasing order), adularia and quartz. The initial mineral precipitation in the ginguro is columnar adularia followed by granular adularia and anhedral quartz coexisting with the ore minerals (Fig. 5a, 5b, 5c, 5d and 5e). The ore minerals have mutually curving boundaries (Fig. 5c, 5e and 5f), and are intimately associated with the granular adularia (Fig. 5b and 5d) and the anhedral to euhedral quartz (Fig. 5d and 5f). Where the amounts of ore minerals are greater, the amount of quartz is also greater, but the amount of adularia is less. The porcellaneous white bands (Fig. 3b and 3c) consist mainly of rhombic adularia and anhedral quartz (Fig. 5g). Calcite precipitation on euhedral quartz comes last (Fig. 5h).
Loc. R2(Ryosen
No. 6 vein, 10ML-2SL E42B)
RY980320-1-SL1 The vein strikes approximately east-west and dips steeply toward the northwest. The vein at this location is hosted by shale of the Shimanto Supergroup. The vein consists mainly of multiple porcellaneous bands of quartz and adularia with ginguro and local dissemination of ore minerals (Fig. 4a and 4b, the bands 1 to 8). As no cross-cutting relationship is observed in the vein, except for the zones between band 3 and an unidentified sequence, each band corresponds to a temporal growth sequence, which began at the vein’s contact with the wall rock and terminated at the center of the vein (this study). The analyzed sample (Fig. 4c) was collected from the outermost zone (band 1at the right hand-side in Fig. 4b). Under the microscope, electrum and chalcopyrite are seen to occur sporadically and are intimately associated with both granular adularia and anhedral quartz (Fig. 6a and 6b).
Table 1 Petrographic characteristics of the veins and analyzed samples in field, hand specimen and microscopic observations

− 5−
EMicro X-ray fluorescence mapping of Hishikari Au-Ag bonanza ores (Shimizu)
Fig. 3 Mode of occurrence of Ryosen No. 1 vein. a. Outcrop image of the symmetrical vein at 100ML, E18B. Courtesy of Dr. Yukitoshi Urashima. b. Collection of a symmetrical vein sample (Sample M12212-1) from Ryosen No. 1 vein, 100ML, E20B (Loc. R1 in Fig. 1 and 2), which is at a distance of 20 m towards the northeast from the outcrop shown in (a). The dotted line area, “c” indicates the position for the sketch shown in (c). The area “d” and the orange-outlined area denote the position of the thin section in (d) and the region selected for geochemical bulk analysis (Table 2), respectively, in a slab, the surface of which is parallel to the sample surface “c” (dotted outlined area) with mirror symmetry. c. A sketch of the dotted outlined area in (b). Abbreviations: qz = quartz, ad = adularia. d. A petrographic thin section of the area “d” shown in (b) that includes the whole mineral precipitation sequences between wall rock and druzy comb quartz and calcite in the vein center. An arrow and dotted lines indicate the growth direction and the boundary between the vein and wall rock, respectively. The areas, “5a,” “5f,” “5g,” and “5h” denote the locations of the microscope image shown in Fig. 5a, 5f, 5g, and 5h. The area “5h” includes the druzy comb quartz and calcite in the center of the vein.

− 6−
Bulletin of the Geological Survey of Japan, vol. 66 (1/2), 2015
Fig. 4 Mode of occurrence of Ryosen No. 6 vein. a. An outcrop image of the symmetrical vein at 10ML-2SL, E42B (Loc. R2 in Fig. 1 and 2). The dotted-outlined area “b” denotes the position for a sketch in (b). b. A sketch of the outcrop of the vein delineated by the dotted-outline area “b” in (a). Abbreviations: ad = adularia, qz = quartz. The vein consists of multiple banding of qz and ad with symmetrical distribution. c. A grinded slab collected from band 1 in (b) (Sample RY980320-1-SL1). The white arrow indicates the growth direction. Goethite occurs along cracks in the sample. The white rectangle area, the area “6c” and the orange-outlined area mark the position of a thin section, the position of the microscopic image shown in Fig. 6c and the region for geochemical bulk analysis (Table 2), respectively, in another slab, the surface of which is parallel to the surface of the grinded slab with mirror symmetry.
III). The enrichment of Fe is also partly related to the presence of goethite (Figs. 3d and 4c).
The sample from Loc. R1 could provide representative information on the elemental distribution of the bonanza ores at the Ryosen vein because the sample contained various mineral-izing events: the formation of columnar adularia (the earliest event) through ginguro formation to euhedral quartz and calcite formation in the vein center (the latest event) as shown in Figs. 3c, 5a, and 5h. This study hereafter focuses the discussion on the mechanism of electrum and adularia precipitation based on the microscopic observations and geochemical interpretation of the Au and K contents of the sample from Loc. R1. The positive correlation between Au and K based on the geochemical bulk analysis is consistent with the results of previous bulk ore analy-sis on the scale of an individual ore deposit (Ibaraki, 1990; Izawa et al., 1990). The positive correlation is also consistent with the fact that the veins containing abundant adularia at Hishikari tend to be richer in precious-metal minerals than adularia-poor veins of the same scale (Izawa et al., 1990).
However, the positive correlation seen between Au and K above is not consistent with the result of X-ray mapping on Au and K at hand specimen to microscopic scale with a spatial resolution of tens of micrometers (Fig. 10a). The initial peak of Au concentration follows that of K in each of the mineraliza-tion zones I, II, and III (Fig. 10b and 10c), indicating that the concentration of Au is slightly delayed from that of K. This is consistent with a negative correlation between the amounts of electrum and granular adularia as seen under the microscope. The negative correlation could be due to the following depositional mechanism of electrum and adularia.
Exploration of active geothermal systems indicates that the presence of adularia is evidence of fluid boiling during mineral-ization (e.g., Browne, 1978; Hedenquist, 1990). The precipitation of columnar adularia along the vein walls is common in many veins in the Honko and Sanjin deposits at Hishikari, indicating the ubiquitous presence of initial boiling during mineralization—based on a mineralogical and fluid inclusion study of adularia (Nagayama, 1993; Etoh et al., 2002). Nagayama (1993) also

− 7−
EMicro X-ray fluorescence mapping of Hishikari Au-Ag bonanza ores (Shimizu)
Fig. 5 Photomicrographs of Au–Ag ores in a thin section from Loc. R1. Abbreviations: ad = adularia, cpy = chalcopyrite, el = electrum, na = naumannite, qz = quartz. a. Magnified image of the white rectangle area “5a” in Fig. 3d under transmitted, crossed polarized light, rotated 90° counterclockwise. The arrow and the dotted line indicate the growth direction and the boundary between the vein and wall rock, respectively. Areas “b” and “d” are enlarged in (b) and (d), respectively. b. Magnified image of the area “b” in (a) under transmitted crossed polarized light. Area “c” is enlarged in (c). Granular ad formed immediately after tabular ad. c. Magnified image of the area “c” in (b) under reflected light. El, cpy, and na are intimately associated. d. Magnified image of “d” in (a) under transmitted, crossed polarized light. Granular ad and anhedral qz coexist. e. Magnified image of the area “e” in (d) under reflected light. El, cpy, na, sp, and gn interstitially occur in the area of mixture of ad and qz. f. Magnified image of white rectangle area “5f” in Fig. 3d under reflected light, rotated 90° counterclockwise. El, cpy, and na enclose euhedral qz. * indicates doubly terminated quartz. g. Magnified image of the area “5g” in Fig. 3d under transmitted, crossed polarized light, rotated 90° counterclockwise. h. Magnified image of the area “5h” in Fig. 3d under transmitted, crossed polarized light, rotated 90° counterclockwise. The mineral sequence has changed from rhombic ad and anhedral qz (bottom) through euhedral qz (middle) to calcite (top).
− 8−
Bulletin of the Geological Survey of Japan, vol. 66 (1/2), 2015
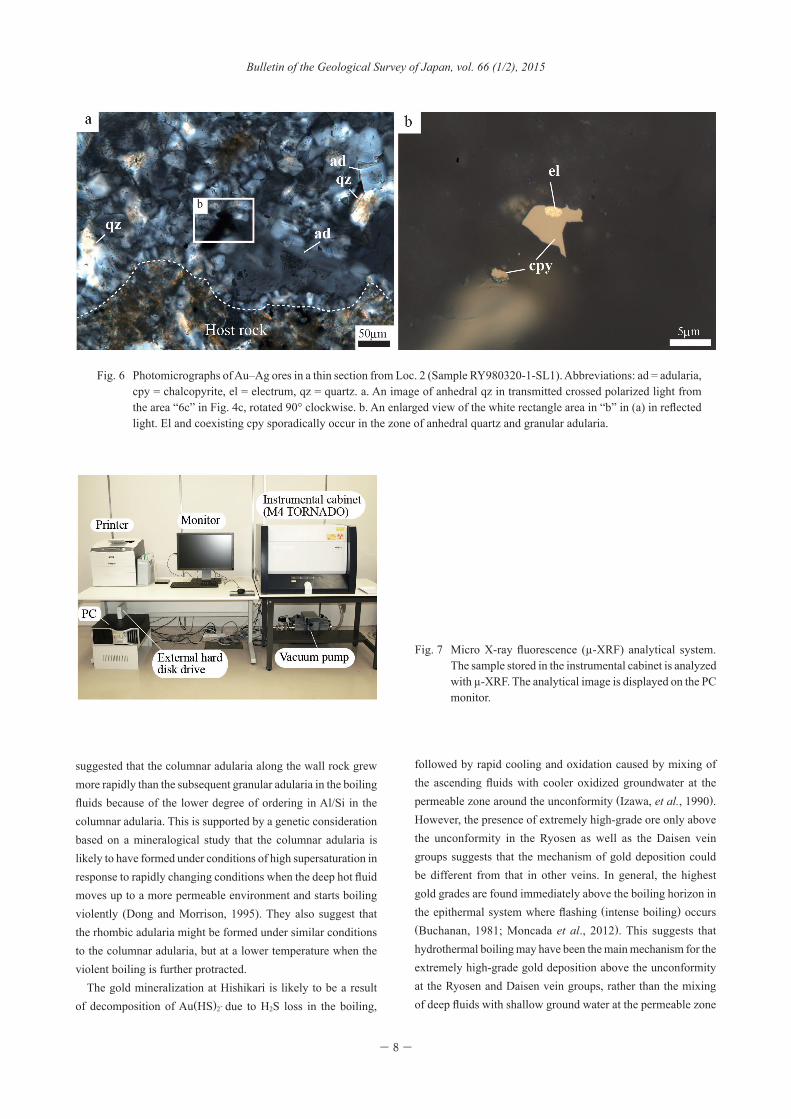
Fig. 6 Photomicrographs of Au–Ag ores in a thin section from Loc. 2 (Sample RY980320-1-SL1). Abbreviations: ad = adularia, cpy = chalcopyrite, el = electrum, qz = quartz. a. An image of anhedral qz in transmitted crossed polarized light from the area “6c” in Fig. 4c, rotated 90° clockwise. b. An enlarged view of the white rectangle area in “b” in (a) in reflected light. El and coexisting cpy sporadically occur in the zone of anhedral quartz and granular adularia.
Fig. 7 Micro X-ray fluorescence (µ-XRF) analytical system. The sample stored in the instrumental cabinet is analyzed with µ-XRF. The analytical image is displayed on the PC monitor.
suggested that the columnar adularia along the wall rock grew more rapidly than the subsequent granular adularia in the boiling fluids because of the lower degree of ordering in Al/Si in the columnar adularia. This is supported by a genetic consideration based on a mineralogical study that the columnar adularia is likely to have formed under conditions of high supersaturation in response to rapidly changing conditions when the deep hot fluid moves up to a more permeable environment and starts boiling violently (Dong and Morrison, 1995). They also suggest that the rhombic adularia might be formed under similar conditions to the columnar adularia, but at a lower temperature when the violent boiling is further protracted.
The gold mineralization at Hishikari is likely to be a result of decomposition of Au(HS)2- due to H2S loss in the boiling,
followed by rapid cooling and oxidation caused by mixing of the ascending fluids with cooler oxidized groundwater at the permeable zone around the unconformity (Izawa, et al., 1990). However, the presence of extremely high-grade ore only above the unconformity in the Ryosen as well as the Daisen vein groups suggests that the mechanism of gold deposition could be different from that in other veins. In general, the highest gold grades are found immediately above the boiling horizon in the epithermal system where flashing (intense boiling) occurs (Buchanan, 1981; Moncada et al., 2012). This suggests that hydrothermal boiling may have been the main mechanism for the extremely high-grade gold deposition above the unconformity at the Ryosen and Daisen vein groups, rather than the mixing of deep fluids with shallow ground water at the permeable zone

− 9−
EMicro X-ray fluorescence mapping of Hishikari Au-Ag bonanza ores (Shimizu)
Table 2 Analytical conditions of X-ray mapping analysisSample name M12212-TH-1
(Ryosen No.1 vein, 100ML, E20B)RY980320-1-SL1
(Ryosen No. 6 vein, 10ML-2SL E42B)Principle Energy dispersive
X-ray (EDX) analysis
Sample chamber atmosphere Vacuum (≈ 5mbar)
Target material Rh
Detection Silicon drift detector (SDD)
Energy resolution (eV) <145 (at 3000,000 cps)
Accelerating voltage (kV)
50
Anode current (µA)
600
A beam diameter (µm)
25
A beam stepsize (µm) 25
Scanning range (pixels)
1000 x 1376 (25 mm x 34.4mm in area) 3844 x 1620 (96.1 mm x 40.5 mm in area)
Pixel time (milliseconds/pixel) 5 5.31
Measuring time (seconds/frame) 6880 33067
Typical limits of detection * K, Al, Si, S: 100〜1000ppm, Au: 100ppm, Ag: 200~300ppm, Cu: 20ppm, Fe: 40ppm, Zn: 20ppm, Se: 20~100ppm.
*Data source: Bruker Nano GmbH (2011) and Mizuhira (2012)
Table 2 Analytical conditions of X-ray mapping analysis
around the unconformity.The negative correlation between electrum and adularia at
Hishikari (this study) could be due to a kinetic effect on gold deposition in boiling fluids—discussed by Shimizu (2014)—as in the case of the Koryu deposit. In geothermal systems and their analogues for epithermal mineralization (e.g., Broadlands, New Zealand), the principal control on pH is the concentration of CO2 in solution (Henley et al., 1984). Thus, boiling and loss of CO2 to the vapor results in an increase in the pH (equation 1).
HCO3- + H+ = H2CO3- > CO2 (g) + H2O (1)
Field observation and related reaction-path modeling among aqueous and gaseous species and minerals in Broadlands-Ohaaki geothermal system, New Zealand, show that cooling and pH increase favor the deposition of adularia (Browne, 1978; Sim-mons and Browne, 2000). However, experimental data pertain-ing to gold solubility as a function of time, pH, temperature, and pressure show that the increase in pH, along with an increase in oxidation state due to H2 loss, initially cause the reaction
shown in equation 2 to shift to the left, competing with H2S loss, thereby resulting in delay in gold deposition (Brown, 1989; Seward, 1989).
Au(HS)2- + 0.5H2 (g) = Au + H2S (g) + HS- (2)
The gold deposition could only occur when fluid boiling was protracted and the effect of H2S loss was dominant over that of the initial increase in pH (Dong and Morrison, 1995).
Silver is transported predominantly as Ag(HS)2- in hydro-thermal systems with a similar environment in which gold is transported as Au(HS)2- (Gammons and Barnes, 1989). Silver deposition follows a similar pattern to gold deposition (Brown, 1989); as a result of the decomposition of Ag(HS)2- due to H2S loss (equation 3), fluid boiling could also cause delay in the silver deposition.
Ag(HS)2- + 0.5H2 (g) = Ag + H2S (g) + HS- (3)
Electrum could precipitate due to the concurrent shift of reactions (2) and (3) to the right at the Ryosen vein, Hishikari.
A local high-concentration of Au in zone II (Au concentra-

− 10 −
Bulletin of the Geological Survey of Japan, vol. 66 (1/2), 2015
tion within the dotted oval, “LC” in Fig. 10a), however, is not apparently negatively correlated with K concentrations. This characteristic and the presence of doubly-terminated quartz associated with electrum (Fig. 5f) suggest that some electrum deposition may have been related to a different mechanism (i.e., co-transportation of electrum colloidal nanoparticles and the quartz crystals in the fluids from depth to preferential sites to precipitate, forming rich orebodies as in the case of the Sleeper and Buckskin National Au deposits, Nevada, USA–Saunders, 1994, 2012; Mason et al., 2013).
7. Conclusions
Based on the elemental analysis using micro X-ray fluores-cence (µ-XRF), compared with the results of geochemical bulk analysis and microscopic observations, this study shows the following mineralogical characteristics in terms of ore formation at the Ryosen veins, Hishikari Au–Ag epithermal deposit:
1. The enrichment of Au, Ag, Cu, Zn, Fe, Se, S, and K, as shown in X-ray maps, reflects the distribution of ore minerals: electrum for Au and Ag, naumannite for Ag and Se, chalcopyrite for Cu, Fe, and S, sphalerite for Zn and S, and adularia for K.
2. Although the geochemical bulk analysis at an ore deposit scale shows a positive correlation between Au and K concentra-tions, the X-ray maps show a negative correlation between Au and K at hand specimen to microscopic scale with a spatial reso-lution of tens of micrometers, indicating that the concentration of
Au is delayed from that of K. The delay in Au precipitation could be due to the kinetic effect on electrum deposition in boiling fluids; electrum precipitates from the concurrent decompositions of the thiocomplexes: Au(HS)2- and Ag(HS)2- after adularia when the effect of H2S gas loss competes with that of initial increase in pH that favors adularia precipitation.
AcknowledgmentThis study has benefited from collaboration with Dr. Nobuo
Geshi, Dr. Masatsugu Ogasawara, Dr. Yoshihiro Ishizuka and other staffs on the operation of µ-XRF in the collaboratory in AIST, Geological Survey of Japan, “GSJ-lab”. I thank Mr. Akira Owada, Mr. Takumi Sato, Ms. Eri Hirabayashi and Mr. Kazuyuki Fukuda for preparing the polished thin sections. I also convey my appreciation to Mr. Mizuhira, Mr. Kitajima, and Dr. Ogawa at Bruker AXS Co., Ltd. for having taken the time to answer the questions I posed on the µ-XRF technique. The author also thanks Mrs. Hinako Shimizu for her technical assistance in preparing the figures. I acknowledge the comments from Mr. Morimoto, Sumitomo Metal Mining Co., Ltd., Hishikari mine to improve the original manuscript. I am grateful for the construc-tive comments by the reviewer, Dr. Kenzo Sanematsu and the editorial committee member of the bulletin of the Geological Survey of Japan, Dr. Norio Yanagisawa.
Analyte Symbol Ag Zn Fe Se S KUnit Symbol ppm ppm % ppm % %Detection Limit 0.03 0.002 0.05 50 0.2 0.5 0.01 0.1 0.01 0.01Upper Limit 1,000 30 100,000 - 10,000 100,000 - - 20 -Analysis Method a b c d e c b f g gSample M12212-1(Loc. R1, Ryosen No.1 vein, 100ML,E20B)
9880* - 31,200 25,500 - 2,320 3.7 42,400 2.99 5.16
Sample RY980320-1-SL1 (Loc. R2, RyosenNo. 6 vein, 10ML-2SL, E42B)
- 20.2 12.5 - 11 11 0.09 <0.1 0.02 1.26
*: The metal content was determined with the upper limit removed. - : Not determined.
Table 3 Geochemical bulk analysis of Au-Ag ore samples at the Hishikari deposit
Analysis method: Analytical methods: a = FA-GRA (Fire assay - gravimetric analysis), b = INAA (Instrumentalneutron activation analysis), c = MULT INAA/TD-ICP/TD-MS (INAA or total digestion followed by inductivelycoupled plasma-optical emssion spectroscopy, ICP-OES or inductively coupled plasma-mass spectroscopy, ICP-MSanalyses), d = FUS-Na2O2 (Sodium peroxide fusion and acid dissolution followed by ICP-OES analysis), e = MULTTD-ICP/TD-ICP-MS (Total digestion followed by ICP-OES or ICP-MS analysis, f = MULT INAA/TD-ICP-MS (INAAor total digestion followed by ICP-MS analysis), g = TD-ICP (Total digestion followed by ICP-OES analysis).
Auppm
Cuppm
Table 3 Geochemical bulk analysis of Au-Ag ore samples at the Hishikari deposit

− 11 −
EMicro X-ray fluorescence mapping of Hishikari Au-Ag bonanza ores (Shimizu)
Fig. 8 X-ray mapping images of the entire thin section shown in Fig. 3d from Loc. R1 (Sample M12212-1, Ryosen No. 1 vein, 100ML, E20B). Images show uncalibrated (semiquantitative) element distribution (as total counts). a. Au Lα, b. Ag Lα, c. Cu Kα, d. Fe Kα, e. Zn Kα, f. Se Kα, g. S Kα, h. K Kα. Brightness is proportional to the content of each element in (a)–(h). The arrow in (a) indicates the growth direction. For analytical conditions, see Table 2.
References
Abe, I., Suzuki, H., Isogami, A. and Goto, T. (1986) Geology and development of the Hishikari mine. Mining Geology, 36, 117-130 (in Japanese with English abstract).
Brown, K.L. (1989) Kinetics of gold precipitation from experi-mental hydrothermal sulfide solutions. Economic Geology Monograph, 6, 320-327.
Browne, P.R.L. (1978) Hydrothermal alteration in active geothermal fields. Annual Reviews of Earth and Planetary Science, 6, 229-250.
Bruker Nano GmbH (2011) Lab Report XRF 442 Analytical per-formance of the M4TORNADO. 4p., https://www.bruker.com/products/x-ray-diffraction-and-elemental-analysis/micro-xrf-and-txrf/m4-tornado/applications/analytical-performance.html (2015/03/21).
Bruker Nano GmbH (2013) M4 TORNADO Brochure. 8p.,http://www.bruker.com/products/x-ray-diffraction-and-elemental-analysis/micro-xrf-and-txrf/m4-tornado/
learn-more.html (2014/11/28).Buchanan, L.J. (1981) Precious metal deposits associated with
volcanic environments in the southwest. Arizona Geologi-cal Society Digest, 14, 237-262.
Dong, G. and Morrison, G.W. (1995) Adularia in epithermal veins, Queensland: morphology, structural state and origin. Mineralium Deposita, 30, 11-19.
Etoh, J., Izawa, E. and Taguchi, S. (2002) A fluid inclusion study on columnar adularia from the Hishikari low-sulfidation epithermal deposit, Japan. Resource Geology, 52, 73-78.
Gammons, C.H. and Barnes, H.L. (1989) The solubility of Ag2S in near-neutral aqueous solutions at 25 to 300°C. Geochemica et Cosmochimica Acta, 53, 279-290.
Hedenquist, J. (1990) The thermal and geochemical structure of the Broadlands-Ohaaki Geothermal System, New Zealand. Geothermics, 19, 151-185.
Henley, R.W., Truesdell, A.H. and Barton, P.B., Jr. (1984) Fluid-mineral equilibria in hydrothermal systems. Society of Economic Geologists, Reviews in Economic Geology,

− 12 −
Bulletin of the Geological Survey of Japan, vol. 66 (1/2), 2015
1, 267p.Ibaraki, K. (1990) General description of Yamada deposit,
Hishikari mine. In Papers in Honor of Prof. Urashima on his Retirement, 197-200.
Ibaraki, K. and Suzuki, R. (1993) Gold-silver quartz-adularia veins of the Main, Yamada and Sanjin deposits, Hishikari gold mine; a comparative study of their geology and ore deposits. Resource Geology Special Issue, 14, 1-11.
Ibaraki, K., Suzuki, R. and Fukuda, E. (1991) Trace element distributions of Honko and Yamada deposit, the Hishikari mine, Kyushu, Japan. Mining Geology, 41, 63-75 (in Japanese with English abstract).
Izawa, E., Urashima, Y., Ibaraki, K., Suzuki, R., Yokoyama, T., Kawasaki, K., Koga, A. and Taguchi, S. (1990) The Hishikari gold deposit: High grade epithermal veins in Quaternary volcanics of southern Kyushu, Japan. Journal of Geochemical exploration, 36, 1-56.
Mason, M.S., Saunders, J.A. and Shimizu, T. (2013) Doubly terminated quartz crystals in epithermal gold-silver veins: evidence for physical transport. Geological Society of America Annual meeting, Denver, CO, GSA Abstracts with Programs 45, no. 7 Abstract No: 232188.
Mizuhira, M. (2012) Introduction of the new high-speed micro X-ray mapping using a µ-EDXRF, M4 TORNADO. Bruker AXS confidential report.
Moncada, D., Mutchler, S., Nieto, A., Reynolds, T.J., Rimstidt, J.D. and Bodnar, R.J. (2012) Mineral textures and fluid inclusions petrography of the epithermal Ag-Au deposits at Guanajuato, Mexico: Application to exploration. Journal of Geochemical Exploration, 114, 20-35.
Nagayama, T. (1993) Precipitation sequence of veins at the Hi-shikari deposits, Kyushu, Japan. Resource Geology Special Issue, 14, 13-27.
Sanematsu, K., Duncan, R., Imai, A. and Watanabe, K. (2005) Geochronological constrains using 40Ar/39Ar dating on the mineralization of the Hishikari epithermal golddeposit, Japan. Resource Geology, 55, 249-266.
Saunders, J.A. (1994) Silica and gold textures in bonanza ore of the Sleeper deposit, Humboldt County, Nevada: Evidence for colloids and implications for epithermal ore-forming processes: Economic Geology, v. 89, p. 628-638.
Saunders, J.A. (2012) Textural evidence of episodic introduction of metallic nanoparticles into Bonanza epithermal ores: Minerals, v. 2, p. 228-243,http://www.mdpi.com/2075-163X/2/3/228 (2014/11/29).
Sekine, R., Izawa, E. and Watanabe, K. (2002) Timing of fracture formation and duration of mineralization at the Hishikari deposit, southern Kyushu, Japan. Resource Geology, 52, 395-404.
Seward, T.M. (1989) The hydrothermal chemistry of gold and its implications for ore formation: Boiling and conductive cooling as examples. Economic Geology Monograph, 6, 398-404.
Shikazono, N., Naito, K. and Izawa, E. (1993) Editor’s Preface in High grade epithermal gold mineralization –The Hishikari deposit–. Resource Geology Special Issue, 14, iii-v.
Shimizu, T. (2014) Reinterpretation of quartz textures in terms of hydrothermal fluid evolution at the Koryu Au-Ag deposit, Japan. Economic Geology, 109, 2051-2065.
Simmons, S.F. and Browne, P.L. (2000) Hydrothermal minerals
Fig. 9 X-ray mapping images of a slab as shown in Fig. 4c from Loc. 2 (Ryosen No. 6 vein, 10ML-2SL, E42B). Images show uncalibrated (semiquantitative) element distribution (as total counts). a. Cu Kα. b. Fe Kα. c. K Kα. The arrow in (a) indicates the growth direction. Brightness is proportional to the content of each element in (a)–(c). Some scattered X-rays detected around the sample are also shown in (a). Fe concentration in (b) corresponds to goethite filled in fracture. For analytical conditions, see Table 2.

− 13 −
EMicro X-ray fluorescence mapping of Hishikari Au-Ag bonanza ores (Shimizu)
Fig. 10 Relationship between Au and K distribution. a. A summary image of Au Lα (Fig. 8a) and K Kα (Fig. 8h). The color codes at the bottom left-hand corner indicate the color assignments for the two elements. Yellow lines A–B and C–D correspond to the position of the line analysis traverses in (b) and (c), respectively. The long dashed lines indicate the boundary between the vein and the wall rock. The short dashed lines indicate the boundary between distinct mineralization zones where Au and K concentrate (I, II, and III). The dotted oval, LC, denotes an area with a local high concentration of Au. LC includes the area for the thin section observation, as shown in Fig. 5f. b. A linear distribution of Au and K concentrations along the A–B (16.747 mm) traverse in (a). Au data on top of K data. The analysis number (vertical axis) corresponds to numbers of analytical position with a 25 µm stepsize. See Table 2 for the analytical conditions. The green line in zone I denotes the boundary between granular adularia and columnar adularia that attaches to the wall rock. c. A linear distribution of Au and K concentrations along the C–D (23.673 mm) traverse in (a). Au data on top of K data. The green line in zone I denotes the boundary between granular adularia and columnar adularia that attaches to the wall rock. LC corresponds to the data in the dotted oval “LC” in (a).
and precious metals in the Broadland-Ohaaki geothermal system: Implications for understanding low-sulfidation epithermal environments. Economic Geology, 95, 971-999.
Sumitomo Metal Mining Co., Ltd., Hishikari mine (2012) Outline of Hishikari mining operation. 1p.
Takahashi, M., Mizuta, T., Ishiyama, D., Kimura, J. and Takada, J. (2002) Characteristics of trace elements in quartz by LA-ICP-MS and the origin of ore fluid responsible for gold mineralization at the Hishikari epithermal gold deposit, Japan. Shigen Chishitsu, 52, 51-67 (in Japanese with Eng-lish abstract).
Tohma, Y., Imai, A., Sanematsu, K., Yonezu, K., Takahashi,
R., Koyama, M., Sekine, R., Duncan, R. and Watanabe, K. (2010) Characteristics and mineralization age of the Fukusen No. 1 vein, Hishikari epithermal gold deposits, southern Kyushu, Japan. Resource Geology, 60, 348-358.
Wiedenbeck, M. (2014) Fast mapping with µ-XRF. Elements, 10, 5-6.
Received January 16, 2015Accepted May 8, 2015

− 14 −
Bulletin of the Geological Survey of Japan, vol. 66 (1/2), 2015
微小部蛍光X線分析装置 (µ-XRF) による菱刈浅熱水性金銀鉱床産ボナンザ鉱石の元素分析
清水 徹
要 旨
微小部蛍光X線分析装置(Bruker M4 TORNADO)を用いて,掌~顕微鏡スケールにて菱刈浅熱水性金銀鉱床菱泉脈のボナンザ鉱石表面の元素分布を調べた.数十ミクロンの空間分解能を持つX線面分析によれば,Au, Ag, Cu, Fe, Zn, Seおよび Sは互いに相関するが,これらの元素はいずれもKとは逆相関する.顕微鏡観察よれば,鉱脈構成鉱物は,面分析における以下の元素濃集を意味する.エレクトラム:Au及びAg,ナウマン鉱:Ag及びSe,黄銅鉱:Cu, Fe及びS,閃亜鉛鉱:Zn及びS, 氷長石:K. 沸騰熱水中の金及び銀二硫化物錯体から金銀が沈殿するという,従来のモデル研究または実験的研究結果と併せて考えると,Auと
Kの間の逆相関は,エレクトラム晶出時の動的効果に起因する.すなわち,熱水沸騰時,最初の pH増加による氷長石晶出の後,硫化水素脱ガスの影響が上回ると,金及び銀の二硫化物錯体の分解が起こりエレクトラムが晶出する.