elements of a tribal monitoring & assessment program · as discussed in chapter 8 and appendix...
TRANSCRIPT

DATA MANAGEMENT
Supplement to the Clean Water Act Section 106 Tribal Guidance

Table of Contents
INTRODUCTION................................................................................................................................1 WHAT IS THE PURPOSE OF THIS TRIBAL DATA MANAGEMENT DOCUMENT? .................................1
DATA MANAGEMENT ......................................................................................................................3 I. WHAT IS DATA MANAGEMENT? ........................................................................................3 II. DATA MANAGEMENT PROCEDURES...................................................................................4 III. DATA TYPES ......................................................................................................................6 IV. DATA MANAGEMENT FORMATS ........................................................................................9
STORET-COMPATIBLE DATA SUBMISSIONS ..............................................................................12 I. GETTING YOUR DATA INTO A STORET-COMPATIBLE FORMAT .....................................12 II. WAYS TO SUBMIT DATA ..................................................................................................16 III. RETRIEVING DATA FROM THE STORET WAREHOUSE.....................................................19 IV. ONGOING SUPPORT ..........................................................................................................20
ATTACHMENT A: EXAMPLES OF TRIBAL DATA MANAGEMENT............................................21
ATTACHMENT B: GLOSSARY...................................................................................................26

Data Management
Supplement to the Clean Water Act Section 106 Tribal Guidance
Introduction
What is the purpose of this tribal data management document?
In October 2006, the United States Environmental Protection Agency (EPA) issued the Final Guidance on Awards of Grants to Indian Tribes under Section 106 of the Clean Water Act (Tribal 106 Guidance). The Tribal 106 Guidance provides a flexible framework for tribes and EPA regions to ensure that tribes' water quality program goals are met while being consistent with Section 106 of the Clean Water Act (CWA), the Governmental Performance and Results Act (GPRA), and other federal requirements. The Tribal 106 Guidance outlines new water quality reporting requirements and data expectations for all tribal programs receiving 106 funds. These requirements will help tribes collect and manage critical data and information for effective management of water quality programs, to measure environmental results, and report them to EPA.
As discussed in Chapter 8 and Appendix A of the Tribal 106 Guidance, EPA requires that tribes submit to EPA a tribal Assessment Report that contains information about water quality on tribal land and demonstrates national results for the Section 106 Tribal program. The Assessment Report consists of: (1) a description of the tribe's monitoring strategy; (2) a water quality assessment; and (3) surface water quality data submitted electronically in a STORET- compatible format that includes metadata for at least the nine basic parameters that are being monitored (dissolved oxygen, pH, water temperature, turbidity, total phosphorus, total nitrogen, macroinvertebrates, E. coli or enterococci, basic habitat information), as required considering the Tribal 106 Guidance and a tribal water quality program’s level of sophistication.
This document is intended to supplement the Tribal 106 Guidance by providing useful suggestions and tips to tribes about how to establish a data management system that reflects tribal water quality goals and objectives, and manage the system so that the data is accessible and reliable. As a result of good data management, tribes are empowered to use the data to determine the physical, chemical, and biological conditions of a water body so water quality trends can be identified and measured to ensure that water quality can be maintained and/or improved. An organized and thorough data management program provides the foundation for measuring and achieving water quality environmental results while helping tribes meet the EPA data reporting requirements. Attachment A provides examples of existing tribal management programs. Attachment B provides a glossary of terms used throughout this document.
This document provides basic data management principles that will be helpful to all tribes and all water quality programs, whether their programs are at the fundamental, intermediate, or mature level as defined by the Tribal 106 Guidance.
Page 1 of 28

Two additional templates have been created for assisting tribes in developing monitoring strategies and performing data analysis and assessment1. These resources are available to assist tribal programs in meeting the tribal Assessment Report requirements. The data management principles presented in this document are meant to assist tribes with getting data into a usable format in order to begin putting together data assessments (statistics, data summaries, etc). This document is not intended as a tutorial for data submission to EPA, however information about data submission to EPA and support for submission is included in the document.
This document has been reviewed and approved for publication by EPA. Mention of trade names or commercial products or services does not convey, and should not be interpreted as conveying, official EPA approval, endorsement, or recommendation. Any use of words such as “should” or “may” are not intended to be mandatory language, rather, these are statements of suggestion that a tribal program may or may not adopt depending upon available resources.
1 EPA Tribal Monitoring Strategy and Assessment Workgroup. 2008. Developing a Tribal Water Monitoring Strategy: Supplement to the Clean Water Act Section 106 Tribal Guidance. EPA Tribal Monitoring Strategy and Assessment Workgroup. 2008. Data Assessment and Reporting: Supplement to the Clean Water Act Section 106 Tribal Guidance.
Page 2 of 28
Data Management
I. What Is Data Management?
Data management is the process of reporting and storing the information you collect as part of your water quality monitoring program. It helps you store information in a format that allows you to manipulate, summarize, and analyze your results to make decisions. Managing data properly does take time, but it will save you time in the end and help you maintain and present accurate information about water quality in your area. Data management is a crucial part of a monitoring strategy2 and can be a way to integrate your thinking about many aspects of your work.
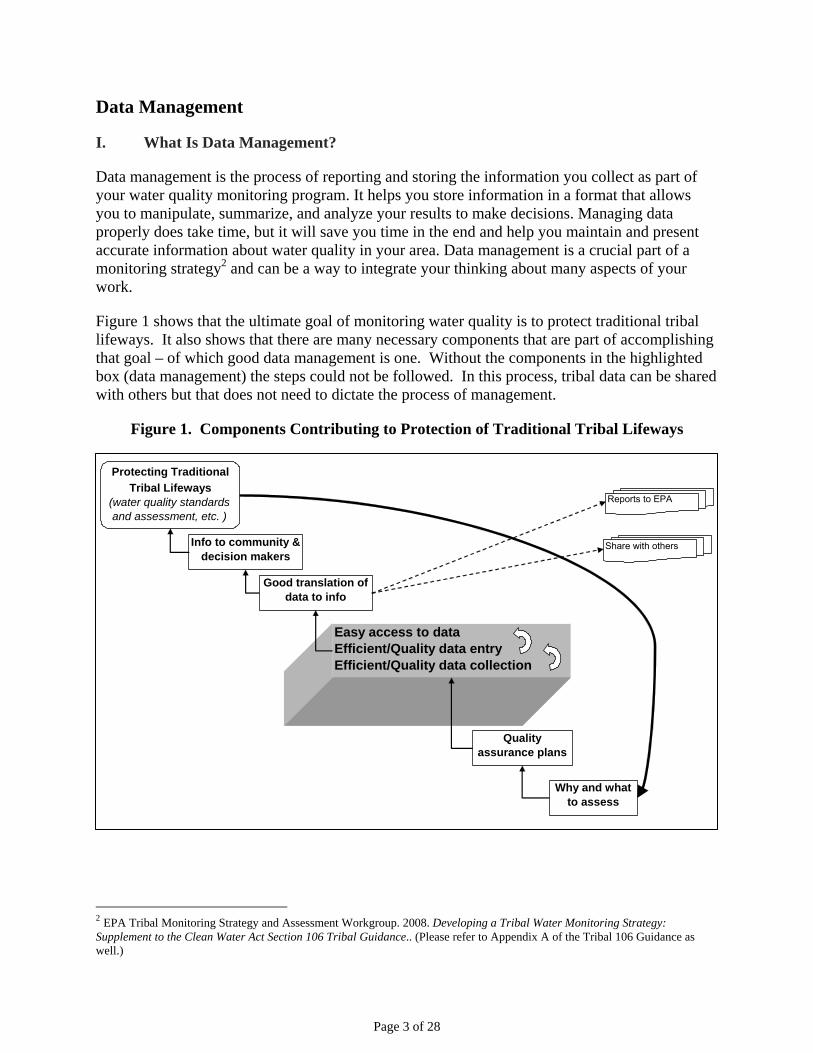
Figure 1 shows that the ultimate goal of monitoring water quality is to protect traditional tribal lifeways. It also shows that there are many necessary components that are part of accomplishing that goal – of which good data management is one. Without the components in the highlighted box (data management) the steps could not be followed. In this process, tribal data can be shared with others but that does not need to dictate the process of management.
Protecting Traditional Tribal Lifeways
(water quality standards and assessment, etc. )
Info to community & decision makers
Easy access to dataEfficient/Quality data entryEfficient/Quality data collection
Good translation of data to info
Quality assurance plans
Why and what to assess
Reports to EPA
Share with others
Figure 1. Components Contributing to Protection of Traditional Tribal Lifeways
2 EPA Tribal Monitoring Strategy and Assessment Workgroup. 2008. Developing a Tribal Water Monitoring Strategy: Supplement to the Clean Water Act Section 106 Tribal Guidance.. (Please refer to Appendix A of the Tribal 106 Guidance as well.)
Page 3 of 28

Water quality monitoring data generally consist of the following information:
1. Where a sample or measurement was collected 2. When it was collected 3. What was collected 4. How it was collected 5. Why it was collected 6. Who collected it
Data management ensures that this information is accessible and understandable. The purpose of data management is to convert your monitoring results into a useful set of data to use for making decisions about your water quality monitoring program and meet tribal water quality goals.
II. Data Management Procedures
Data management procedures are processes for storing and sharing your water quality monitoring data in a controlled and standard way. Take a step back to consider the goals of your water quality monitoring program. Any decisions you can make in advance of managing your data can help you develop standard procedures and save time. For example, you may want to have a meeting with others in your group who collect water quality monitoring data, your lab, or your manager to discuss ways to report the data so that information can be documented in similar ways over time. This will avoid confusion when looking at past information, and prevent the need to review procedures to make them consistent. Coordinating with your laboratory will allow it to report data in formats that are helpful and consistent for you. These decisions and meetings will help develop effective data management to help you understand your data over time and will help any new people that are hired in your organization to understand the data.
To determine what data management procedures may be right for you, ask yourself the following questions:
1. What data are currently collected? – Some examples may be:
Field measurements for temperature, pH, and turbidity on field sheets Continuous data from YSI or other data loggers from lakes and streams
monitoring locations Water chemistry sample results from a lab Benthic macro invertebrates counts or fish tissue sample results
2. What data are being recorded? – Some examples may be:
Results for the core and supplemental water quality indicators (see page 4-10 of the Tribal 106 Guidance) being used to meet monitoring strategy goals and objectives
Field sheet result values Metadata for your results, such as the methods you used in collected or analyzing
a sample
Page 4 of 28

Locational information for sampling stations
3. How w ta be handled?
ld data are entered on a field en these data
he ha le entry form and then directly
– The e documented in your Quality Assurance Project Plan
4. HowSome examples may be:
eet that has ing conv
lt h station visited on a certain sults are linked via a unique
oss
–
5. e? Some examples may be:
m their r name and password
e, these data can be carefully
6. How m re performing data entry or data management? - Some examples may be:
des monitoring data oring sites
ed.
7. Who ne ta and how do they want to see the information? – Some examples may be:
ill field and laboratory da
– Some examples may be: Fie
sheet at the station, thare entered in a spreadsheet and tField data are entered using a portabuploaded to your database
rd copy field sheet is filed away digital data
Metadata are data that are supplemental to your data, or “data about data”. For example, the result values received from your lab are data, while information like the time the sample was taken and the sample collection procedure are both metadata.
Results from a lab may be sent back to you in a standard formatted spreadsheet se processes may already b
(QAPP) or QAPP Standard Operating Procedures (SOPs)
will data be entered and validated? –
Field data are entered in a standard data spreadshconsistent headings and namA staff member enters the field resuday into the program database, and the field re
entions s data from eac
Note: An EPA-approved QAPP must be in place before a tribe can take environmental measurements using EPA project funds.
identifier assigned to them to the sample results that will come back from the lab A second staff member produces a report from the program database and crchecks the data values with those received from the lab
These processes may be documented in your QAPP or QAPP SOPs
How will data be managed to make them useful for their intended purpos–
Data are within a database that multiple staff members can access frocomputers using a use
Data that are of questionable quality is flagged within a comment field in the spreadsheet so that when data analysis is donconsidered
any people a
All staff members need access to a single database that inclufor all types of monit
Certain staff handle biological and habitat data while others handle lab data so separate spreadsheets are kept
A spreadsheet tracks who has entered the data and at what time, so that others know if an entry has been chang
eds to know information about the da
Page 5 of 28

Tribal council members want a report and a graph showing how water temperature and flow have been changing over the past 2 years
the tribal Assessment Report need raw continuous pH data
rmat.
Working throu u decide which procedures you will need to create and i wered these questions, you may want to develop written procedures for data handling, records
be ep
alyzed
er
iles on a specific computer with backup files on a CD, DVD, or external drive.
umentation is to write out all the steps of your data management process
Seprep h year.
n. Your organization may not have these exact names for the same types of data, but these are some examples of the concepts that you are probably already capturing or
as
– An organization that collects water quality monitoring information
Staff putting together to determine if levels have spiked Reports to EPA that require certain information in a particular fo
gh the above questions will help yowh ch tools you may need in order to manage your data. Once you have ans
management, and documentation. For example, when you consider how field and lab data will handled, you may decide that you will enter data collected in the field into spreadsheets and kehard copies of field sheets in a filing cabinet. You may decide that the lab data will be anfrom an outside lab and that they will send you electronic copies of results that you will copy into spreadsheets. In any case, you could set up a few procedures about how your water quality monitoring program will operate and how you will record and track information. You could come up with a standard format for spreadsheets so that the items are reported in a specific ordand names of what you are recording stay the same.
As far as records management, a good practice is to keep hard copies of all lab reports and field sheets in a filing cabinet, and electronic copies of all f
Once you have decided on what your data management procedures are, one way to approach doc
as if you were explaining them to a new person. You cansave and date the document and update it anytime your procedures change. This will help you remember what the procedures are and communicate them to others. For example, if you collect your field data in the spring and summer and produce a report to your tribal council eachprocess in your documentation, and include a copy of the
III. Data Types
Data types describe the way organizations, such as tribes, generally categorize water quality
Note: It is considered a good practice to keep archived backup files in a physically different building than your main hardcoor electronic files. This protects your files against an unforesedisaster situation (e.g., fire, flood, tornado, etc.)
py
en
tember, you can describe that ort you use eac
monitoring informatio
should capture. These types of data influence the way you might organize your data within adata management system. Here are some examples of the types of data related to water quality. Some of these can be considered metadata, which contextualize monitoring data results, such who, why, where, and how.
1. Who you are – Examples:
Page 6 of 28

– Name of staff member who was doing field measurements and taking water
2. Wh o e or more projects to
coll ct data.
profile study le stream condition study
reek condition study
3. Wh where monitoring activities occur. – Examples:
un, above confluence with Entry Run
– a etadata associated with them. This may the latitude/longitude of the station, recording
ct
4. How cted by an organization’s staff. – Examples:
ture or Secchi disk depth) .,
ng collection, transport or analysis of routine samples, – e.g., field is
temperature measured at intervals from
– Accol portant piece of information. Your QAPP or
5. Wh ata collected or produced from monitoring activities.
trogen
samples – Name of lab staff person who was analyzing a sample
y y u are collecting the data - An organization may have one
– Examples: Lakes Wadeab Little Northeastern C
ere you are collecting data - Stations are places
Atlantic Beach Near Gordan’s Pond Collets R Chatfield In-Reservoir Near Dam Alluvial Well – Flying C Ranch
St tions or monitoring locations have minclude using a GPS device to recorddirections to the station, or other overall observations of the station that may impasampling. Metadata are an important component of your data, as they provides context for your monitoring activities and results.
you collect data - Monitoring activities are condu
Field measurement (parameters measured in field using instruments, e.g., tempera
Field observation (parameters observed in the field using the eye or ear, e.gstream bank erosion)
Routine sample (media collected in the field for analysis by the lab, such as a water sample)
Quality control (QC) sample (samples used to ensure that no contamination is introduced duriand lab blanks - or samples used to assess the variability in collection or analysmethods, e.g., duplicates and splits) Integrated vertical profile sample (discrete sample derived from a continuous vertical segment at your station, e.g.,surface to bottom of waterbody)
tivities will have metadata associated with them. For example, the sampling lection method used may be an im
SOPs will often contain this information.
at data you are collecting - Results are the d
– Examples: pH Total ni
Page 7 of 28

Fecal coliform ies
resence (% Rch) – ata associated with them. For example, the analytical method
an important piece of information that should
6. Wh ssessing onsite water quality characteristics
erosion
7. Wh la boratory data are results that must be analyzed by a lab.
Total phosphorous rogen
8. How you check the data you are collecting – quality assurance (QA) or QC results are another type of result data that are very important to capture, not only for overall data
on
9. Assessment data, geographic information systems (GIS) data, wildlife surveys, etc.
These d ou organize and manage data overall. For example, from year to year, your organization name will likely stay the same, although staff members may
ill
r continue to implement data management for these data types within spreadsheets or a database, a few principles are important to keep in mind:
mportant to agree to what types of data you will track and how much of these data will be required. For example, you might always require the entry of the unit of measure for any result value.
Count of mayfl Undercut bank p
Results will have metadthat was used to attain a result value isaccompany results. Your QAPP will often contain this information.
at field data you are collecting - Field data are results that come from a
– Examples: Water temperature pH Existing streambank
at b data you are collecting - La
- Examples:
Total nit E. Coli
quality, but for later data analysis. You may decide to track these types of results separately from the regular results, while linking them via a common monitoring locati(see page 4-20 of the Tribal 106 Guidance for additional information on the QA/QCprocess and tribal responsibilities).
What additional data do you collect –
ata types may already drive how y
change. Similarly, the project will likely stay the same from year to year. Many tribes organizetheir information under one project. However, some tribes want to set up separate projects to track information related to specific studies or funding sources. Stations or monitoring locations often stay the same over time, but sometimes additional stations and water quality indicators wbe added as a tribal water quality environmental program becomes more sophisticated. The monitoring activities and results are the data types that will change each time water quality data are collected.
As you begin o
1. Required or optional data – within databases and spreadsheets, it is i
Page 8 of 28

Or, you might say that whenever a result value is not detected, a reason for the non-detectmust be given in a separate field. In a database, enforcing these rules is easy once yohave set them up. Spreadsheets may be documented so that all users can adhere to the rules that have been defined by your program.
Common identifying conventions – it is an important practice to begin to use common naming conventions, especially in tracking what
u
2. types of water quality indicators or
parameters you are sampling. For example, if you are tracking dissolved oxygen by a
g
asy to
3. elements will also make it easier to manipulate data once you
have begun to analyze it. For example specifying that all dates need to have a format of
You ma S data. Regardless of the types of data you currently collect or plan to collect, you should list the data
ine your current level of data management and what fully implementing data management as you move
forward (e.g., Recommendation A, etc). There are many ways to manage your data, so you
eems
2. Electronic documents, such as word processing or scanned documents
consistent name, it will be much easier to find, manipulate, and analyze all the measurement values associated with this parameter. Another example may be makinsure a consistent naming scheme is in place for identifying all of your monitoring stations. In a database, drop down lists based on valid values can make it very eimplement common naming conventions. You can also set up common values lists within spreadsheets.
Standard data formats – similar to common identifying conventions, having standardformats for certain data
YYYY-MM-DD or that all latitude and longitude coordinates should be in decimal degrees will make the data useful for all staff members. Be sure to know the exact capabilities of the software you are using before assuming that the data format you define is absolute.
y also be managing assessment data or GI
Water quality monitoring data consisof field data or lab results associated
ts
with sampling events at a monitoring
lity that are made based on omparisons of water quality monitoring
location. Assessment data are decisions about water quacdata against water quality standards.
types and determine how you will manage information for each data type. The same data management principles apply whether you are managing water quality monitoring data, assessment data, or GIS data.
IV. Data Management Formats
Figure 2 is a road map for you to determrecommendations you can consider in
should choose the one that works best for your organization now and in the long term. Each format has advantages and disadvantages. But don’t underestimate the potential for what slike less work now making far more work for you in the future as your program develops.
Some formats you may be currently using include:
1. Paper reports
Page 9 of 28

3. Spreadsheets While GIS is a common way of analyzing
supplemental to most datasets and is not a core way of and presenting data, it is4. Databases
5. GIS managing data.
Figure 2. Data Managem
filing cabinets. Keeping papers can be relatively easy, especially if that is what you have been oing previously and/or if labs mail you paper reports. It is also smart to keep paper copies of
portant data and reports as a back-up system to data stored electronically. However, keeping track of all of your data on paper makes it very difficult to analyze the data, make environmental
ent Road Map 1. What do you currently collect?
Field Lab
Recommendation A. Some tribes keep track of information in paper reports that are filed in
2A. How do you track this data? 2B. How does the lab provide data?
Paper Reports
Electronic Documents Spreadsheet Database Paper Electronic
See Recommendation A
See Recommendation C Spreadsheet Database
Yes
See Recommendation D
See Recommendation E
No
2C. How do you manage these lab files?
2D. Is the same database?
See Recommendation B
See Recommendation A
dim
Page 10 of 28

decisions, and share the information with your community. You also run a greater risk of losinthe data over time. You could also contact your lab and request that they provide data to you inan electronic format specified by your environmental program. Once you get data in an electronic format, you can expand your data management capabilities and use the data collected to meet the water quality goals and objective of your environmental program.
Recommendation B. Other tribes keep track of information in electronic documents such as Microsoft (MS) Word, Word Perfect, or PDF documents. The advantage of having electrdocuments is that they are easy to print and revise. Although electronic documents are helpful, they are not very effective methods for managing data. It is difficult to find, m
g
onic
anipulate, sort, and analyze data when it is in a document format. If you maintain electronic documents with
s
up a little bit more. You can easily copy and paste data, rearrange data for specific reports, and even create
sing
and can
anize
stems can vary in complexity, from simple “Out of the Box” programs like MS Access, to more complex,
er,
ady
your data, you may consider pasting or entering the data into a spreadsheet or database. Pleasenote that if you do transfer data from electronic documents to spreadsheets or a database, it is important to do a QC check to ensure that the data were transferred correctly.
Recommendation C. Spreadsheets organize data in tables (rows and columns) that you manually construct and can directly rearrange, sort, search, and use to perform many calculationand statistical and graphical analyses. Several spreadsheet programs are available, such as MS Excel. If you have all of your data in spreadsheets, your options begin to open
charts to present the data. If you are using a spreadsheet format, it is helpful to define a consistent standard format for your spreadsheets (i.e., same columns, same column order). You may also develop a standard way of reporting certain items, like the parameter names and unitsof measurement. For example, if you sometimes record “temp” and other times record “temperature,” or sometimes record “degrees” and other times “degC,” you should choose the name and units you want to use consistently. Unlike hard copy or electronic word procesdocuments, more formal business rules (e.g., required or conditionally required fields) can be incorporated into a spreadsheet. Because of the inherent lack of a centralized location, it is frequently found that the process of manually rearranging data is quite time consuming generate many files and versions. Consequently, it becomes even more important to institute a good file management plan. You can develop a storage plan for how to name and track your spreadsheets, and to ensure that you keep one master version of the spreadsheet to avoid confusion about what is the most up to date, correct spreadsheet. It is very important to keepseparate read-only copies of spreadsheets somewhere in case you make a mistake as you change a spreadsheet, and to prevent others from inadvertently changing data in them.
Recommendation D. Databases (such as MS Access, Oracle, or MS SQL databases) orgdata in tables, but you typically interact with them through data entry screens. Although databases take a considerable amount of preparation time, once they are completed, it is easy to enter, store, retrieve, perform relational queries, and report the data. Database sy
customized systems, like Oracle or SQL Server. Databases are the best way to ensure data consistency and that the most correct version of the data is maintained. They can, howevrepresent a fairly significant technical hurdle to those who have not worked with them. Therefore, it is recommended that you identify a qualified person who has primary responsibilityfor database management and maintenance. If you have a database, you are most likely alremeeting your need for managing data.
Page 11 of 28

Recommendation E. If you have multiple databases to manage your field and lab water quadata, it is recommended that you combine your data into one database. Part of the powehaving a database is that you can store multiple types of monitoring data together, such as lab and field data, in an easily accessible format. A database will allow these data to be related to each other for a given station, on a speci
lity r of
fic date. A database also eliminates the need to store data more than once, such as station information. Raw monitoring data should be stored
rate s
le to which the spatial information can be linked.
RET (short for STOrage and RETrieval) Data Warehouse (or STORET Warehouse) is a repository for water quality, biological, and physical data and is used by tribal environmental
ther federal agencies, universities, private citizens, and many others. Formatting your monitoring data to be STORET-compatible, not only
efit ng data in a STORET-compatible format, you are formatting the data you are managing (with Excel or Access, etc.)
ta s.
also
TORET Warehouse, which will be discussed in the next section. It is important to note that the Water Quality Exchange (WQX) is the new way
type of data submission.
separately from assessment data because this allows for future assessments to be made based on the same data. For example, the result for 8° C for water temperature would be kept in a sepadatabase from the assessment conclusion that the stream is determined to be meeting the Tribe’threshold for supporting a cold water fish habitat.
GIS software gives you another way to store and display your data that combines simple database and graphing functions with the power of putting data directly onto a map of the watershed. GIS software allows you to visually analyze, manipulate and report on your data based on the location of your sampling point in the river or watershed. Most GIS software also easily imports other types of data formats into a tab
STORET-Compatible Data Submissions
I. Getting Your Data Into a STORET-Compatible Format
The STO
organizations, state environmental agencies, EPA, o
ben s the EPA, it also benefits tribes and other agencies. By putti
into a standard set of data elements, formal business rules and allowable values that comply with the STORET Warehouse, allowing the data to be placed in the STORET Warehouse. Once daare in the STORET Warehouse, they can be retrieved for use in a variety of studies and analyseFor instance, your tribe can acquire your data and data from surrounding jurisdictions to identify upstream issues that might be of concern to your reservation. The STORET Warehouse canbe useful in the event of an internal data loss.
As part of the required tribal Assessment Report, tribes are required to submit monitoring data to EPA electronically in a STORET-compatible format for each assessed surface water body. This section describes what it means to put data into a STORET-compatible format.
There are different ways to submit data to the S
to place data into the STORET Warehouse and will be discussed in the next section. The STORET-compatible format as outlined below is very similar to the WQX format, and any efforts in putting data in a STORET-compatible format are well worth it for any
Page 12 of 28

For each data type, STORET requires that certain information be reported in a very specifiThese data types answer the questions defined in Section III: Who, Why, Where, How, and What. Tables 1 through 3 show information needed to submit data to STORET Warehouse anwhere to get
c way.
d the information.
ation on where to get the data from.
Ple at is availab ml
Field Name is the data parameter that can be sent to STORET. You will likely have similar names in your own data sets.
Description explains what the field name means and other helpful hints. Source provides inform
ase note Tables 1 through 3 come from the STORET Data Template, an MS Excel file thle from the EPA STORET Web site (http://www.epa.gov/storet/national_websim.ht ).
The e nding STORET. The m ghout the country. It can be used to actually manage data or simply as a guide to see how data can be organized for easy
T mplate also contains other worksheets that can be very helpful to understa te plate was created as a result of consultation with tribes throu
import into the STORET Warehouse.
Table 1. Project Information in STORET
Field Name Description Source
Project ID A unique ID for the Project to which data will be assigned User Created
Name A unique Name fo ted r the Project User Crea
Start Date Date on which the Project started (MM/DD/YYYY format) monitoring work began (may
cover multiple years) Date which
Duration Planned duration of the Project Either planned end date of monitoring for
“Ongoing” this purpose or
Purpose Project goals, expectations, or why these data were collected User Created
STTable 2. Station Information in ORET
Field Name Description Source
Station ID dentifier for the Station Unique i User Created
Station Name A geographically ated descriptive Station name User Cre
Primary Type Station's primary type Listed in template allowable values
LatitudeLatitude. See recommended)
available format options. (DD.DDDDDDD
ing, Map Interpolation, etc. – ods listed in template
GPS readbased on meth
LongitudeLongitude. See available format options. (DDD-DDDDDDD ap Interpolation, etc. –
ods listed in template recommended) GPS reading, Mbased on meth
Geopositioning ine Lat/Long coordinates Method Method used to determ Listed in template allowable values
Geopositioning Datum Datum used to determine Lat/Long Listed in template allowable values
StatePostal abbreviation for Station's primary state, not required for Great Lake and Ocean Stations The state containing the Station
County Name or FIPS code for Station's primary county The county containing the Station
Station Station Description User Created
Page 13 of 28

Field Name Description Source Description
ts Information in STOTable 3. Resul RET
Field Name Description Source
Activity ID
r each activity (an activity can be a unique lab ID, a suite of on-site field measurements, an individual sample ted
A unique identifier fo
, etc) User-crea
Medium Medium in which this activity occurs Listed in template allowable values
Activity Type Type of activity Listed in template allowable values Activity
ate allowable values Category Category of activity Listed in templActivity Start
n Date Date activity began (MM/DD/YYYY) Date samples or measurements takeSample Collection Procedure ID
ample collection procedure, required if activity type is sample User-created based on QAPP Valid STORET s
Characteristic Valid STORET characteristic name Listed in template allowable values Name
Result Value Measured value of characteristic From lab results or field sheet Result ValuUnits
e Units for characteristic Result From lab Results or field sheet
Sample Fraction
Fraction for characteristic, required for certain characteristics tails) (see Non-Taxa Characteristics for de Lab Results
Field/Lab Procedure
The field or lab procedure used to analyze the sample, (see Non-Taxa
Characteristics for details) sed on
QAPP required for certain characteristics
Listed in template allowable values or created by organization staff ba
Field/Lab e Listed in template allowable values or use
D ProcedurSource
Source acronym for field/lab procedure, required if field/lab procedure entered organization I
nage mat, you elds li h 3. The STORET template provides detailed guidance on the ment ex
that:
value from the STORET lists, as defined in the template
, and
If you are i m, meeting these STORET requirem nts will not be difficult. Tinvolve y
To ma and report data in STORET-compatible forsted in Tables 1 throug
will need to provide at least the data firequireure
s for each field that you may need to provide. For ample, you will need to make s
– Field length of data in a data field is not longer than what STORET will accept – You provide information in the defined formats or select the appropriate allowable
You provide the unique identifier that STORET requires for all projects, stations–
activities within your organization.
mplementing this within your own data management systee his helps to make the use of these data easier for everyone
d b aiding data standardization, which is essential for data sharing at the national level.
Page 14 of 28
Metadata, or data about your data, are very important for telling potential data users how data were gathered and why certain data may be unreliable. For this reason, it is encouraged that all relevant QC data be entered into STORET, as well as specific sample collection procedures and field/lab procedures.
ristic names are based on an EPA data standard. Table 4 shows the list of the parameters defined in the Tribal 106 Guidance and the corresponding STORET
le 4 is to list of
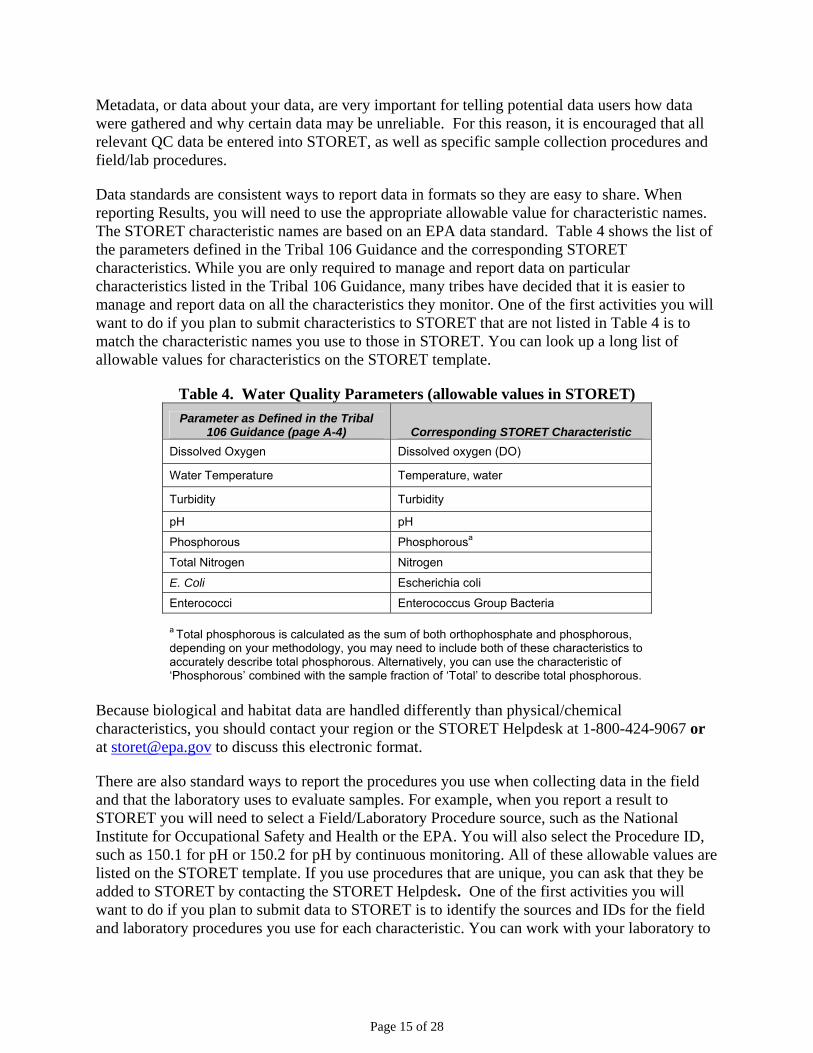
Data standards are consistent ways to report data in formats so they are easy to share. When reporting Results, you will need to use the appropriate allowable value for characteristic names. The STORET characte
characteristics. While you are only required to manage and report data on particular characteristics listed in the Tribal 106 Guidance, many tribes have decided that it is easier to manage and report data on all the characteristics they monitor. One of the first activities you will want to do if you plan to submit characteristics to STORET that are not listed in Tabmatch the characteristic names you use to those in STORET. You can look up a longallowable values for characteristics on the STORET template.
Table 4. Water Quality Parameters (allowable values in STORET) Parameter as Defined in the Tribal
106 Guidance (page A-4) Corresponding STORET Characteristic Dissolved Oxygen Dissolved oxygen (DO)
Water Temperature Temperature, water
Tu Turbidity rbidity
pH pH
Phosphorous Phosphorousa
Total Nitrogen Nitrogen
E. Coli Escherichia coli
Enterococci Enterococcus Group Bacteria a Total phosphorous is calculated as the su rthophosphate and phosphorous,
ng on your methodology, you may oth of these characteristics to ly describe total phosphorous. Alte he characteristic of
’ combined with the sample f l phosphorous.
m of both odependiaccurate
need to include brnatively, you can use t
‘Phosphorous raction of ‘Total’ to describe tota Because biocharacterist -9067 or at storet@e
logical and habitat data are handled differently than physical/chemical ics, you should contact your region or the STORET Helpdesk at 1-800-424pa.gov to discuss this electronic format.
There are also standard ways to report the procedures you use when collecting data and that the laboratory uses to evaluate samples. For example, when you report a result to STORET you will need to select a Field/Laboratory
in the field
Procedure source, such as the National Institute for Occupational Safety and Health or the EPA. You will also select the Procedure ID,
e y be
such as 150.1 for pH or 150.2 for pH by continuous monitoring. All of these allowable values arlisted on the STORET template. If you use procedures that are unique, you can ask that theadded to STORET by contacting the STORET Helpdesk. One of the first activities you willwant to do if you plan to submit data to STORET is to identify the sources and IDs for the field and laboratory procedures you use for each characteristic. You can work with your laboratory to
Page 15 of 28

find out its procedures for analyzing certain parameters. Tribal QAPPs, SOPs, and even data logger manuals are also good resources for procedural IDs.
Overall, the following steps will help you get your data into a STORET-compatible format. Aany point in this process, contact the Tribal STORET suppor
t t line at 1-800-844-0638 or
[email protected] if you have any questions about how to organize your data, what are the allowable values, or other topics. For these steps below, the STORET template available on the EPA Web site will show specifics such as allowable and required values: http://www.epa.gov/storet/national_websim.html.
1. Ensure that you are collecting all the required data fields listed in Tand as shown in the template available on th
ables 1 to 3, above, e EPA Web site.
s.
2. Figure out what values STORET will allow for your parameters and field and laboratoryprocedures. Refer to the STORET template for help.
3. Get your data formatted according to STORET’s specific required fields, field length, andfield type. You might want to use the STORET template, which lays out these item
4. Before you can send your data to STORET, you need to request an Organization ID by contacting the STORET Helpdesk at 1-800-424-9067 or at [email protected].
Thebe used some of these tools on the STORET Web site (http://www.epa.gov/STORET/otherapps.html
re are other applications that have been created by members of the user community that may to help you put your data into a STORET-compatible format. You may find
).
ical, and physical data (from 1999 and beyond) collected by federal, state and local agencies, Indian Tribes, volunteer groups, academics, and others. The STORET Warehouse will
xt step is to submit the data electronically to the STORET Warehouse using the different tools and mechanisms available. Figure 3 shows
II. Ways to Submit Data
As you may know, the STORET Warehouse contains raw surface and ground water biological, chem
continue to be the repository for all STORET data.
Section 5 talked about how to put your data into a format that is accessible by the STORET Warehouse. Once your data are in this format, the ne
the different mechanisms for submitting data to the STORET Warehouse.
Page 16 of 28

Figure 3. Mechanisms for Submitting Data
PA expects that once data are in a STORET-compatible format, they will be submitted to the STORET Warehouse. EPA recognizes that due to resource limitations, certain tribes need EPA
the STORET Warehouse, determine what mechanism is best for your tribe. Each approach has advantages and disadvantages, but all are acceptable
National WebSIM)
E
support in completing the data submission. In these cases, submitting the data electronically to your project officer (via e-mail, CD, DVD, etc.) may be sufficient for meeting the data submission requirement. This option is not discussed below, and should be discussed further between you and your project officer.
To submit your data electronically into
means for meeting the data submission requirements set forth in the Tribal 106 Guidance. Here are some options to consider (described in more detail below):
1. Submit data through the Web STORET Import Module (
Page 17 of 28

2. Submit data through WQX using an Exchange Network Node or Node Client
3. Submit data through the WQX Web Submission Tool (WQXWeb)
Thi using these tools. Please see the resources for support at the end of this document for more information about the
ET Import Module (National WebSIM)
t, Station, and esults data. More information about this option, including a data management template and
s document does not include detailed instructions on how to submit data
steps to be taken to utilize these tools.
1. Submit data through the Web STOR
National WebSIM is a Web-based user interface for uploading text files of ProjecRNational WebSIM tutorials can be found at http://www.epa.gov/storet/national_websim.html. In addition, the National WebSIM tutorials on the Web site help you understand how it works anhow to submit electronic files to STORET. Please note that National WebSIM will be ph
d
ased out as it is replaced with WQXWeb. QXWeb will be similar to National WebSIM, so any effort made with National WebSIM will
ased so
. Submit data through WQX
your data into the STORET Data Warehouse. WQX is a framework
r
Wnot be wasted. EPA plans to continue to support National WebSIM as WQXWeb is relethat tribes can transition to the tool in a complete and comfortable fashion. National WebSIM will remain available until September 2009. Any progress that you make now towards data management, including submitting data to STORET through National WebSIM, will help you organize your data and prepare for the future.
2
WQX is another way to submit
that makes it easier for tribes, states, and others to submit and share water quality monitoring data ovethe Internet. WQX uses EPA’s Exchange Network(http://www.exchangenetwork.net/exchanges/water/wqx.htm) to flow water quality monitoring data to STORET from a tribe’s data system via Exchange Network nodes or node client. Tribes that have beenawarded Exchange Network grants use WQX to submit files. Most tribes submitting data through WQX directly have database systems for managindata. Some tribes have begun working together toward utilizing WQX for submitting data. If you araware of activities going on in your region throug106 grant representative, and monitoring coordinator. More information about the WQX can bfound at
g
e ch your
e
onsidering this route, you should stay Exchange Network grant representative,
EPA’s Exchange Network is a way to exchange environmental information
are warded to states, territories, and
sist in n of
securely over the internet, using an approach based on standard technology and protocols. Exchange Network Grants afederally recognized tribes to asthe development and implementatioExchange Network Nodes, exchanges, tools, and related backend systems.
http://www.epa.gov/storet/wqx.html.
3. Submit data through WQXWeb
Page 18 of 28

WQXWeb is a tool that will eventually replace the National WebSIM, but it will work in much the same way. Like WebSIM, WQXWeb allows the uploading of text files, but also allows the
ct
available for use by your tribe, EPA, and the general public who have an interest in the water quality data in your area. As a part of a
nd
e errors in data that they have submitted to the STORET
the STORET Warehouse
h to perform analyses on data that has been loaded to the STORET Warehouse by you or other organizations having jurisdiction in your area. In order to do this, you will need to
odernized STORET data. All
ail tailed
creation of a WQX file and the submittal of this file to the STORET Warehouse via WQX. Standardized templates, as well as tutorials, will continue to be available to assist tribes in formatting data in the correct format for data submission. The tool also allows tribes to corredata errors upon submission. Tribes will be able to easily transition from the National WebSIM to the new WQX web submission tool because they will be familiar with formatting and preparing data for submission using a Web-based tool.
Once data is submitted to the STORET Warehouse, it is
tribal Assessment Report, the data submitted to EPA will enable water quality managers to have a better picture of how water quality is improving in Indian Country. If you have privacy concerns about the availability of monitoring data through the STORET Warehouse, please see Appendix C (Letter to Tribal Leaders on Information Access) of the Tribal 106 Guidance, aconsult with your project officer.
Some tribes may find that they hav
Warehouse. All the tools for submitting data described above allow a tribe to change any submitted data. For example, if a set of resultstaken during a certain sampling season was taken using equipment that was later found to be defective, the tribe can use any of the submission tools to delete the erroneous data and resubmit the new data.
III. Retrieving Data from
You may wis
retrieve the necessary data from the STORET Warehouse. You may download data from the STORET Data Warehouse by going to the STORET Web site (http://www.epa.gov/storet/index.html) and clicking on the “Download Data” link. You will have the choice between accessing Legacy STORET data or Mdata that was loaded during or after 1999 will be found in the Modernized STORET data. TheSTORET Warehouse offers several query options. Once you have selected a query option, a form will help you filter your data down to only the data that are needed. Once you have requested the data, you will need to select what data fields that you want and provide your e-maddress so that you can receive a web-link telling you where to download your data set. Deinstructions for downloading data from the STORET Data Warehouse are available from http://www.epa.gov/storet/Downloading_STORET_Data.pdf.
A second option for retrieving data from the STORET Data Warehouse is through Web Services. Web Services offer a way to allow computers to retrieve data directly from the STORET Data
The STORET Warehouse does not provide QA/QC services (i.e., does not check data
to as part of
for “bad” values), but rather, trusts data providers to perform QA/QC before the data is submitted. It is generally unnecessary to report questionable data the EPA, unless the data are used your water quality assessment. Data with questionable data quality can be flagged within STORET if shared.
Page 19 of 28

Warehouse in predefined formats using a computer to computer protocol for directly sharing information. You may find more information on STORET Web Services at: http://www.epa.gov/STORET/web_services.html.
IV. Ongoing Support
If you have questions about getting your data into a STORET-compatible format or how to submit data to STORET, there are ways to seek help. Table 5 lists some resources that may be
Table 5. STORET Resources for Tribes
helpful to you.
Item Location
STORET Web site http://www.epa.gov/storet/index.html
Information on Nation http://www.epa.gov/storet/n websim.htmlal WebSIM ational_
Information on WQX http://www.epa.gov/storet/wqx.html
STORET Tribal data management template ebsim.htmlhttp://www.epa.gov/storet/national_wNational WebSIM Tutorials and Example Files http://www.epa.gov/storet/national_websim.htmlData Management Applications http://www.epa.gov/STORET/otherapps.htmlInformation on Exchange Network http://www.exchangenetwork.net/STORET Helpdesk 1-800-424-9067 or [email protected] STORET/WQX Support Line 1-800-844-0638 or at [email protected]
The RET/W assist you
ith any issues that arise with STORET/WQX. EPA’s STORET helpdesk can set up
lems with
ng data, you should determine how you plan to submit data and how often you should submit it to EPA. That way, you can reserve the staff hours necessary to submit data on a
STORET helpdesk and tribal STO QX support line are useful resources towOrganization IDs and enter field/lab procedures into the system. The tribal support line can answer questions about data management and reporting, or help you troubleshoot probSTORET/WQX.
As part of submitti
routine basis. The more often you submit data, the more familiar you will become with the process. It will get easier every time. Once you have decided on a plan for submitting data, you should document it and revise the plan as necessary.
Page 20 of 28

ATTACHMENT A: Examples of Tribal Data Management
This section provides examples of tribal data management systems that were provided by tribes. Please note that the Fond du Lac, Penobscot Indian Nation, and Yurok Tribe Environmental Program are considered to have mature data management programs because they use databases to manage their water quality environmental data and provide data to EPA in a STORET-compatible format. Fond du Lac Fond du Lac’s water quality monitoring program includes physical, chemical, and biological data from reservation lakes and streams, going back to 1998. In 2008, we will begin collecting similar data from a targeted group of wetlands. Physical field data include a Hydrolab profile in lakes (temperature, dissolved oxygen, pH, specific conductance, turbidity and depth), Secchi transparency; and in streams, continuous temp loggers, flow/discharge measurements, and habitat assessments. We have begun to use BioSonics integrated hydroacoustic/GPS equipment to collect data that will generate accurate bathymetric maps, including substrate type and vegetation mapping. Chemistries include nutrients (TKN, nitrite-nitrate, ammonia, total phosphorus, ortho P), total suspended solids, total hardness, alkalinity, color (correlation verified one season with dissolved organic carbon), chloride and metals (arsenic, cadmium, chromium, copper, lead, nickel, selenium, zinc), chlorophyll a (plus ash free dry mass for stream periphyton). Biological data include algal community and zooplankton from lakes (will add fish this year), and benthic macroinvertebrates and fish in streams. Additionally, we have sampled fish tissue for mercury and other contaminants of concern, and have done two sediment studies on reservation lakes and the St. Louis River, looking at physical characteristics (grain size, moisture, organic content), mercury, lead, PCBs, and toxicity tests. Our water quality data is integrated into an Access database, which was organized and designed to facilitate STORET transfer. We record field data and lab data in separate, hard copy notebooks, which are kept as a permanent record after the information is entered into the database. Contract labs submit both electronic files (generally Excel spreadsheets) and hard copies to us; our database has some forms designed specifically for ease of import of these files (including our Hydrolab output). Our sediment data is in a separate Access database, designed to be similar to the National Sediment Quality Database. The contract lab that analyzes most of our chemistry data formats the electronic files so that they can be easily imported to our Access database. Since the database was designed to be similar to STORET, our intent was to make data migration as simple as possible. We have used National WebSIM to migrate our water quality data to STORET. After the training we received, we successfully uploaded all of our water chemistry data from 1998-2006 into STORET. Since we have had staff turnover in the interim, we have not yet entered the 2007 data; will be training new staff to carry on this duty. Our Access database has provided us with a comprehensive electronic “parking lot” for all of our water quality monitoring data. Because of the way it is designed, the data is in a secure place
Page 21 of 28

with only two key staff able to enter or edit the data, and it is backed up nightly. We have been able to extract data—either specific parameters or specific waterbodies—to be able to conduct analyses, do assessment and reporting, as well as being able to easily share data with other resource management agencies in a format they can use.
Page 22 of 28

Penobscot Indian Nation Penobscot Indian Nation (PIN) collects general water quality monitoring data from late May to early October. Table 1 describes the different locations and types of monitoring we do.
Table A-1. PIN Water Monitoring Program Location or
Type Number of Stations
Characteristics monitored
Penobscot River
84 temperature, pHa, dissolved oxygen, conductivitya, BODa, E. coli bacteriaa, colora, total suspended solidsa, turbiditya, secchi disc visibility, foam (index). Additional parameters monitored less frequently include: phosphorous, nitrogen, chlorine, closed cell pH, alkalinity, tannin and lignin, chlorophyll ā, organic carbon
Penobscot River Tributaries
30 temperature, dissolved oxygen, conductivity, E. coli bacteria, color, total suspended solids, and turbidity
Trust Land Lakes and Ponds
temperature, pHa, dissolved oxygen, conductivitya, E. coli bacteriaa, colora, total suspended solidsa, turbiditya, secchi disc visibility, foam (index), alkalinity, develop trophic status index
Biomonitoring
4-6 This method involves examining communities of aquatic insects to determine water quality conditions
Ambient Toxics Monitoring
Contaminant monitoring primarily focuses on aquatic species that are used by Tribal members or that have ecological importance. Species examined include: Smallmouth bass, white suckers, muskrat, snapping turtles, freshwater mussels, and fiddlehead ferns. Toxics examined include: dioxins, furans, PCBs, chlorophenols, and trace elements (including Mercury). Regularly collect Penobscot River fish samples for ME DEP programs including Dioxin Monitoring Program and Surface Waters Ambient Toxics Program. Provide assistance to University of Maine researchers (i.e. bioassay development, histeopathology, endocrine disruption)
Other Water Quality Projects
13 ambient sites 4 point source sites
Monitoring Project to document and determine the cause of algae blooms during summer months on the Penobscot River. Sampling within the watershed for temperature, nitrogen, phosphorous, chlorophyll ā, total suspended solids, dissolved organic carbon, algal taxonomy, presence of toxins and physical/visual characteristics. Preliminary study to determine presence and characteristics of sediments in the Penobscot River. Assist USGS with occurrence & distribution study of contaminated sediments. Continuous temperature monitoring Project to examine daily water temperature patterns at numerous sites within the mainstem and tributaries of the Penobscot River. Assessment & management plan of non-point source pollution on Trust Lands and Indian Island Spring thaw sampling on Lakes/Ponds to determine effects of acidity on fish Cooperative waste load allocation study in 1997, 1998 and 2001 with Maine Department of Environmental Protection, EPA, and several dischargers to collect data for dissolved oxygen modeling of the Penobscot and Piscataquis Rivers.
a Because the Penobscot Nation Water Resources Program has a Water Quality Monitoring Cooperative Agreement with ME DEP, collected data are made available for use in Maine's 305 (b) Water Quality Assessment report to Congress. The classifications of over 400 miles of Penobscot River watershed were upgraded in the last reclassification effort by DEP as the result of Penobscot Indian Nation water quality data.
We manage our data in a MS Access database called Penobscot Indian Nation Environmental (PINE). Field data on physical/chemical parameters are collected on mobile digital assistants
Page 23 of 28

using forms created in Visual CE (software from Syware) based on tables in the PINE database. This data is synchronized with a field database file. The field database has forms for making final edits, checking in the samples and documenting bacteria sample preparation. The relevant field information is moved to a laboratory and archive database file. The laboratory database file has forms for data entry on all in-house analyses done by PIN including: bacteria, total suspended solids, biological oxygen demand, alkalinity, conductivity, turbidity, color, and pH. Laboratory data also get sent to the common archive database file. An uploading tool copies both field and laboratory data into the main PINE database file. The process for real-time electronic entry of field and laboratory data has been amended to accommodate entering data from paper reports from previous years. Current efforts include making data processing more efficient, incorporating more quality-assurance checks, and producing a good data entry form for information from external laboratories. In addition, we are working to add continuous data from data loggers/data sondes into the database. PIN is currently matching the PINE database fields to the required WQX elements. We plan to develop a data entry process for the external labs to use so that they can easily import the data when it is received. Once the matching is done, we will run a series of database queries and exporting the Results to an XML file for submission to EPA. At this stage of developing the PINE database, we are just beginning to be able to look at all of the data for one sampling season at the end of it. Our first Assessment Report to EPA included a summary of the average, minimum and maximum of each characteristic they analyzed in the PIN lab for each site they visited. We also plan to calculate a trophic state index for each of the lakes they monitor. As we begin entering more past data, we plan to look at trends over time. Benefits of data management for our program include:
• Improved ability to protect traditional tribal lifeways • Integration of all aspects of monitoring so each team member has a better understanding
of how their contribution fits into the effort as a whole • Improved quality of data entry • More timely assessment of problems with water bodies, quality-control sampling/analysis
efforts, and the ability to produce reports on problems and analysis • Better and more timely information to decision-makers • Time savings in the long run
Page 24 of 28

Yurok Tribe Environmental Program
The Yurok Tribe Environment Program (YTEP) collects continuous water quality data (temperature, pH, conductivity, Dissolved Oxygen), bacteria, nutrients, and chemicals. We also measure stage height and flow via continuous monitors. In order to manage our data, we built an SQL-based data warehouse. The database includes an XML translator to generate files and submit them to WQX. Water quality monitoring data is pushed from the database into WQX on a regular basis, as data packages are entered, validated, quality assured (QA’d), and approved. YTEP used Exchange Network funding to enhance their data management system. (For more information on these grants, see the Exchange Network Grants web site at: http://www.exchangenetwork.net/grants/index.htm) YTEP prepares an annual report summarizing water quality data collected. We also prepare a report summarizing the hydrological data collected and presenting the rating curves generated by staff based on data. We do not do much analysis beyond minimum/maximum/average charting, seven-day moving averages, percent exceedance for temperature, and identification of measurements which violate water quality standards. Benefits of data management for the YTEP include enhanced data quality, improved quality assurance/quality control (QA/QC), streamlined data handling, and increase in efficiency (reduced staff time demand for data handling).
Page 25 of 28

ATTACHMENT B: Glossary
Allowable Values – Acceptable data values that can be input for a given data element. These values provide information on the exact spelling and capitalization needed for acceptance into the STORET Warehouse. Assessment Data - Decisions about water quality that are made based on comparisons of water quality monitoring data against water quality standards. Characteristic Names – Standard names used to describe measured or analyzed parameters. Common Values Lists –List of acceptable data values that are allowed to be input into the STORET Warehouse. Common values ensure consistency between data entered by different organizations. Conditionally Required Fields – Data fields in STORET/WQX that are required only when certain conditions are met in other data fields. For example, a time zone must be entered if you enter the time of an Activity, but is otherwise not required. Data Elements – A basic unit of data within a data flow or transfer. It is often called a data field in a database. Data Field – A column in a database that can hold one specific data parameter. For example, the station ID for all stations would be contained within one data field. Data Standards – Consistent ways to report data so that they are easily understood and shared between data users. Distributed STORET – Desktop software that allows users to enter and upload data directly to the STORET Warehouse. Distributed STORET will not be supported after September 2009. Exchange Network Node – Software that facilitates the transfer of data between an organization’s database and other databases on EPA’s Exchange Network. Nodes use standards based web services and eXtensible Markup Language (XML) to allow for the seamless exchange of data between organizations regardless of hardware, operating system, or programming environment. Extensible Markup Language (XML) – An open standard language that describes data using rigid syntax rules. XML allows data to be transferred between different data systems, regardless of computer system or platform. XML overcomes system incompatibility by translating information into a common data structure and format. Field length – The maximum number of characters or numbers that can be placed in a data field. Field name – The name of a data field, which provides a common reference for a data field.
Page 26 of 28

Field type – Term referring to whether a data field can contain freely formatted text data, data of a defined format, or must conform to a list of allowable values. Formal Business Rules – Rules that ensure completeness and consistent structure of data input into the STORET Warehouse. GIS Data – Data of a spatial nature, such as a map associated with information about your waterbodies, produced using a Geographic Information System. Metadata – Data that are supplemental to and add context to your data, or “data about data.” For example, the Result values received from your lab are data, while information like the time the sample was taken and the sample collection procedure are both metadata. National WebSIM – Web-based tool used to upload water quality monitoring data to STORET Data Warehouse from spreadsheets and databases. Will be replaced by WQX Web Submission Tool (late 2008 or 2009). Node Client – Software that can be downloaded on to individuals’ computers and can initiate Exchange Network requests for data or a submission of data to other nodes. Unlike nodes, node clients can not respond to requests for data. Quality Assurance (QA)/Quality Control (QC) – Processes, samples, or results that help validate and check the quality of monitoring data and the processes used to acquire results from monitoring activities. Relational Queries – Queries used to access data in a database that relate data in one table to data in another table by the use of matching values in key fields. Required Fields – Data fields in STORET/WQX that must be included in a data submission under all circumstances. Spatial information – Information that allows data to be associated with a location on a map. STORET Data Template – Spreadsheet tool used to facilitate the entry of water quality data for eventual upload to the STORET Warehouse. Will be called STORET/WQX data template in the future. STORET Data Warehouse – The repository for water quality data, a warehouse for both STOrage and RETrieval of water quality data from across the U.S. Water Quality Exchange (WQX) – The new data transmission standard for upload to the STORET Warehouse. WQX uses the XML programming language to format data. Water Quality Monitoring Data – Field data or lab results associated with sampling events at a monitoring location.
Page 27 of 28

Wildlife Surveys – Studies designed to census and measure the number of species in order to assess the ecological health of an area. WQX Web Submission Tool (WQXWeb) – The replacement for WebSIM that will convert data (from spreadsheets and other flat file formats) to the XML format and migrate the data to the STORET Warehouse. This tool will fully replace the current function of WebSIM.
Page 28 of 28