elements of mathematical statistics. general notions mathematical statistics is a set of methods...
TRANSCRIPT

ELEMENTS OF MATHEMATICAL
STATISTICS

ELEMENTS OF MATHEMATICAL
STATISTICSGENERAL NOTIONS
Mathematical statistics is a set of methods that are used to collect, analyzegroup and interprete data concerning a certain phenomenon and predict its future evolution.THE STATISTICAL POPULATION is a definite set of similar objects.Elements of a statistical population are called statistical units or individuals.The part of the entire population for which the statistical analysis is made is called sample.CHARACTERISTIC ( or variable ) is the common feature of statistical population which we study in the statistical analysis. Characteristics are : - quantitative – if we can measure them (average , height) - qualitative – if we can`t measure them ( eyes color) .

ELEMENTS OF MATHEMATICAL
STATISTICS THE QUANTITATIVE CHARACTERISTICS can be :
- discontinuous – if the variable takes a finite number of values- continuous – if the variable takes any value from a finite or infinite interval
For example : the average mean in mathematics takes values: 1, 2, …, 10and is a discontinuous characteristic and height can take any value in a finite interval and is a continuous characteristic.STAGES OF A STATISTICAL STUDY (survey)
- collecting data- presenting data in a table from which expresses answers, allows
comparing and classifying- representing data- calculating specific parameters- interpreting data

ELEMENTS OF MATHEMATICAL
STATISTICS TOTAL EFFECTIVE is the total number of the units of a statistical population.
ABSOLUTE FREQUENCY of a value of the characteristic is the number of unitscorresponding to this value
RELATIVE FREQUENCY of a value is the fraction between the absolute frequency and the total effective.
CUMULATIVE FREQUENCY ( increasing ) of a value of the characteristic is the sum of all relative frequencies of values up to and including this value

ELEMENTS OF MATHEMATICAL
STATISTICS
EXEMPLES
GRAPHIC REPRESENTATION OF DATA
Representation of statistical series with discontinuous quantitative variable:
- by columns (on the horizontal axis – values of the variable
on the vertical axis - values of absolute frequency ).
Representation of statistical series with continuous quantitative variable: - by histogram ( on the horizontal axis- succession of segments proportional to the length of classes; there are built rectangles having these segments as bases and height proportional to the absolute frequencies ) .
1 2 3

ELEMENTS OF MATHEMATICAL
STATISTICSRepresentation of statistical series with qualitative variable : - by structural rectangle ( it is divided into rectangles of areas proportional to relative frequencies ) ,
- by structural circle ( it is divided into circle sectors with areas proportional to relative frequencies ) ,
- diagrams with columns or bands ( rectangles with equal bases and heights proportional to the absolute frequencies, placed at equal distances from each other ).
4 65 7EXEMPLES

ELEMENTS OF MATHEMATICAL
STATISTICS
EXEMPLU
CHARACTERISTIC ELEMENTS OF A STATISTICAL SERIESThe tables with the values of the characteristic and the correspondingabsolute frequencies define the distribution of the statistical repartition of the statistical variable and represent a statistical series with only one variable.
THE AVERAGEConsidering the statistical variable x taking the values x1 , x2 , x3 , … xk with the corresponding effectives n1 , n2 , n3 , … nk
Definition We call the average of the characteristics the number
_ n1 x1 +n2 x2+…+nkxk
x= ——————————— n1 +n2 +…+nk

ELEMENTS OF ELEMENTS OF MATHEMATICAL MATHEMATICAL
STATISTICSSTATISTICS ~
Definition THE MEDIAN x , is a value for which half of the values xi are smaller or equal and the other half of the values xi are bigger or equal to that.
Definition THE MODULUS ( or THE DOMINANT ) of a statistical series is the value of the characteristic corresponding to the highest frequency, in case of discontinuous values and the main value of the class corresponding to the highest frequency in case of continuous values.

Marks in MathematicsMarks in Mathematics
TABLEBACK
4
5
6 7
8 9
10
0
1
2
3
4
5
6
7
8
9
10
1 8 10 10 9 9 3
4 5 6 7 8 9 10

Marks in MathematicsMarks in Mathematics
MarksMarksStudentsStudents
Absolute Absolute frequency(ffrequency(fa a ))
Relative Relative frequency(ffrequency(fr r
) )
Cumulative Cumulative frquency(ffrquency(fc c ))
44 11 0.020.02 0.020.02
55 88 0.160.16 0.180.18
66 1100 0.200.20 0.380.38
77 1100 0.200.20 0.580.58
88 99 0.180.18 0.760.76
99 99 0.180.18 0.940.94
1010 33 0.060.06 1.001.00
CHARTBACK
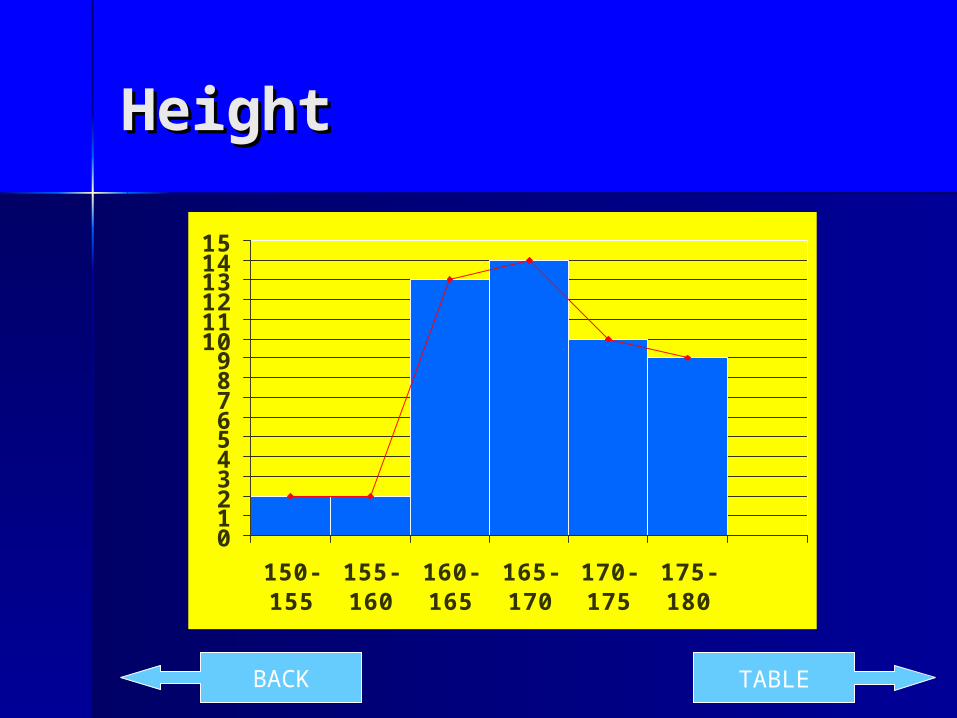
HeightHeight
TABLEBACK
0123456789
101112131415
150-155
155-160
160-165
165-170
170-175
175-180

HeightHeight
CHARTBACK
HeightHeight
StudentsStudents
Absolute Absolute frequency(ffrequency(fa a
))
Relative Relative frequency(ffrequency(fr r
) )
Cumulative Cumulative frquency(ffrquency(fc c ))
44 11 0.020.02 0.020.02
55 88 0.160.16 0.180.18
66 1100 0.200.20 0.380.38
77 1100 0.200.20 0.580.58
88 99 0.180.18 0.760.76
99 99 0.180.18 0.940.94
1010 33 0.060.06 1.001.00

Distance from home to Distance from home to schoolschool
TABLEBACK
6
910
9
4
7
5
0
1
2
3
4
5
6
7
8
9
10
0-300 300-600 600-900 900-1200 1200-1500
1500-1800
1800-2100

Distance from home to Distance from home to schoolschool
CHARTBACK
DistanceDistance
StudentsStudents
Absolute Absolute frequency(ffrequency(fa a
))
Relative Relative frequency(ffrequency(fr r
) )
Cumulative Cumulative frquency(ffrquency(fc c ))
0-3000-300 66 0.120.12 0.120.12
300-600300-600 99 0.180.18 0.300.30
600-900600-900 1100 0.200.20 0.500.50
900-1200900-1200 99 0.180.18 0.680.68
1200-15001200-1500 44 0.080.08 0.760.76
1500-18001500-1800 77 0.140.14 0.900.90
1800-21800-2110000 55 0.100.10 1.001.00

Eye colourEye colour
TABLEBACK
Blue Green Brown Black
10% 28% 52% 10%

Eye colourEye colour
Eye colourEye colour StudentsStudents
BlueBlue 55
GreenGreen 1414
BrownBrown 2626
BlackBlack 55
CHARTBACK

Favourite sportFavourite sport
TABLEBACK
0 1 2 3 4 5 6 7 8 9 10111213141516
Voleyball
Handball
Basketball
Football
Tennis
Other

Favourite sportFavourite sport
SportSport StudentsStudents
VoleyballVoleyball 1515
HandballHandball 33
BasketballBasketball 44
FootballFootball 1515
TennisTennis 88
OtherOther 66
CHARTBACK

Favourite musicFavourite music
TABLEBACK
House22%
Dance24%
Rock12%
Symphonic8%
HeavyMetal6%
Rap14%
Other14%

Favorite musicFavorite music
TypeType StudentsStudents
HouseHouse 1111
DanceDance 1212
RockRock 66
SymphonicSymphonic 44
Heavy metalHeavy metal 33
RapRap 77
OtherOther 77
CHARTBACK

Birth monthBirth month
TABLEBACK
012345678
Janu
ary
Febr
uary
Mar
chAp
rilMay
June Ju
ly
Augu
st
Sept
embe
r
Octob
er
Novem
ber
Decem
ber

Birth monthBirth month
MonthMonth StudentsStudents
JanuaryJanuary 33
FebruaryFebruary 22
MarchMarch 77
AprilApril 44
MayMay 55
JuneJune 44
JulyJuly 44
AugustAugust 22
SeptemberSeptember 44
OctoberOctober 66
NovemberNovember 44
DecemberDecember 55
CHARTBACK

Survey carried out bySurvey carried out bystudents and staff of students and staff of
National College National College “August Treboniu Laurian” “August Treboniu Laurian”
BotosaniBotosaniRomaniaRomania