elements of the framework debate the needs of users of financial ... part of the european paaine...
TRANSCRIPT

ELEMENTS OF THE FRAMEWORK DEBATE
THE NEEDS OF USERS OF FINANCIAL INFORMATIONA USER SURVEY
PRO-ACTIVE ACCOUNTING ACTIVITIES IN EUROPE (PAAinE)
MAY 2009
PRO-ACTIVE ACCOUNTING ACTIVITIES IN EUROPE (PAAinE)

© The Conseil National de la Comptabilité and EFRAG (2009)
This survey was carried out by the PAAinE Framework Project Team led by staff of the French standard setter (the Conseil National de la Comptabilité (‘CNC’)). This report has been prepared by the same team. The work has been carried out as part of Europe’s PAAinE initiative.
The report is being issued by the CNC and EFRAG (the European Financial Reporting Advisory Group). It has been approved by the Co-ordinating Group of PAAinE, which at the time comprised representatives of the issuers and of the National Standard-Setters of The Netherlands, Poland, Spain, and Sweden, although those bodies do not express an opinion on the views expressed in the report.
The report is available for downloading from the websites of the issuers.
About the PAAinE
EFRAG and the European National Standard Setters have agreed to pool some of their resources and work together more closely so that Europe as a whole can participate more effectively in the global accounting debate. It was agreed that this initiative should in the beginning concentrate on long-term pro-active work. The objective of the initiative is to stimulate debate on important items on the IASB agenda at an early stage in the standard-setting process before the IASB formally issues its proposals. The initiative has the joint ambitions of representing a European point of view and exercising greater influence on the standard-setting process. This initiative is known as the 'Proactive Accounting Activities in Europe' (or PAAinE) initiative.
Several projects have commenced under the PAAinE initiative, and this paper is the result of the PAAinE project that relates to the joint IASB/FASB project on the Conceptual Framework.
Work carried out under the PAAinE initiative can take a number of different forms and the full objectives of the initiative are:
• to stimulate, carry out and manage pro-active development activities designed to encourage the debate in Europe on accounting matters and to enhance the quality of the proactive input to the IASB;
• to co-ordinate and resource monitoring work of IASB and FASB projects; and
• to try to ensure, as far as is practicable, that the messages Europe gives the IASB are consistent.
A further description of the PAAinE initiative is available on the EFRAG website (www.efrag.org).
The Needs of Users of Financial Information
1
SUMMARY OF CONTENTS
Pages
1 INTRODUCTION 1
2 PURPOSE OF THE SURVEY 1
3 SCOPE 2
4 METHODOLOGY 2 - 4
5 LIMITATIONS DISCLAIMER 4
6 SUMMARY OF RESULTS 4 - 10
APPENDICES
1 RESULTS OF THE SURVEY 11 – 25
2 USER SURVEY QUESTIONNAIRE 26 – 32
3 LIST OF COUNTRIES INCLUDED IN THE SURVEY 33
4 THE PAAINE PROJECT TEAM 34
The Needs of Users of Financial Information
1
INTRODUCTION
The PAAinE initiative on the conceptual framework
1.1 The Survey of the needs of users of financial information (User Survey) forms part of the European PAAinE initiative on the conceptual framework. It relates to the first phase of the IASB/FASB’s (Joint Boards’) Framework project, and in particular to the views expressed initially in the Joint Boards’ discussion paper Preliminary Views on an improved Conceptual Framework for Financial Reporting: The Objective of Financial Reporting and Qualitative Characteristics of Decision-useful Financial Reporting Information (issued in July 2006) and subsequently largely repeated in Exposure Draft of An improved Conceptual Framework for Financial Reporting: Chapter 1: The Objective of Financial Reporting & Chapter 2: Qualitative Characteristics and Constraints of Decision-useful Financial Reporting Information (issued in May 2008).
1.2 The PAAinE project team’s first discussion paper issued in October 2006 (“The conceptual framework: Starting from the right place?”) identifies different key issues that, the PAAinE project team argues, have not been dealt with adequately in the first phase of the Joint Boards’ project. One of the central issues identified by the PAAinE project team is that, although the identification of user needs is a pre-requisite to determining the objectives and qualitative characteristics of financial reporting, the first phase of the project is largely based on assumptions and unsupported assertions with respect to user needs. The issue was therefore taken onto the agenda of the PAAinE project on the conceptual framework.
1.3 At the end of 2006, in order to obtain information directly from user sources the PAAinE project team decided to carry out a survey in accordance with the methodology described in section 4.
PURPOSE OF THE SURVEY
2.1 The principal aim of the User Survey is to determine:
(a) how useful different forms of financial information are to users in their decision-making process;
(b) what improvements to financial information users require; and
(c) whether certain assumptions made by the Joint Boards were valid with respect to:
(i) the cash flow predictive objective of financial reporting; and
(ii) the stewardship objective of financial reporting.
The Needs of Users of Financial Information
2
SCOPE
3.1 The User Survey is intended to cover ‘financial information’ needs in a broad sense. No attempt is made in this survey to define ‘financial information’ precisely and exhaustively and respondents were left free to determine what they included in this term. It is, however, assumed to include financial statements, management commentary and different forms of financial communication such as press releases. The term ‘financial reporting’, which is not defined by the Joint Boards, has been avoided as it may be interpreted in a restrictive manner by respondents; whereas the intention of the survey is to allow respondents to express their needs freely without reference to this undefined concept.
3.2 The users targeted are professional investors, lenders and related advisors. This is a pragmatic choice based on the fact that:
(a) it would not be practical to address all user categories, although a limited number of replies received from untargeted categories (e.g. regulators) have been included in the results and presented as a separate category ‘others’;
(b) investors, lenders and related advisors are identified as the primary users of financial reporting by the Joint Boards in their July 2006 discussion paper. The May 2008 ED identifies ‘capital providers’ as the primary user group, but the meaning appears to be the same; and
(c) these categories appear to have similar needs, as assumed by the Joint Boards, and this assumption should be tested by the survey.
3.3 The types of entity targeted in the survey, to which the financial information needs apply, are listed and unlisted entities that have adopted International Financial Reporting Standards (IFRS).
METHODOLOGY
4.1 The PAAinE project team decided that, for practical reasons, the survey would not be based on statistical methodology. The survey was carried out on the assumption that useful information could be obtained from the user organisations identified by the various European national standard setters. The PAAinE project team therefore contacted the 25 European national standard setters on EFRAG’s contact list as at June 2006 (see Appendix 3 for more details). Those national standard setters were asked to identify those organisations in their country deemed the most representative of investors, lenders and their advisors and were left free to decide the number of organisations that would meet this objective. The user organisations identified were then invited to take part in the survey by completing the User questionnaire online. 32 user organisations in 10 countries eventually took part in the survey (see appendix 3 and paragraph 6.1 below).
4.2 The User questionnaire (see Appendix 2) was designed to be completed in around twenty minutes, assuming that respondents would not be prepared to allocate more time to the task. The questionnaire therefore contains only 7 direct questions plus an ‘Any further comments’ and an ‘Identification’ question .The questions contain closed and open sub-questions. The open sub-questions enable the respondents to suggest up to three additional replies.
The Needs of Users of Financial Information
3
4.3 The questionnaire had a dual structure:
(a) Questions 1 to 3 address the usefulness of financial information in a broad sense; and
(b) Questions 4 to 7 focus on the usefulness of financial statements.
4.4 The objective of each of the 7 questions was set out in full in the questionnaire and can be summarised as follows:
• Question 1—To determine the relative importance of financial information other than financial statements in the users’ decision process.
• Question 2(a)—To determine the level of satisfaction of users with the different sources of financial information identified in Question 1.
• Question 2(b)—To specify one area where improvement is required.
• Question 2(c)—To indicate which source of financial information requires improvement.
• Question 3(a)—To test the Joint Boards’ assumption that information on an entity’s cash flow generating capacity is the key to all major user decisions, including management assessment.
• Question 3(b)—To determine whether users consider that the financial statements provide the necessary information on an entity’s cash flow generating capacity.
• Question 3(c)—To the extent that the answer to question 3(b) is ‘no’, to determine which report—within or outside the financial statements—users believe the additional information needed should be provided.
• Question 4—To assess the usefulness of the financial statements for different types of decision.
• Question 5—To determine whether certain components of the financial statements are considered more useful than others.
• Question 6—To determine which financial indicators derived from the financial statements are considered the most useful.
• Question.7—To determine which improvements to the financial statements users consider necessary.
4.5 Participants were asked to rate the usefulness of the above–mentioned financial information on a scale from 1 to 5, where 5 is the most useful. Responses between 3 and 5 on the scale were considered ‘useful or very useful’ in the analysis of the results, whereas results of 1 or 2 were considered ‘not very useful’.
4.6 The results were analysed primarily by country. The pie charts in Appendix 1 represent the total replies of the 10 countries that took part in the survey. The results were reviewed to determine whether there were national differences and any such differences were dealt with in the commentary on the results in Appendix 1.
The Needs of Users of Financial Information
4
4.7 The results were further analysed by user category to determine whether responses varied according to specific user needs. The relevant variations were dealt with in the commentary on the results in Appendix 1.
LIMITATIONS DISCLAIMER
5.1 The PAAinE project team recognises that the User Survey is not a statistically valid survey of the information needs of users in Europe. It is based on 32 replies from user organisations in 10 countries. Although at the time the survey was carried out, the 10 countries in question represent approximately 70% of the Gross Domestic Product of the European Union, several major countries including Belgium, The Netherlands and Spain are not represented. (See Appendix 3 for more details.) Moreover, the four most important economies of the European Union at the time—France, Germany, Italy and the UK—are represented in the survey by only 14 user organisations. The remaining 18 replies come from users’ organisations in countries representing at the time less than 9% of the GDP of the European Union. All answers received from user organisations are given equal weighting in the analysis of the results of the survey, irrespective of the economic importance of the countries from which they originate. In a marginal number of cases where replies were received from individuals they were treated in the same way as if they had come from organisations. The survey is based on the assumption that the user organisations identified by national standard setters are sufficiently representative of users in their countries and that the persons taking part are representative of those organisations.
5.2 The low number of replies received is a major limitation in establishing trends. This limitation is even more pronounced when the responses are broken down by country or user category. As a result, it appears more significant to consider the results in total for all users’ organisations participating, except where the number of replies by country or user category provides a sufficient basis for further analysis.
5.3 In spite of these limitations the PAAinE project team considers that the survey results contain some interesting information which is summarised in section 6 below.
SUMMARY OF RESULTS
Participation by country
6.1 User organisations from 10 countries out of 25 targeted actually took part in the survey. In those 10 countries a total of 641respondents were identified by national standard setters (NSS) and 322 different respondents actually took part.
1 The 64 respondents represent user organisations with some exceptions. The 11 Swedish respondents identified by the NSS include 10 individuals and one organisation. The German NSS identified 4 respondent organisations of which 2 were represented by the same person. The latter respondent has been counted once only. 2 The majority of the 32 respondents represent user organisations and are referred to as such in this report although a marginal number of individual users are also included (e.g. the 2 replies for Sweden comprise one organisation and one individual).
The Needs of Users of Financial Information
5
U.K. Denmark Poland Italy Germany Sweden France Lithuania Latvia Cyprus Total
Respondents identified by NSS
4 16 11 7 3 11 3 6 2 1 64
Actual participation
4 7 1 5 2 2 3 6 1 1 32
Participation rate 100% 43% 9% 71% 67% 18% 100% 100% 50% 100% 50%
Participation by user category
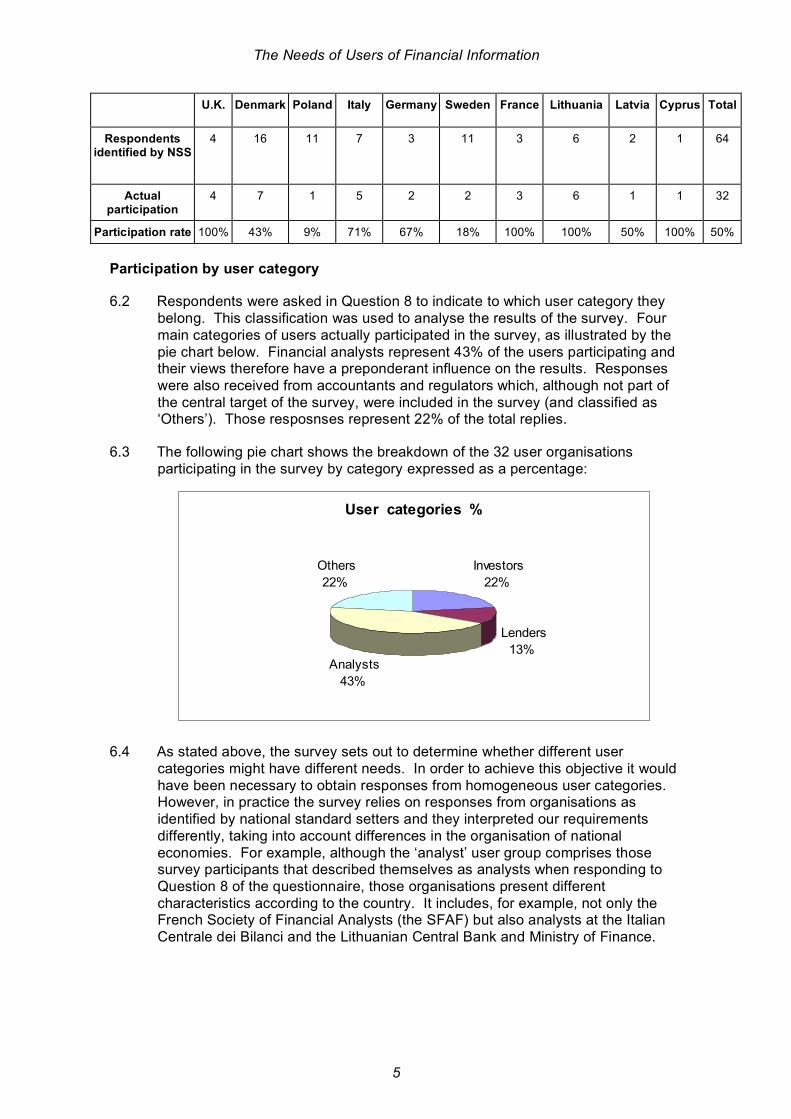
6.2 Respondents were asked in Question 8 to indicate to which user category they belong. This classification was used to analyse the results of the survey. Four main categories of users actually participated in the survey, as illustrated by the pie chart below. Financial analysts represent 43% of the users participating and their views therefore have a preponderant influence on the results. Responses were also received from accountants and regulators which, although not part of the central target of the survey, were included in the survey (and classified as ‘Others’). Those resposnses represent 22% of the total replies.
6.3 The following pie chart shows the breakdown of the 32 user organisations participating in the survey by category expressed as a percentage:
6.4 As stated above, the survey sets out to determine whether different user categories might have different needs. In order to achieve this objective it would have been necessary to obtain responses from homogeneous user categories. However, in practice the survey relies on responses from organisations as identified by national standard setters and they interpreted our requirements differently, taking into account differences in the organisation of national economies. For example, although the ‘analyst’ user group comprises those survey participants that described themselves as analysts when responding to Question 8 of the questionnaire, those organisations present different characteristics according to the country. It includes, for example, not only the French Society of Financial Analysts (the SFAF) but also analysts at the Italian Centrale dei Bilanci and the Lithuanian Central Bank and Ministry of Finance.
User categories %
Investors
22%
Lenders
13% Analysts
43%
Others
22%
The Needs of Users of Financial Information
6
Analysis of results
6.5 The detailed results of the survey in graphic form, including a commentary on each question and an analysis of responses by user category, are set out in Appendix 1. The paragraphs that follow summarise the actual responses received, as well as some thoughts on possible interpretations or orientation for further research. The main themes identified are set out under the heading ‘Highlights’ in paragraphs 6.15-6.17 below.
6.6 Users are almost unanimous in finding financial statements and management commentary the most useful sources of financial information. Economic surveys are considered useful by 31% of users as against 25% for press releases and 41% for market information (see Appendix 1, Question 1). This would appear to reflect:
(a) a preference for accounting information in the financial statements presumably considered more reliable, and
(b) the view that the management commentary provides relevant decision-useful information
6.7 When asked to indicate their level of satisfaction with the above-mentioned sources of financial information (Appendix 1, Question 2(a)), users again expressed almost unanimous satisfaction with financial statements. However, the overall level of user satisfaction with management commentary is lower (72%). Users in all countries are unanimous in expressing greater satisfaction with financial statements than with management commentary, with the exception of the UK where 3 users’ organisations out of 4 gave a higher rating to management commentary than financial statements.
This would appear to reflect a ‘UK view’ on the relevance of management commentary whilst in most other countries user organisations preferred with the financial statements, possibly because they were considered a ‘more reliable’ source of information.
6.8 Users were asked to identify one area where improvement to financial information is the most required; a list of possibilities was offered, but survey participants were free to add to the list (see Appendix 1, Question 2(b)). The main areas identified for improvement in financial information were the possibilities listed:
(a) more/better information on the risk management process (32% of users);
(b) more/better quality prospective financial information (26 % of users);
(c) highlighting trends in growth and profitability (19% of users);
(d) competitive analysis (13% of users); and
(e) improved segmental information (10% of users).
When asked in which report these improvements were required (Appendix 1, Question 2(c)), 48% of users indicated the management commentary as opposed to the financial statements (39%).

The Needs of Users of Financial Information
7
6.9 Users were asked whether information on an entity’s cash flow generating capacity was the key to making ‘hold/buy/sell’, management evaluation and credit assessment decisions. 69% of users confirmed the usefulness of information on an entity’s cash flow generating capacity for hold/buy/sell decisions as opposed to 66% for management evaluation and credit assessment (see Appendix 1, Question 3(a)).
This question set out to test the assumptions and assertions made in the Joint Boards’ July 2006 discussion paper (and subsequently in the May 2008 ED) and in particular the assertion that information on an entity’s cash generating capacity is decision-useful. The user organisations’ replies appear to confirm the validity of the Joint Boards’ assumptions and assertions with respect to the decision-usefulness of information on an entity’s cash generating capacity.
6.10 In response to the question about whether sufficient decision–useful information on an entity’s cash generating capacity can be derived from the financial statements, 53% of total users (including 100% of lenders) replied ‘no’ (see Appendix, 1 Question 3(b)). When those answering ‘no’ were asked where information on an entity’s cash flow generating capacity should be provided, 33% thought it should be provided as a forecast in the cash flow statement, 28% thought it should be provided in the notes, 22% in a separate report, and 17% in the balance sheet valuations (see Appendix 1, Question 3(c)).
A majority of users were in favour of including a cash forecast in the cash flow statement. This seems to be corroborated by the desire expressed by many users for more prospective information (see Appendix 1, Questions 2(b) and 7).
Users’ replies also seem to reflect a certain view of what the balance sheet should present or not present, since only 17% of users consider that balance sheet valuations should reflect an entity’s cash generating capacity. This is however a subject in its own right that would require further research to determine what implications if any this might have for users’ views on, for example, the use of fair value measures in the balance sheet.
It needs to be borne in mind that there may be differences in the way users interpret what “information useful in assessing cash flow prospects” means. Information on past cash flows might be considered by some users to be a sufficient basis for assessing cash flow prospects. Other users may feel that that forecast information would better represent an entity’s cash flow generating capacity. This would explain why a significant group of users was in favour of the presentation of forecasts in the cash flow statement.
6.11 With respect to Question 4 (on the usefulness of financial statements for certain types of decision), 88% of users find the financial statements useful for the evaluation of management, 75% find them useful for credit assessment and 72% for ‘hold/buy/sell’ decisions (see Appendix 1, Question 4).
Bearing in mind the historical perspective of financial statements, it may appear surprising that 72% of users found them useful for hold/buy/sell decisions. Indeed the 28% holding the opposite view considered in most cases that the financial statements were of no value for such decisions. The latter view is held by a number of analysts and regulators across different countries. The same respondents often give a high rating to the management evaluation function of financial statements.

The Needs of Users of Financial Information
8
This view as to the usefulness of financial statements for management evaluation involved no significant national exceptions and, for analysts, investors and ‘other’ users, financial statements are more useful for management evaluation than for hold/buy sell decisions or credit assessment. This would appear to confirm the importance of the stewardship objective of financial statements—in the sense of management evaluation—for users. Indeed, for investors and analysts management evaluation would appear to be the primary objective of financial statements.
The implications of this for certain Joint Board projects need to be drawn out. For example, what are the implications, if any, for the debate about the proprietary and entity views of reporting, the relevance of different valuation bases, the role of the management commentary etc?
6.12 The survey sought in Question 5 (see Appendix 1) to determine whether certain of the reports comprising the financial statements were perceived by users to be more useful than others. Whilst all of the components of the financial statements are considered useful or very useful, the highest rating is given to the Income statement (considered useful or very useful by 94% of users) and the balance sheet (88% of users) and, followed closely by the notes (82% of users) and the cash flow statement (75%) and the statement of changes in equity (66% of users). Whilst this trend is representative of users in most countries, the view of 3 UK users out of 4 was that the cash flow statement was more useful than the balance sheet.
The UK users appear to find the financial statements in their current form more useful to represent performance than financial position .It would be interesting to investigate this point further in order to gain further insight. Would, for example, a different view of financial position than that currently presented in the financial statements be considered more useful to users? Or is it an indication that financial statements should focus more on the presentation of performance?
6.13 The survey also sought to determine whether certain indicators derived from the financial statements were considered more useful than others (see Appendix 1, Question 6). Users consider income-based indicators derived from the financial statements the most useful. Operating income was considered the most useful of the indicators mentioned in the questionnaire (84 % users thought it was useful or very useful) followed by revenue (72%), net income (71%), debt/equity ratio (68% of users), liquidity ratios (59%), earnings per share (56%) and cash flows (29%).
Respondents were asked to mention any other indicator they found useful, and the most commonly mentioned were EBITDA and profitability ratios such as return on capital employed and return on equity.
Indicators of operating performance appear to be considered more useful than net income or earnings per share by all user categories, including investors. Further investigation would be useful to establish whether this reflects, for example, the requirement to determine ‘recurrent’ performance and how this should be reflected in the financial statements. Moreover, the preference for indicators such as EBITDA or return on capital employed might reveal an appetite for the systematic presentation of such information in the notes or the management commentary which could be further investigated.
The Needs of Users of Financial Information
9
6.14 Users were further asked which improvements would make financial statements more useful to them (see Appendix 1, Question 7). Five possible improvements were suggested in the questionnaire, and survey participants were invited to specify up to three further improvements. Users’ ranking of the areas of possible improvement were:
(a) Stability of reporting standards (84% of users thought this would be useful or very useful).
(b) Improved comparability (78%of users).
(c) Simplification of presentation (65% of users).
(d) Prospective financial information (50% of users).
The desire for stability of reporting standards and improved comparability probably have a common objective: to compare the financial statements of an entity through time and against other entities. This seems also to confirm the responses given to Question 2(b) (in which 19% of users said highlighting trends in growth and profitability was a priority area for improvement) and Question 2 (in which 13% of users gave priority to ‘competitive analysis’ as an improvement to financial information). This evidence would appear to suggest that users find it hard to establish trends.
The requirement for stability of reporting standards and improved comparability is essentially a message to the Joint Boards. In spite of the Joint Boards’ objective of creating a stable platform of reporting standards the convergence project is leading, in the short term at least, to numerous changes to IFRSs. This begs the question as to what messages the Joint Boards take from this for, for example, their convergence projects? If further changes to existing standards are considered inevitable, should the disclosure of pluri-annual trends for certain key indicators, including a better defined operating result, be mandatory?
Highlights of the main findings
6.15 The findings as to the most decision-useful financial information (Questions 1, 5 and 6) can be summarised as follows.
(a) The majority of users find financial statements and management commentary the most useful sources of financial information as compared to press releases, economic surveys and market information.
(b) The relevance of the management commentary as a source of decision-useful information is confirmed by the survey and some users consider it more useful than the financial statements. Although Question 1 refers specifically to “management commentary in the annual report”, it has been observed that some respondents may have had a broader ‘management communication’ concept in mind.
(c) Whilst users as a whole find both balance sheet and income statement useful, certain users clearly find the income statement more useful (see paragraph 6.12).
(d) Although the disclosure of the results of operating activities is not required and the concept is undefined under IFRSs, operating income is considered
The Needs of Users of Financial Information
10
by users to be the most useful indicator in the financial statements (see paragraph 6.13).There would, therefore, appear to be room for principles-based guidance with respect to the definition of operating income, bearing in mind the concept is so widely used in practice.
6.16 The survey has highlighted that users believe the main improvements required to decision-useful financial information (Questions 2 and 7) are as follows.
(a) Stability in reporting standards, improved comparability and simplicity of presentation highlighting key data and disclosures are the main improvements to financial statements required by users (see paragraph 6.14). One of the user priorities for improvement to financial information (see paragraph 6.8) is to highlight trends in growth and profitability.
(b) With respect to financial information in general and in particular management commentary, the highest priorities for improvement according to users concern the disclosure of risk management information, more or better quality prospective information, and highlighting trends in growth and profitability (see paragraphs 6.6-6.9). The IASB has a management commentary project on its active agenda including a forthcoming exposure draft which will offer an opportunity to provide appropriate input.
6.17 The main findings as regards the objectives of financial statements (questions 3 and 4) were as follows.
(a) Users’ replies suggest that they use financial statements more for management evaluation than for resource allocation (see paragraph 6.11).
(b) The decision usefulness of information on an entity’s cash flow generating capacity is confirmed by the survey. However, the majority of users clearly feel that insufficient information is provided about this by financial statements in their current form. It is however recognised that there may be differences in the way users interpret what “information useful in assessing cash flow prospects” means.

The Needs of Users of Financial Information
11
APPENDIX 1: RESULTS OF THE SURVEY
Q1. WHICH KINDS OF FINANCIAL INFORMATION DO USERS FIND MOST USEFUL?
• Financial statements
• Management commentary
• Other sources. (Users were invited to specify up to three additional items: press releases, economic surveys and market information were mentioned as examples.)
Press releases
No answ er
50%
Useful or
very
useful
25%
not very
useful
25%
Economic survey
not very
useful
13%
No answ er
56%
Useful or
very useful
31%
Market information
not very
useful
9%
Useful or
very useful
41%
No answ er
50%
Management Commentary
Useful or
very useful
94%
not very
useful
3%No answ er
3%
Financial Statements
Useful or
very useful
97%
No answ er
3%
The Needs of Users of Financial Information
12
Analysis by user category
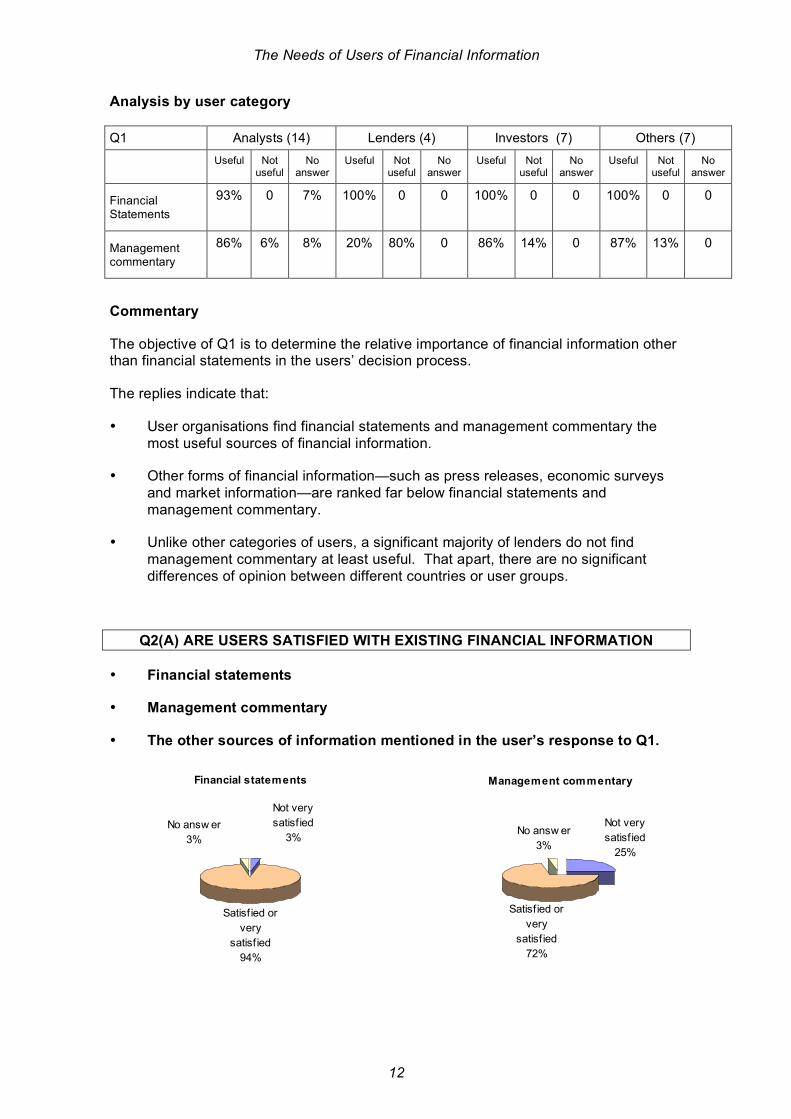
Q1 Analysts (14) Lenders (4) Investors (7) Others (7)
Useful Not
useful No
answer Useful Not
useful No
answer Useful Not
useful No
answer Useful Not
useful No
answer
Financial Statements
93% 0 7% 100% 0 0 100% 0 0 100% 0 0
Management commentary
86% 6% 8% 20% 80% 0 86% 14% 0 87% 13% 0
Commentary
The objective of Q1 is to determine the relative importance of financial information other than financial statements in the users’ decision process.
The replies indicate that:
• User organisations find financial statements and management commentary the most useful sources of financial information.
• Other forms of financial information—such as press releases, economic surveys and market information—are ranked far below financial statements and management commentary.
• Unlike other categories of users, a significant majority of lenders do not find management commentary at least useful. That apart, there are no significant differences of opinion between different countries or user groups.
Q2(A) ARE USERS SATISFIED WITH EXISTING FINANCIAL INFORMATION
• Financial statements
• Management commentary
• The other sources of information mentioned in the user’s response to Q1.
Financial statements
Satisf ied or
very
satisf ied
94%
Not very
satisf ied
3%
No answ er
3%
Management commentary
Not very
satisf ied
25%
No answ er
3%
Satisf ied or
very
satisf ied
72%
The Needs of Users of Financial Information
13
Analysis by user category
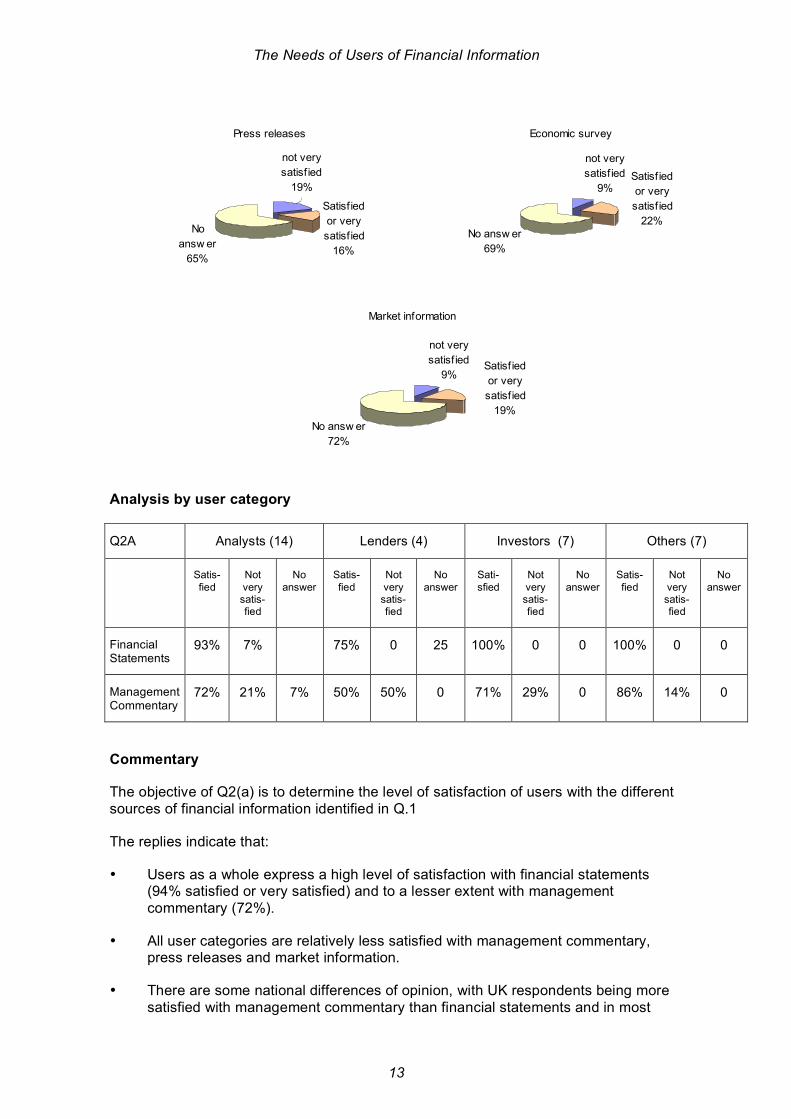
Q2A Analysts (14) Lenders (4) Investors (7) Others (7)
Satis-fied
Not very satis-fied
No answer
Satis-fied
Not very satis-fied
No answer
Sati-sfied
Not very satis-fied
No answer
Satis-fied
Not very satis-fied
No answer
Financial Statements
93% 7% 75% 0 25 100% 0 0 100% 0 0
Management Commentary
72% 21% 7% 50% 50% 0 71% 29% 0 86% 14% 0
Commentary
The objective of Q2(a) is to determine the level of satisfaction of users with the different sources of financial information identified in Q.1
The replies indicate that:
• Users as a whole express a high level of satisfaction with financial statements (94% satisfied or very satisfied) and to a lesser extent with management commentary (72%).
• All user categories are relatively less satisfied with management commentary, press releases and market information.
• There are some national differences of opinion, with UK respondents being more satisfied with management commentary than financial statements and in most
Press releases
Satisf ied
or very
satisf ied
16%
No
answ er
65%
not very
satisf ied
19%
Economic survey
not very
satisf ied
9%
No answ er
69%
Satisf ied
or very
satisf ied
22%
Market information
not very
satisf ied
9%
No answ er
72%
Satisf ied
or very
satisf ied
19%

The Needs of Users of Financial Information
14
other countries the reverse being true. Indeed, in France and in Italy the level of satisfaction with management commentary expressed by investors and lenders is low.
Q2(B) ONE AREA WHERE IMPROVEMENT IS MOST REQUIRED.
• PROSPECTIVE FINANCIAL INFORMATION
• MORE INFORMATION ON RISK MANAGEMENT PROCESS
• COMPETITIVE ANALYSIS
• IMPROVED SEGMENTAL INFORMATION
• HIGHLIGHTING TRENDS IN GROWTH AND PROFITABILITY
• OTHER
Analysis by user category
Q2b Analysts (14) Lenders (4) Investors (7) Others (7)
More information on risk management process
42% 25% 0 43%
Competitive analysis 8% 0% 28% 14%
Improved segmental information 8% 25% 14% 0
Highlighting trends in growth and profitability
25% 0 29% 14%
Prospective financial information 17% 50% 29% 29%
- Prospective financial
information
26%
- Highlighting trends in
growth and profitability
19% - Improved segmental
information
10%
- Competitive analysis
13%
- More information on
risk management
process
32%
The Needs of Users of Financial Information
15
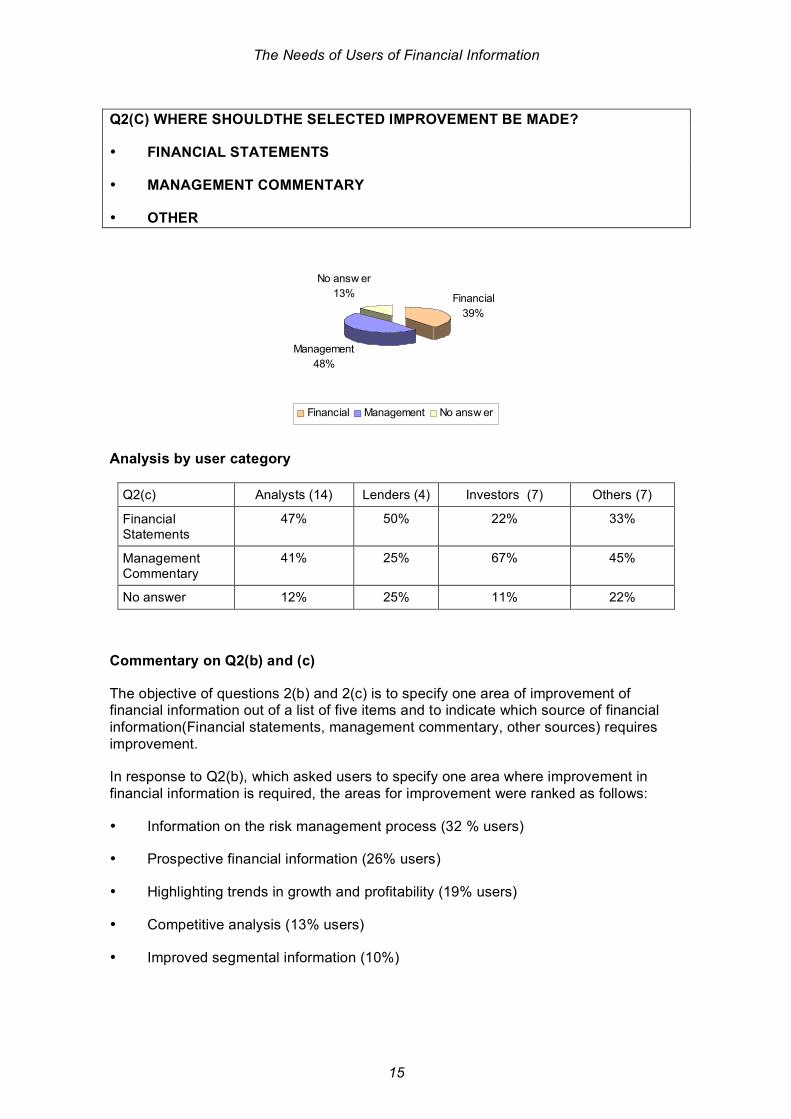
Q2(C) WHERE SHOULDTHE SELECTED IMPROVEMENT BE MADE?
• FINANCIAL STATEMENTS
• MANAGEMENT COMMENTARY
• OTHER
Analysis by user category
Q2(c) Analysts (14) Lenders (4) Investors (7) Others (7)
Financial Statements
47% 50% 22% 33%
Management Commentary
41% 25% 67% 45%
No answer 12% 25% 11% 22%
Commentary on Q2(b) and (c)
The objective of questions 2(b) and 2(c) is to specify one area of improvement of financial information out of a list of five items and to indicate which source of financial information(Financial statements, management commentary, other sources) requires improvement.
In response to Q2(b), which asked users to specify one area where improvement in financial information is required, the areas for improvement were ranked as follows:
• Information on the risk management process (32 % users)
• Prospective financial information (26% users)
• Highlighting trends in growth and profitability (19% users)
• Competitive analysis (13% users)
• Improved segmental information (10%)
Financial
39%
Management
48%
No answ er
13%
Financial Management No answ er
The Needs of Users of Financial Information
16
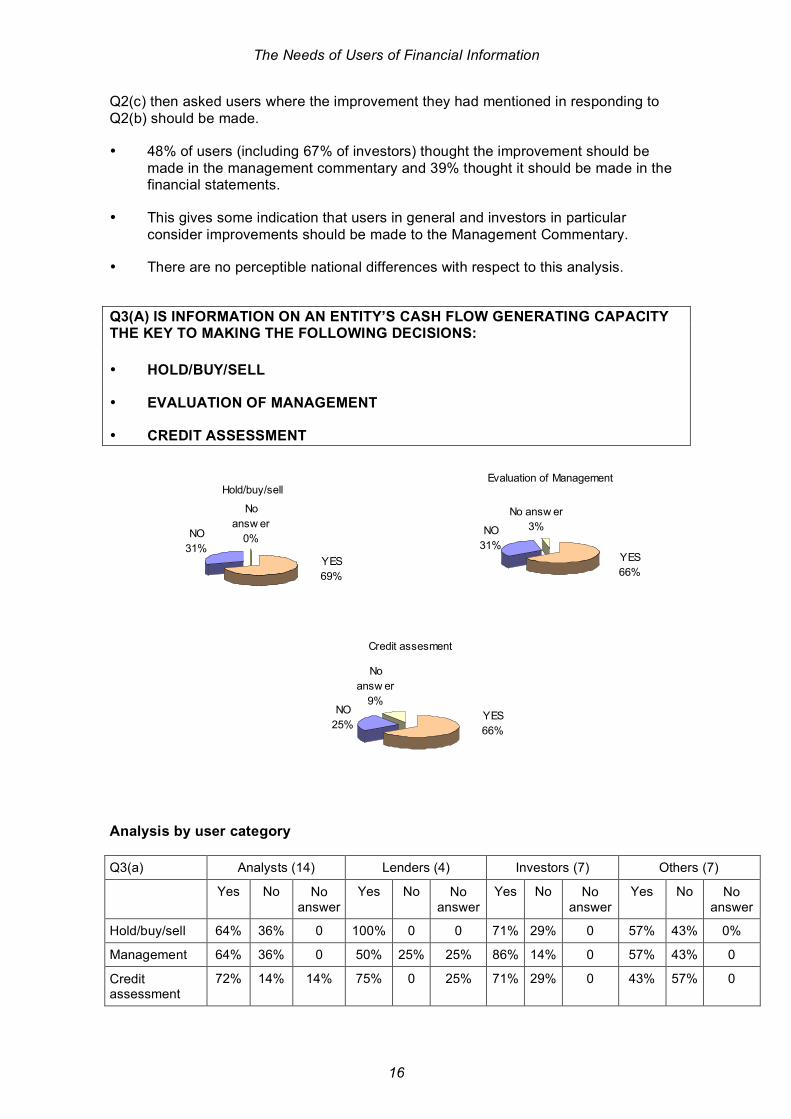
Q2(c) then asked users where the improvement they had mentioned in responding to Q2(b) should be made.
• 48% of users (including 67% of investors) thought the improvement should be made in the management commentary and 39% thought it should be made in the financial statements.
• This gives some indication that users in general and investors in particular consider improvements should be made to the Management Commentary.
• There are no perceptible national differences with respect to this analysis.
Q3(A) IS INFORMATION ON AN ENTITY’S CASH FLOW GENERATING CAPACITY THE KEY TO MAKING THE FOLLOWING DECISIONS:
• HOLD/BUY/SELL
• EVALUATION OF MANAGEMENT
• CREDIT ASSESSMENT
Analysis by user category
Q3(a) Analysts (14) Lenders (4) Investors (7) Others (7)
Yes No No answer
Yes No No answer
Yes No No answer
Yes No No answer
Hold/buy/sell 64% 36% 0 100% 0 0 71% 29% 0 57% 43% 0%
Management 64% 36% 0 50% 25% 25% 86% 14% 0 57% 43% 0
Credit assessment
72% 14% 14% 75% 0 25% 71% 29% 0 43% 57% 0
Credit assesment
NO
25%
No
answ er
9%
YES
66%
Evaluation of Management
NO
31%
No answ er
3%
YES
66%
Hold/buy/sell
NO
31%
No
answ er
0%
YES
69%
The Needs of Users of Financial Information
17
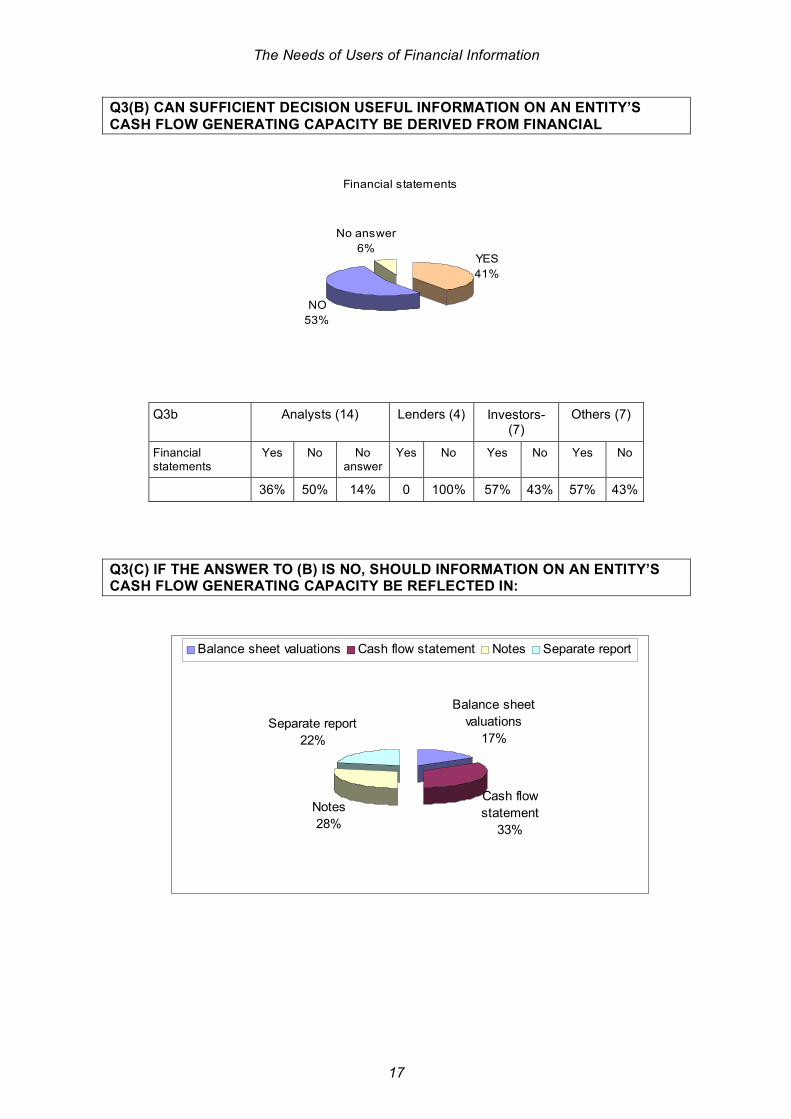
Q3(B) CAN SUFFICIENT DECISION USEFUL INFORMATION ON AN ENTITY’S CASH FLOW GENERATING CAPACITY BE DERIVED FROM FINANCIAL
Q3b Analysts (14) Lenders (4) Investors- (7)
Others (7)
Financial statements
Yes No No answer
Yes No Yes No Yes No
36% 50% 14% 0 100% 57% 43% 57% 43%
Q3(C) IF THE ANSWER TO (B) IS NO, SHOULD INFORMATION ON AN ENTITY’S CASH FLOW GENERATING CAPACITY BE REFLECTED IN:
Balance sheet
valuations
17%
Cash flow
statement
33%
Notes
28%
Separate report
22%
Balance sheet valuations Cash flow statement Notes Separate report
Financial statements
YES
41%
NO
53%
No answer
6%
The Needs of Users of Financial Information
18
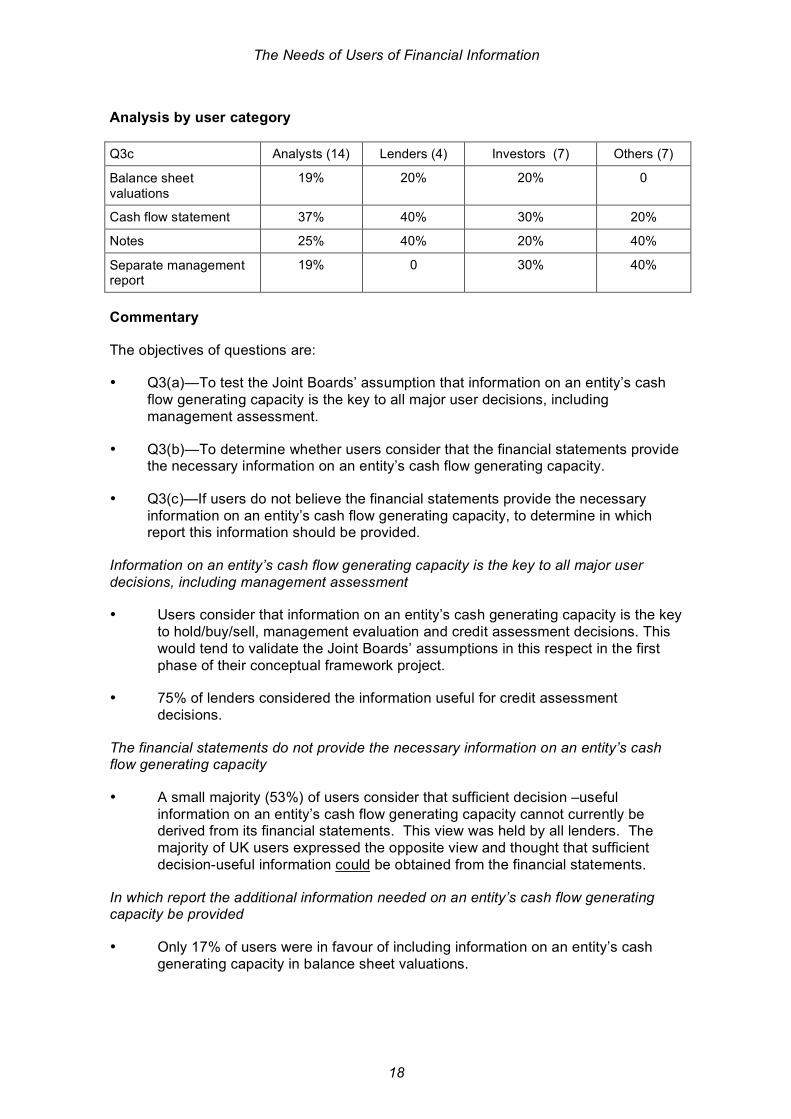
Analysis by user category
Q3c Analysts (14) Lenders (4) Investors (7) Others (7)
Balance sheet valuations
19% 20% 20% 0
Cash flow statement 37% 40% 30% 20%
Notes 25% 40% 20% 40%
Separate management report
19% 0 30% 40%
Commentary
The objectives of questions are:
• Q3(a)—To test the Joint Boards’ assumption that information on an entity’s cash flow generating capacity is the key to all major user decisions, including management assessment.
• Q3(b)—To determine whether users consider that the financial statements provide the necessary information on an entity’s cash flow generating capacity.
• Q3(c)—If users do not believe the financial statements provide the necessary information on an entity’s cash flow generating capacity, to determine in which report this information should be provided.
Information on an entity’s cash flow generating capacity is the key to all major user decisions, including management assessment
• Users consider that information on an entity’s cash generating capacity is the key to hold/buy/sell, management evaluation and credit assessment decisions. This would tend to validate the Joint Boards’ assumptions in this respect in the first phase of their conceptual framework project.
• 75% of lenders considered the information useful for credit assessment decisions.
The financial statements do not provide the necessary information on an entity’s cash flow generating capacity
• A small majority (53%) of users consider that sufficient decision –useful information on an entity’s cash flow generating capacity cannot currently be derived from its financial statements. This view was held by all lenders. The majority of UK users expressed the opposite view and thought that sufficient decision-useful information could be obtained from the financial statements.
In which report the additional information needed on an entity’s cash flow generating capacity be provided
• Only 17% of users were in favour of including information on an entity’s cash generating capacity in balance sheet valuations.

The Needs of Users of Financial Information
19
• 33% thought the cash flow information should be presented as a forecast in the cash flow statement, 28% thought it should be provided in the notes to the financial statements and 22% in a separate management report.
Q4. TO WHAT EXTENT DO USERS USE FINANCIAL STATEMENTS FOR THE FOLLOWING DECISION-MAKING PURPOSES?
• HOLD/BUY/SELL DECISIONS
• EVALUATION OF MANAGEMENT
• CREDIT ASSESSMENT DECISIONS
Analysis by User category
Q4 Analysts (14) Lenders (4) Investors- Private Equity (7)
Others (7)
Useful Not Useful
No answer
Useful Not Useful
No answer
Useful Not Useful
No answer
Useful Not Useful
No answer
Hold/buy/sell 57% 14% 29% 100% 0 0 86% 14% 0 71% 0 29%
Evaluation of management
86% 7% 7% 50% 25% 25% 100% 0 0 100% 0 0
Credit assessment
72% 7% 21% 75% 0 25% 71% 0 29% 86% 0 14%
Hold/buy/sell
not very
useful
9%
Useful or
very useful
72%
No answ er
19%
Evaluation of management
Useful or
very useful
88%
not very
useful
6%
No answ er
6%
Credit assessment
not very
useful
3%No answ er
22%
Useful or
very useful
75%

The Needs of Users of Financial Information
20
Commentary
The objective of Q4 is to assess the usefulness of the financial statements for different types of decision.
Hold/buy /sell decisions
Considering the historical perspective of financial statements it may appear surprising that 72% of users found them useful for hold/buy/ sell decisions. Indeed the 28% holding the opposite view considered in most cases that the financial statements had no value for such decisions. The latter view is held by a number of analysts and regulators across different countries. The same respondents often give a high rating to the management evaluation function of financial statements.
Management evaluation
88% of users find the financial statements useful for management evaluation; there were no significant national exceptions. For analysts, investors and other users, financial statements are more useful for management evaluation than for hold/buy sell decisions or credit assessment.
This evidence would appear to confirm the importance of the stewardship objective of financial statements for users.
Credit assessment
75% of users find financial statements to be useful for credit assessment despite their historical perspective; there were no significant national or user category exceptions.
Q5 HOW DO USERS RATE THE USEFULNESS OF THE VARIOUS COMPONENTS OF FINANCIAL STATEMENTS? IN OTHER WORDS, THE BALANCE SHEET, THE INCOME STATEMENT, THE CASH FLOW STATEMENT, THE STATEMENT OF CHANGES IN EQUITY AND THE NOTES TO THE FINANCIAL STATEMENTS.
Balance sheet
No answ er
6%
not very
useful
6%
Useful or
very useful
88%
Income statement
No answ er
6%
Useful or
very useful
94%
not very
useful
0%
Cash-flow statements
not very
useful
19%
No answ er
6%
Useful or
very useful
75%
Statement of changes in equity
not very
useful
25%
No answ er
9%
Useful or
very useful
66%
The Needs of Users of Financial Information
21
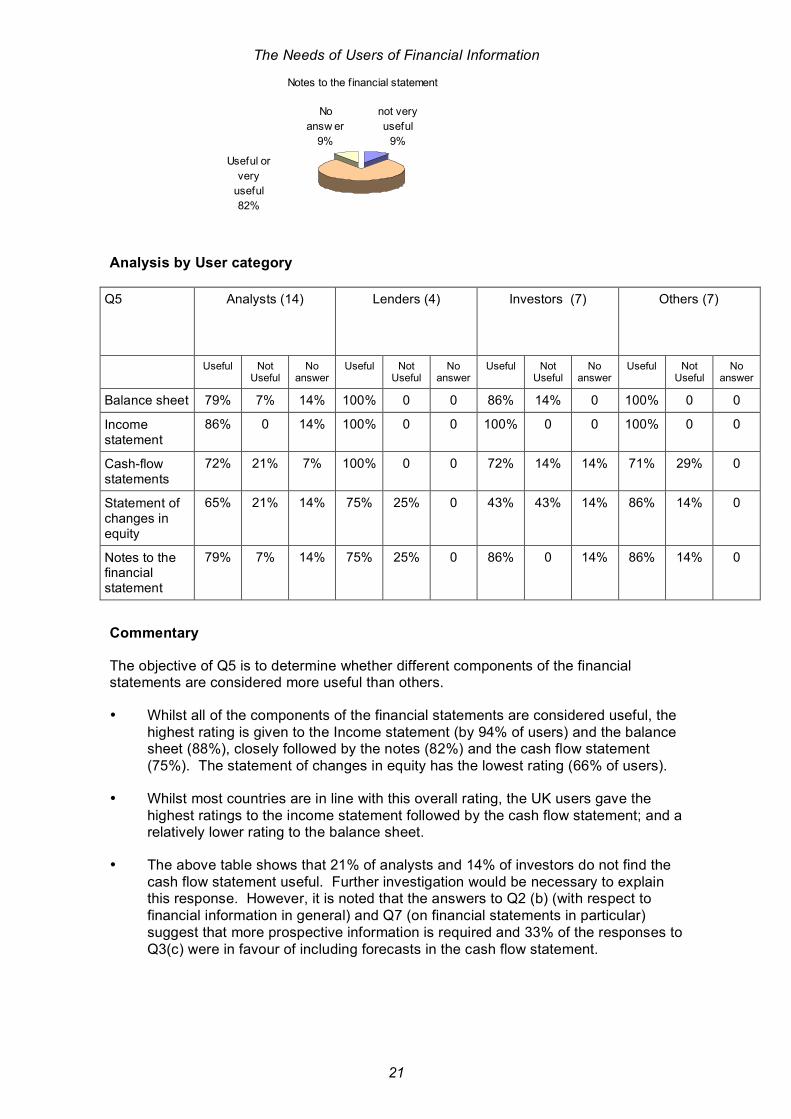
Analysis by User category
Q5 Analysts (14) Lenders (4) Investors (7) Others (7)
Useful Not Useful
No answer
Useful Not Useful
No answer
Useful Not Useful
No answer
Useful Not Useful
No answer
Balance sheet 79% 7% 14% 100% 0 0 86% 14% 0 100% 0 0
Income statement
86% 0 14% 100% 0 0 100% 0 0 100% 0 0
Cash-flow statements
72% 21% 7% 100% 0 0 72% 14% 14% 71% 29% 0
Statement of changes in equity
65% 21% 14% 75% 25% 0 43% 43% 14% 86% 14% 0
Notes to the financial statement
79% 7% 14% 75% 25% 0 86% 0 14% 86% 14% 0
Commentary
The objective of Q5 is to determine whether different components of the financial statements are considered more useful than others.
• Whilst all of the components of the financial statements are considered useful, the highest rating is given to the Income statement (by 94% of users) and the balance sheet (88%), closely followed by the notes (82%) and the cash flow statement (75%). The statement of changes in equity has the lowest rating (66% of users).
• Whilst most countries are in line with this overall rating, the UK users gave the highest ratings to the income statement followed by the cash flow statement; and a relatively lower rating to the balance sheet.
• The above table shows that 21% of analysts and 14% of investors do not find the cash flow statement useful. Further investigation would be necessary to explain this response. However, it is noted that the answers to Q2 (b) (with respect to financial information in general) and Q7 (on financial statements in particular) suggest that more prospective information is required and 33% of the responses to Q3(c) were in favour of including forecasts in the cash flow statement.
Notes to the f inancial statement
not very
useful
9%
No
answ er
9%
Useful or
very
useful
82%

The Needs of Users of Financial Information
22
Q6.WHICH INDICATORS DERIVED FROM THE FINANCIAL STATEMENTS DO USERS FIND THE MOST USEFUL?
• REVENUE
• OPERATING INCOME
• NET INCOME
• EARNINGS PER SHARE
• DEBT/EQUITY RATIO
• LIQUIDITY RATIOS
• CASH FLOWS
• OTHERS
Revenue
No
answ er
19%
not very
useful
9%Useful or
very
useful
72%
Operating income
No
answ er
13%
not very
useful
3%Useful or
very
useful
84%
Earnings per share
not very
useful
25%
No answ er
19%
Useful or
very useful
56%
Debt/Equity ratio
not very
useful
13%No answ er
19%
Useful or
very useful
68%
Liquidity ratios
not very
useful
19%
No answ er
22%
Useful or
very useful
59%
Net Income
not very
useful
13%
No
answ er
16%
Useful or
very
useful
71%
The Needs of Users of Financial Information
23
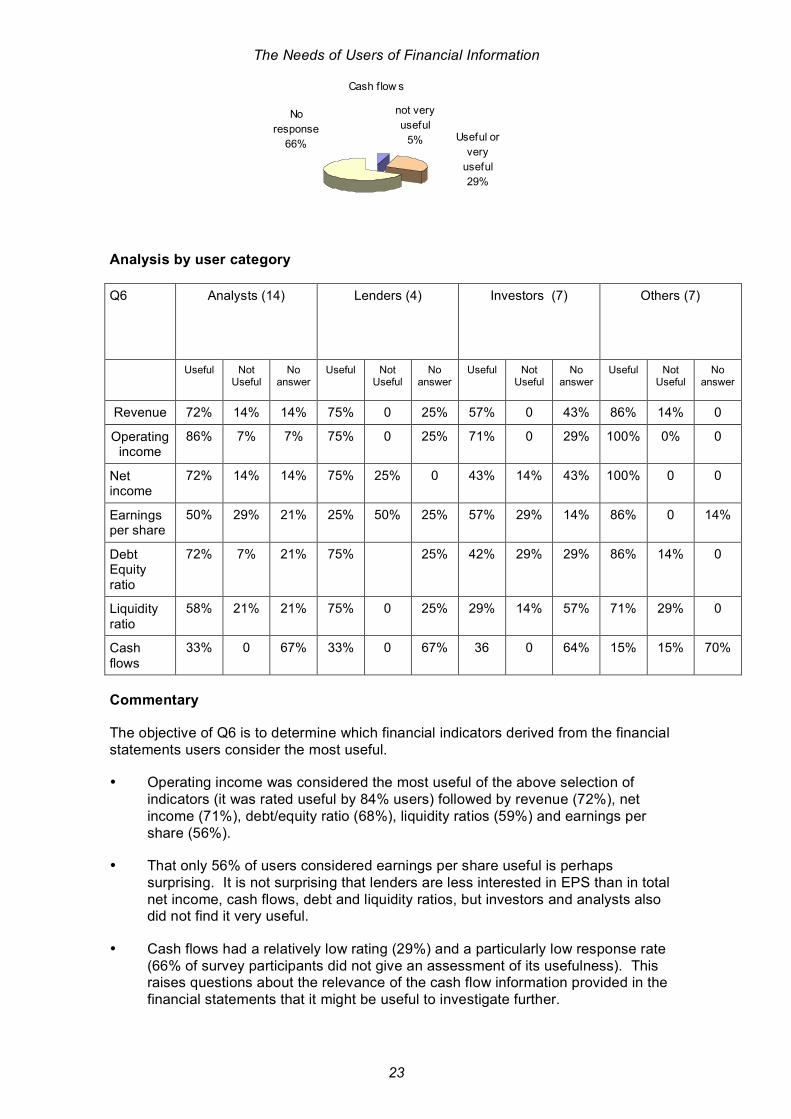
Analysis by user category
Q6 Analysts (14) Lenders (4) Investors (7) Others (7)
Useful
Not Useful
No answer
Useful
Not Useful
No answer
Useful
Not Useful
No answer
Useful
Not Useful
No answer
Revenue 72% 14% 14% 75% 0 25% 57% 0 43% 86% 14% 0
Operating income
86% 7% 7% 75% 0 25% 71% 0 29% 100% 0% 0
Net income
72% 14% 14% 75% 25% 0 43% 14% 43% 100% 0 0
Earnings per share
50% 29% 21% 25% 50% 25% 57% 29% 14% 86% 0 14%
Debt Equity ratio
72% 7% 21% 75% 25% 42% 29% 29% 86% 14% 0
Liquidity ratio
58% 21% 21% 75% 0 25% 29% 14% 57% 71% 29% 0
Cash flows
33% 0 67% 33% 0 67% 36 0 64% 15% 15% 70%
Commentary
The objective of Q6 is to determine which financial indicators derived from the financial statements users consider the most useful.
• Operating income was considered the most useful of the above selection of indicators (it was rated useful by 84% users) followed by revenue (72%), net income (71%), debt/equity ratio (68%), liquidity ratios (59%) and earnings per share (56%).
• That only 56% of users considered earnings per share useful is perhaps surprising. It is not surprising that lenders are less interested in EPS than in total net income, cash flows, debt and liquidity ratios, but investors and analysts also did not find it very useful.
• Cash flows had a relatively low rating (29%) and a particularly low response rate (66% of survey participants did not give an assessment of its usefulness). This raises questions about the relevance of the cash flow information provided in the financial statements that it might be useful to investigate further.
Cash flow s
No
response
66%
not very
useful
5% Useful or
very
useful
29%
The Needs of Users of Financial Information
24
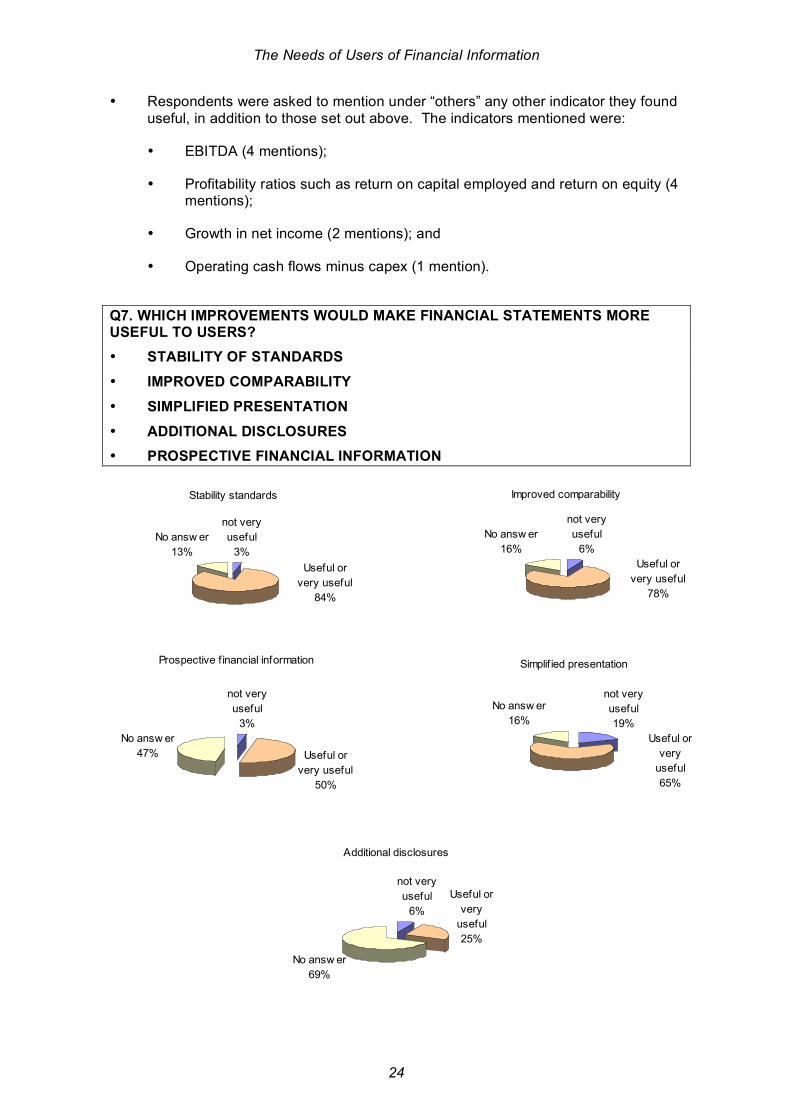
• Respondents were asked to mention under “others” any other indicator they found useful, in addition to those set out above. The indicators mentioned were:
• EBITDA (4 mentions);
• Profitability ratios such as return on capital employed and return on equity (4 mentions);
• Growth in net income (2 mentions); and
• Operating cash flows minus capex (1 mention).
Q7. WHICH IMPROVEMENTS WOULD MAKE FINANCIAL STATEMENTS MORE USEFUL TO USERS?
• STABILITY OF STANDARDS
• IMPROVED COMPARABILITY
• SIMPLIFIED PRESENTATION
• ADDITIONAL DISCLOSURES
• PROSPECTIVE FINANCIAL INFORMATION
Stability standards
not very
useful
3%
No answ er
13%
Useful or
very useful
84%
Improved comparability
not very
useful
6%
No answ er
16%
Useful or
very useful
78%
Simplif ied presentation
not very
useful
19%
No answ er
16%
Useful or
very
useful
65%
Prospective f inancial information
not very
useful
3%
Useful or
very useful
50%
No answ er
47%
Additional disclosures
not very
useful
6%
Useful or
very
useful
25%
No answ er
69%

The Needs of Users of Financial Information
25
Analysis by user category
Q7 Analysts (14) Lenders (4) Investors (7) Others (7)
Useful
Not Useful
No answer
Useful
Not Useful
No answer
Useful
Not Useful
No answer
Useful
Not Useful
No answer
Stability of reporting standards
72% 7% 21% 100% 0 0 86% 0 14% 100% 0 0
Improved comparability
86% 0 14% 75% 25% 0 57% 0 43% 86% 14% 0
Simplified presentation
57% 29% 14% 100% 0 0 43% 14% 43% 86% 14% 0
Prospective financial information
64% 0 36% 50% 0 50% 43% 0 57% 29% 14% 57%
Additional disclosures
36% 7% 57% 25% 0 75% 0 0 100% 29% 14% 57%
Commentary
The objective of Q7 is to determine which improvements to the financial statements users consider necessary. Q7 suggested 5 possible improvements (see above table) and invited users to provide their own suggestions under “Other”.
• Of the 5 suggested improvements, the stability of reporting standards and improved comparability were considered useful or very useful by respectively 84% and 78% of users. 65% of users thought simplifications in presentation would be useful. 50% of users wanted prospective financial information in the financial statements.
• Users were asked to indicate what improvements they required to financial statements other than those suggested. In all 20 improvements were suggested and the main improvements were:
• Prospective information (for example, business plans, cash forecasts, capital expenditure, debt forecasts, market outlook etc) was suggested by 7 users.
• Additional segmental information (for example, revenues by activity, volumes per product group etc) were suggested by 5 users.
• Improvements to the notes were suggested by 3 users.
• Key performance indicators were suggested by 2 users.

The Needs of Users of Financial Information
26
APPENDIX 2: USER QUESTIONNAIRE
Set out in this appendix is the questionnaire that was used in the survey.
Introduction
(a) This questionnaire is issued by the Proactive Accounting Activities in Europe (PAAinE) working group on the Conceptual Framework for Financial Reporting.
(b) The PAAinE is an association of national standard setters and the European Financial Reporting Advisory Group, whose objective is to address key IASB/FASB projects at an early stage in their development.
(c) The current IASB/FASB project on the Conceptual Framework for Financial Reporting “Phase A” identifies investors and financial creditors as the primary users of financial reporting, but does not provide an analysis of their financial information needs.
(d) The objective of this questionnaire is to carry out a European-wide survey of their user needs. The questionnaire therefore focuses on the financial information needs of investors and financial creditors in their decision making process with regard to listed or unlisted entities to which International Financial Reporting Standards are applicable .The questionnaire is intended exclusively for professional users and their advisors.
(e) Questions 4, 5, 6 and 7 focus on financial statements under their current IFRS definition i.e. balance sheet, income statement, cash-flow statement, statement of changes in equity and notes. Questions 1 to 3 deal with financial information in a broader sense, including financial statements and other forms of reporting published by an entity, as well as financial information from other sources.
(f) In order to facilitate the interpretation of the questionnaire, respondents are requested to indicate, by ticking in the appropriate box, whether their responses as users apply to listed or unlisted entities. Where respondents reply for both listed and unlisted entities, a separate questionnaire should be filled in for each category.
Listed entities Unlisted entities
(g) Some questions invite respondents to rate the usefulness of different forms of financial information in their decision making process. The rating consists of entering a number on a scale from 1 to 5 in the box provided, where 5 is the highest rating .The same rating may apply to more than one form of information e.g. in Question 1 it would be possible for Financial Statements and Other Sources to be rated “5” if both were considered very useful.
(h) In order to assist respondents, each question includes a brief explanatory note.
(i) The results of this survey will be published on the website of the French standard setter the “CNC –Conseil national de la comptabilité” ” www.cnc.minefi.gouv.fr as well as on the EFRAG website www.efrag.org.
The Needs of Users of Financial Information
27
Q1. WHICH KINDS OF FINANCIAL INFORMATION DO YOU FIND MOST USEFUL?
Q1. aims at determining how you rate the usefulness of financial statements as opposed to management commentary and other forms of financial information .Where you use other sources of information than financial statements and management commentary please specify and rate them under the heading “other sources”.
Please rate the financial information from 1 to 5, where 5 is the most useful.
- FINANCIAL STATEMENTS (as defined in the Introduction(e) )
- MANAGEMENT COMMENTARY IN THE ANNUAL REPORT
- OTHER SOURCES (please specify up to 3 items such as press releases, economic surveys, market information, etc…)
-………………………………………………….
-………………………………………………….
-…………………………………………………..
Q2. ARE YOU SATISFIED WITH EXISTING FINANCIAL INFORMATION?
For each of the different kinds of financial information identified in Q.1 ,Q.2(a) sets out to determine how you rate your level of satisfaction.
Q2(b) seeks to highlight one area of improvement you see as a priority .
Q2( c) seeks to identify where you consider improvements are required: in financial statements ,management commentary or other sources.
(a) Please rate your satisfaction from 1 to 5.
- FINANCIAL STATEMENTS
- MANAGEMENT COMMENTARY IN THE ANNUAL REPORT
- OTHER SOURCES (please specify up to 3 items such as press releases, economic surveys, market information, etc…)
-………………………………………………….
-………………………………………………….
-…………………………………………………..

The Needs of Users of Financial Information
28
(b) Please indicate ONE area where improvement is the most required by ticking in the appropriate box:
- Highlighting trends in growth and profitability
- Prospective financial information
- Competitive analysis
- More information on risk management process
- Improved segmental information
- Other (please specify no more than 3 items)
-……………………………………………………….
-………………………………………………………..
-…………………………………………………………
(c) Please indicate where the selected improvement should be made by ticking in the appropriate box
FINANCIAL STATEMENTS-…………………………………………………
MANAGEMENT COMMENTARY IN THE ANNUAL REPORT
OTHER SOURCES (please specify up to 3 items such as press releases, economic surveys, market trends, etc…)
-……………………………………………………….
-……………………………………………………….
-……………………………………………………….
Q3.CASH FLOW INFORMATION
Q.3(a) sets out to determine whether information relevant to assessing an entity’s ability to generate cash flows(e.g. actual past cash flows or cash forecasts) is the key information common to making all major user decisions, including the evaluation of management performance.
Q.3(b)/(c) asks whether sufficient information about an entity’s cash flow generating capacity can be derived from the financial statements and if not where the information should be presented .
The Needs of Users of Financial Information
29
(a) Is information on an entity’s cash flow generating capacity the key to making the following decisions?
Please tick the appropriate box.
YES NO
- Hold/buy/sell
- Evaluation of management /accountability/stewardship
- Credit assessment
- Other (please specify not more than 3 purposes
-……………………………………………………..
-……………………………………………………..
-……………………………………………………..
(b) Can sufficient decision useful information on an entity’s cash flow generating capacity be derived from financial statements? Please tick the appropriate box .
YES NO
(c) If the answer to (b) is no, should information on an entity’s cash flow generating capacity be reflected
YES NO
- As forecast figures in the Cash Flow Statement
- In the balance sheet valuations
-In the Notes
-In a separate management report outside the financial statements
-Other (Please specify up to three items)
-……………………………………………………………….
-………………………………………………………………
-…………………………………………………………… .

The Needs of Users of Financial Information
30
Q4.TO WHAT EXTENT DO YOU USE FINANCIAL STATEMENTS FOR DECISION-MAKING PURPOSES?
Q4 asks you to rate the usefulness of financial statements for the different types of decisions you take .
Please rate from 1 to 5, where 5 indicates that financial statements are the most used
in your decision-making process
- Hold/buy/sell decisions
- Evaluation of management (accountability/stewardship)
- Credit assessment
- Other(please specify not more than 3 purposes
-……………………………………………………..
-…………………………………………………….. -
-………………………………………………………
Q5.HOW DO YOU RATE THE USEFULNESS OF FINANCIAL STATEMENTS?
The items listed in Q5 comprise a full set of financial statements under the general IFRS definition .The aim of the question is to determine whether you find certain of these items more useful than others.
Please rate from 1 to 5, where 5 is the most useful
- Balance Sheet
- Income Statement
- Cash-flow statement
- Statement of changes in equity
- Notes to the financial statements
The Needs of Users of Financial Information
31
Q6.WHICH INDICATORS DERIVED FROM THE FINANCIAL STATEMENTS DO YOU FIND THE MOST USEFUL?
Certain lines of the financial statements provide directly or enable the calculation of indicators of activity , profitability , liquidity ratios etc .Q6 asks how you rate the usefulness of the indicators listed above and invites you to specify and rate under “Other” up to three other key indicators or ratios you use but which are not included in the list.
Please rate from 1 to 5, where 5 is the most useful
-Revenue (or equivalent activity indicator)
-Operating income
-Net Income
-Earnings per share
-Debt/Equity ratio
-Liquidity ratios
-Cash flows
-Other (please specify up to three indicators e.g. EBITDA ,Comprehensive Income)
-………………………………….
-………………………………….
-…………………………………
Q7.WHICH IMPROVEMENTS WOULD MAKE FINANCIAL STATEMENTS MORE USEFUL TO YOU?
Please rate from 1 to 5, where 5 is the most useful
-Stability of reporting standards
-Improved comparability
-Simplified presentation highlighting key data and disclosures
-Prospective financial information
-Additional disclosures
-Other (please specify up to 3 items)
-………………..……………………………..
-……………………………………………….
-………………………………………………..
The Needs of Users of Financial Information
32
Q8.OTHER COMMENTS?
If you have any points to make with respect to your financial information needs that are not covered by questions 1 to 7 please mention them in response to Q8.
…………………………………………………………………………………………………………………………………………………………………………………………………..………………………………………..…………………………………………………………..
Q9. WHAT IS YOUR USER IDENTITY?
(a) Which of the following user categories do you represent ?Please tick the appropriate box:
Investor
Lender
Analyst
Rating agency
Mutual Fund Manager
Private Equity
Other (please specify)
-……………………
-……………………
-……………………
(b) Please indicate the organisation you represent :…………………………………
(c) Please indicate your position in the organisation :…………………………………..
(d) Please indicate which country you represent ……………………………………

The Needs of Users of Financial Information
33
APPENDIX 3: LIST OF COUNTRIES INCLUDED IN THE SURVEY
The PAAinE project team approached the 25 European national standard-setters on EFRAG’s contact list as at June 2006 to ask them whether they wished and were able to help the team in carrying out the survey. Those 25 national standard-setters were mainly from the EU, although a few countries in the EFTA were also included. 10 countries indicated that they wished and were able to participate.
The following table sets out the population and the Gross Domestic Product (GDP) of those countries on EFRAG’s contact list that were participants and non-participants in order to give an idea of the relative economic importance of the countries represented. It can be seen that user organisations from countries representing a GDP of US$9375 billions (70% of GDP of the EU) took part in the survey.
Country Population GDP Number particip-
Millions(1) $US billions3 ating in the survey
PARTICIPATING Cyprus 1 18 1 Denmark 6 202 7 France 61 1902 3 Germany 82 2632 2 Italy 58 1756 5 Latvia 2 37 1 Lithuania 4 55 6 Poland 39 555 1 Sweden 9 290 2 United Kingdom 61 1928 4
Total participating (10) 323 9375 32
TOTAL EU (27) 488 13359
NON-PARTICIPATING Austria 8 284 Belgium 10 343 Czech Republic 10 226 Estonia 1 27 Finland 5 175 Greece 11 257 Hungary 10 175 Luxembourg 1 34 Malta 0.4 9 Portugal 11 210 Slovenia 2 47 Spain 40 1109 The Netherlands 17 530 Norway (Non EU) 4.6 336 Switzerland (Non-EU) 7.5 486
Total not participating (15) 138.5 4248
3 Statistics 2006/7 Source CIA The world factbook 2006/ 30/9/07

The Needs of Users of Financial Information
34
APPENDIX 4: THE PAAinE PROJECT TEAM
This report has been prepared by the PAAinE Framework Project Team, which is led by staff of the French standard-setter, the CNC. For the report, the team comprised Jérôme Chevy and Philip Staines of the CNC’s staff and Sigvard Heurlin, who is a member of EFRAG’s staff.
The team would like to thank the pan-European PAAinE Framework Advisory Panel for its help and advice in designing, implementing and writing up the survey. The Panel’s members during the period were as follows:
Mr Bernard Colasse Université Paris – Dauphine, Professor
France
Mr Dominique Bonsergent
TOTAL S.A. Director of Accounting
France
Mr Paul Ebling Staff member at EFRAG
Mr Ole Michaël Friis University of Southern Denmark, Assistant Professor, Ph. D.
Denmark
Mr Rolf Uwe Fûlbier WHU - Otto Beisheim School of Management, Professor
Germany
Ms. Seema Jamil-O’Neill Staff member at UK Accounting Standards Board
UK
Mrs Alicja Jaruga University of Lodz, Professor Dr h.c.
Latvia
Mr Steinar Sars Kvifte Ernst & Young, Partner Norway
Mrs Laima Kazlauskienè Accounting Institute Lithuania, Director
Lithuania
Mr Knut Tonne European Commission
Mr Enrique Villanueva Universidad Complutense de Madrid, Vice dean Facultad de Economicas
Spain

The Needs of Users of Financial Information
35

PRO-ACTIVE ACCOUNTING ACTIVITIES IN EUROPE (PAAinE)