elevated radon levels in high rise …wpb-radon.com/pdf/radon in high rise condominium.pdf ·...
TRANSCRIPT

1
ELEVATED RADON LEVELS IN HIGH RISE CONDOMINIUM FROM CONCRETE EMANATION
Bill Brodhead
WPB Enterprises, Inc., 2844 Slifer Valley Rd., Riegelsville, PA USA [email protected] www.wpb-radon.com
ABSTRACT The author investigated five residential units of an eight story high rise condominium building that had elevated indoor radon levels on every floor. The building had two levels of ventilated garages under most of the building and only partial ground contact. Each floor was constructed with post stressed concrete floors and ceilings. Blower door and ventilation dilution measurements in the units tested indicated very low air change rates to the exterior of the units. E-PERM’s® were placed under three liter metal accumulator’s over exposed surfaces of the concrete in six locations of the building to determine the emanation rate from the concrete. The measurement results indicated the concrete radon emanation rate along with the low ventilation rates was the cause of the elevated indoor radon levels.
GENERAL BUILDING INFORMATION The investigated building was actually two buildings above grade with three levels of open parking garages under most of the building. These garages are mechanically ventilated and open to each other. There is an alley way above the garages that separates the buildings. One side of the building is five stories tall. The other side is eight stories tall. There is a single row of ground contact condominiums and commercial stores surrounding three sides of the buildings. Both buildings are built with post stressed concrete slab floors and ceilings. The exterior and interior walls are metal stud framed except around the stairwell and elevator shafts which are concrete walls. There are multiple concrete beams throughout the building supporting the concrete slabs. See aerial photo of the site in Figure 1 below.

2
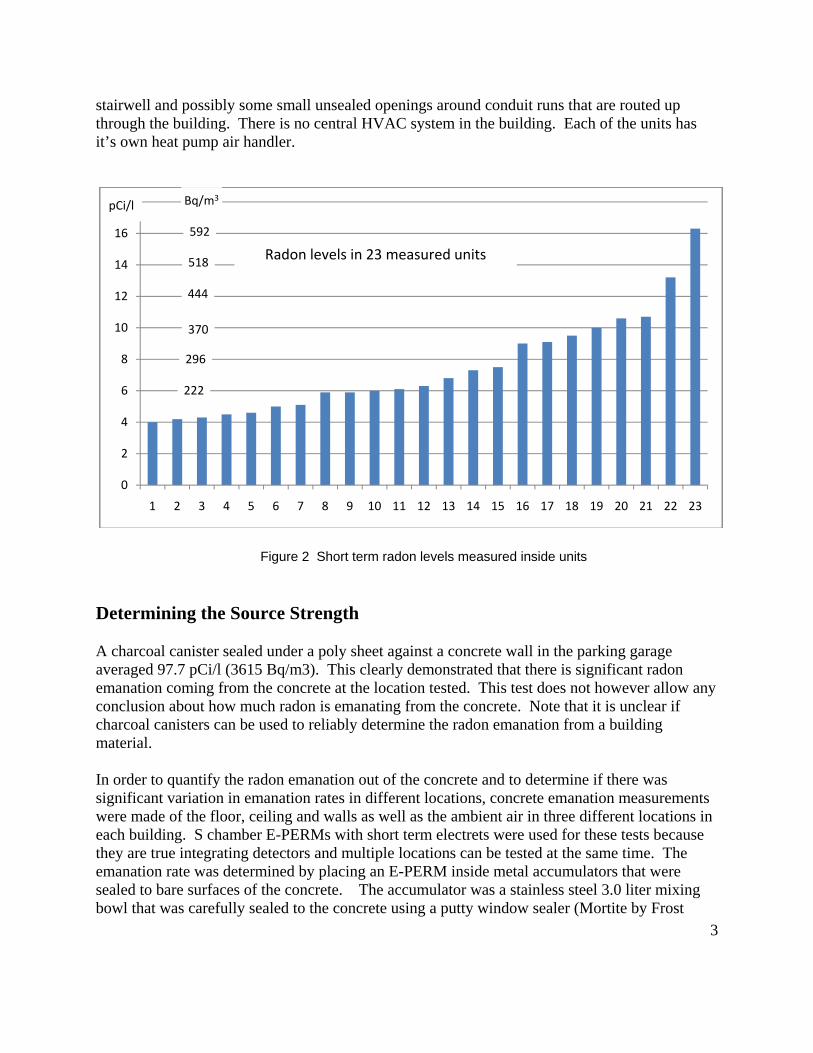
Building Radon Measurements Short term radon measurements were made by independent testing contractors in 23 different units mostly in the Fall of 2007. The radon measurements in the units varied from 4.0 pCi/l (150 Bq/m3) to a high of 16.3 pCi/l ( 600 Bq/m3). The average of all the measurements was 7.5 pCi/l ( 278 Bq/m3). Every floor of both buildings had units with radon measurements above the EPA guideline. Radon measurements in five different hallways averaged 6.2 pCi/l (230 Bq/m3). Three of the units had short term tests with the windows open. The radon levels with windows open ranged from 0.6 pCi/l (22 Bq/m3) to 3.0 pCi/l (111 Bq/m3). See the range of radon measurements in Figure 2 below.
The parking garage under the building has a large exhaust fan on one side and a supply fan on the other side. There were seven measurements made in the parking garage that ranged from 0.3 pCi/l (11 Bq/m3) in two locations to a high of 2.9 pCi/l (107 Bq/m3). The elevator shaft in one of the buildings measured 3.4 pCi/l (126 Bq/m3) and 4.5 pCi/l (167 Bq/m3). The garage measurements and elevator shaft measurements were all less than the measurements in the units indicated that the source of the radon was not likely to be from the soil. There are no other air pathways from the lower level to the upper units other than the elevator shaft, the
Figure 1 1998 aerial view of the building
Figure 1 Aerial Photo of both Buildings
3
stairwell and possibly some small unsealed openings around conduit runs that are routed up through the building. There is no central HVAC system in the building. Each of the units has it’s own heat pump air handler.
Determining the Source Strength A charcoal canister sealed under a poly sheet against a concrete wall in the parking garage averaged 97.7 pCi/l (3615 Bq/m3). This clearly demonstrated that there is significant radon emanation coming from the concrete at the location tested. This test does not however allow any conclusion about how much radon is emanating from the concrete. Note that it is unclear if charcoal canisters can be used to reliably determine the radon emanation from a building material.
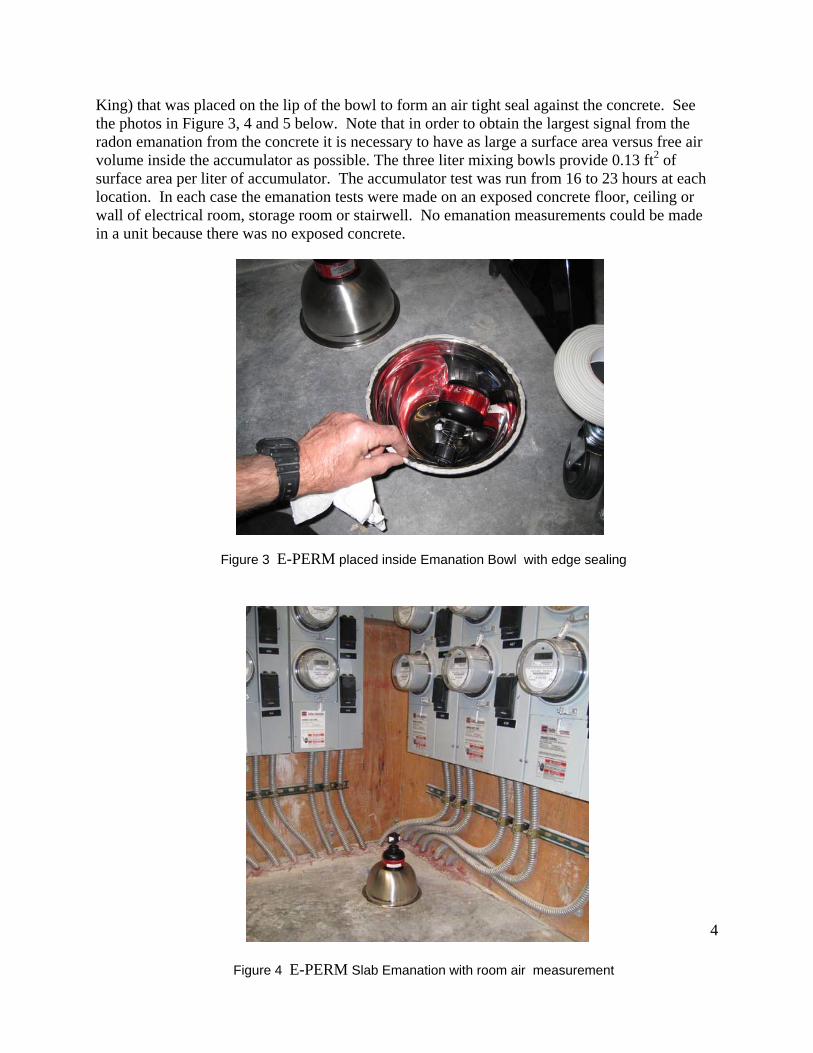
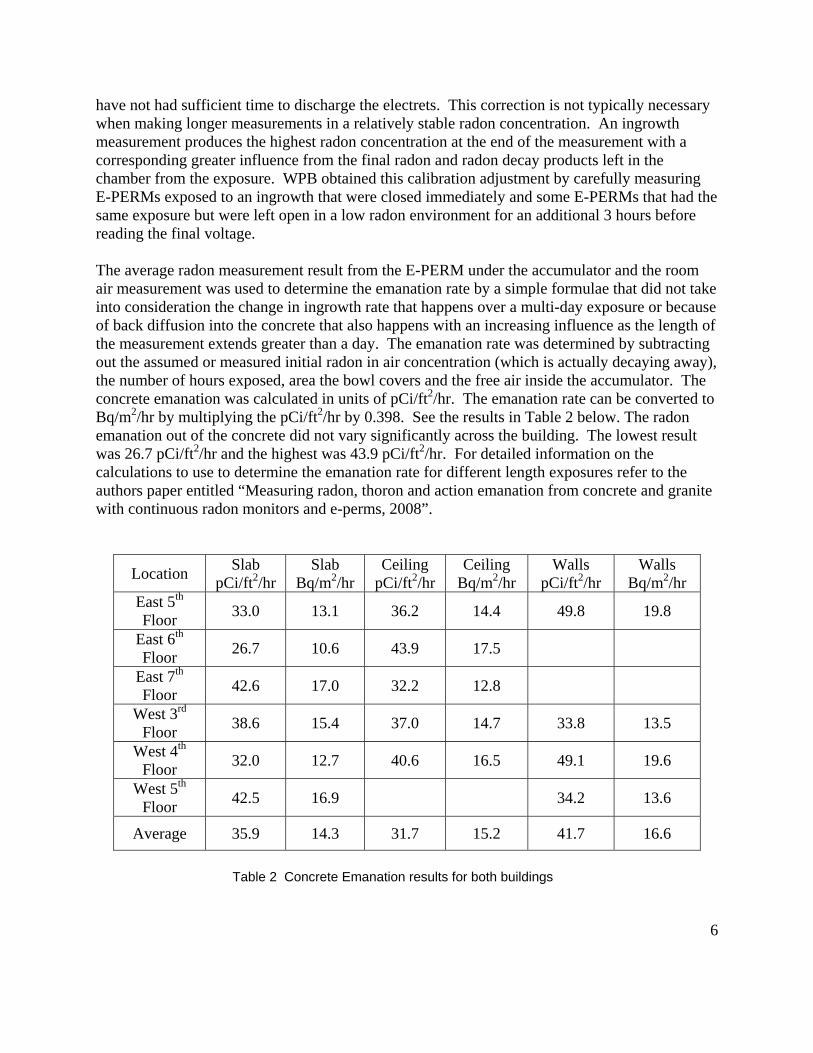
In order to quantify the radon emanation out of the concrete and to determine if there was significant variation in emanation rates in different locations, concrete emanation measurements were made of the floor, ceiling and walls as well as the ambient air in three different locations in each building. S chamber E-PERMs with short term electrets were used for these tests because they are true integrating detectors and multiple locations can be tested at the same time. The emanation rate was determined by placing an E-PERM inside metal accumulators that were sealed to bare surfaces of the concrete. The accumulator was a stainless steel 3.0 liter mixing bowl that was carefully sealed to the concrete using a putty window sealer (Mortite by Frost
0
2
4
6
8
10
12
14
16
18
1 2 3 4 5 6 7 8 9 10 11 12 13 14 15 16 17 18 19 20 21 22 23
Radon levels in 23 measured units
pCi/l
592
518
444
370
296
222
Bq/m3
Figure 2 Short term radon levels measured inside units
4
King) that was placed on the lip of the bowl to form an air tight seal against the concrete. See the photos in Figure 3, 4 and 5 below. Note that in order to obtain the largest signal from the radon emanation from the concrete it is necessary to have as large a surface area versus free air volume inside the accumulator as possible. The three liter mixing bowls provide 0.13 ft2 of surface area per liter of accumulator. The accumulator test was run from 16 to 23 hours at each location. In each case the emanation tests were made on an exposed concrete floor, ceiling or wall of electrical room, storage room or stairwell. No emanation measurements could be made in a unit because there was no exposed concrete.
Figure 4 E-PERM Slab Emanation with room air measurement
Figure 3 E-PERM placed inside Emanation Bowl with edge sealing

5
The electret pre-exposure and post exposure voltages were used to obtain the average radon concentration under the accumulator and in the room the accumulator tests was being performed in. Note that it is important to quantify the initial radon concentration when the accumulator is sealed to the concrete, especially if the emanation rate is low. The average radon concentration was determined by exposing an E-PERM in the test location. This average concentration was then assumed to be the concentration in the air when the flux tests were started. A more exact method of obtaining the ambient radon at the beginning of the flux test is to expose an E-PERM inside a sealed glass jar that is available from Rad Elec for making radon in water measurements. The voltage loss of the electret sealed in the jar could be subtracted from each flux measurement voltage loss to subtract out the influence of gamma as well as the ambient radon. Note that there is about a 15% lower voltage loss of an electret starting with 250 initial volts versus an electret with 750 initial volts that will cause a small bias. A Bicron Micro-Rem gamma survey meter was used to determine the gamma levels used in calculating the average radon concentration. The gamma measurements throughout the building varied from a low of 4.0 μR/hr to a high of 10.0 μR/hr. There was not any significant increase of gamma directly adjacent to the concrete which might influence the E-PERM reading. Note that the gamma variation would be more critical if a low emanation rate was being measured. In each case the gamma measurements made at the test locations were used in determining the E-PERM radon measurement result. The E-PERM chambers were closed up immediately after being removed from the accumulator. A small correction factor of an additional 10% was added to the calculated emanation rate to compensate for the additional radon and radon decay products that have entered the chamber but
Figure 5 E-PERM Emanation of ceiling of electrical room
6
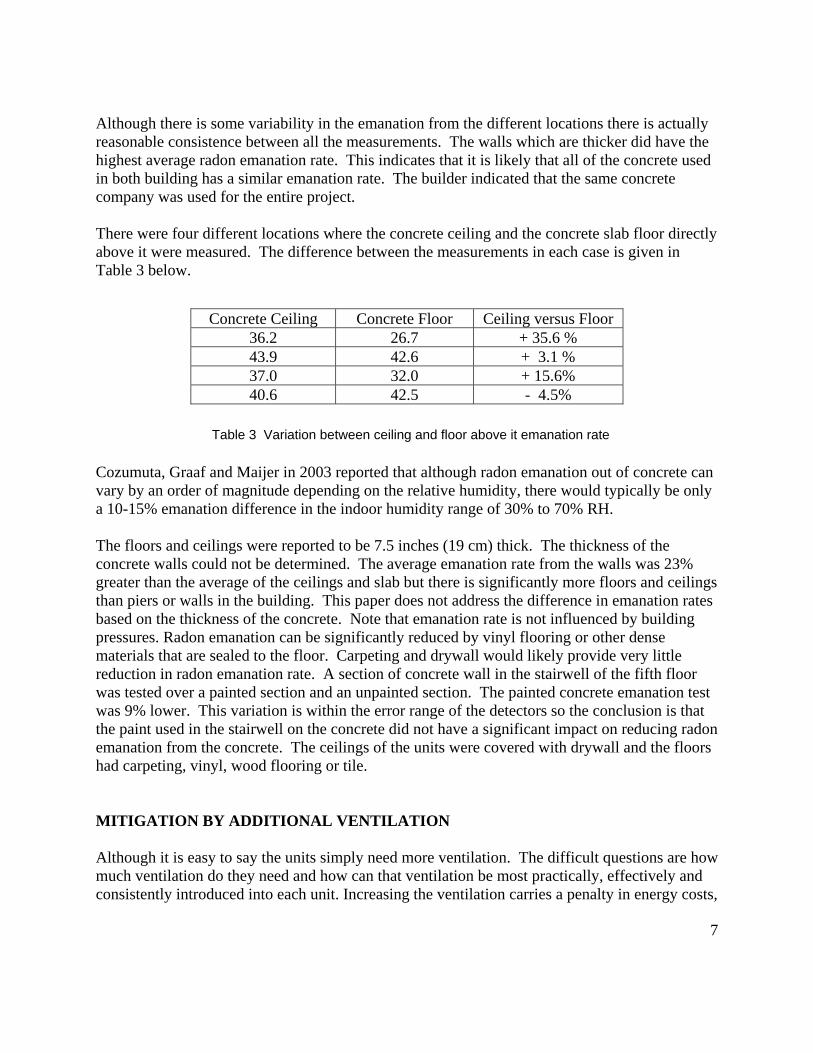
have not had sufficient time to discharge the electrets. This correction is not typically necessary when making longer measurements in a relatively stable radon concentration. An ingrowth measurement produces the highest radon concentration at the end of the measurement with a corresponding greater influence from the final radon and radon decay products left in the chamber from the exposure. WPB obtained this calibration adjustment by carefully measuring E-PERMs exposed to an ingrowth that were closed immediately and some E-PERMs that had the same exposure but were left open in a low radon environment for an additional 3 hours before reading the final voltage. The average radon measurement result from the E-PERM under the accumulator and the room air measurement was used to determine the emanation rate by a simple formulae that did not take into consideration the change in ingrowth rate that happens over a multi-day exposure or because of back diffusion into the concrete that also happens with an increasing influence as the length of the measurement extends greater than a day. The emanation rate was determined by subtracting out the assumed or measured initial radon in air concentration (which is actually decaying away), the number of hours exposed, area the bowl covers and the free air inside the accumulator. The concrete emanation was calculated in units of pCi/ft2/hr. The emanation rate can be converted to Bq/m2/hr by multiplying the pCi/ft2/hr by 0.398. See the results in Table 2 below. The radon emanation out of the concrete did not vary significantly across the building. The lowest result was 26.7 pCi/ft2/hr and the highest was 43.9 pCi/ft2/hr. For detailed information on the calculations to use to determine the emanation rate for different length exposures refer to the authors paper entitled “Measuring radon, thoron and action emanation from concrete and granite with continuous radon monitors and e-perms, 2008”.
Location Slab pCi/ft2/hr
Slab Bq/m2/hr
Ceiling pCi/ft2/hr
Ceiling Bq/m2/hr
Walls pCi/ft2/hr
Walls Bq/m2/hr
East 5th Floor 33.0 13.1 36.2 14.4 49.8 19.8
East 6th Floor 26.7 10.6 43.9 17.5
East 7th Floor 42.6 17.0 32.2 12.8
West 3rd Floor 38.6 15.4 37.0 14.7 33.8 13.5
West 4th Floor 32.0 12.7 40.6 16.5 49.1 19.6
West 5th Floor 42.5 16.9 34.2 13.6
Average 35.9 14.3 31.7 15.2 41.7 16.6
Table 2 Concrete Emanation results for both buildings
7
Although there is some variability in the emanation from the different locations there is actually reasonable consistence between all the measurements. The walls which are thicker did have the highest average radon emanation rate. This indicates that it is likely that all of the concrete used in both building has a similar emanation rate. The builder indicated that the same concrete company was used for the entire project. There were four different locations where the concrete ceiling and the concrete slab floor directly above it were measured. The difference between the measurements in each case is given in Table 3 below. Cozumuta, Graaf and Maijer in 2003 reported that although radon emanation out of concrete can vary by an order of magnitude depending on the relative humidity, there would typically be only a 10-15% emanation difference in the indoor humidity range of 30% to 70% RH. The floors and ceilings were reported to be 7.5 inches (19 cm) thick. The thickness of the concrete walls could not be determined. The average emanation rate from the walls was 23% greater than the average of the ceilings and slab but there is significantly more floors and ceilings than piers or walls in the building. This paper does not address the difference in emanation rates based on the thickness of the concrete. Note that emanation rate is not influenced by building pressures. Radon emanation can be significantly reduced by vinyl flooring or other dense materials that are sealed to the floor. Carpeting and drywall would likely provide very little reduction in radon emanation rate. A section of concrete wall in the stairwell of the fifth floor was tested over a painted section and an unpainted section. The painted concrete emanation test was 9% lower. This variation is within the error range of the detectors so the conclusion is that the paint used in the stairwell on the concrete did not have a significant impact on reducing radon emanation from the concrete. The ceilings of the units were covered with drywall and the floors had carpeting, vinyl, wood flooring or tile. MITIGATION BY ADDITIONAL VENTILATION Although it is easy to say the units simply need more ventilation. The difficult questions are how much ventilation do they need and how can that ventilation be most practically, effectively and consistently introduced into each unit. Increasing the ventilation carries a penalty in energy costs,
Concrete Ceiling Concrete Floor Ceiling versus Floor 36.2 26.7 + 35.6 % 43.9 42.6 + 3.1 % 37.0 32.0 + 15.6% 40.6 42.5 - 4.5%
Table 3 Variation between ceiling and floor above it emanation rate
8
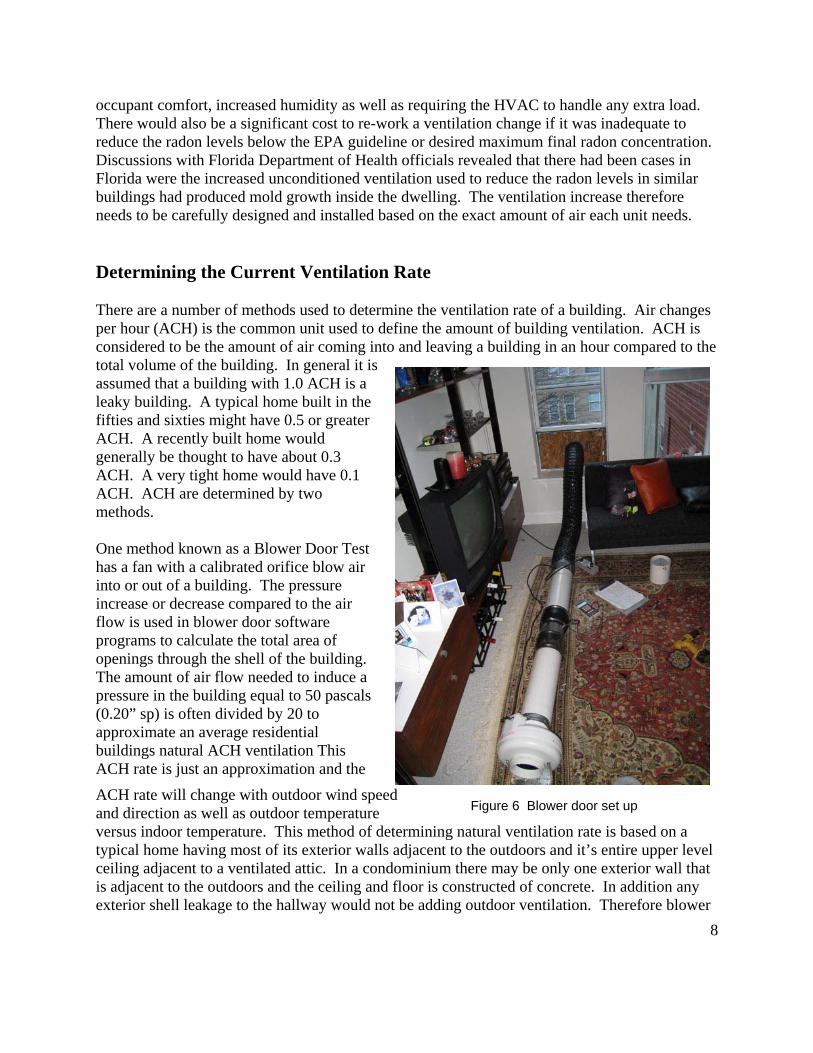
occupant comfort, increased humidity as well as requiring the HVAC to handle any extra load. There would also be a significant cost to re-work a ventilation change if it was inadequate to reduce the radon levels below the EPA guideline or desired maximum final radon concentration. Discussions with Florida Department of Health officials revealed that there had been cases in Florida were the increased unconditioned ventilation used to reduce the radon levels in similar buildings had produced mold growth inside the dwelling. The ventilation increase therefore needs to be carefully designed and installed based on the exact amount of air each unit needs. Determining the Current Ventilation Rate There are a number of methods used to determine the ventilation rate of a building. Air changes per hour (ACH) is the common unit used to define the amount of building ventilation. ACH is considered to be the amount of air coming into and leaving a building in an hour compared to the total volume of the building. In general it is assumed that a building with 1.0 ACH is a leaky building. A typical home built in the fifties and sixties might have 0.5 or greater ACH. A recently built home would generally be thought to have about 0.3 ACH. A very tight home would have 0.1 ACH. ACH are determined by two methods. One method known as a Blower Door Test has a fan with a calibrated orifice blow air into or out of a building. The pressure increase or decrease compared to the air flow is used in blower door software programs to calculate the total area of openings through the shell of the building. The amount of air flow needed to induce a pressure in the building equal to 50 pascals (0.20” sp) is often divided by 20 to approximate an average residential buildings natural ACH ventilation This ACH rate is just an approximation and the ACH rate will change with outdoor wind speed and direction as well as outdoor temperature versus indoor temperature. This method of determining natural ventilation rate is based on a typical home having most of its exterior walls adjacent to the outdoors and it’s entire upper level ceiling adjacent to a ventilated attic. In a condominium there may be only one exterior wall that is adjacent to the outdoors and the ceiling and floor is constructed of concrete. In addition any exterior shell leakage to the hallway would not be adding outdoor ventilation. Therefore blower
Figure 6 Blower door set up
9
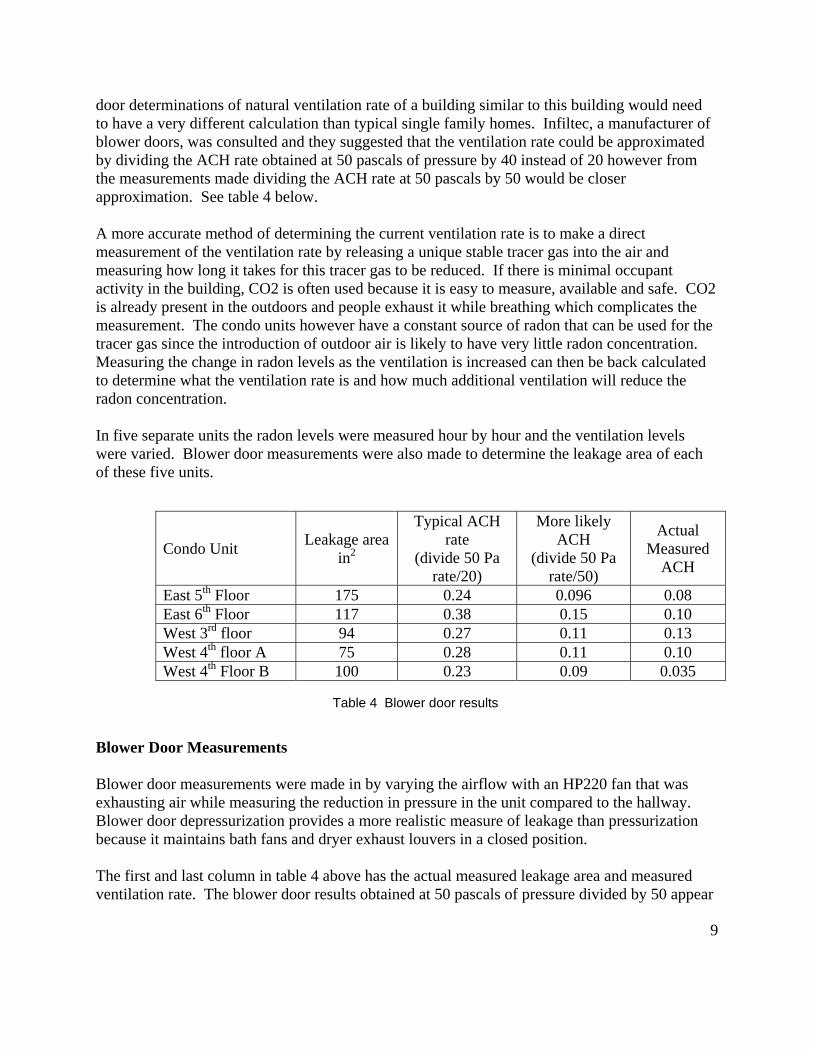
door determinations of natural ventilation rate of a building similar to this building would need to have a very different calculation than typical single family homes. Infiltec, a manufacturer of blower doors, was consulted and they suggested that the ventilation rate could be approximated by dividing the ACH rate obtained at 50 pascals of pressure by 40 instead of 20 however from the measurements made dividing the ACH rate at 50 pascals by 50 would be closer approximation. See table 4 below.
A more accurate method of determining the current ventilation rate is to make a direct measurement of the ventilation rate by releasing a unique stable tracer gas into the air and measuring how long it takes for this tracer gas to be reduced. If there is minimal occupant activity in the building, CO2 is often used because it is easy to measure, available and safe. CO2 is already present in the outdoors and people exhaust it while breathing which complicates the measurement. The condo units however have a constant source of radon that can be used for the tracer gas since the introduction of outdoor air is likely to have very little radon concentration. Measuring the change in radon levels as the ventilation is increased can then be back calculated to determine what the ventilation rate is and how much additional ventilation will reduce the radon concentration.
In five separate units the radon levels were measured hour by hour and the ventilation levels were varied. Blower door measurements were also made to determine the leakage area of each of these five units. Blower Door Measurements Blower door measurements were made in by varying the airflow with an HP220 fan that was exhausting air while measuring the reduction in pressure in the unit compared to the hallway. Blower door depressurization provides a more realistic measure of leakage than pressurization because it maintains bath fans and dryer exhaust louvers in a closed position. The first and last column in table 4 above has the actual measured leakage area and measured ventilation rate. The blower door results obtained at 50 pascals of pressure divided by 50 appear
Condo Unit Leakage area in2
Typical ACH rate
(divide 50 Pa rate/20)
More likely ACH
(divide 50 Pa rate/50)
Actual Measured
ACH
East 5th Floor 175 0.24 0.096 0.08 East 6th Floor 117 0.38 0.15 0.10 West 3rd floor 94 0.27 0.11 0.13 West 4th floor A 75 0.28 0.11 0.10 West 4th Floor B 100 0.23 0.09 0.035
Table 4 Blower door results

10
to be closer to the actual measured value. Note that this is 2 ½ times more air tight than most residential housing. Using standard blower door calculations to determine natural ventilation in condominiums is not recommended.
Trace Gas Measurements The continuous radon monitors used in this study were inter-compared against three Femto-Tech 210 monitors that had just been calibrated at the factory. See the results in Figure 7 above. A base line radon measurement of the radon levels with the doors and windows closed is required to measure the effects of ventilation changes.. Unfortunately in the three occupied units there were open windows and doors at the beginning of the measurement period. See the photos in Figure 8 and 9 of the ventilation happening in one of the units to reduce radon levels. In this particular unit the radon levels were reduced from 13.2 pCi/L (488 Bq/m3) down to around 1.0 pCi/L (37 Bq/m3) with the screened window and patio door left adjar.
0
2
4
6
8
10
12
14
16
1 3 5 7 9 11 13 15 17 19 21 23 25 27 29 31 33 35
Pyl 269
Pyl 598
Pyl 352
femto 371
Femto 374
Femto 384
pCi/l
hours
Figure 7 WPB Inter-Comparison of CRM monitors
Figure 8 Occupant kept bedroom door to patio open
11
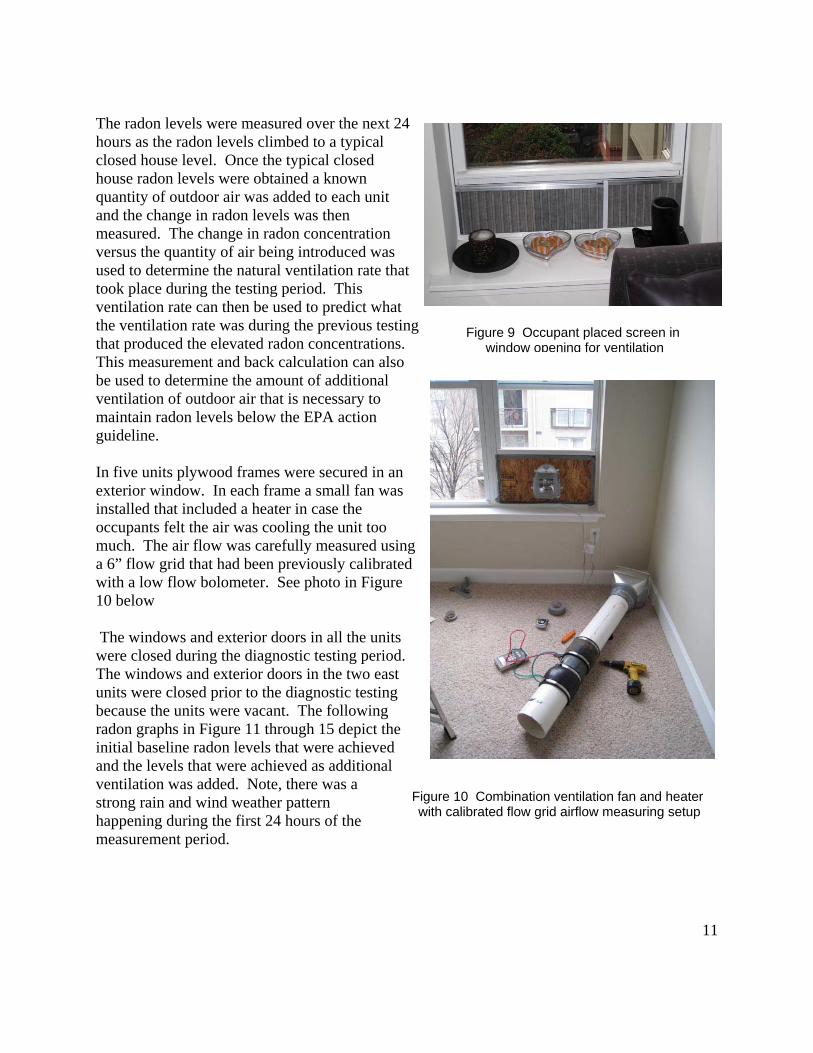
The radon levels were measured over the next 24 hours as the radon levels climbed to a typical closed house level. Once the typical closed house radon levels were obtained a known quantity of outdoor air was added to each unit and the change in radon levels was then measured. The change in radon concentration versus the quantity of air being introduced was used to determine the natural ventilation rate that took place during the testing period. This ventilation rate can then be used to predict what the ventilation rate was during the previous testing that produced the elevated radon concentrations. This measurement and back calculation can also be used to determine the amount of additional ventilation of outdoor air that is necessary to maintain radon levels below the EPA action guideline.
In five units plywood frames were secured in an exterior window. In each frame a small fan was installed that included a heater in case the occupants felt the air was cooling the unit too much. The air flow was carefully measured using a 6” flow grid that had been previously calibrated with a low flow bolometer. See photo in Figure 10 below
The windows and exterior doors in all the units were closed during the diagnostic testing period. The windows and exterior doors in the two east units were closed prior to the diagnostic testing because the units were vacant. The following radon graphs in Figure 11 through 15 depict the initial baseline radon levels that were achieved and the levels that were achieved as additional ventilation was added. Note, there was a strong rain and wind weather pattern happening during the first 24 hours of the measurement period.
Figure 10 Combination ventilation fan and heater with calibrated flow grid airflow measuring setup
Figure 9 Occupant placed screen in window opening for ventilation

12
0.0
1.0
2.0
3.0
4.0
5.0
6.0
7.0
8.0
nn
East 5th Floorvacant
added20 CFM OA
added41 CFM OA
75 SI of opening
Windows were closedbefore test
Natural 0.08 ACH12 CFM
CRM glitch
Windows closed
Blower door indicated
0.12 ACH / 17 CFM
959 ft2t8631 ft3
0.005 CFM per ft2
concrete
0.022 CFM per ft2
concrete
2400 ft2
concretepCi/L
0.013 CFM per ft2
concrete
2.0 pCi/l at 0.014 CFM per ft2 concrete
Hours
Figure 11 Radon Reduction from Increased Outdoor Air
13
0.0
0.5
1.0
1.5
2.0
2.5
3.0
3.5
4.0
4.5
5.0
East 6th Floorvacant
added41 to 35CFM OA
added59 CFM OA
117 SI of opening
Windows were closedbefore test
Natural 0.10 ACH16 CFM
Windowsclosed
Blower door indicated 0.19 ACH / 28 cfm
1039 ft2
9351 ft3
0.006 CFMper ft2
concrete
0.03 CFM per ft2
concrete
2475 ft2
concrete
pCi/L
0.02 CFM per ft2
concrete
2.0 pCi/l at 0.011 CFM per ft2 concrete
hours
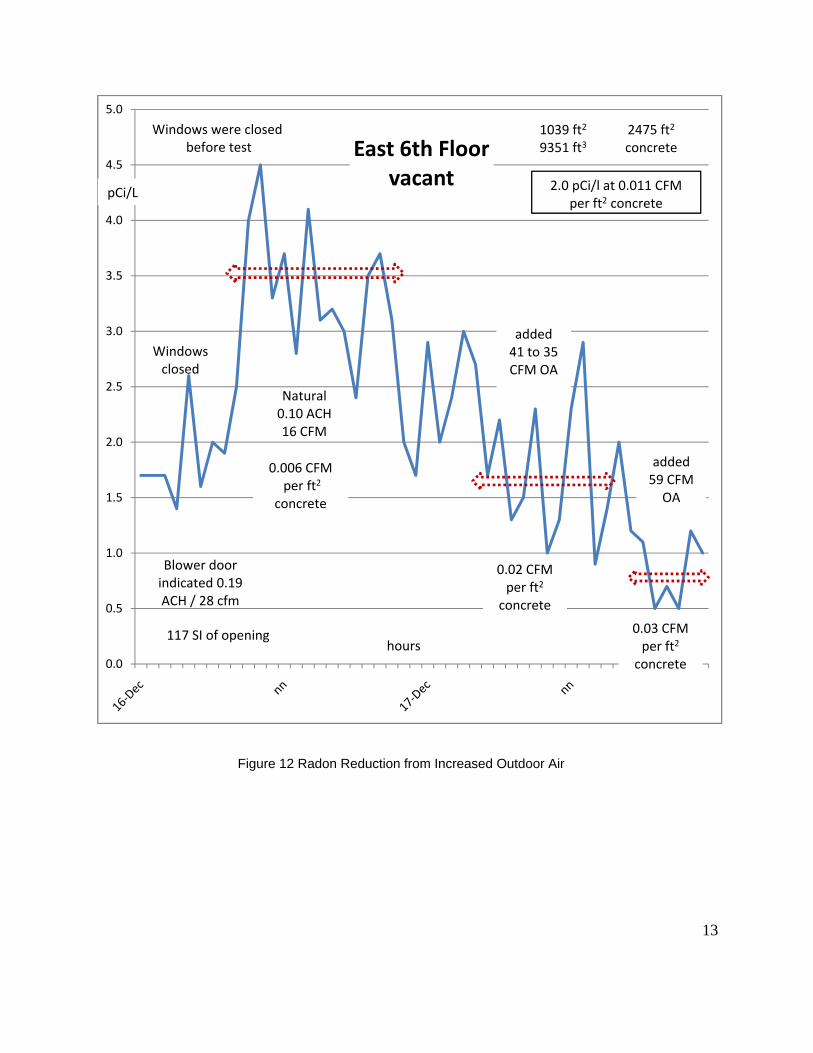
Figure 12 Radon Reduction from Increased Outdoor Air
14
0.0
1.0
2.0
3.0
4.0
5.0
6.0
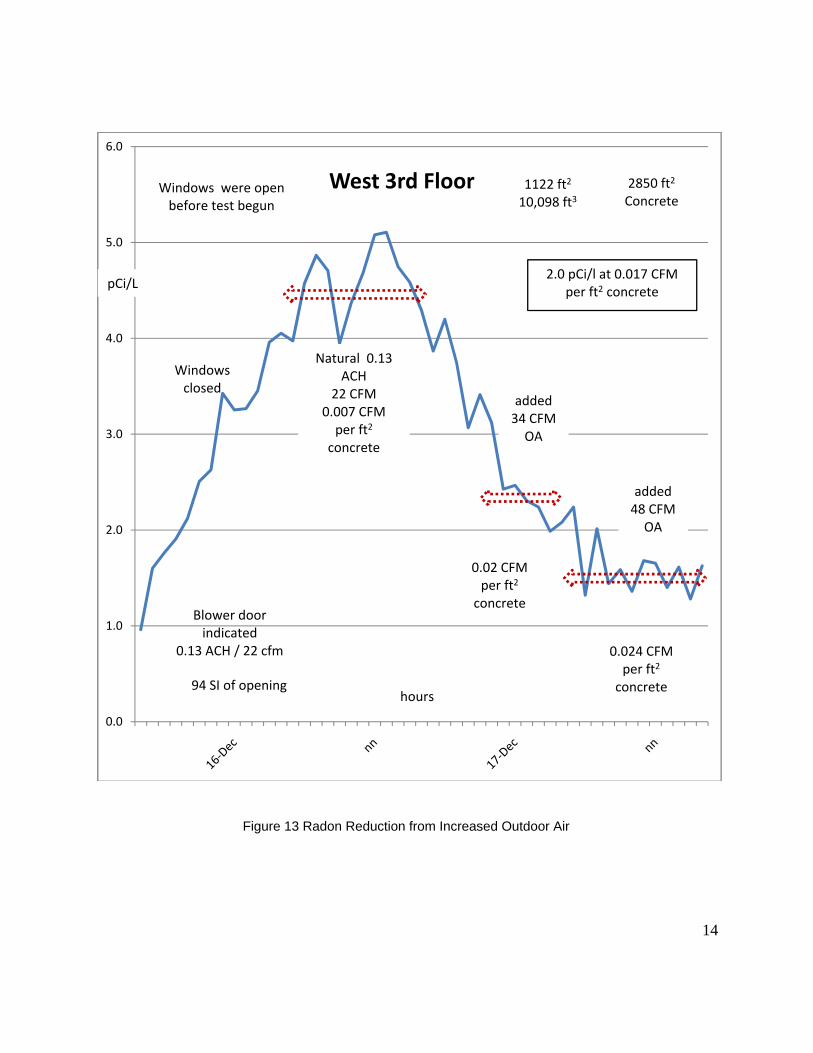
West 3rd Floor
94 SI of opening
Windows were open before test begun
Natural 0.13 ACH
22 CFM0.007 CFMper ft2
concrete
Windowsclosed
Blower door indicated
0.13 ACH / 22 cfm
1122 ft2
10,098 ft3
added34 CFM OA
added48 CFM OA
0.024 CFM per ft2
concrete
2850 ft2
Concrete
pCi/L
0.02 CFM per ft2
concrete
2.0 pCi/l at 0.017 CFM per ft2 concrete
hours
Figure 13 Radon Reduction from Increased Outdoor Air
15
0.0
0.5
1.0
1.5
2.0
2.5
3.0
3.5
4.0
4.5
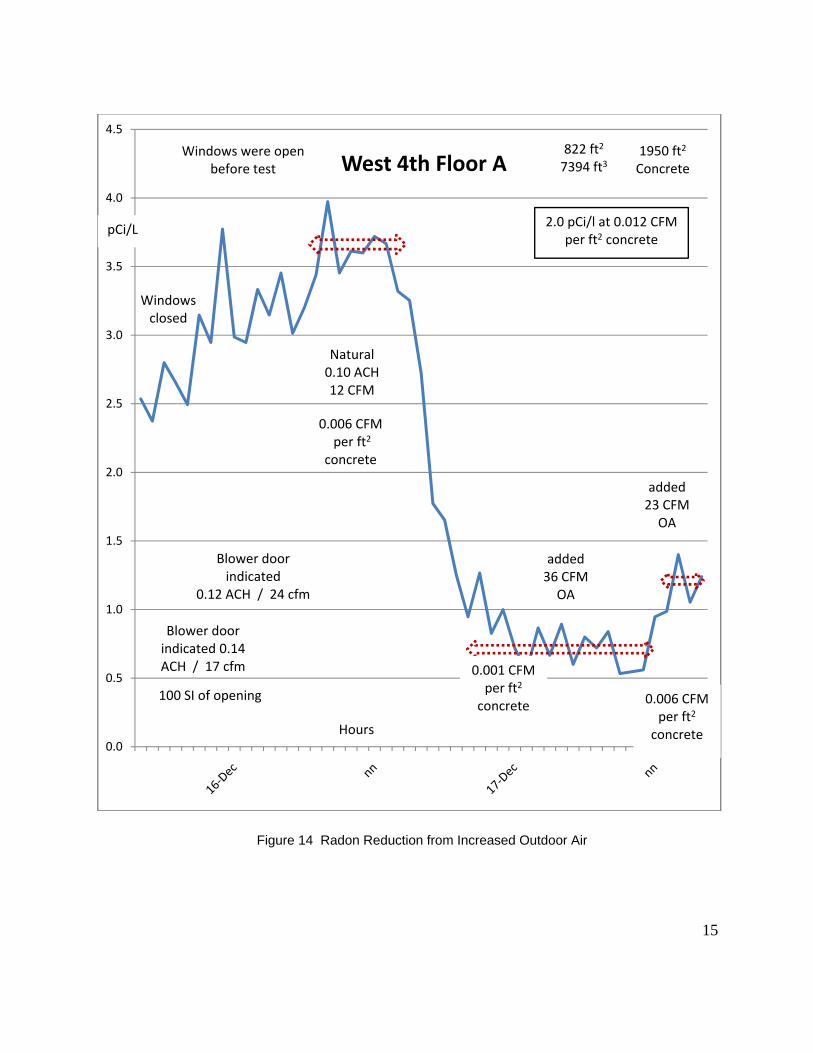
West 4th Floor A
added36 CFM OA
added23 CFM OA
822 ft2
7394 ft3
Natural 0.10 ACH12 CFM
Windowsclosed
Blower door indicated 0.14 ACH / 17 cfm
0.006 CFMper ft2
concrete
Windows were openbefore test
0.02 CFMper Ft2
concrete
1950 ft2
Concrete
pCi/L 2.0 pCi/l at 0.012 CFM per ft2 concrete
100 SI of opening
Blower door indicated
0.12 ACH / 24 cfm
0.006 CFM per ft2
concrete
0.001 CFM per ft2
concrete
Hours
Figure 14 Radon Reduction from Increased Outdoor Air
16
0.0
0.5
1.0
1.5
2.0
2.5
3.0
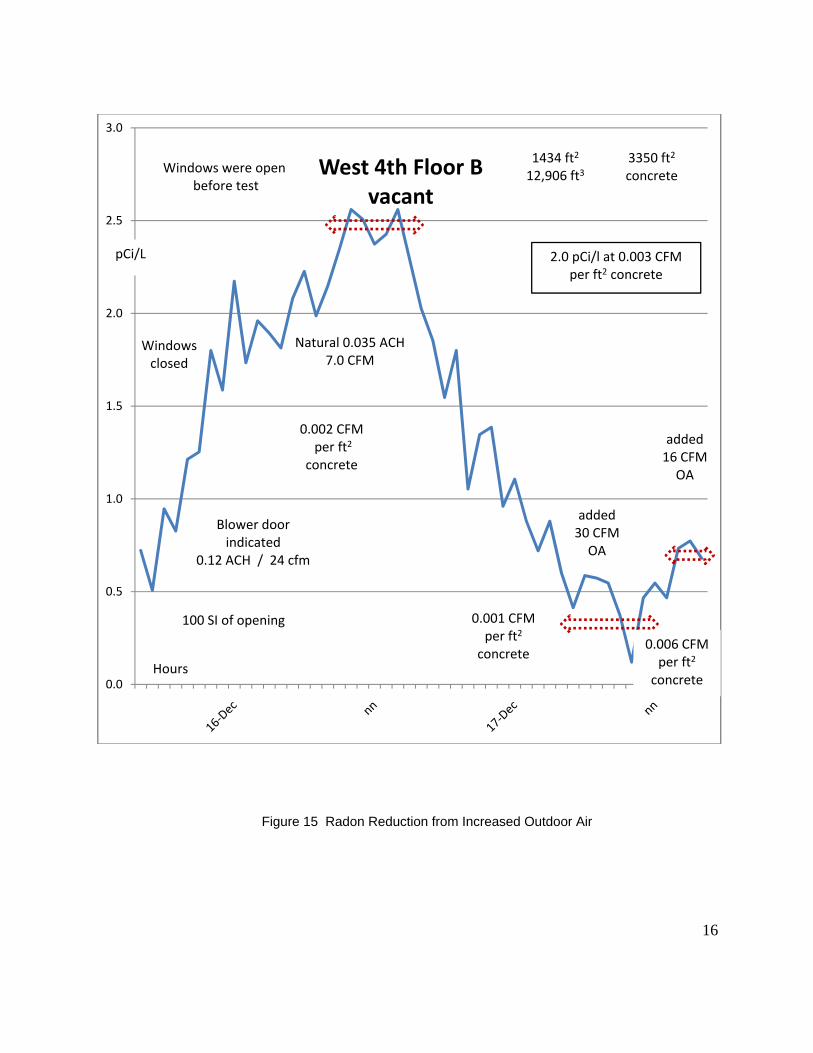
West 4th Floor Bvacant
added30 CFM OA
added16 CFM OA
100 SI of opening
Windows were openbefore test
Natural 0.035 ACH7.0 CFM
Windowsclosed
Blower door indicated
0.12 ACH / 24 cfm
1434 ft2
12,906 ft3
0.002 CFMper ft2
concrete
0.006 CFM per ft2
concrete
3350 ft2
concrete
pCi/L
0.001 CFM per ft2
concrete
2.0 pCi/l at 0.003 CFM per ft2 concrete
Hours
Figure 15 Radon Reduction from Increased Outdoor Air

17
MITIGATION RECOMMENDATIONS The radon reduction achieved by the added ventilation during the diagnostic testing was used to deduce the ventilation rate at the test time. In Table 5 below the ventilation rate is compared to the predicted radon levels inside the unit if 0.015 CFM of outdoor air is added for each ft2 of concrete that is adjacent to the interior area of the building. In four of the five units there was reasonable correlation between the predicted values and the actual radon levels. In unit West 4th Floor B the radon levels were the lowest of all the units and yet this unit had the most square footage of concrete. This unit also backs up to the stairwell which provides more exposed concrete from the stairwell poured concrete walls. There is no explanation why this unit’s radon levels were so low. The reduction in radon achieved by the ventilation fan in unit West 4th Floor B was also the greatest amount which then calculates the units ventilation rate at one third the level of the other units. There is no explanation of why condo unit West 4th Floor B is behaving in this manner.
Unit Initial Radon level
ACH During
Test
Prev Radon Test
ACH during Prev. Test
0.015 CFM per ft2.
concrete + ACH
of prev test
New Radon Levels
Radon w/40
pCi/ft2/hrFlux
East 5TH Floor 5.5 0.084 10.9 0.042 42 1.7 1.5 East 6th Floor 3.5 0.103 9.5 0.038 43 1.4 1.4 West 3rd Floor 4.75 0.132 13.2 0.048 50 1.7 1.7 West 4th Floor A 3.75 0.095 10 0.035 34 1.3 1.6 West 4th Floor B 2.5 0.032 10 0.008 52 0.4 1.8
Table 5 above shows that the ventilation level in four of the condo units was around 0.1 ACH during the diagnostic testing. Unit West 4th Floor B had one third this level.
The ventilation rate that occurred during the previous tests that had higher radon levels can be deduced to be around 0.04 ACH. Moderate temperatures and lack of wind during the previous radon measurement can easily explain the ventilation rate being half of the ventilation rate recorded during the diagnostic visit.
In the table above the predicted radon levels were determined by adding ventilation equal to 0.015 CFM/Ft2 of exposed concrete plus the natural ventilation that existed during the previous radon test period when the natural ventilation rate was very low. In the last column this amount of added ventilation is used to determine the radon levels based on 40 pCi/SqFt/hr emanations from the exposed concrete. The radon levels for both calculations are comparable except for unit West 4th Floor B.
Table 5 Effect of adding 0.03 CFM/ft2 of floor area to each unit

18
Since the radon is coming from the concrete and the emanation rate did not vary significantly, the ventilation added to the building should be proportional to the concrete exposure. The ventilation rate for each unit will need to take into consideration all concrete that the unit is exposed to. Note that the diagnostic testing calculations used the square foot area of the condo and included an approximation for additional concrete walls and beams.
It was therefore recommended that a minimum of 0.015 CFM be added to each unit for every square foot of concrete floor, concrete ceiling, concrete wall and concrete support column that is exposed to the unit with no less than 30 CFM per single bedroom unit and 45 CFM for a two bedroom unit. Additional ventilation may be appropriate.
POSSIBLE MITIGATION OPTIONS Negative Pressure Ventilation One method of inducing ventilation into a building is to exhaust air out of the building from central locations on each floor. Exhaust ducting could be routed from the hallways of each floor to the roof. This would tend to draw air from any leakage points in the building that have access to the hallway. This method would cause varying amounts of air flow to happen to the individual units. Units that have large gaps under the door way to the hallway would tend to have higher air flows than those that having small gaps due to carpeting or other restrictions. This could be remedied by having a pass through transition grill installed between the inside of each unit and the drop ceiling of the hallway. The ventilation to each unit would then vary depending upon each units openings to the outdoors. A unit without an open window might receive very little ventilation while another unit that typically keeps its windows or doors open would have large ventilation increases. This might require over sizing the exhaust system to compensate. The owners that enjoy having windows or patio doors open might find that this system induces increased moisture gain during humid outdoor conditions. This approach would also have reduced effectiveness on any level that had doors from the hallway to the outside. Hallway areas with doors to the outside would tend to get excessive moisture gain on days of elevated outdoor humidity. Negative pressure ventilation is not recommended as the remediation method. Installation of ERV
Another method of increasing the ventilation is to install an Energy Recovery Unit (ERV) either inside or outside every unit. This would require two penetrations of the exterior to allow supply air in and exhaust air out. In some cases it may be possible to use an existing bathroom exhaust duct as the ERV exhaust duct if an adequate backdraft damper exists or is installed to prevent re-circulation of the air exhausted by the ERV. Note that the EPA radon mitigation standard’s recommends that the intake port installed on the exterior of the unit for the ERV be ten feet away from any exhaust ports. The ERV will only partially condition the incoming air with the outflowing air. If the outdoor air is 40 degrees and the indoor air is 70 degrees, the entering air
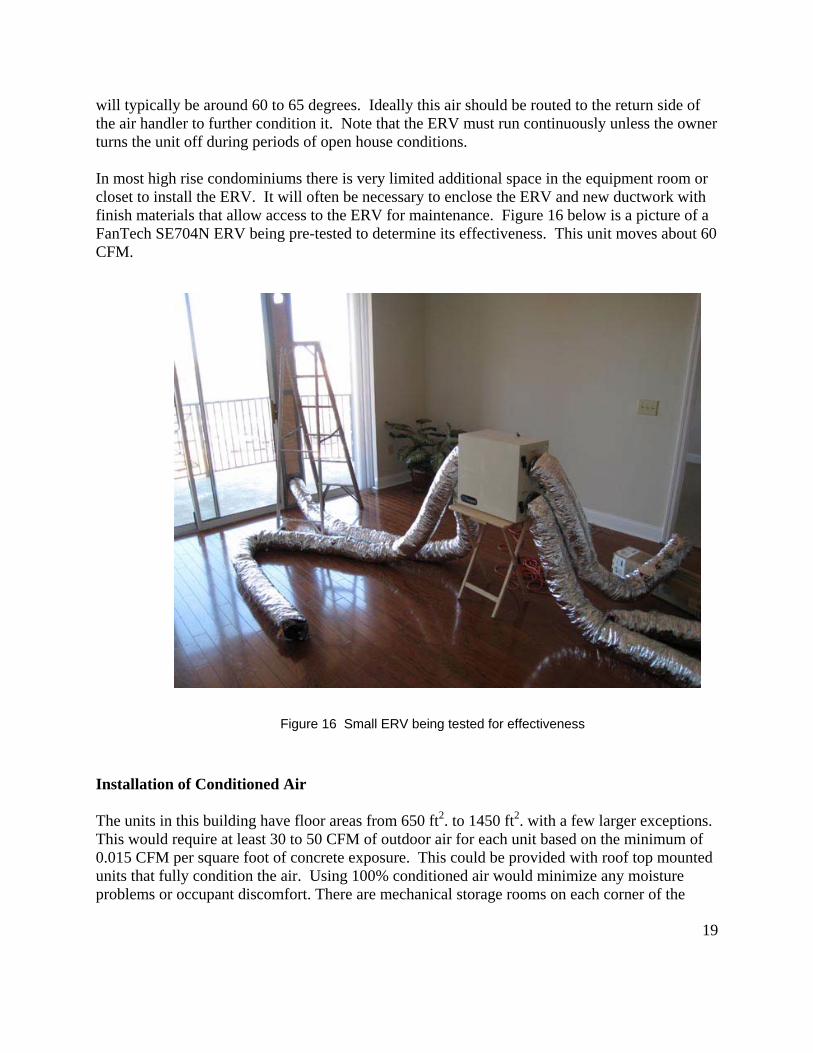
19
will typically be around 60 to 65 degrees. Ideally this air should be routed to the return side of the air handler to further condition it. Note that the ERV must run continuously unless the owner turns the unit off during periods of open house conditions. In most high rise condominiums there is very limited additional space in the equipment room or closet to install the ERV. It will often be necessary to enclose the ERV and new ductwork with finish materials that allow access to the ERV for maintenance. Figure 16 below is a picture of a FanTech SE704N ERV being pre-tested to determine its effectiveness. This unit moves about 60 CFM.
Installation of Conditioned Air The units in this building have floor areas from 650 ft2. to 1450 ft2. with a few larger exceptions. This would require at least 30 to 50 CFM of outdoor air for each unit based on the minimum of 0.015 CFM per square foot of concrete exposure. This could be provided with roof top mounted units that fully condition the air. Using 100% conditioned air would minimize any moisture problems or occupant discomfort. There are mechanical storage rooms on each corner of the
Figure 16 Small ERV being tested for effectiveness

20
buildings that line up above each other that could be used to provide air ducts to each floor. The larger challenge will be routing the air from these mechanical/storage rooms to each unit on each floor while ensuring that each unit gets adequate amount of outdoor air. The hallways in the buildings did have a drop ceiling with fire suppression piping and other mechanical utilities routed through the space already. There might be enough space above the drop ceiling to route some or all of the necessary ducts. Note that all the hallways will also need outdoor air.
There are a number of grade level condo units that along with their exposure to concrete also have exposure to soil based radon. These units were not tested for radon and may need duct work that is oversized in case soil base radon is contributing an additional radon load to the unit. BUILDING VENTILATION STANDARDS ASHRAE, the American Society of Heating, Refrigerating and Air-Conditioning Engineers has been updating ventilation guidelines for commercial buildings for 100 years. The society however has not directed much attention to residential dwellings. Residential ventilation was traditionally not a major concern because it was felt that between operable windows and envelope leakage, occupants were getting adequate air. The latest standard developed by ASHRAE for ventilation of residential buildings is Standard 62.2-2003 which took place after this building was completed. Prior to this in 2001, ASHRAE approved a ventilation standard 62-2001 but this standard was basically the same standard that was adopted in 1989. Note that both 2001 and 2003 standards were and are intended for single family homes and low rise multi-family structures only. The 2001 standard did include specific ventilation flow rates for kitchen, baths, toilets, garages and common areas as well as air exchange rates for living areas. This included an air exchange rate of 0.35 ACH for the living areas with no less than 15 cfm per person from natural and induced ventilation but the standard did not describe how to accomplish this. It was not however until the 62.2.2003 standard that fan forced ventilation was part of the standard and more explicit ventilation requirements were included in the standard. References Brodhead B.. Measuring radon and thoron emanation from concrete and granite with continuous radon monitors and e-perms. Proceedings of AARST International Radon Conference; 2008 Chao C., Tung T., Chan D., Burnett J.. Determination of radon emanation and back diffusion characteristics of building materials in small chamber tests. Building and Environ. 32:355-362; 1997 Cozmuta I., Van der Graaf E.R., Meijer R.J.. Moisture dependence of radon transport in concrete: measurements and modeling. Health Phys. 85: 438-456; 2003 Kovler K. Perevalov A., Steiner V., Rabkin E.. Determination of the radon diffusion length in

21
building materials using electrets and activated carbon. Health Phys. 66: 505-516; 2004 Roelofs L.M.M., Scholten L.C.. The effect of aging, humidity, and fly ash additive on the radon exhalation from concrete. Health Phys. 67: 225-230; 1991a Rogers V.C., Nielson K.K., Holt R.B.. Radon diffusion coefficients for aged residential concretes. Health Phys. 68:832-834; 1995 Sun H., Furbish D.J.. Moisture effect on radon emanation in porous media. J. Contam Hydrol 18:239-255; 1995 Yu K.N., Chan T.F., Young E.C.M.. The variation of radon exhalation rates from building materials of different ages. Health Phys. 68:716-718; 1995