eli gruber, pe - dnrc.mt.gov
TRANSCRIPT

2017 Montana Floodplain Resource Seminar: Lecture 6 Reviewing Results
Eli Gruber, PE
Lecture 6 Overview
• Model Outputs
• RAS Mapper Functionality
• Flow Checks
• Flow and Stage Hydrograph Output
• Render Mode
• Export Results
July 25, 2017 2

Model Outputs
• RAS Mapper
–Depth, WSEL, velocity
–Animate results
–Flow Check
• Hydrograph outputs
– Internal connections
–Boundary conditions
• Errors and volume conservation
July 25, 2017 3

Results Check
• Runtime messages
–Convergence errors above the tolerance will show up here
July 25, 2017 4

Volume Accounting
• Computation log file
–Shows final volume accounting
–Acceptable error is application dependent
July 25, 2017 5

Viewing Results in RAS Mapper
• After a model is run, the plan short ID will show up in the TOC in RAS Mapper under Results
• Each plan can be expanded to toggle on/off different map results
• Dynamic maps
–Results available based on output interval selected in plan setup
July 25, 2017 6

Render Mode Options
• Right click results in TOC
• Three options
–Horizontal
–Sloping
–Hybrid
• Important to understand how each of these relate to model computations and actual results
July 25, 2017 7

Horizontal Render Mode
• Fills each 2D cell to the water surface as computed in the 2D simulation
• Can produce “patchwork” in areas of significant relief
• Fails to represent hydraulic gradient
July 25, 2017 8

Sloping Render Mode
• Interpolates water surface elevations from each cell face
• Provides visualization of continuous flooding
• Exaggerates flooding in some areas and under-represents in others
July 25, 2017 9

Hybrid Render Mode
• Attempts to utilize both sloping and horizontal and apply the “correct” option for different areas
• Uses metrics to determine when one of the render mode options is failing and switches to the other
• Can’t export these results in the current version (5.0.3)
July 25, 2017 10

Layer Visualization
• Adjust color scheme and transparency
• Display Map Values shows computed value
• Plot 2D Hydraulic Connectivity shows how water is moving between cells
July 25, 2017 11

Animations
• Dynamic map allows user to view simulation results for each output point
–Specify output interval in plan file
July 25, 2017 12

More Animations
• Velocity particle tracer and vector arrows
–Visualize flow patterns; direction and magnitude
July 25, 2017 13

Profile Lines
• Draw profile lines using the measure tool in RAS Mapper
–Cut terrain profile
–Save profile line and use to view results
–Plot WSEL with terrain cross section
–Plot depth or velocity profiles
–Extract flow or stage time-series results
July 25, 2017 14

Profile Lines Plotting
July 25, 2017 15
Dynamic: Scroll through different output interval data points, or min/max

Exporting Results
• Static datasets can be exported from RAS Mapper in raster format
–Right click desired plan
July 25, 2017 16

Selecting Export File and Output
• Select map type and desired profile
• Can add dynamic maps to RAS (only viewable inside RAS Mapper)
• To create a static exported dataset, needs to be Stored option
July 25, 2017 17

Executing Export
July 25, 2017 18
RAS Mapper Windows Explorer
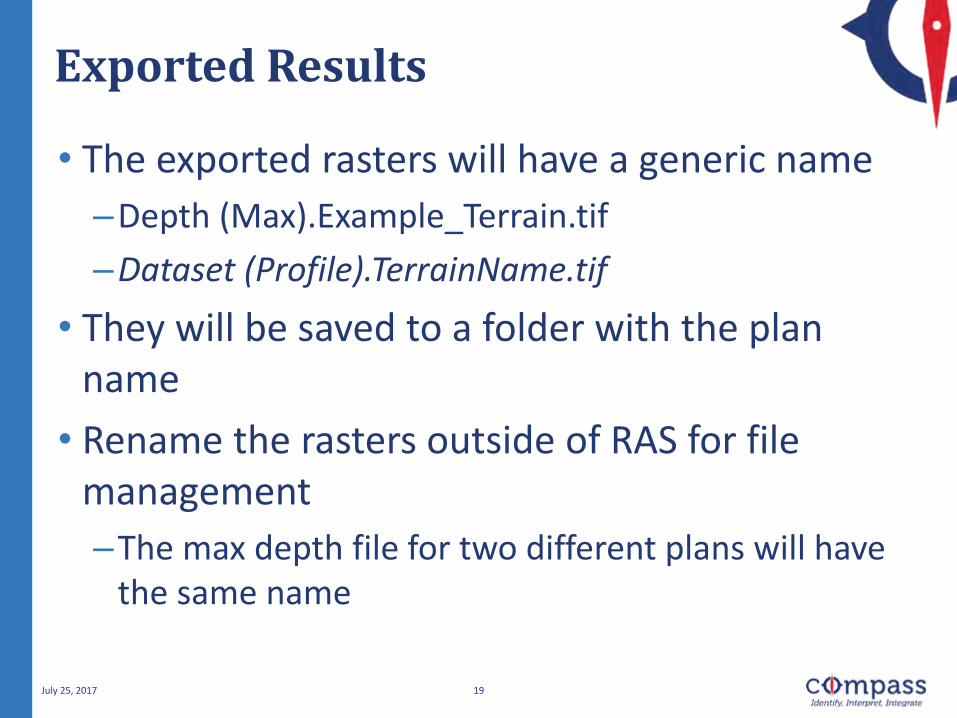
Exported Results
• The exported rasters will have a generic name
–Depth (Max).Example_Terrain.tif
–Dataset (Profile).TerrainName.tif
• They will be saved to a folder with the plan name
• Rename the rasters outside of RAS for file management
–The max depth file for two different plans will have the same name
July 25, 2017 19

Notes on Results in RAS Mapper
• Results render differently at different zoom levels – pyramids
• Maximum and minimum do not represent snapshots in time; max/min for each cell regardless of when it occurs
–Floodplain mapping limit
• Review results carefully to ensure hydraulics make sense
July 25, 2017 20

Questions
July 25, 2017 21
Photo from FEMA
