eli lilly valuation - texas tech universitymmoore.ba.ttu.edu/valuationreports/elililly.pdf · eli...
TRANSCRIPT

Eli Lilly Valuation April 1, 2005
Chelsea Winters [email protected]
Lucas Minkley [email protected]
Godfrey Offoegbu [email protected]
Brandon Perryman [email protected]
Stuart Armstrong [email protected]
Group 17
1

Eli Lilly Valuation
Table of Contents
Executive Summary………………….………..4
Business and Industry Analysis…………….6 Industry Analysis………………………………..6
Five Forces Model……………………………….7 Key Success Factors…………………………..10 Competitive Strategy Analysis……………..13
Accounting Analysis…………………............14
Identify Key Accounting Policies…………...14 Assessing Accounting Flexibility………….…17 Evaluate Accounting Strategy…………….…18 Quality of Disclosure…………………………...19 Quantitative Measures ………………………..21
Ratio Analysis and Financials…………………23
Financial Ratio Analysis………………………..24 Profitability Analysis……………………………..28 Financial Forecasting Methodology….........36 Quarterly Methodology………………………….36 Limitations Strengths and Weaknesses…..39
Valuation Analysis………………………………….40 Method of Comparables………………………....44 Discounted Residual Income……………..….…47 Discounted Free Cash Flows……………..….…49 Discounted Dividends………………………….....49
Abnormal Earnings Growth………………………50
References...………………………………………...51 Appendix……………………………………………….52
2

Investment recommendation: Sell, Overvalued April 13, 2005
3
LLY – NYSE 4/13/05 $57.12 52 Week Range $50.34 - $76.95 Revenue (2004) $13,857,900,000 Market Cap $64,700,000,000 Shares Outstanding 1,132,884,800 Dividend Yield 2.28% 3-month Avg Daily Trading Volume 3,343,272 Percent Institutional Ownership 68.59% Book Value per Share (mrq) 9.647 ROE 17.06% ROA 7.81% 5 year est. EPS growth rate 10.00% Cost of Capital Estimates Ke Est. 6.399% Est.Beta .911 R^2 Beta Ke 5 Year Beta .0287 .356 4.45 3 Year Beta .2413 .911 6.40 2 Year Beta .1770 1.165 7.29 Published Beta .367 Kd 3.5% WACC (bt) 6.13 Debt Risk Altman Z-Score 4.45
Executive Summary
EPS Forecast FYE 4/05 2004 (A) 2005 (E) 2006 (E) 2007 (E) EPS 1.66 2.61 2.85 3.12 Valuation Ratio Comparison Eli Lilly Industry avg. Trailing P/E 32.72 12.37 Forward P/E 17.58 13.15 Forward PEG 1.76 1.79 M/B 5.63 7.74 Valuations Estimates Actual Current Price (4-13-05) $57.12 Ratio Based Valuations P/E Trailing $20.54 P/E Forward $40.65 PEG Forward $55.40 Dividend Yield $41.01 M/B $45.69 Ford Epic Valuation $86.75 Intrinsic Valuation Discounted Dividends $33.13 Free Cash Flows $48.29 Residual Income $47.24 Abnormal earning Growth $58.73 Long Run Residual Income Perpetuity $33.02

Executive Summary Recommendation – Overvalued We recommend Lilly as a sell or short option at a target price of $50. With the
pharmaceutical market being so capital intensive with high R&D costs, much of
Lilly’s income depends on the success of its new products. Due to this we
believe that much of Lilly’s current share price is based on the assumption that
its current R&D projects will be successful.
Industry Demand Drivers In a booming drug Industry where a company with the best combination of
factors can lead them to have success, Eli Lilly, is heading down this path. Lilly
has done a good job in its financial performance, along with its research and
development.
Lilly’s Growth Prospects Lilly saw total sales grow 10 percent over the prior years at the high end of the
drug industry. Lilly’s eight new products contributed to that result, accounting for
11 percent of Lilly’s total sales. Lilly also expects sales to double in 2005. “Lilly
also managed to beat investor’s expectation for earning for the year delivering
adjusted earning per share around 2.82. (For a reconciliation of our adjusted EPS
per share to the reported EPS of 1.66)” (www.Lilly.com) Eli Lilly’s growth
prospects are almost solely related to new Research and Development funding
and projects, in house our acquired through the open market. R&D acquisitions
are initially detrimental to earnings, and it is important that new drugs receive
regulatory approval; R&D costs can then be capitalized. Demand directs drug
development; focus on chronic rather than acute illnesses is instrumental to
growth and success. Advances in biotechnology are opening new windows for
product development, as well as decreasing costs associated with research and
4

development. The pharmaceutical industry will see continued growth, in lock
step with biotechnology, healthcare, and related industries. With Clinical research
conducted in more than 60 countries, manufacturing plants located in 13
countries, and Products marketed in 143 countries, there is ample room for
global expansion as well as product and marketing innovation
Valuation There are many factors in our valuation that leads us to believe that Lilly is
overvalued. Lilly’s Long-Term Debt to Equity ratio for the previous year was
1.28, significantly higher than the industry average of 32. ROE for 2004 was
16.58% compared to an industry average of 24.85%. For the fiscal year ended
12/31/04, net sales rose 10.1% to $13.86 billion. Net income fell 29% to $1.81
billion. Revenues in some part reflect the strong performances of Zyprexa,
Strattera, and Cialis. Earnings decreased by $392.2 million following the
acquisition of an in-process research and development project. Lilly has a P/E of
32.70 compared to the industry average of 23.80. With a ROA of 7.28% in the
lat fiscal year, Lilly trailed the industry average of 10.88%. Lilly also posted an
84.98 dividend payout ratio as opposed to the industry average of 56.25.
Risks
Among the many threats that Eli Lilly faces is the negative publicity that they
receive from the media. On January 1, 2005 the British Medical Journal printed
an article stating that Eli Lilly had hidden information about their drug Prozac.
They had to retract the article after receiving a complaint from Eli Lilly
customers. Incidents such as this cause a decrease in consumer confidence in
their product. Pharmaceutical companies also face the threat of competitor’s
ability to create generic drugs. These companies can sell the same product at a
lower price due to lower research and development costs.
5

Business & Industry Analysis
Industry Analysis
The Pharmaceutical Industry is a $300 billion industry. 1 The high
competition in this industry allows new entrants to enter the industry with low
legal barriers. Competitors in the industry will engage in price competition and
experience low product differentiation, along with trends of supply being greater
than demand. The profit potential of this industry fluctuates from low to high,
pending on your company’s success of research and development. One of the
major factors of the Pharmaceutical Industry is the increasing elderly population
which consumes three times as many drugs as any other population, and this
population is increasing. The elderly population is expected to reach 690 million
by the year of 2025. 2
Figure 3.2 3 shows changing expectations over the last nine years for the future growth, profitability and P/E levels of major drug companies. Sales
6

Growth (left axis) - 3-5 year forecast estimates. Net Margin (left axis) - expected net margin in the next 3-5 years.
Five Forces Model
Competitive Force 1: Rivalry among existing firms
Eli Lilly (Lilly) is a leader in a somewhat competitive pharmaceutical
industry. Its major competitors include Pfizer Inc., GlaxoSmithKline PLC, and
Novo Nordisk A/S. The pharmaceutical industry is high growth, high competition
industry with product differentiation being the main industry driver. Lilly spent
705.5 million dollars in the 4th Quarter of 2004 in Research and Development.
High Research and development cost for Lilly and its competitors leads to high
7

product differentiation with new products being introduced on a regular basis.
Lilly has 2 new products in the final stages of FDA trials with a new product
planned to be introduced in 2005. Lilly has also recently purchased a new
compound from Merck Inc which shows promise in treating insomnia. The drug
market has a steep learning curve which leads to Lilly being engrossed in steep
competition with the other major drug companies. Lilly does, however, maintain
a low fixed to variable cost ratio which leads to low competition on the basis of
price. Competition in this industry is primarily based on product differentiation.
The exit barriers in the pharmaceutical industry are very high which makes this
industry that much more competitive. Lilly is a very specialized company,
focusing solely on pharmaceuticals.
Competitive Force 2: Threat of New Entrants
The threat of new entrants into this highly specialized industry is very low.
There is a big first mover advantage for those companies such as Lilly that have
been in the industry a long time and have a big investment in research and
development built up. This is a key to being competitive in this industry. It
would be very hard for a company to make the move to pharmaceuticals due to
the fact that it is such a specialized industry. There is a very steep learning
curve in the pharmaceutical industry which also prevents competitors from
entering the market. There is an already built up capacity in existing distribution
channels that Lilly and its competitors have built up over the years. High
marketing investments and established relationships with health care providers
make it hard for new entrants to be able to cut in. There are also high legal
barriers to the pharmaceutical industry with new products having to go through
an extensive testing and approval process from the FDA.
8

Competitive Force 3: Threat of Substitute Products
In the pharmaceutical industry there is a somewhat substantial degree of
product substitution with many drugs being offered to treat the same illness.
The threat of substation lies not with the end user, but with the doctor that
prescribes the medication. Drug companies such as Lilly spend a great deal of
resources to send out drug reps. to inform doctors of new drugs on the market.
In order to have an advantage over its competitors a drug company has to spend
extensive amounts of money on research and development costs, as well as
marketing in order to discover and sell new and innovative drugs. The drugs
ability to successfully cure whatever illness it is designed to cure is the basis of
the industry. Therefore, the company that comes out with the best drug will
have a considerable share of the market for curing that particular illness for as
many years as it has a patent on that drug. Once the patent expires, however,
rival drug companies can make generic versions of that drug and can be able to
re enter the market for that particular illness. This potential for other drug
companies to eventually be able to take away a share of the market is what
drives up the research and development costs of pharmaceutical companies.
They are always on the lookout for better performing drugs to introduce and re
gain their share of the market.
Competitive Force 4: Bargaining Power of Buyers The bargaining power of buyers is intermediate in the pharmaceutical
markets the same holds true for Lilly and Co. Two elements of bargaining power
of buyers are price sensitivity and relative bargaining power. Buyers are less
sensitive to price because Lilly produces some drugs that have no substitutes
and are not replicated in the generic drug markets. Buyers are more sensitive to
price when generic drugs are available.
9

Relative Bargaining power of buyers is intermediate because drugs are
prescribed by a Doctor and the buyer does not have the option of switching
products if the price is too high, but if a generic drug is available, the consumer
can opt not to purchase the brand name drug. Therefore the bargaining power
of the buyer depends on what a Doctor tends to prescribe, and the status of
patents and available generic counterparts.
Competitive Force 5: Bargaining Power of Suppliers
The bargaining power of suppliers is low because there are many drug
suppliers that produce generic compounds that are used in a great number of
pharmaceutical products. Lilly purchases large quantities chemicals and chemical
compounds many of which are used in more than one type of drug. Lilly can
choose from a plethora of companies offering the exact same materials,
therefore bargaining power of pharmaceutical suppliers is low. With high
bargaining power over suppliers, and buyers with little bargaining power, Lilly
can increase profit margin on their products by increasing retail prices and
decreasing supplier prices.
Key Success Factors
One of Lilly’s greatest key success factors is its capability to create
strategic alliances and marketing partnerships with other thriving corporations.
Lilly joined forces with German firm Boehringer Ingelheim Pharmaceuticals to
market the anti-depressant drug Cymbalta. Despite having to withdraw its
application to sell the product as a treatment for stress urinary incontinence in
the U.S., the drug generated $61 million in the fourth quarter of 2004 in Europe.
Lilly also has an alliance with Amylin Pharmaceuticals, Inc., to collaborate on the
10

development and commercialization of exenatide for the treatment of type 2
diabetes.
Another success factor of Lilly is its brand name products. Drugs such as
Strattera and Cialis have proven to be very effective among consumers
throughout the years. Lilly is committed to the improving the quality of their
products and maintaining the integrity of the data that supports the safety and
effectiveness of their drugs. The success of these products creates even better
credibility for Lilly and Company.
Lilly’s marketing ability is a success factor that is directly related to its
financial success. The company ran a 60 second commercial spot advertising the
male enhancement drug Cialis during the 2004 and 2005 Super Bowl
championship games. The Super Bowl is the most- watched television event in
the U.S., and would provide an extremely large viewing audience. Each 60
second commercial costs about $6.8 million, which shows the financial stability of
this powerful company. Sales of this drug totaled $153 million in the fourth
quarter of 2004 due in part to the marketing strategies of Lilly.
Lilly’s ability to market and sell its drugs all over the world is another one
of their key success factors. Lilly’s drug Cymbalta has been approved in 30
countries to aid major depression. Lilly’s ability to sell and market drugs outside
the borders of the U.S. open the market up for more potential customers.
Lilly announced a seven percent increase in its dividend effective for the
first quarter of 2005. The increase in dividends shows that a leading innovation
driven corporation such as Lilly is profitable and will continue to grow in the
future.
11

Pfizer, one of Lilly’s biggest competitors, was accused in 1999 by Public
Citizen of withholding evidence about the link between its pain drug Celebrex
and heart problems. This mistake on Pfizer’s behalf caused customers to lose
trust allowing other competitors such as Lilly to gain a competitive advantage.
This also shows that Lilly is not the only company that faces the problems with
information disclosure.
Lilly’s ability to develop, manufacture, and patent drugs before its
competitors will also give Lilly a competitive advantage. Lilly currently has
patents on the ingredients in drugs such as Zyprexa, Humalog, and ReoPro.
New drugs such as Alimta for cancer treatment, Cialis for erectile dysfunction,
and Strattera for ADD accounted for 20 percent of Lilly’s 2004 fourth-quarter
sales. Eli Lilly also acquired Applied Molecular Evolution, a research and
development company that is recognized as a leader in optimizing and
developing human biotherapeutics, in February of 2004. This acquisition will aid
Lilly in discovering new drugs for the future.
Pharmaceutical companies also face the threat of competitor’s ability to
create generic drugs. These companies can sell the same product at a lower
price due to lower research and development costs. Lilly has the ability to create
generic drugs while also maintaining its edge in the market of new drugs.
Competitive Strategy Analysis
With health care on the rise there are a significant number of
pharmaceutical companies in the market. Lilly has created a competitive
advantage by differentiation of their drugs. With the production of drugs like
Strattera, which is the first non-stimulant medication approved by the FDA to
treat Attention Deficit Hyperactivity Disorder (ADHD), other companies cannot
12

produce a substitute or a replica. This gives Lilly a sustaining competitive
advantage because it sets them above their competitors and that is why they are
becoming the leading pharmaceutical company in the market.
Another way that Lilly sustains a competitive advantage is through there
superior product quality and variety. They will conduct pre-clinical trials to
obtain proof of safety and effectiveness before any human ever takes a new
drug candidate. Lilly also offers a wide product pipeline of superior drugs that
have hit the market in the past three years. The drugs are related to curing
osteoporosis, bipolar depression, type II diabetes, and also ADHD in children and
adults.
Last but not least, and the most important factor in obtaining a
competitive advantage is the investment in research and development. With one
of the top five total operating revenues in the pharmaceutical industry, Lilly is
also ranked fourth in money spent on research and development in 2003. Lilly
has capitalized on there resources and has recently built a new research
laboratories in Indianapolis to compensate for there 8,800 scientific employees.
Lilly is not just limited to the United States but also does clinical research and
development in many other countries. They now own manufacturing plants in
other countries which is advantages since there products are marketed in 138
countries worldwide.
13

Accounting Analysis
In this section we discuss both qualitative and quantitative steps to
evaluate Lilly’s accounting quality in their financial statements. The qualitative
method involves the following six steps: key accounting policies, potential
accounting flexibility, accounting strategy, quality of the disclosure, potential “red
flags”, and undo accounting distortions. The quantitative methods consist of
sales manipulation diagnostic ratios and core expense manipulation diagnostic
ratios used to determine the change in accounting over time.
Identifying Key Accounting Policies
Lilly is a pharmaceutical company that relies heavily on patents along
with other intellectual property, the ability to produce drugs on demand, and
research and development activities which allow the company to develop new
and innovative drugs while remaining competitive. Some of Lilly’s most critical
accounting policies include sales rebates and discounts and their impact on
revenue recognition, product litigation liabilities and other contingencies, and
pension and retiree medical benefit costs. Lilly, like any other publicly traded
company, is required to prepare financial statements in which some estimates
and judgments have to be completed by Lilly’s management. Lilly bases its
estimates and judgments on past experience and assumptions concerning the
future. They explain that some of their estimates might be different from actual
results.
Research and development is a key element of Lilly’s success because
discovery of new drugs drives the pharmaceutical industry. Lilly immediately
expenses research and development costs, capitalizing them only after
regulatory product approval is received. If the product has obtained regulatory
14

approval, Lilly generally capitalizes the expense milestones and amortizes them
over the life of the product. Milestones paid prior to regulatory approval of the
product are generally expensed when the event requiring payment occurs.
Lilly records all inventories at the lower of cost or market. They use the
conservative inventory method of last-in, first-out (LIFO) method for largely all of
their inventories located in the continental United States, or approximately 40
percent of their total inventories. Other inventories are valued by the more
aggressive method of first-in, first-out (FIFO) method, which causes Net Income
to be higher. FIFO cost approximates current replacement cost.
Lilly amortizes other intangibles, such as patents, with finite lives arising
from acquisitions and research alliances over their estimated useful lives, ranging
from 5-10 years, using the straight-line method. Beginning with Lilly’s adoption
of Statement of Financial Accounting Standards (SFAS) 142, Goodwill and Other
Intangible Assets, on January 1, 2002, goodwill is no longer amortized. Goodwill
and other intangibles are reviewed to assess recoverability at least annually and
when certain impairment indicators are present. Lilly currently has no other
intangible assets with indefinite lives. No material impairments occurred with
respect to the carrying value of Lilly’s goodwill or other intangible assets in 2003,
2002, or 2001. Amortization of goodwill in 2001 was insignificant.
Lilly recognizes it sales rebates and discount accruals in the same period
as their related sales and they are recorded as other current liabilities. Sales
rebates and discounts that require the use of judgment in the establishment of
the accrual include Medicaid, managed care, long-term-care, hospital, and
various other government programs. Lilly bases their sales rebates and discount
accruals primarily upon their historical rebate and discount payments made to
their customer segment groups. Lilly calculates the rebates and discounts based
15

upon a percent of the companies sales for each of their products as defined by
the statutory rates and the contracts with their various customer groups.
Lilly, like many other pharmaceutical companies, faces unexpected
product litigation liabilities and other contingencies. These liabilities and
contingencies are based upon complex judgments and probabilities. The factors
that Lilly considers in developing their product litigation liability reserves and
other contingent liability amounts include the qualities and jurisdiction of the
litigation, the nature and the number of other similar current and past litigation
cases, the nature of the product and the current assessment of the science
subject to the litigation, and the likelihood of settlement and current state of
settlement discussions if any. Lilly has accrued for certain product liability claims
incurred, but not filed, to the extent they can formulate a reasonable estimate of
their costs. Lilly estimates for litigation expenses based mainly on historical
claims experience and data about product usage.
Lilly uses discount rate and the expected return on plan assets in their
defined benefit pension and retiree health benefit plans which they adjust
periodically. In 2003, Lilly decreased the assumed weighted-average discount
rate from 7.2 percent to 6.8 percent for the pension plans and 6.9 percent for
the retiree medical plans and reduced the assumed weighted-average expected
return on plan assets from 10.5 percent to 9.26 percent for the pension plans
‘and 9.25 percent for the retiree health plans. The changes in their discount rate
and expected rate of return on plan assets decreased income before taxes in
2003 by approximately $30 million and $50 million, respectively. Lilly increased
their assumed health-care-cost trend rate from 6 percent to 10 percent for 2003,
due to increasing trend in the cost of health care.
16

Assessing Accounting Flexibility
Lilly uses LIFO for their inventory accounting in the continental United
States. This accounts for 40% of their total inventory. LIFO inventories are
stated at cost or market value, depending on the lower of the two. The
remainder of non-domestic inventory is accounted for using FIFO, costs of which
are approximated using current replacement cost. They are not flexible in
deciding which method for domestic and international inventory, but the weights
of these inventories does affect the overall accounting since they are consistent.
Pharmaceutical companies rely heavily on Research and Development
expenditures to create value within the organization. Managers have very little
accounting discretion and are forced to initially expense R&D no matter what the
expected future cash flows. R&D can only be capitalized and subsequently
amortized once a tangible result is produced. This limits managers and may
create an incentive for overstating assets or inflating net income if R&D expenses
are large and tangible products are delayed or off-schedule. Lilly recognizes
incurred R&D asset costs even when regulatory approval has not been granted
for the particular research process, and no alternative use of the asset is defined.
Once a product receives regulatory approval, R&D expenses are capitalized, and
amortized over the expected life of future financial benefits. This lack of flexibility
could be motivation to manage earning or other areas in order to compensate for
decreased assets and increased expenses associated with R&D.
As with most major corporations, pension and severance packages have
great flexibility. The number of factors and their uncertainty make estimating
pension expenses inherently difficult. There is flexibility within these estimates to
significantly over/under state expenses.
17

Delaying asset impairment is another potential area of flexibility for Lilly.
With large investments in Plant, Property, and Equipment related to
manufacturing and distribution of their products there is a potential for delaying
impairment to inflate assets. Another key area where this could be achieved is
R&D. If a product is not as successful as anticipated, or a generic counterpart is
created the asset is impaired. Delaying the impairment of future cash flows
overstates assets. Income could then be smoothed to mitigate the initial loss of
future cash flows and let investors down easy.
Evaluate Accounting Strategy
Lilly’s overall accounting strategy puts an emphasis on transparency and
consistency. In addition to following all SEC, GAAP, and FASB regulations, a
company-wide ethics manual known as “The Red Book” outlines ethical and legal
standards of business conduct worldwide. The books vary according to what
country they apply to. A special section regarding Financial Management outlines
the “unique responsibilities of financial stewardship.”
Related to requirements forcing R&D to be immediately expensed and
only later capitalized, acquisitions can be potentially misleading when looking at
Lilly’s financial statements. Lilly routinely acquires separate companies or in-
process R&D projects. If a company is acquired assets will go up, but the R&D
expenses associated with in-process projects will be expensed, subsequently
lowering the associated value if the acquisition. This can have an adverse effect
on financial statements because R&D expense is increased significantly and there
is no real recording of value until the expenses can be capitalized. This acquired
R&D expense can have a negative effect on earnings. For example Lilly acquired
Applied Molecular Evolution (AME) 5 in 2004. The financial statements recorded
an incurred cost of $362.3 million dollars for R&D projects already in progress.
18

This acquisition decreased earnings per share by $0.33 cents in the first quarter
of 2004. Acquisitions such as AME are listed in the Management Discussion as
well as footnotes to try to explain transactions that may seem to provide little
value initially. The Pharmaceutical industry is a primarily R&D driven industry,
and even if an acquisition is a positive value proposition; acquired R&D expenses
will decrease earnings until their financial benefits can be recorded.
Quality of Disclosure
Lilly believes in providing adequate disclosure of its accounting quality and
financial statements to assess its firms’ business strategy, economics conditions
and to provide it shareholder’s, potential investors and analysis with the highest
quality of information. Lilly’s goal is provide accurate information in a user
friendly way to potential investors so they are able to make a viable decision
when investing. Lilly’s annual reports are detailed, printed in a multi-language
selection, and simple, identifying all major issues from the condition of it’s
industry to financial performance, and ending with management’s plans for the
future.
Lilly explains deviations with footnotes that inform the potential investors,
stakeholders, and analysts with detailed explanations.
At the beginning of each year Lilly’s annual report states it coming
products and release dates of its future products. The products that Lilly produce
gives Lilly the reputation it deserves. With the success and failure of these
products Lilly is proud to provide the current performance in its prospective
analysis, financial analysis and accounting analysis which gives the viewers a
thorough and in depth position of Lilly’s financial performance, their standpoint in
the pharmaceutical industry, and how they plan on improving.
19

Lilly’s management discloses all information to the public pertaining to
their performance, whether it is negative, or beneficial to the firm. Lilly reveals
the cause of the failure and explains in detail the strategy to solve the problem.
Lilly’s investors’ relation program addresses all major issues regarding the
potential investor. The company provides facts books with detailed data on the
firm’s business and performance. Lilly does a meticulous job finding questionable
accounting behavior and explaining the situation in a comprehensible way. Below
is an instance of the procedure Lilly practices to justifies itself from questionable
activities.
Figure 3.4
Potential Red Flags and Accounting Distortions
Lilly’s financial statements appear to be on par with its competitors. Ratio
Analysis of the companies financial statements show no unreasonable differences
20

from year to year. Research and development costs for Lilly are on par with its
competitors and are properly capitalized once the benefits from the R&D are
realized. Otherwise the costs are expensed. There are no obvious reasons to
capitalize additional R&D expenses in order further adjust Lilly’s net income.
Lilly occasionally adjusts its pension costs and costs of healthcare to
represent recent trends. Recent actions by Lilly to account for the increased cost
of healthcare and pension expense shows no further need for adjustment. Lilly
appears to be taking the proper initiative to adjust its accounting methods to
recognize the increasing costs of healthcare.
Inventory valuation methods for Lilly appear to be a fairly conservative
and more proper method for valuing inventory in the pharmaceutical industry.
Lilly uses the LIFO approach for valuing its US inventory. This is a more
conservative method of valuing inventory so there appears to be no worry of
possible of Lilly trying to increase net income by overvaluing inventory.
There appears to be no compelling needs to adjust Lilly’s income
statements for any possible accounting missteps. Lilly’s financials seem to be a
very accurate representation of the company’s actual performance and appears
to be on the same level as that of its rivals.
Quantitative Measures and Indicators:
Quantitative Measures and Indicators are relevant in the examination and
analysis of the past performance of Lilly. Sales manipulation diagnostics shows
the behavior between sales relative to cash from sales, accounts receivable, and
also inventory. The core expense manipulation diagnostics shows earnings
21

relative to expenses. At this point we should know if Lilly has been engaging in
any suspicious accounting.
Sales Manipulation Diagnostics
1999 2000 2001 2002 2003Net sales / Cash from sales 1.02 1.02 0.99 1.03 1.02Net sales / Net Accts. Receivable 6.93 6.66 8.21 6.63 6.78Net sales / Inventory 11.12 12.3 10.89 7.41 6.41 Note: There is insufficient information available on Lilly’s statement to determine any value for Warranty Liabilities. Net sales over cash from sales are at a steady rate after disregarding the outlier of 2001. This shows that there is very little change is purchasing with cash or how fast they collect their accounts receivable. Next we have net sales over net accounts receivable also remains fairly constant around the 6.75 range. This shows that our accounts receivable are not changing very much but this ratio is consistent with the first ratio. Net sales over inventory was on the rise but then took a fall which is good because we decreasing our inventories. These Diagnostics have produced favorable results since we are a pharmaceutical company.
Core Expense Manipulation Diagnostics
1999 2000 2001 2002 2003Asset Turnover 1.42 1.37 1.66 1.42 1.44Changes in CFFO / OI 0.97 0.83 1.09 1.11 1.14Changes in CFFO / NOA 0.61 0.84 0.53 0.22 0.34
Declining asset turnover fluctuates but it stays around 1.5 which is very
good because it is stable which means we are not declining. An increase in the
asset turnover is good but holding stable is ok as long as we do not decline. The
changes in cash flow from operation over operating income are slowly
increasing. This could be caused because our operating income is increasing.
22

Ratio Analysis and Forecast Financials
The rationale for this report is to perform a financial ratio analysis on Lilly
as well as to forecast the company’s financial statements for the next ten years.
From the information collected in the ratio analysis we will be able to benchmark
individual competitors and compute an entire industry average. By finding the
industry average we will be able to compare the performance of Lilly with the
rest of the pharmaceutical industry.
Ratio analysis is significant because it allows us to analyze and compare
Lilly’s ratios and financials to other companies within the industry. By performing
ratio analysis, we will be able to focus in depth on the strengths and weaknesses
of Lilly. Investors and shareholders find this ratio analysis information very
important because it allows them to create insider information.
23

Financial Ratio Analysis
Current Ratio
Industry Pfizer Lilly Merck
1999 2.17 1.37 1.79 3.71 2000 2.31 1.43 1.60 3.78 2001 1.91 1.35 1.33 2.70 2002 1.33 1.34 1.54 1.16 2003 1.76 1.26 1.58 1.20
Current Ratios
00.5
11.5
22.5
33.5
4
1999 2000 2001 2002 2003
Year
Valu
es
PfizerIndustryMerckEli Lilly
From the past five years Pfizer, Lilly and Merck all have declining current ratios, thus making the industry average follow a similar step. The lower the level of current ratio; the less liquid a company is.
24
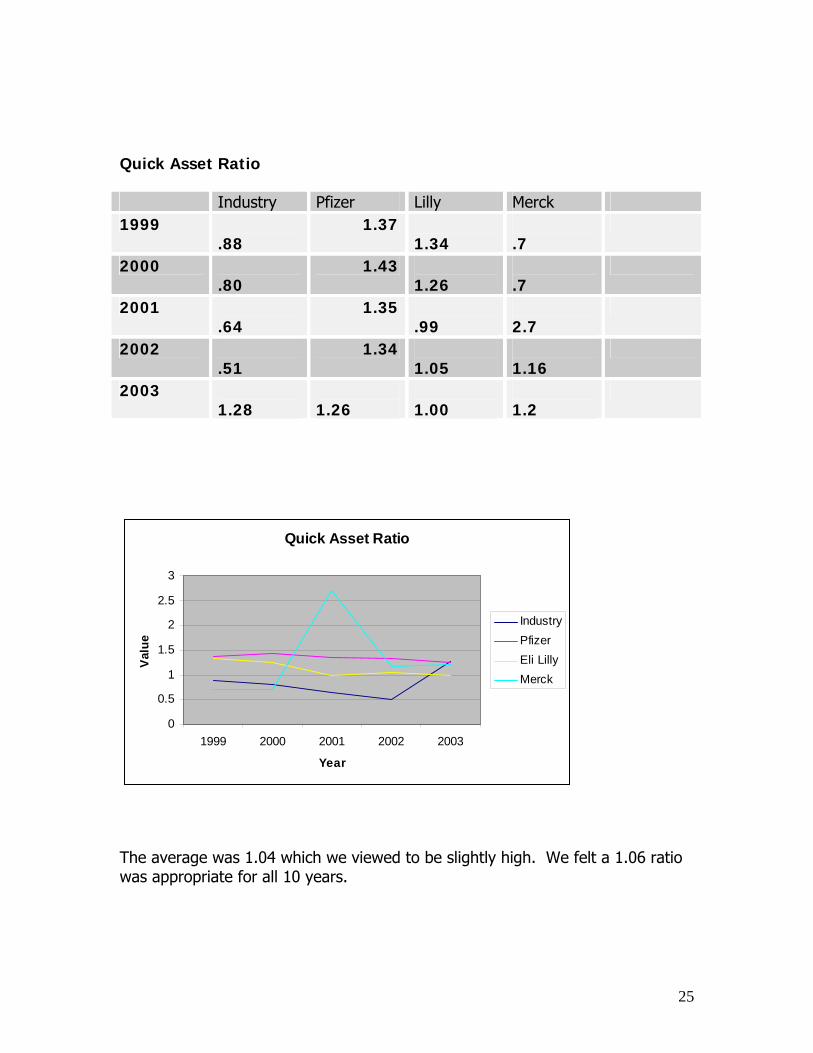
Quick Asset Ratio Industry Pfizer Lilly Merck 1999
.88 1.37
1.34 .7
2000 .80
1.43 1.26
.7
2001 .64
1.35 .99
2.7
2002 .51
1.34 1.05
1.16
2003 1.28
1.26
1.00
1.2
Quick Asset Ratio
0
0.5
1
1.5
2
2.5
3
1999 2000 2001 2002 2003
Year
Val
ue
IndustryPfizerEli LillyMerck
The average was 1.04 which we viewed to be slightly high. We felt a 1.06 ratio was appropriate for all 10 years.
25

Inventory Turnover
Industry Pfizer Lilly Merck
1999 3.26 2.15 2.33 5.8 2000 2.78 1.85 2.33 7.43 2001 4.60 1.39 2.04 1.01 2002 2.43 1.51 1.46 1.32 2003 1.58 1.68 1.36 1.69
Inventory Turnover
012345678
1999 200 2001 2002 2003
Year
Val
ue
IndustryPfizerEli LillyMerck
Inventory turnover tends to increase and decrease from year to year, giving the industry a notion that companies tend to be efficient with an increase in turnover ratio and inefficient when the inventory ratio decreases.
26

Accounts Receivable Turnover
Industry Pfizer Lilly Merck
1999 6.00 5.06 6.93 6.52 2000 4.88 5.35 6.66 7.67 2001 5.78 5.44 8.21 4.06 2002 11.38 5.59 6.63 3.95 2003 6.03 5.15 6.78 5.59
Accounts Receivable Turnover
0
2
4
6
8
10
12
1999 2000 2001 2002 2003
Year
Val
ue
IndustryPfizerEli LillyMerck
Once again an average was used here, but we excluded one outlier in the low 8 range.
27

Profitability Analysis Gross Profit Margin
Industry Pfizer Lilly Merck 1999 62.74 79.47 79.03 46.00 2000 63.47 82.94 81.07 44.00 2001 84.92 86.83 81.28 83.00 2002 84.76 87.51 80.35 82.00 2003 74.39 78.24 78.74 81.00
Gross Profit Margin
0
20
40
60
80
100
1999 2000 2001 2002 2003
Year
Per
cent
IndustryPfizerEli LillyMerck
Gross profit margin in 2004 is above the industry and out of the past five years, has been above the industry three out of five times.
28

Operating Profit Margin
Industry Pfizer Lilly Merck 1999 60.67% 54.00% 32.75% 74.00% 2000 57.48% 64.44% 32.77 % 76.00% 2001 45.59% 52.76% 29.61% 53.00% 2002 53.55% 51.44 % 29.28% 55.00% 2003 67.80% 63.03% 24.79% 60.00%
The average here was 29%; we felt this was too high due to a decreasing trend in Lilly’s financials, also observable in the industry averages. Net Profit Margin
Industry Pfizer Lilly Merck 1999 18.30% 18.30 % 27.20% 18.00 2000 18.56% 12.67% 28.15 17.00 2001 26.14% 26.83% 24.08 34.00 2002 26.50% 28.19% 24.45 33.00 2003 19.17% 8.65 20.35 30.00
Net Profit Margin
05
10152025303540
1999 2000 2001 2002 2003
Year
Per
cent
IndustryPfizerEli LillyMerck
The average was 25%, but we lowered it to 23% after viewing another downward trend.
29

Asset Turnover
Industry Pfizer Lilly Merck 1999 .87 .87 .78 .82 2000 .71 .88 .74 1.01 2001 1.21 .74 .70 .48 2002 3.61 .7 .58 .45 2003 .65 .39 .58 .55
Asset Turnover
00.5
11.5
22.5
33.5
4
1999 200 2001 2002 2003
Year
Val
ue
IndustryPfizerEli LillyMerck
We fell that the asset turnover was not improving but was following the others in the industry.
30

Return on Assets
Industry Pfizer Lilly Merck
1999 15.95% 15.85% 21.22% 15.00% 2000 11.40% 11.10% 20.81% 17.00% 2001 26.63% 19.89% 16.92% 17.00% 2002 70.43% 19.69% 14.22% 15.00% 2003 12.36% 3.35% 11.81% 17.00 %
Return On Assets
01020304050607080
1999 2000 2001 2002 2003
Year
Per
cent
IndustryPfizerEli LillyMerck
The average was 17%; a sharp 5 year downward trend caused us to change it to 13%.
31

Return on Equity
Industry Pfizer Lilly Merck 1999 36.21% 35.64% 54.28 40.00 2000 26.64% 23.13% 50.57 46.00 2001 58.19% 42.57% 39.13 45.00 2002 154.01% 45.74% 32.73 39.00 2003 24.85% 5.98% 26.22 44.00
Return On Equity
020406080
100120140160180
1999 2000 2001 2002 2003
Year
Per
cent
IndustryPfizerEli LillyMerck
Outliers of 1999 and 2000 were removed, and the subsequent average was used.
32

Debt to Equity Ratio
Industry Pfizer Lilly Merck 1999 1.4 1.24 1.43 1.04 2000 1.06 1.08 1.31 1.04 2001 1.08 1.14 1.30 1.02 2002 1.42 1.32 1.22 1.61 2003 .32 .79 1.80 1.61
Debt to Equity
0
0.5
1
1.5
2
1999 2000 2001 2002 2003
Year
Val
ue
IndustryPfizerEli LillyMerck
The debt to equity was fairly constant around 1.35% which is low but could use some improvement.
33

Times Interest Earned
Industry Pfizer Lilly Merck 1999 977.66% 18.27% 17.83% 2873.17 2000 33.92% 11.35% 19.53% 28.15 2001 33.45% 27.73% 17.83% 64.18 2002 70.08% 29.86% 40.70% 47.71 2003 12.58% 20.47% 51.14% -110.93
Times Interest
-500
0
500
1000
1500
2000
2500
3000
3500
1999 2000 2001 2002 2003
Year
Val
ue
IndustryPfizerEli LillyMerck
We excluded the 2000 and 2001 outliers.
34

Sustainable Growth Rate
Industry Pfizer Lilly Merck 1999 19.38% 22.59% 34.32% 19.47 2000 12.06% 9.46% 31.95% 21.56 2001 30.30% 27.73% 22.14% 21.05 2002 77.08% 29.86% 16.58% 18.28 2003 12.58% -.66% 11.45% 20.63
Sustainable Growth Rate
-100
102030405060708090
1999 2000 2001 2002 2003Year
Per
cent
IndustryPfizerEli LillyMerck
Sales Growth Change
Industry Pfizer Lilly Merck
1999 8.06% 8.06% N/A 2000 -1.13% -1.13% 8.59% 2001 11.54% 11.54% 6.26% 2002 39.59% 39.59% -4.03% 2003 27.00% N/A 13.59%
35

Financial Statement Forecasting Methodology
Forecasting is a very complex process, but can be obtained by using
selected forecasting methods for the income statement, balance sheet, and
statement of cash flow. The forecasting is not just a guess but is ratios used to
come up with what our company will do in the future. To help with the
forecasting we are going to use the past five years of financial statements from
Lilly as well as some of our competitors and an industry average of ratios
excluding Lilly.
Quarterly methodology
The numbers that we have come up with for 2004 were much easier to
obtain than 2005 and following. In our 2004 forecasting we have the company’s
quarterly reports for the first three quarters. With these we came up with an
average to forecast the fourth quarter and then the yearly statements. This
forecast should be very accurate because we had three of the four quarters and
it is much easier to forecast in the short-run rather than in the long run were
economic conditions could affect your forecasting.
Income statement
Based upon the trend analysis and the benchmark ratios, there are many
assumptions that we will be using to come up with the forecasting of Lilly’s
future performance. In the construction of our future forecasting financial
statements we used the following ratios. Over the past five years, the current
ratio average for Lilly was 1.49. In the next ten years of forecasting we will keep
this as a steady, average of about 1.5. The current ratio is one of the very most
important ratios for a firm because it is a measurement of there liquidity. For
36

example for every dollar in current liabilities Lilly has a dollar and fifty cents in
current assets. The current ratio is also used in the valuation of firms across the
industry. Debt to equity ratios is also very important because it measures the
total liabilities over total equity of Lilly. When coming up with our ratio we did an
average of the past five years which gave us 1.30 which we used for the ten
year forecasting. We have also chosen to calculate our sales growth rate from
an average of the sales rates from the past four years excluding the 2002 outlier.
We came up with a sales growth rate of 9.5% for the upcoming four years
(Table 2). After the four years, we then chose to decrease our sales growth rate
to 8% because it was not possible to keep growing at a constant 9.5%.
Table 1 (Dollars in millions)
2000 2001 2002 2003 2004
Sales 10,862.2 11,542.5 11,077.5 12,582.5 13,618.1 Average
Growth
Rate
6.62% -4.03% 13.59% 5.23% 9.5%
The sustainable growth rate (SGR) is another ratio that is vital to the forecasting.
We have computed the SGR by coming up with return on equity (ROE) and
putting it into the SGR formula, [SGR= ROE * (1- Dividend Payout Ratio)] which
gives us the result in (Table 2).
Table 2
2000 2001 2002 2003 2004
ROE .5057 .3913 .3273 .2622 .2334
Dividend
Payout
.3682 .4342 .4933 .5635 .4651
SGR 31.95% 22.14% 16.58% 11.45% 12.49%
37
Coming up with a SGR average for the forecast is somewhat difficult with
our SGR ranging from 11.45 to 31.95 per year so we have taken an average of
four years excluding 2001 which was an outlier of 31.95%. We have chosen to
use the SGR average of 15.67% for the future 10 years because we find that the
use of our outlier would not be realistic.
From these ratios and moving averages, we feel that was have forecasted
the next ten years with accuracy if there is not any economic disruptions. When
forecasting we have taken into consideration what our competitors are doing as
well as the industry average of all the ratios. We have provided or forecasting
statements at the end of this section for further review.
Balance Sheet We have forecasted the balance sheet the same way that we forecasted
the income statements. We used moving averages and weighted averages to
come up with our ten year forecasting’s. We have used the asset turnover ratio
to come up with future forecasts of asset. We then used the Pro-Forma balance
sheet and came up with our moving averages, which we then used to come up
with our forecasts for the rest of our balance sheet items. When looking at the
balance sheet total current assets were forecasted for the next ten years by
using the asset turnover ratio. Our current assets will continue to increase
steadily as long as we are in business. We also looked at our total not current
assets which will increase with the increase in property plant and equipment and
sundry.
When forecasting out our balance sheet we were very careful not to make
any errors because a small error in the short run could make a dramatic effect in
the long run or at the end of our forecasts. By using the moving averages we
feel that we have accurately forecasted our balance sheet out not only for the
38
short run but also the long run. At the end of the section we have provided a
forecasted balance sheet for further review.
Statement of Cash Flow
When forecasting our statement of cash flow, we had no problems coming
up with an accurate forecast because we have already forecasted our balance
sheet and income statements. If we come up with any forecasting errors in the
statement of cash flow they would come from miscalculations from our balance
sheets and income statements. When forecasting there were no apparent trends
in the line items on the statement of cash flow. We have provided or forecasting
statements at the end of this section for further review.
Limitations, Strengths, and Weaknesses
Most of our forecasts were done using averages from the previous 5 years
of financial statements. Items that were handled differently will be discussed
below. Our forecasts are limited because we only have past data and cannot
predict future economic and corporate conditions. Our forecasts are more
accurate because we could compare 5 years of Lilly’s ratios with 5 years of
industry averages.
39

Ratio Analysis and Financials
The purpose of assessing our company is to help in the valuation and future
decision making of Eli Lilly & Company. Employees in the human resource
department to employees in the research and development department use
valuations to guide their decisions. Valuations are necessary to price such things
as stock prices, initial public offerings, and even estimates of the firm’s equity.
Valuations
There six different methods used to value a company such as Eli Lilly, which
include the following: method of comparables, discounted dividend, discounted
free cash flows, discounted residual income, abnormal earnings growth, and long
run average residual income perpetuity based on the P/B ratio. All of these
intrinsic valuation methods will help us identify whether the share price is
undervalued, overvalued, or reasonably valued. Valuing the price of the firm is
important to shareholders as well as potential shareholder so they are able to
determine if the company is worth what they are paying for it. If a company is
overvalued then it is a good time to sell shares as well as vice versa, when it is
undervalued it is a good time to buy shares. This is important to the company as
well because they may be willing to buy back shares when the price is low.
However, as you will see, valuing the firm is a complex process that has many
variables affecting its outcome. The market may reflect many variables that are
unable to be accurately predicted and it is therefore unlikely that the market can
beat on a short-term basis.
40

Cost of Equity
Eli Lilly has an estimated cost of equity of 6.399%. This figure was generated by
using a risk free rate of 3.21%, which is the rate on the seven year treasury
bonds. The beta used was calculated using a data regression for the previous
sixty months, which is approximately 0.912. The market t risk premium was
estimated to be 3.50%.
Cost of Debt
Eli Lilly’s cost of debt is estimated to be 3.52%; this figure was calculated
using a weighted average of short and long term debt. The short term debt
represents 54.45% of the total debt at a cost of 2.70% interest. Long term debt
is 45.55% of total debt at an estimated cost of 4.85%. Eli Lilly’s long term debt
is represented by a weighted average of their bond maturities, note maturities,
and other items considered as long-term debt. We used the average rate of
5.640% to calculate the weighted average portion of short-term notes. We also
used the average rate of 5.815% to calculate the long-term notes portion of
long-term debt. We used the variable interest rates of bonds to calculate the
weighted average portion of bonds on long-term debt.
Weighted Average Cost of Capital
Eli Lilly’s Weighted Average Cost of Capital (WACC) is estimated to be
7.81%, in making these calculations it was determined that Lilly is comprised of
9.36% debt and 90.64 % equity. Eli Lilly has a very low debt to equity ratio,
which frees it from having to worry much about debt covenants and interest
41

payments. The downside to having such a small amount of is that Lilly loses the
tax benefit of the interest paid on it debt. WACC was calculated by taking a
weighted average of Lilly’s total equity and after tax debt, and dividing each by
the total value of the company. Equity was estimated at $61.526 billion, this
figure was reached by multiplying the current share price of $51.19 by the 1.13
billion outstanding shares. Debt was the total book value of debt from the
balance sheet, or $6.353 billion. Lilly’s weighted average tax rate is 38.5%,
which was calculated on the recent year 10K annual report.
For Eli Lilly, each component of the equation is computed below:
• Vd = book value of debt = $6,353,400,000
• Ve = (Price per share) * (shares outstanding) = (51.19)*(1,132,884,801) = $61,526,973,542
• Vf = V
d +V
e
• Kd = weighted average cost of long term debt: 3.50%
• Tax = average tax rate from income statement = 38.5%
From this equation we can estimate the WACC if we have a cost of equity, and vice versa
WACC = (6,353,400,000/67,880,373,542) * (.035) * (1−.385) +
(61,526,973,542/67,880,373,542) * (.06399)
WACC after tax= 7.81% WACC before tax = 6.13%
42

Method of Comparables EPS BPS DPS PPS SPS PEG Lilly 1.66 9.65 1.52 54.31 12.73 1.91Merck 2.61 7.83 1.52 33.33 10.30 3.40Pfizer 1.49 9.11 0.76 17.84 6.91 1.68Abbott Labs 2.02 9.18 1.10 47.86 12.53 1.72
Forward P/E Ratio
Current Price EPS(1 year forward) Forward P/E**
Lilly 54.31 3.09* 17.58 Merck 33.33 2.40 13.89 Pfizer 17.84 2.20 8.11 Abbott Labs 47.86 2.74 17.47 Average 13.15 Value $40.65***
* From our forecast financial statements. ** Calculated by Current Price/EPS (1 year forward) *** Calculated by Avg. Forward P/E (excluding Lilly)*EPS Lilly Forward PEG Ratio
Forward P/E 5 Year Earnings Growth
Forward PEG**
Lilly 17.58 10* 1.76
Merck 13.89 5 2.78 Pfizer 8.11 8 1.01
Abbott Labs 17.47 11 1.59 Average 1.79
Value $55.40***
* From finance.yahoo.com ** Calculated by Forward (P/E)/5 year growth *** Calculated by Avg. Forward PEG (excluding Lilly)*Current Price*5 year growth M/B Ratio
43

Price Book Value M/B
Lilly 54.31 9.65 5.63 Merck 33.33 7.83 4.26
Pfizer 17.84 9.11 1.96*
Abbott Labs 47.86 9.18 5.21
Average 4.74
Value $45.69**
* Excluded from M/B average ** Calculated by Avg. M/B (excluding Lilly)*BPS (Lilly) D/P Ratio
Dividend Price D/P Lilly 1.52 54.31 0.03 Merck 1.52 33.33 0.05 Pfizer 0.76 17.84 0.04 Abbott Labs 1.10 47.86 0.02 Average 0.04 Value $41.01*
* Calculated by D/P Lilly/Avg. D/P (excluding Lilly) P/S Ratio
Price Sales P/S Lilly 54.31 12.73 4.27 Merck 33.33 10.30 3.24 Pfizer 17.84 6.91 2.58 Abbott Labs 47.86 12.53 3.82 Average 3.21 Value $40.89*
* Calculated by Avg. SPS (excluding Lilly)*SPS (Lilly)
44

The method of comparables valuation method takes different indicator values
and uses them to directly compare us with our competitors. In this case we
have taken three major competitors of Eli Lilly and used these indicators to track
our share price. After looking at all the different methods of comparison, the
Forward PEG ratio seems to be the closest indicator of the current share price of
Lilly. The average forward PEG ratio is very close to that of Lilly. Lilly has the
second highest forward PEG ratio of its competitors. Lilly’s current share price of
$51.19 is very close to the calculated price of $55.40. Lilly also has the second
highest growth rate among its competitors and the highest current share value
which may indicate that Lilly’s current share price is fair given its high growth
rate.
The M/B ratio is the second closest indicator of Lilly’s current share price.
The calculated price of $45.69 is fairly close to Lilly’s current price of $51.19.
Lilly has the highest M/B ratio of the three competitors with Pfizer’s M/B ratio
being excluded from the average because it was unusually low compared to the
other three.
The D/P, P/S, and forward P/E ratios all show a similar share price which
is much lower than Lilly’s current observed share price. The D/P ratio shows a
much lower share price due to the fact that Lilly’s current share price is higher
than that of its competitors. The P/S ratio shows a lower share price because
Lilly’s SPS is higher than its competitors. The forward P/E ratio also shows a
much lower share price because Pfizer’s forward P/E is very low, which brings
the average down. Pfizer could have been excluded from the average, but the
difference in share price would not have better explained Lilly’s current share
price than the Forward PEG ratio does.
45

Discounted Residual Income Model
In our residual income model, we analyzed the residual incomes for the
next ten years, including our terminal values, and we discounted them back to
the present value of 2004. We started by finding the book value of equity per
share, then added in our earnings per share, and subtracted out dividends
distributed by Lilly. We came up with earnings per share by taking net income
and dividing it by the number of shares that we have outstanding. To compute
our dividends per share we took total dividends distributed and divided them by
the number of shares outstanding at that time. By doing this we come up with
the ending book value of equity which we used for the beginning equity of the
next year. From there we went to our normal income which is just our Ke
multiplied by the beginning book value of equity of the previous year. The
residual income is the difference of earnings per share minus normal income.
Our perpetuity and residual income are then discounted back to present value in
2004 and giving us and estimated share price of $47.24 with no growth rate.
We then took some other Ke rates as well as growth rates and put them into the
sensitivity analysis to see if we could come up with anything better.
When looking at our sensitivity analysis, we have used a variety of growth
rates and cost of equity rates to come up with a closer number to match the
reported closing price. We have used growth rates that are fairly low around .02
to .06 because we know that our company is going to grow but a larger growth
rate would cause conflicting numbers to appear. The number would not work
properly because our Ke is low to begin with so it would put our growth rate
higher above the Ke. On the other hand when we were working with our Ke we
tried to stay fairly close to .066 because we feel that is a very reasonable Ke.
46

Sensitivity Analysis g 0 0.02 0.04 0.06
Ke 0.02 $85.87 N/A ($61.79) (24.88) 0.026 $68.89 $247.42 ($84.13) (25.62) 0.046 $49.92 $69.11 $216.30 (57.04) 0.066 $47.24 $53.49 $69.38 $191.17 0.086 $48.50 $51.28 $56.48 $69.67
Residual Income Conclusions
After looking at this model we feel that there are certain conclusions that can be
made. We found that our model does not work properly with our sensitivity
analysis. Our Ke is ok but only if we have very low growth rates, so if we were
to up our Ke then we could come up with some better, more accurate results.
This model also is dependent on our forecasted calculations of earnings per
share and dividends per share. If these numbers were forecasted incorrectly by
a small error, then our whole model would be thrown off causing inaccurate
results. With these facts this model has its drawbacks because of the
inaccuracy. Even though these errors are possible we have came up with Lilly to
be slightly overvalued but not by much. We know these numbers are estimated
but we feel very comfortable with our results of Lilly be overvalued.
47

Discounted Free Cash Flow
Discounted free cash flow analysis yields a price of $48.29, $2.90 less than the
actual share price of $51.19. After sensitivity analysis we were able to come
closer to actual PPS by using a WACC of 4.13% and 4% as the growth rate,
yielding $57.10.
Sensitivity Analysis g 0 0.02 0.04 0.06
0.0013 $78.77
0.0213 $66.90
0.0413 $57.10
0.0613 $48.29
0.0813 $41.95
Discounted Dividends Discounted dividends produced a share value of $33.13, significantly less than
the actual price, and further than the free cash flows model. Sensitivity analysis
revealed that a share price of $55.88 can be achieved using 8.59% for Ke and a
6% growth rate. This is $4.69 away from the actual price of $51.19 per share.
Sensitivity Analysis g 0 0.02 0.04 0.06
Ke 0.0059 $405.77 0.0259 $340.95 0.0459 $287.56 0.0659 $33.13 $42.14 $65.06 0.0859 $36.49 $55.88
48

Our models appear to perform well and are relatively consistent. Some prove to
be more accurate than others, but the consensus was that Eli Lilly is over valued
as a firm. The recent share price we used was $51.19. Every model that we used
to estimate firm value and share price came in under this number.
Our valuations are relatively limited because of the forecasted material that we
used. In our Discounted Free Cash Flow analysis we had to use changed in PP&E
to signify cash flows from investing activities, as this was not listed on the Eli Lilly
balance sheets.
Our forecasts greatly affected these valuations and in some cases yielded
numbers that were obvious outliers. Although there can be volatility and
potential mistakes in our forecasts, the models produce an overall view of the
firm that is consistent.
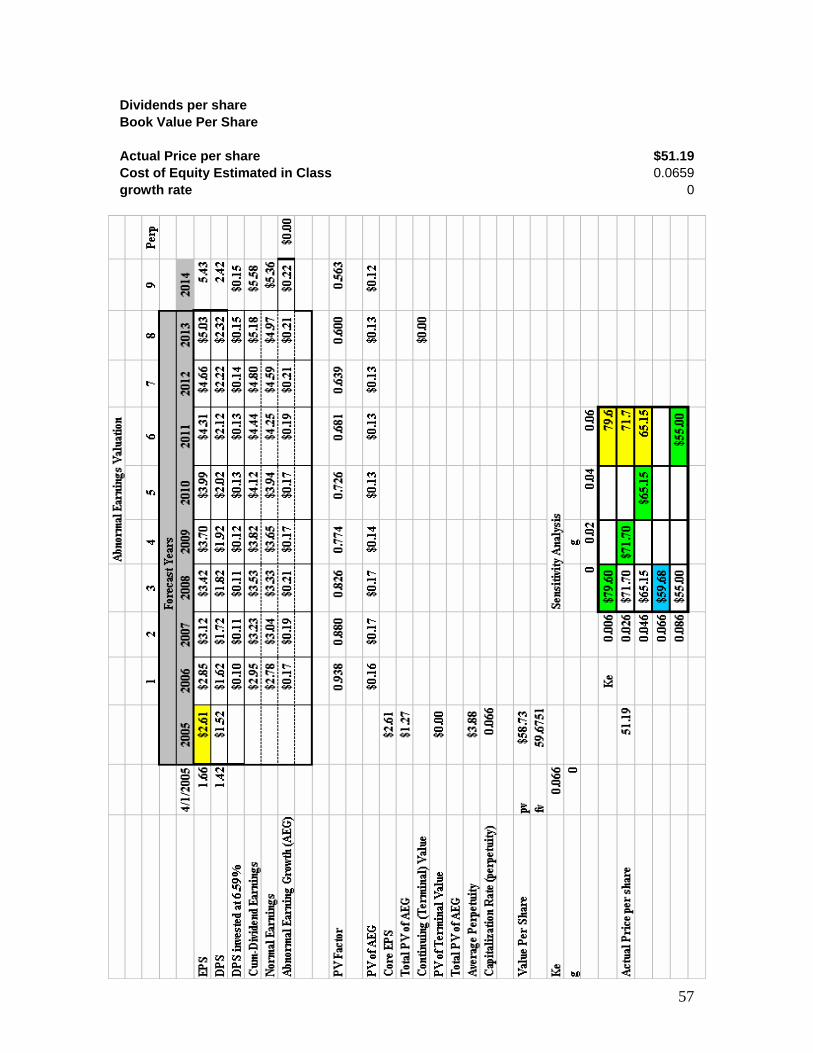
Abnormal Earning Growth Valuation
The abnormal earnings growth model is a model that takes into account the
present value of the investment opportunities of the dividends paid to
shareholders. Abnormal earnings consist of expected net income subtracted by
the normalized income multiplied by the discount rate. This method implies that
if a company has no difference between its expected net income and normalized
earnings, then the amount invested in the stock should be no more than the
book value.
Our estimation of the abnormal earnings was low due to the difference between
our cumulative dividend earnings and our normal earnings, which suggest that
we have a low abnormal stock performance. Using our own cost of equity and no
growth rate, we estimated the value per share to be $59.00 compared to the
current value of $54 dollars. This would mean that our company would comprise
49

a higher cost of equity to in order to meet the actual value. As a result from this
model we can conclude that the company’s stock is undervalued.
Since our estimated value per share was higher than the current value, we
utilized the sensitivity analysis to see what cost of equity would yield a closer
share price to the actual share price of $54. Shown below is a cost of equity of
8.6 which would be able to yield a share price close to the actual. A cost of
equity of 9.0 would yield the closest value to actual price.
Sensitivity Analysis
g0 0.02 0.04 0.06
0.006 $79.60 79.60.026 $71.70 $71.70 71.70.046 $65.15 $65.15 65.150.066 $59.680.086 $55.00 $55.00
Z-Score Altman’s Z – score = 1.2(Working Capital/Total Assets) + 1.4(Retained Earnings/Total Assets) + 3.3(EBIT/Total Assets) + 0.6(Market Value Equity/Book Value Liabilities) + 1.0(Sales/Total Assets)
= 1.2(5,242.1/24,867) + 1.4(9,724.6/24,867) + 3.3(2,663.5/24,867) + 0.6(61,527/13,947.1) + 1.0(13,857.9/24,867)
= 4.3575 After using Altman’s Method for calculating the Z-Score for Eli Lilly, we
found that Lilly has a Z-Score of 4.3575. The model states that a value > 1.9 means that the company is in good shape and is a lower credit risk; we feel that they are represented pretty accurately by this model. Eli Lilly’s current debt rating is “AA”. The moderately high performance rating is due to the positive numbers in all the variables of the equation and the high market value of equity compared to the lower book value of liabilities. Eli Lilly’s moderately high z-score should give them the ability to borrow at a lower interest rate or cost.
50

References
1. Yahoo Finance (www.finance.yahoo.com) 2. AARP Statistic (www.aarp.org) 3. Figure 3.2, 3.3 Graphs (www.phrma.org) 4. Figure 3.4 (www.lilly.com) 5. AME (news.yahoo.com) 6. Eli Lilly and Company 10-Q (www.investor.lilly.com/edgarscan) 7. Photos (www.lilly.com) 8. Price Waterhouse Coopers Edgar Online http://edgarscan.pwcglobal.com 9. Yahoo Finance, LLY” http://finance.yahoo.com/q?s=lly “Cialis Impotence Drug
Returns to Super Bowl.” 2005 10. “Eli Lilly and Company Responds to BMJ Apology and Retraction.”
2005.http://newsroom.lilly.com/ReleaseDetail.cfm?ReleaseID=153934 11. “Eli Lilly: losing the war in antipsychotic.” 2005
http://www.commentwire.com/commwire_story.asp?commentwire_ID=6311 12. “Gorman, Brian. 2005 “Pfizer’s Troubling Trust
”http://www.fool.com/news/mft/2005/mft05020220.htm 13. “Lilly Announces Dividend Increase.” 2004.
http://biz.yahoo.com/prnews/ 14. “Lilly Eli & CO 10-K 2003-12-31” 2003.
http://edgarscan.pwcglobal.com/servlets/RunQuery?goal=wf_next_region&accession=0000...
15. “Lilly withdraws Cymbalta incontinence application.” 2005. http://uk.biz.yahoo.com/050131/241/fbh9d.html
16. “New drugs treat Lilly to a jump in revenue.” 2005.http://www.fortwayne.com/mld/journalgazette/business/10747843.htm
17. Wilson, Charles. 2005. “Eli Lilly Suffers $2.4M 4th-Quarter Loss.” http://news.yahoo.com/news?tmpl=story&cid=509&u=/ap/20050126/ap_on_bi_ge/earns_l...
51

Appendix
Date Firm's Return
SP500 Return
Monthly Yield Risk Free
Market Risk
Premium Beta Estimate R-Squared
Average Risk Free Rate
Yahoo Published
Beta Feb-00 Mar-00 0.0580 0.0967 0.00522 0.09150 0.91 0.24 0.03 0.37 Apr-00 0.2314 -0.0308 0.00558 -0.03637 May-00 -0.0130 -0.0219 0.00525 -0.02716 Jun-00 0.3154 0.0239 0.00515 0.01878 Estimated Ke 6.40% Jul-00 0.0401 -0.0163 0.00505 -0.02139 Aug-00 -0.2970 0.0607 0.00494 0.05576 Find an implied Ke 5.79% Sep-00 0.1145 -0.0535 0.00482 -0.05830 Oct-00 0.1017 -0.0049 0.00475 -0.00970 Estimated Cost of Debt 3.44% Nov-00 0.0483 -0.0801 0.00431 -0.08438 Dec-00 -0.0039 0.0041 0.00405 0.00000 short horizon 1-Jan -0.1532 0.0346 0.00408 0.03056 1.2158 Estimated Ke 1-Feb 0.0084 -0.0923 0.00387 -0.09616 R^2 21.208% 1-Mar -0.0317 -0.0642 0.00397 -0.06817 1-Apr 0.1088 0.0768 0.00411 0.07271 Historical Risk Premium 1-May -0.0035 0.0051 0.00401 0.00108 1-Jun -0.1230 -0.0250 0.00397 -0.02897 0.04 1-Jul 0.0714 -0.0108 0.00381 -0.01458 1-Aug -0.0208 -0.0641 0.00343 -0.06754 Ke 1-Sep 0.0432 -0.0817 0.00326 -0.08498 5yr beta 0.356 0.0287 4.45% 1-Oct -0.0520 0.0174 0.00331 0.01405 3yr beta 0.911 0.2413 6.40% 1-Nov 0.0807 0.0760 0.00366 0.07230 2yr beta 1.165 0.1770 7.285% 1-Dec -0.0466 0.0076 0.00362 0.00396 2-Jan -0.0438 -0.0156 0.00358 -0.01916 2-Feb 0.0084 -0.0208 0.00395 -0.02472 2-Mar 0.0103 0.0367 0.00388 0.03286 2-Apr -0.1322 -0.0617 0.00374 -0.06540 2-May -0.0204 -0.0088 0.00349 -0.01232 2-Jun -0.1235 -0.0725 0.00318 -0.07564 2-Jul 0.0358 -0.0790 0.00274 -0.08174 2-Aug -0.0063 0.0049 0.00245 0.00243 2-Sep -0.0413 -0.1100 0.00246 -0.11247 2-Oct 0.0029 0.0864 0.00254 0.08391
52

2-Nov 0.2306 0.0571 0.00253 0.05453 2-Dec -0.0657 -0.0603 0.00254 -0.06287 3-Jan -0.0513 -0.0274 0.00242 -0.02983 3-Feb -0.0611 -0.0170 0.00232 -0.01932 3-Mar 0.0164 0.0084 0.00244 0.00592 3-Apr 0.1167 0.0810 0.00210 0.07894 3-May -0.0635 0.0509 0.00189 0.04901 3-Jun 0.1595 0.0113 0.00239 0.00894 3-Jul -0.0454 0.0162 0.00281 0.01340 3-Aug 0.0105 0.0179 0.00265 0.01522 3-Sep -0.1021 -0.0119 0.00266 -0.01460 3-Oct 0.1252 0.0550 0.00274 0.05222 3-Nov 0.0327 0.0071 0.00273 0.00440 3-Dec 0.0271 0.0508 0.00260 0.04817 4-Jan -0.0326 0.0173 0.00256 0.01472 4-Feb 0.0867 0.0122 0.00233 0.00988 4-Mar -0.0904 -0.0164 0.00283 -0.01918 4-Apr 0.1033 -0.0168 0.00321 -0.02000 4-May -0.0019 0.0121 0.00328 0.00881 4-Jun -0.0462 0.0180 0.00308 0.01491 4-Jul -0.0885 -0.0343 0.00289 -0.03718 4-Aug -0.0042 0.0023 0.00280 -0.00051 4-Sep -0.0480 0.0094 0.00279 0.00657 4-Oct -0.0856 0.0140 0.00294 0.01107 4-Nov -0.0288 0.0386 0.00300 0.03559 4-Dec 0.0708 0.0325 0.00309 0.02937 5-Jan -0.0442 -0.0253 0.00314 -0.02843 5-Feb 0.0324 0.0189
53

Residual Income
54

Free Cash Flows Cash Flow from Operations
Cash Provided (Used) by Investing Activities
Free Cash Flow (to firm)
discount rate (6.13% WACC) PV Factor Present Value of Free Cash Flows Total PV of Annual Cash Flows $48,671,550,106.91 PV (Terminal) Value $12,387,989,917.67 Value of the Firm $61,059,540,024.59 Book Value of Debt $6,353,400,000.00 Value of Equity $54,706,140,024.59 Estimated Value per Share $48.29 Actual Price Per Share $51.19 Growth 0 WACC 0.0613
Shares Outstanding 1,132,884,801
Ke 6.59%
Weight of Debt 0.104052536
Weight of Equity 0.895947464
Cost of Debt 0.035
Cost of Equity Tax Rate 0.615 Debt 0.002239731
Equity .89028556 *
Ke
55
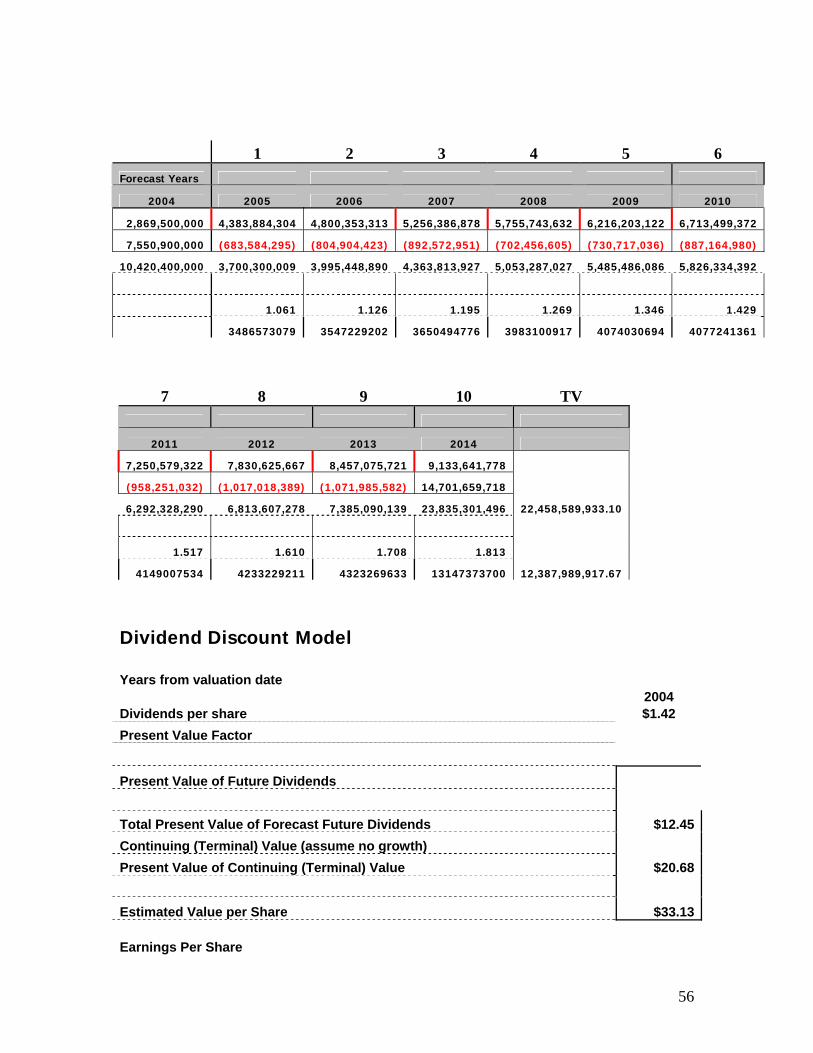
1 2 3 4 5 6 Forecast Years
2004 2005 2006 2007 2008 2009 2010
2,869,500,000 4,383,884,304 4,800,353,313 5,256,386,878 5,755,743,632 6,216,203,122 6,713,499,372
7,550,900,000 (683,584,295) (804,904,423) (892,572,951) (702,456,605) (730,717,036) (887,164,980)
10,420,400,000 3,700,300,009 3,995,448,890 4,363,813,927 5,053,287,027 5,485,486,086 5,826,334,392
1.061 1.126 1.195 1.269 1.346 1.429
3486573079 3547229202 3650494776 3983100917 4074030694 4077241361
7 8 9 10 TV
2011 2012 2013 2014
7,250,579,322 7,830,625,667 8,457,075,721 9,133,641,778
(958,251,032) (1,017,018,389) (1,071,985,582) 14,701,659,718
6,292,328,290 6,813,607,278 7,385,090,139 23,835,301,496 22,458,589,933.10
1.517 1.610 1.708 1.813
4149007534 4233229211 4323269633 13147373700 12,387,989,917.67
Dividend Discount Model Years from valuation date 2004 Dividends per share $1.42 Present Value Factor
Present Value of Future Dividends Total Present Value of Forecast Future Dividends $12.45 Continuing (Terminal) Value (assume no growth) Present Value of Continuing (Terminal) Value $20.68 Estimated Value per Share $33.13 Earnings Per Share
56
57
Dividends per share Book Value Per Share Actual Price per share $51.19 Cost of Equity Estimated in Class 0.0659growth rate 0

58
(Dollars in millions) Actual Forecast
2000 2001 2002 2003 2004 2005 2006 2007 2008 2009 2010 2011 2012 2013 2014
Net sales $10,862.20 $11,542.50 $11,077.50 $12,582.50 $13,857.90
Average Growth=
9.5% yrs 1-4, 8.0% yrs
5-10 $15,174.40 $16,615.97 $18,194.48 $19,922.96 $21,516.80 $23,238.14 $25,097.19 $27,104.97 $29,273.37 $31,615.24
Cost of sales $2,055.70 $2,160.20 $2,176.50 $2,675.10 $3,223.90 Gross Profit -
Sales $3,019.70 $3,306.58 $3,620.70 $3,964.67 $4,281.84 $4,624.39 $4,994.34 $5,393.89 $5,825.40 $6,291.43
Gross Profit $8,806.50 $9,382.30 $8,901.00 $9,907.40 $10,634.00
Average Gross Profit
Margin =80.1% $12,154.70 $13,309.39 $14,573.78 $15,958.29 $17,234.96 $18,613.75 $20,102.85 $21,711.08 $23,447.97 $25,323.80
Research and development $2,018.50 $2,235.10 $2,149.30 $2,350.20 $2,691.10
5 year moving average $2,896.70 $3,188.72 $3,485.34 $3,806.62 $4,129.59 $4,449.41 $4,808.26 $5,191.18 $5,606.25 $6,057.58
Marketing and administrative $3,228.30 $3,417.40 $3,424.00 $4,055.40 $4,284.20
5 year moving average $4,654.98 $5,128.98 $5,662.11 $6,208.39 $6,659.08 $7,193.34 $7,782.78 $8,413.15 $9,081.47 $9,799.20
Acquired in-process R & D $0.00 $190.50 $84.00 $0.00 $392.20
5 year moving average $158.99 $208.92 $214.46 $251.58 $326.05 $291.03 $324.58 $352.50 $387.83 $422.79
Other Special Charges $0.00 $121.40 $0.00 $382.20 $603.00
5 year moving average $256.16 $336.60 $404.02 $530.88 $557.30 $520.03 $589.22 $653.82 $717.34 $761.19
Total Operating Expenses $5,246.80 $5,964.40 $5,657.30 $6,787.80 $7,970.50
Gross Profit - Operating
Income $8,057.61 $8,823.08 $9,661.27 $10,579.09 $11,425.43 $12,339.45 $13,326.61 $14,392.74 $15,544.16 $16,787.69
Operating Income $3,559.70 $3,417.90 $3,243.70 $3,119.60 $2,663.50
Operating Profit
=27.0% $4,097.09 $4,486.31 $4,912.51 $5,379.20 $5,809.53 $6,274.30 $6,776.24 $7,318.34 $7,903.81 $8,536.11
Interest expense $182.30 $191.70 $79.70 $61.00 $51.60
5 year moving average $149.19 $140.26 $123.86 $134.09 $152.92 $180.87 $185.06 $194.08 $211.68 $231.78
Other income-net ($481.30) ($280.70) ($293.70) ($203.10) ($330.00)
5 year moving average ($410.00) ($391.49) ($425.93) ($454.02) ($518.95) ($561.89) ($592.58) ($640.26) ($692.72) ($753.67)
0 0 0 0 0 0 0 0 0 0 0 0 0 0 0
Income before income taxes $3,858.70 $3,506.90 $3,457.70 $3,261.70 $2,941.90
Average Income
tax/sales = 30.0% $4,552.32 $4,984.79 $5,458.34 $5,976.89 $6,455.04 $5,971.44 $7,529.16 $8,131.49 $8,782.01 $9,484.57
Income taxes $800.90 $726.90 $749.80 $700.90 $1,131.80
5 year moving average $1,037.23 $1,117.90 $1,239.76 $1,359.34 $1,521.98 $1,592.91 $1,721.31 $1,866.10 $2,019.54 $2,185.90
Net income $3,057.80 $2,780.00 $2,707.90 $2,560.80 $1,810.10
Net Profit Margin =
23.0% $3,490.11 $3,821.67 $4,184.73 $4,582.28 $4,948.86 $5,344.77 $5,772.35 $6,234.14 $6,732.87 $7,271.50
Earnings per share-basic 2.83 2.58 2.51 2.38 1.67 2.61 2.85 3.12 3.42 3.7 3.99 4.31 4.66 5.03 5.43
Earnings per share-diluted 2.79 2.55 2.5 2.37 1.66

ELI LILLY & CO. 10-K Pro-Forma (% of Sales) Income Statement
2000 2001 2002 2003 2004 2005 2006 2007 2008 2009 2010 2011 2012 2013 2014Net sales 100.00% 100.00% 100.00% 100.00% 100.00% 5 year moving average 100.00% 100.00% 100.00% 100.00% 100.00% 100.00% 100.00% 100.00% 100.00% 100.00%Cost of sales 18.93% 18.72% 19.65% 21.26% 23.26% 5 year moving average 20.36% 20.65% 21.04% 21.31% 21.33% 20.94% 20.94% 21.03% 21.10% 21.11%Gross Profit 81.07% 81.28% 80.35% 78.74% 76.74% 5 year moving average 79.64% 79.35% 78.96% 78.69% 78.67% 79.06% 79.06% 78.97% 78.90% 78.89%Research and development 18.58% 19.36% 19.40% 18.68% 19.44% 5 year moving average 19.09% 19.20% 19.16% 19.11% 19.20% 19.15% 19.17% 19.16% 19.16% 19.17%Marketing and administrative 29.72% 29.61% 30.91% 32.23% 30.92% 5 year moving average 30.68% 30.87% 31.12% 31.16% 30.95% 30.95% 31.01% 31.04% 31.02% 31.00%Acquired in-process research and development 0.00% 1.65% 0.76% 0.00% 2.83% 5 year moving average 1.05% 1.26% 1.18% 1.26% 1.52% 1.25% 1.29% 1.30% 1.32% 1.34%Asset impairments, restructuring, and other special charges 0.00% 1.05% 0.00% 3.04% 4.35% 5 year moving average 1.69% 2.03% 2.22% 2.66% 2.59% 2.24% 2.35% 2.41% 2.45% 2.41%Total Operating Expenses 48.30% 51.67% 51.07% 53.95% 57.52% 5 year moving average 52.50% 53.34% 53.68% 54.20% 54.25% 53.59% 53.81% 53.90% 53.95% 53.90%Operating Income 32.77% 29.61% 29.28% 24.79% 19.22% 5 year moving average 27.14% 26.01% 25.29% 24.49% 24.43% 25.47% 25.14% 24.96% 24.90% 24.98%Interest expense 1.68% 1.66% 0.72% 0.48% 0.37% 5 year moving average 0.98% 0.84% 0.68% 0.67% 0.71% 0.78% 0.74% 0.72% 0.72% 0.73%Other income-net -4.43% -2.43% -2.65% -1.61% -2.38% 5 year moving average -2.70% -2.36% -2.34% -2.28% -2.41% -2.42% -2.36% -2.36% -2.37% -2.38%
Income before income taxes 35.52% 30.38% 31.21% 25.92% 21.23% 5 year moving average 28.85% 27.52% 26.95% 26.09% 26.13% 27.11% 26.76% 26.61% 26.54% 26.63%
Income taxes 7.37% 6.30% 6.77% 5.57% 8.17% 5 year moving average 6.84% 6.73% 6.81% 6.82% 7.07% 6.85% 6.86% 6.88% 6.90% 6.91%Net income 28.15% 24.08% 24.45% 20.35% 13.06% 5 year moving average 22.02% 20.79% 20.13% 19.27% 19.06% 20.25% 19.90% 19.72% 19.64% 19.72%
ELI LILLY & CO. 10-K Pro-Forma (Line Item Change Relative to Sales Change) Income Statement
2000 2001 2002 2003 2004Net sales 1.00 1.00 1.00 1.00 Cost of sales 0.15 (0.04)
1.04 0.33 0.43
Gross Profit 0.85 0.67 0.57 Research and development 0.32 0.18 0.13 0.27 Marketing and administrative 0.28 0.42 0.18 (0.01)Acquired in-process research and development 0.28 0.31 0.23 (0.06)Asset impairments, restructuring, and other special charges 0.18 0.26 0.17 Total Operatin
0.25g Expenses 1.05 0.66 0.75 0.93
Operating Income 0.37 Interest expense 0.24 Other income-net 0.29 0.03
0.00 0.00 0.00 Income before income taxes 0.11 Income taxes Net income
(0.21) (0.08) (0.36)0.01 (0.01) (0.01)
0.06 (0.10)0.00
(0.52) (0.13) (0.25)(0.11) (0.05) (0.03) 0.34(0.41) 0.16 (0.10) (0.59)
59

60
ELI LILLY & CO. 10-K Balance SheetForecasts
2000 2001 2002 2003 2004 2005 2006 2007 2008 2009 2010 2011 2012 2013 2014
AssetsCurrent AssetsCash and cash equivalents $4,114,900,000 $2,702,300,000 $1,945,900,000 $2,756,300,000 $5,365,300,000 $3,670,332,094 $3,939,558,681 $4,654,456,426 $5,365,573,001 $5,401,277,091 $5,886,533,465 $6,459,217,035 $6,986,465,858 $7,460,782,143 $8,087,993,873Short-term investments $503,300,000 $1,028,700,000 $1,708,800,000 $957,000,000 $2,099,100,000 $1,518,174,584 $1,814,165,409 $2,022,260,288 $2,089,676,635 $2,406,671,966 $2,496,315,717 $2,733,038,320 $2,950,142,469 $3,172,655,964 $3,448,551,290
Accounts receivable, net of allowances $1,630,700,000 $1,406,200,000 $1,670,300,000 $1,854,700,000 $2,058,700,000 $2,057,139,520 $2,252,567,775 $2,465,642,587 $2,685,068,649 $2,895,436,386 $3,141,739,702 $3,391,227,186 $3,660,125,567 $3,950,121,239 $4,267,183,827Other receivables $335,400,000 $289,000,000 $403,900,000 $477,600,000 $494,300,000 $498,761,876 $534,943,651 $601,342,287 $656,009,452 $699,697,362 $760,165,884 $820,192,869 $888,443,493 $957,921,133 $1,033,264,877Inventories $883,100,000 $1,060,200,000 $1,495,400,000 $1,963,000,000 $2,291,600,000 $1,858,805,283 $2,125,382,332 $2,420,128,146 $2,683,355,244 $2,859,090,681 $3,025,542,208 $3,306,240,893 $3,591,477,844 $3,875,799,556 $4,171,406,718
Deferred income taxes $269,500,000 $223,300,000 $331,700,000 $500,600,000 $255,300,000 $398,440,509 $426,783,572 $482,311,259 $523,583,720 $520,826,355 $599,252,181 $644,833,347 $696,465,000 $747,419,149 $802,482,905Prepaid expenses $206,100,000 $229,200,000 $248,100,000 $249,500,000 $271,500,000 $305,570,460 $327,516,869 $349,801,162 $377,232,971 $410,276,936 $451,174,148 $483,644,080 $519,949,677 $561,294,766 $607,713,754 Total current assets $7,943,000,000 $6,938,900,000 $7,804,100,000 $8,758,700,000 $12,835,800,000 $9,995,835,250 $10,945,439,599 $11,985,256,361 $13,123,855,715 $14,173,764,172 $15,307,665,306 $16,532,278,530 $17,854,860,813 $19,283,249,678 $20,825,909,652Other AssetsPrepaid retirement $1,032,500,000 $1,102,800,000 $1,515,400,000 $1,613,300,000 $2,253,800,000 $1,840,309,551 $2,047,435,051 $2,302,732,967 $2,522,455,032 $2,760,753,838 $2,909,311,626 $3,161,724,139 $3,429,614,592 $3,703,800,536 $3,999,561,671Investments $395,700,000 $2,710,900,000 $3,150,400,000 $3,374,600,000 $561,400,000 $3,062,852,351 $3,104,620,318 $3,054,931,942 $2,950,731,733 $3,790,723,751 $3,944,860,732 $4,153,237,036 $4,469,109,926 $4,949,400,154 $5,289,235,998Sundry $1,143,000,000 $1,149,100,000 $1,279,100,000 $1,392,500,000 $1,665,100,000 $1,615,530,601 $1,750,219,195 $1,910,624,316 $2,107,326,516 $2,273,156,768 $2,450,254,001 $2,646,948,677 $2,861,799,539 $3,089,340,874 $3,335,606,914
$2,571,200,000 $4,962,800,000 $5,944,900,000 $6,380,400,000 $4,480,300,000 $6,518,692,503 $6,902,274,564 $7,268,289,226 $7,580,513,281 $8,824,634,358 $9,304,426,359 $9,961,909,853 $10,760,524,056 $11,742,541,564 $12,624,404,583Property and Equipment $4,176,600,000 $4,532,400,000 $5,293,000,000 $6,539,000,000 $7,550,900,000 $6,953,004,425 $7,636,588,721 $8,441,493,144 $9,334,066,094 $10,036,522,700 $10,767,239,736 $11,654,404,716 $12,612,655,748 $13,629,674,137 $14,701,659,718Total non-current assets $6,747,800,000 $9,495,200,000 $11,237,900,000 $12,919,400,000 $12,031,200,000 $14,090,514,750 $15,429,113,651 $16,894,879,448 $18,499,892,996 $19,979,884,435 $21,578,275,190 $23,304,537,205 $25,168,900,182 $27,182,412,196 $29,357,005,172Total Assets $14,690,800,000 $16,434,100,000 $19,042,000,000 $21,678,100,000 $24,867,000,000 $24,086,350,000 $26,374,553,250 $28,880,135,809 $31,623,748,711 $34,153,648,607 $36,885,940,496 $39,836,815,736 $43,023,760,995 $46,465,661,874 $50,182,914,824
Liabilities and Shareholders' Equity
Current Liabilities
Short-term borrowings $184,300,000 $286,300,000 $545,400,000 $196,500,000 $2,020,600,000 $683,746,170 $837,980,964 $1,005,824,625 $1,149,444,680 $1,429,111,945 $1,277,568,897 $1,429,557,452 $1,579,313,447 $1,723,133,114 $1,868,375,666Accounts payable $661,900,000 $624,100,000 $676,900,000 $875,900,000 $648,600,000 $845,154,025 $893,389,311 $966,209,322 $1,055,869,329 $1,098,422,800 $1,239,125,713 $1,326,344,058 $1,427,471,800 $1,539,093,865 $1,659,559,264Employee compensation $468,300,000 $381,900,000 $231,700,000 $387,400,000 $471,600,000 $473,804,499 $468,948,497 $489,099,709 $569,518,241 $618,685,042 $667,715,753 $708,632,985 $765,392,937 $834,565,349 $900,845,917Dividends payable $315,400,000 $341,000,000 $375,800,000 $398,300,000 $414,400,000 $443,046,760 $478,693,241 $515,516,068 $558,730,071 $601,343,802 $661,506,400 $710,759,809 $764,970,059 $825,516,968 $892,543,110
Income taxes payable $2,200,200,000 $2,319,500,000 $1,761,900,000 $1,749,800,000 $1,703,900,000 $2,423,455,788 $2,462,622,746 $2,463,942,741 $2,681,304,624 $2,935,619,565 $3,320,056,821 $3,501,154,855 $3,734,060,961 $4,046,488,491 $4,393,270,392Other liabilities $1,130,600,000 $1,250,200,000 $1,471,800,000 $1,942,700,000 $2,334,600,000 $1,827,490,083 $2,130,808,166 $2,360,943,919 $2,643,059,549 $2,804,004,960 $2,969,233,416 $3,268,790,858 $3,527,146,912 $3,812,859,004 $4,097,852,931 Total current liabilities $4,960,700,000 $5,203,000,000 $5,063,500,000 $5,550,600,000 $7,593,700,000 $6,708,614,262 $7,345,932,617 $8,043,796,215 $8,807,956,856 $9,512,593,404 $10,273,600,876 $11,095,488,947 $11,983,128,062 $12,941,778,307 $13,977,120,572Other LiabilitiesLong-term debt $2,633,700,000 $3,132,100,000 $4,358,200,000 $4,687,800,000 $4,491,900,000 $4,559,600,660 $5,127,302,990 $5,694,894,416 $6,106,998,981 $6,469,722,294 $7,107,482,606 $7,703,057,551 $8,310,369,449 $8,937,719,456 $9,645,076,441
Deferred income taxes $91,600,000 $620,400,000Retiree medical benefit obligation $83,300,000 Other noncurrent liabilities $874,600,000 $995,000,000 $1,346,700,000 $1,674,900,000 $1,241,100,000 $1,456,608,715
$3,683,200,000 $4,127,100,000 $5,704,900,000 $6,362,700,000 $6,353,400,000 $6,016,209,375 $5,127,302,990 $5,694,894,416 $6,106,998,981 $6,469,722,294 $7,107,482,606 $7,703,057,551 $8,310,369,449 $8,937,719,456 $9,645,076,441Commitments and contingencies $0 $0 $0 $0 $0 $0 $0 $0 $0 $0 $0 $0 $0 $0 $0 Total non-current liabilities $3,683,200,000 $4,127,100,000 $5,704,900,000 $6,362,700,000 $6,353,400,000 $6,239,878,812 $6,832,667,300 $7,481,770,693 $8,192,538,909 $8,847,942,022 $9,555,777,383 $10,320,239,574 $11,145,858,740 $12,037,527,439 $13,000,529,634 Total Liabilities $8,643,900,000 $9,330,100,000 $10,768,400,000 $11,913,300,000 $13,947,100,000 $12,948,493,074 $14,178,599,916 $15,525,566,908 $17,000,495,765 $18,360,535,426 $19,829,378,260 $21,415,728,521 $23,128,986,802 $24,979,305,746 $26,977,650,206
Shareholders' Equity
Common stock - no par value Authorized shares: 3,200,000,000 Issued shares: 1,126,567,407 (2000) and 1,091,226,806 (1999) $704,400,000 $702,700,000 $702,100,000 $702,300,000 $708,000,000 $859,120,133 $885,611,167 $939,462,889 $1,032,795,845 $1,147,862,954 $1,220,699,917 $1,313,532,315 $1,423,380,842 $1,542,185,153 $1,660,303,140Additional paid-in capital $2,610,000,000 $2,610,000,000 $2,610,000,000 $2,610,000,000 $3,119,400,000 $3,575,353,021 $3,684,588,021 $3,896,974,783 $4,232,531,793 $4,672,692,744 $5,117,789,117 $5,449,987,504 $5,861,079,392 $6,341,979,245 $6,875,905,896Retained earnings $6,223,200,000 $7,411,200,000 $8,500,100,000 $9,470,400,000 $9,724,600,000 $10,635,704,667 $11,558,935,954 $12,506,286,321 $13,540,969,071 $14,600,323,736 $15,997,779,037 $17,215,007,787 $18,539,523,484 $20,002,913,994 $21,626,213,311
Employee benefit trust ($2,635,000,000) ($2,635,000,000) ($2,635,000,000) ($2,635,000,000) ($2,635,000,000) ($3,508,616,172) ($3,587,188,657) ($3,759,944,376) ($4,043,967,200) ($4,420,528,850) ($4,936,646,447) ($5,237,302,041) ($5,617,215,774) ($6,070,026,031) ($6,583,300,193)
($135,000,000) ($129,100,000) ($123,300,000) ($118,600,000) ($111,900,000) ($166,808,154) ($166,767,336) ($172,410,253) ($184,592,331) ($202,303,508) ($228,536,403) ($241,005,822) ($257,935,359) ($278,805,562) ($302,747,043)Deferred costs - ESOPAccumulated other comprehensive income (Note 14) $218,600,000
0 $7, $11,023,700,000
Less cost of common stock in treasury: 2000 - 1,007,235 shares 1999 - 988,902 shares $109,500,000 $1,074,000,000 $109,500,000 $104,200,000 $103,800,000 $138,087,707 $540,724,139 $262,497,382 $316,820,518 $374,327,588 $330,136,278 $502,247,346 $447,523,672 $487,634,196 $557,833,397Total Stockholder's equity $6,046,900,000 $7,104,000,000 $8,273,600,000 $9,764,800,000 $10,919,900,000 $10,721,119,624 $11,739,625,988 $12,854,890,457 $14,076,105,050 $15,202,193,454 $16,418,368,930 $17,731,838,444 $19,150,385,521 $20,682,416,363 $22,337,009,671Total Liabilities and Stockholder's equity $14,690,800,000 $16,434,100,000 $19,042,000,000 $21,678,100,000 $24,867,000,000 $23,669,612,698 $25,918,225,904 $28,380,457,365 $31,076,600,815 $33,562,728,880 $36,247,747,190 $39,147,566,965 $42,279,372,323 $45,661,722,109 $49,314,659,87
($611,200,000) ($748,400,000) ($670,800,000) ($160,100,000) ($608,702,227) ($562,514,466) ($468,293,783) ($387,087,903) ($451,816,030) ($651,287,793) ($642,720,427) ($649,444,173) ($690,990,741) ($772,672,030)$6,156,400,00 211,400,000 $8,383,100,000 $9,869,000,000
7

ELI LILLY 10-K Pro-Forma Balance Sheet
2000 2001 2002 2003 2004 2005 2006 2007 2008 2009 2010 2011 2012 2013 2014AssetsCurrent AssetsCash and cash equivalents 28.01% 16.44% 10.22% 12.71% 21.58% 15.24% 14.94% 16.12% 16.97% 15.81% 15.96% 16.21% 16.24% 16.06% 16.12%Short-term investments 3.43% 6.26% 8.97% 4.41% 8.44% 6.30% 6.88% 7.00% 6.61% 7.05% 6.77% 6.86% 6.86% 6.83% 6.87%Accounts receivable, net of allowances 11.10% 8.56% 8.77% 8.56% 8.28% 8.54% 8.54% 8.54% 8.49% 8.48% 8.52% 8.51% 8.51% 8.50% 8.50%Other receivables 2.28% 1.76% 2.12% 2.20% 1.99% 2.07% 2.03% 2.08% 2.07% 2.05% 2.06% 2.06% 2.07% 2.06% 2.06%Inventories 6.01% 6.45% 7.85% 9.06% 9.22% 7.72% 8.06% 8.38% 8.49% 8.37% 8.20% 8.30% 8.35% 8.34% 8.31%Deferred income taxes 1.83% 1.36% 1.74% 2.31% 1.03% 1.65% 1.62% 1.67% 1.66% 1.52% 1.62% 1.62% 1.62% 1.61% 1.60%Prepaid expenses 1.40% 1.39% 1.30% 1.15% 1.09% 1.27% 1.24% 1.21% 1.19% 1.20% 1.22% 1.21% 1.21% 1.21% 1.21% Total current assets 54.07% 42.22% 40.98% 40.40% 51.62% 45.86% 44.22% 44.62% 45.34% 46.33% 45.27% 45.16% 45.34% 45.49% 45.52%Other AssetsPrepaid retirement 7.03% 6.71% 7.96% 7.44% 9.06% 7.64% 7.76% 7.97% 7.98% 8.08% 7.89% 7.94% 7.97% 7.97% 7.97%Investments 2.69% 16.50% 16.54% 15.57% 2.26% 12.72% 11.77% 10.58% 9.33% 11.10% 10.69% 10.43% 10.39% 10.65% 10.54%Sundry 7.78% 6.99% 6.72% 6.42% 6.70% 6.71% 6.64% 6.62% 6.66% 6.66% 6.64% 6.64% 6.65% 6.65% 6.65%
Property and Equipment 28.43% 27.58% 27.80% 30.16% 30.37% 28.87% 28.95% 29.23% 29.52% 29.39% 29.19% 29.26% 29.32% 29.33% 29.30%Total non-current assets 45.93% 57.78% 59.02% 59.60% 48.38% 54.14% 55.78% 55.38% 54.66% 53.67% 54.73% 54.84% 54.66% 54.51% 54.48%Total Assets 100.00% 100.00% 100.00% 100.00% 100.00% 100.00% 100.00% 100.00% 100.00% 100.00% 100.00% 100.00% 100.00% 100.00% 100.00%Liabilities and Shareholders' EquityCurrent LiabilitiesShort-term borrowings 2.13% 3.07% 5.06% 1.65% 14.49% 5.28% 5.91% 6.48% 6.76% 7.78% 6.44% 6.68% 6.83% 6.90% 6.93%Accounts payable 7.66% 6.69% 6.29% 7.35% 4.65% 6.53% 6.30% 6.22% 6.21% 5.98% 6.25% 6.19% 6.17% 6.16% 6.15%Employee compensation 5.42% 4.09% 2.15% 3.25% 3.38% 3.66% 3.31% 3.15% 3.35% 3.37% 3.37% 3.31% 3.31% 3.34% 3.34%Dividends payable 3.65% 3.65% 3.49% 3.34% 2.97% 3.42% 3.38% 3.32% 3.29% 3.28% 3.34% 3.32% 3.31% 3.30% 3.31%Income taxes payable 25.45% 24.86% 16.36% 14.69% 12.22% 18.72% 17.37% 15.87% 15.77% 15.99% 16.74% 16.35% 16.14% 16.20% 16.28%Other liabilities 13.08% 13.40% 13.67% 16.31% 16.74% 14.11% 15.03% 15.21% 15.55% 15.27% 14.97% 15.26% 15.25% 15.26% 15.19% Total current liabilities 57.39% 55.77% 47.02% 46.59% 54.45% 52.24% 51.21% 50.30% 50.96% 51.83% 51.31% 51.12% 51.11% 51.27% 51.33%Other LiabilitiesLong-term debt 30.47% 33.57% 40.47% 39.35% 32.21% 35.21% 36.16% 36.68% 35.92% 35.24% 35.84% 35.97% 35.93% 35.78% 35.75%Deferred income taxes 1.06% 0.00% 0.00% 0.00% 4.45% 0.00% 0.00% 0.00% 0.00% 0.00% 0.00% 0.00% 0.00% 0.00% 0.00%Retiree medical benefit obligation 0.96% 0.00% 0.00% 0.00% 0.00% 0.19% 0.04% 0.05% 0.06% 0.07% 0.08% 0.06% 0.06% 0.06% 0.07%Other noncurrent liabilities 10.12% 10.66% 12.51% 14.06% 8.90% 11.25% 11.48% 11.64% 11.46% 10.95% 11.35% 11.38% 11.36% 11.30% 11.27%
Commitments and contingencies 0.00% 0.00% 0.00% 0.00% 0.00% 0.00% 0.00% 0.00% 0.00% 0.00% 0.00% 0.00% 0.00% 0.00% 0.00% Total non-current liabilities 42.61% 44.23% 52.98% 53.41% 45.55% 47.76% 48.79% 49.70% 49.04% 48.17% 48.69% 48.88% 48.89% 48.73% 48.67% Total Liabilities 100.00% 100.00% 100.00% 100.00% 100.00% 100.00% 100.00% 100.00% 100.00% 100.00% 100.00% 100.00% 100.00% 100.00% 100.00%Shareholders' Equity Common stock - no par value Authorized shares: 3,200,000,000 Issued shares: 1,126,567,407 (2000) and 1,091,226,806 (1999) 11.65% 9.89% 8.49% 7.19% 6.48% 8.01% 7.54% 7.31% 7.34% 7.55% 7.43% 7.41% 7.43% 7.46% 7.43%Additional paid-in capital 43.16% 36.74% 31.55% 26.73% 28.57% 33.35% 31.39% 30.32% 30.07% 30.74% 31.17% 30.74% 30.61% 30.66% 30.78%Retained earnings 102.92% 104.32% 102.74% 96.99% 89.05% 99.20% 98.46% 97.29% 96.20% 96.04% 97.44% 97.09% 96.81% 96.71% 96.82%Employee benefit trust -43.58% -37.09% -31.85% -26.98% -24.13% -32.73% -30.56% -29.25% -28.73% -29.08% -30.07% -29.54% -29.33% -29.35% -29.47%Deferred costs - ESOP -2.23% -1.82% -1.49% -1.21% -1.02% -1.56% -1.42% -1.34% -1.31% -1.33% -1.39% -1.36% -1.35% -1.35% -1.36%Accumulated other comprehensive income (Note 14) -10.11% -10.53% -8.11% -1.64% 2.00% -5.68% -4.79% -3.64% -2.75% -2.97% -3.97% -3.62% -3.39% -3.34% -3.46%
Less cost of common stock in treasury: 2000 - 1,007,235 shares 1999 - 988,902 shares -1.81% -15.12% -1.32% -1.07% -0.95% -1.29% -4.61% -2.04% -2.25% -2.46% -2.01% -2.83% -2.34% -2.36% -2.50%Total Stockholder's equity 100.00% 100.00% 100.00% 100.00% 100.00% 100.00% 100.00% 100.00% 100.00% 100.00% 100.00% 100.00% 100.00% 100.00% 100.00%Total Liabilities and Stockholder's equity
61

62
ELI LILLY & CO. Statement of Cash Flows
Forecasts
2000 2001 2002 2003 2004 2005 2006 2007 2008 2009 2010 2011 2012 2013 2014
Cash Flows From Operating ActivitiesNet income $3,057,800,000 $2,780,000,000 $2,707,900,000 $2,560,800,000 $1,810,100,000 $3,490,112,115 $3,821,672,766 $4,184,731,679 $4,582,281,188 $4,948,863,683 $5,344,772,778 $5,772,354,600 $6,234,142,968 $6,732,874,406 $7,271,504,358
Adjustments To Reconcile Net
Income to Cash Flows From
Operating Activities
Depreciation and amortization $435,800,000 $454,900,000 $493,000,000 $548,500,000 $597,500,000 $661,810,111 $768,542,244 $876,479,748 $985,728,657 $1,068,354,495 $1,089,384,727 $1,190,454,140 $1,303,393,125 $1,414,576,152 $1,527,198,750
Change in deferred taxes ($442,700,000)
($214,400,000)
$273,800,000 $346,500,000 $130,900,000 $772,400,000 $323,277,124 $581,969,937 $635,778,967 $726,972,265 $912,155,332 $742,235,065 $854,078,692 $980,064,124 $1,052,650,332 $1,144,542,329
Gain on sale of Kinetra $0 $0 $0 $0 $0 $0 $0 $0 $0 $0 $0 $0 $0 $0
(2000) and PCS (1999), net of
tax
Acquired in-process research and $0 $123,800,000 $54,600,000 $0 $381,700,000 $160,901,975 $220,234,578 $244,904,132 $311,550,197 $408,880,120 $307,649,780 $361,192,964 $404,375,355 $443,384,336 $488,077,341
development, net of tax Asset impairments, restructuring, and other special charges, net of tax $0 $78,900,000 $0 $261,700,000 $374,300,000 $202,808,066 $277,593,540 $336,407,380 $451,576,480 $465,322,465 $413,797,147 $466,071,160 $527,435,081 $580,544,267 $633,117,729
Other, net $117,300,000 $27,600,000 $10,800,000 $61,000,000 $171,500,000 $105,130,979 $106,939,552 $138,695,181 $179,449,470 $206,411,049 $174,252,507 $198,705,736 $217,694,198 $243,783,419 $265,869,686
$2,953,800,000 $3,739,000,000 $3,612,800,000 $3,562,900,000 $4,107,500,000
Changes in operating assets and liabilities
Receivables-(increase) decrease $167,500,000
Inventories-increase $9,800,000
Other assets-increase
Accounts payable and other $1,143,800,000 $20,400,000 $661,600,000 $337,097,546 $101,017,746 $204,331,352 $365,340,477 $146,958,921 $336,154,261 $324,719,859 $308,688,764 $373,540,687 $404,424,506
liabilities-increase (decrease)
$777,700,000 $83,800,000
Net Cash Provided by Operating $3,731,500,000 $3, $3,646,700,000 $2, $4,383,884,304 $4,800,353,313 $5,256,386,878 $5,755,743,632 $6,216,203,122 $6,713,499,372 $7,250,579,322 $7,830,625,667 $8,457,075,721 $9,133,641,778ActivitiesCash Flows From Investing
Activities
Purchase of property and equipment
Disposals of property and
equipment
Net change in short-term $774,000,000
investments
Proceeds from sales and maturities $803,100,000 $3,708,700,000 $4,777,900,000 $6,762,400,000 $14,849,300,000
of noncurrent investments
Purchase of noncurrent investments
Purchase of in-process research $0 $0
and development
Proceeds from sale of PCS $0 $0 $0 $0 $0
$0 $0 $0 $0
Other, net
Net Cash Used in InvestingActivitiesCash Flows From Financing
Activities
Dividends paid
Purchase of common stock and other $0
capital transactions
Issuances of common stock under $178,400,000 $109,500,000 $64,600,000 $103,100,000 $104,500,000
stock plans
Net change in short-term $102,000,000 $1,478,200,000
borrowings
Proceeds from issuance of $1,100,000 $901,300,000 $1,259,600,000 $830,000,000 $1,000,000,000
long-term debt
Repayments of long-term debt
Net Cash Used for Financing $203,700,000
ActivitiesEffect of exchange rate changes on $69,300,000 $73,500,000 $220,600,000
cash
Net increase (decrease) in cash $414,500,000 $810,400,000 $2,609,000,000
and cash equivalents
Cash and cash equivalents at $3,700,400,000 $4,114,900,000 $2,702,300,000 $1,945,900,000 $2,756,300,000
beginning of year
Cash and cash equivalents at end $4,114,900,000 $2,702,300,000 $1,945,900,000 $2,756,300,000 $5,365,300,000
of year
($165,400,000) ($321,100,000) ($195,100,000) ($240,800,000) ($204,360,470) ($227,604,737) ($370,672,005) ($340,987,500) ($387,023,488) ($375,606,633) ($414,808,970) ($462,608,243) ($516,186,505) ($536,580,711)
($184,200,000) ($285,100,000) ($170,800,000) ($111,600,000) ($193,123,231) ($267,425,172) ($284,533,287) ($273,527,205) ($300,012,744) ($338,051,403) ($362,063,385) ($400,896,585) ($423,202,605) ($451,697,403)
($210,500,000) ($81,100,000) ($667,400,000) ($211,900,000) ($765,200,000) ($527,566,831) ($655,783,493) ($847,083,339) ($847,435,257) ($1,067,016,545) ($948,852,370) ($1,068,722,068) ($1,187,096,974) ($1,300,309,447) ($1,386,877,143)
($268,500,000) ($120,400,000)
($77,400,000) ($1,542,100,000) ($123,800,000)
661,600,000 $2,070,700,000 869,500,000
($677,900,000) ($884,000,000) ($1,130,900,000) ($1,706,600,000) ($1,898,100,000)
$5,100,000 $31,600,000 $36,800,000 $61,200,000 $20,500,000
($337,700,000) ($520,300,000) ($651,800,000) ($111,900,000)
($714,700,000) ($5,931,100,000) ($5,190,300,000) ($7,005,300,000) ($11,967,700,000)
($159,600,000) ($84,000,000) ($29,900,000)
($71,700,000)
($134,400,000) ($210,100,000) ($232,100,000) ($217,200,000) ($468,200,000)
($1,056,500,000) ($3,964,800,000) ($2,474,400,000) ($1,331,500,000) ($684,800,000)
($1,126,000,000) ($1,207,200,000) ($1,335,800,000) ($1,443,000,000) ($1,539,800,000)
($1,052,800,000) ($545,700,000) ($385,200,000) ($281,100,000)
($203,000,000) ($18,000,000) ($247,300,000)
($27,200,000) ($408,600,000) ($7,200,000) ($540,000,000) ($839,200,000)
($2,229,500,000) ($1,048,700,000) ($422,000,000) ($1,578,300,000)
($31,000,000) ($60,700,000)
($1,412,600,000) ($756,400,000)

Eli Lilly Pro-forma Statement of Cash Flows (percentage of operating income)
Operating Income $3,559,700,000 $3,417,900,000 $3,243,700,000 $3,119,600,000 $2,663,500,000
2000 2001 2002 2003 2004
5 year moving avg 2005 2006 2007 2008 2009 2010 2011 2012 2013 2014
Cash Flows From Operating ActivitiesNet income 85.90% 81.34% 83.48% 82.09% 67.96%Adjustments To Reconcile NetIncome to Cash Flows FromOperating Activities Depreciation and amortization 12.24% 13.31% 15.20% 17.58% 22.43% 16.15% 17.13% 17.84% 18.32% 18.39% 17.36% 17.57% 17.81% 17.90% 17.89% Change in deferred taxes -12.44% 8.01% 10.68% 4.20% 29.00% 7.89% 12.97% 12.94% 13.51% 15.70% 11.83% 12.60% 13.39% 13.32% 13.41% Gain on sale of Kinetra -6.02% 0.00% 0.00% 0.00% 0.00% 0.00% 0.00% 0.00% 0.00% 0.00% 0.00% 0.00% 0.00% 0.00% 0.00% (2000) and PCS (1999), net of tax Acquired in-process research and 0.00% 3.62% 1.68% 0.00% 14.33% 3.93% 4.91% 4.99% 5.79% 7.04% 4.90% 5.33% 5.53% 5.61% 5.72% development, net of tax Asset impairments, restructuring, and other special charges, net of tax 0.00% 2.31% 0.00% 8.39% 14.05% 4.95% 6.19% 6.85% 8.39% 8.01% 6.60% 6.88% 7.21% 7.35% 7.42%Other, net 3.30% 0.81% 0.33% 1.96% 6.44% 2.57% 2.38% 2.82% 3.34% 3.55% 2.78% 2.93% 2.97% 3.08% 3.11%
Changes in operating assets and liabilities Receivables-(increase) decrease -4.65% 4.90% -9.90% -6.25% -9.04% -4.99% -5.07% -7.55% -6.34% -6.66% -5.99% -6.12% -6.32% -6.53% -6.29% Inventories-increase 0.28% -5.39% -8.79% -5.48% -4.19% -4.71% -5.96% -5.79% -5.08% -5.16% -5.39% -5.34% -5.48% -5.35% -5.29% Other assets-increase -5.91% -2.37% -20.58% -6.79% -28.73% -12.88% -14.62% -17.24% -15.75% -18.37% -15.12% -15.77% -16.22% -16.45% -16.25% Accounts payable and other 32.13% 0.60% -8.28% 21.21% -4.52% 8.23% 2.25% 4.16% 6.79% 2.53% 5.36% 4.79% 4.22% 4.73% 4.74% liabilities-increase (decrease)
Net Cash Provided by Operating 104.83% 107.13% 63.84% 116.90% 107.73% 100.08% 98.90% 97.14% 105.90% 100.96% 100.51% 100.60% 100.68% 101.02% 101.73%Activities
63
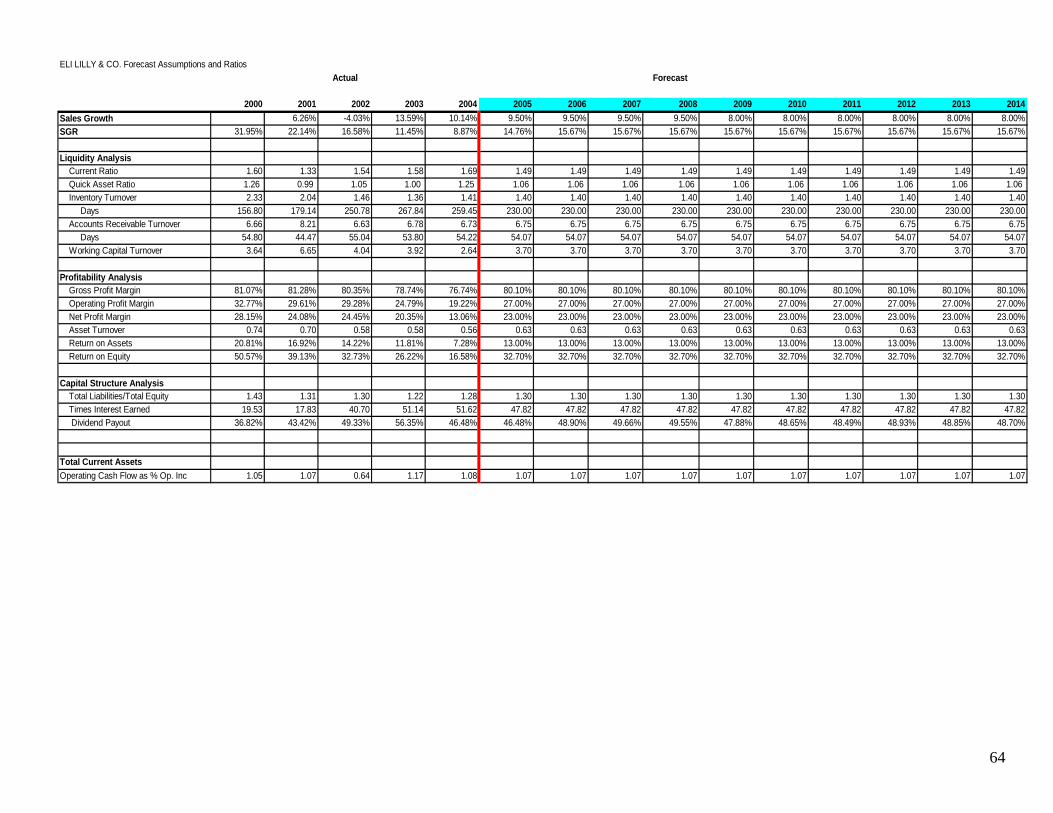
ELI LILLY & CO
2013 2014Sales Growth 8.00% 8.00%SGR .67% 15.67%
Liquidity AnalCurrent Ratio .49 1.49Quick Asset R 1.06 1.06Inventory Turn 1.40 1.40 Days 230.00 230.00Accounts Re 6.75 6.75 Days 54.07 54.07Working Capi 3.70 3.70
Profitability AnGross Profit .10% 80.10%Operating Pr .00% 27.00%Net Profit Ma .00% 23.00%Asset Turnov 0.63 0.63Return on As .00% 13.00%Return on Eq .70% 32.70%
Capital Structure ATotal Liabilitie 1.30 1.30Times Interes 47.82 47.82 Dividend Pa .85% 48.70%
Total Current Operating Cash 1.07 1.07
. Forecast Assumptions and RatiosActual Forecast
2000 2001 2002 2003 2004 2005 2006 2007 2008 2009 2010 2011 20126.26% -4.03% 13.59% 10.14% 9.50% 9.50% 9.50% 9.50% 8.00% 8.00% 8.00% 8.00%
31.95% 22.14% 16.58% 11.45% 8.87% 14.76% 15.67% 15.67% 15.67% 15.67% 15.67% 15.67% 15.67% 15
ysis1.60 1.33 1.54 1.58 1.69 1.49 1.49 1.49 1.49 1.49 1.49 1.49 1.49 1
atio 1.26 0.99 1.05 1.00 1.25 1.06 1.06 1.06 1.06 1.06 1.06 1.06 1.06over 2.33 2.04 1.46 1.36 1.41 1.40 1.40 1.40 1.40 1.40 1.40 1.40 1.40
156.80 179.14 250.78 267.84 259.45 230.00 230.00 230.00 230.00 230.00 230.00 230.00 230.00ceivable Turnover 6.66 8.21 6.63 6.78 6.73 6.75 6.75 6.75 6.75 6.75 6.75 6.75 6.75
54.80 44.47 55.04 53.80 54.22 54.07 54.07 54.07 54.07 54.07 54.07 54.07 54.07tal Turnover 3.64 6.65 4.04 3.92 2.64 3.70 3.70 3.70 3.70 3.70 3.70 3.70 3.70
alysisMargin 81.07% 81.28% 80.35% 78.74% 76.74% 80.10% 80.10% 80.10% 80.10% 80.10% 80.10% 80.10% 80.10% 80ofit Margin 32.77% 29.61% 29.28% 24.79% 19.22% 27.00% 27.00% 27.00% 27.00% 27.00% 27.00% 27.00% 27.00% 27rgin 28.15% 24.08% 24.45% 20.35% 13.06% 23.00% 23.00% 23.00% 23.00% 23.00% 23.00% 23.00% 23.00% 23er 0.74 0.70 0.58 0.58 0.56 0.63 0.63 0.63 0.63 0.63 0.63 0.63 0.63sets 20.81% 16.92% 14.22% 11.81% 7.28% 13.00% 13.00% 13.00% 13.00% 13.00% 13.00% 13.00% 13.00% 13uity 50.57% 39.13% 32.73% 26.22% 16.58% 32.70% 32.70% 32.70% 32.70% 32.70% 32.70% 32.70% 32.70% 32
nalysiss/Total Equity 1.43 1.31 1.30 1.22 1.28 1.30 1.30 1.30 1.30 1.30 1.30 1.30 1.30t Earned 19.53 17.83 40.70 51.14 51.62 47.82 47.82 47.82 47.82 47.82 47.82 47.82 47.82
yout 36.82% 43.42% 49.33% 56.35% 46.48% 46.48% 48.90% 49.66% 49.55% 47.88% 48.65% 48.49% 48.93% 48
Assets Flow as % Op. Inc 1.05 1.07 0.64 1.17 1.08 1.07 1.07 1.07 1.07 1.07 1.07 1.07 1.07
64

65
Marking Guideline for FIN 3321 Valuation Project
Group Mark Allocation Form Please submit this form with your final written report. You (your group) needs to complete allof the detail below. For the allocations to be accepted, it is necessary that all group members sign off in unanimous agreement. Also make sure that each signature is dated. Finally, as perthe instructions provided in lecture, verify that the group allocations sum to 100%. If yourgroup cannot come to agreement regarding the allocation then you will enter into binding arbitration based on my decision/ruling. Percent Grade Group Member Signature ID Number Date Allocation___ 1.____________________ _________ ____ _______
(Signature Here) ____________________ Printed Name Here 2.____________________ _________ ____ _______
(Signature Here) ____________________ Printed Name Here 3.____________________ _________ ____ _______
(Signature Here) ____________________ Printed Name Here 4.____________________ _________ ____ _______
(Signature Here) ____________________ Printed Name Here 5.____________________ _________ ____ _______
(Signature Here) ____________________ Printed Name Here TOTAL: 100%

66