elie canetti* advisor, western hemisphere department ... · elie canetti* advisor, western...
TRANSCRIPT
Elie Canetti*
Advisor, Western Hemisphere Department, International Monetary Fund
*This presentation represents the personal views of Elie Canetti, and should not be construed to represent the views of the IMF’s staff or Executive Board.
Elie Canetti*
Advisor, Western Hemisphere Department, International Monetary Fund
*This presentation represents the personal views of Elie Canetti, and should not be construed to represent the views of the IMF’s staff or Executive Board.
Why? Lessons About Risk from the Crisis
What? Types of Risk Monitoring/Assessment
How? The Institutional Set-Up
Words of Warning
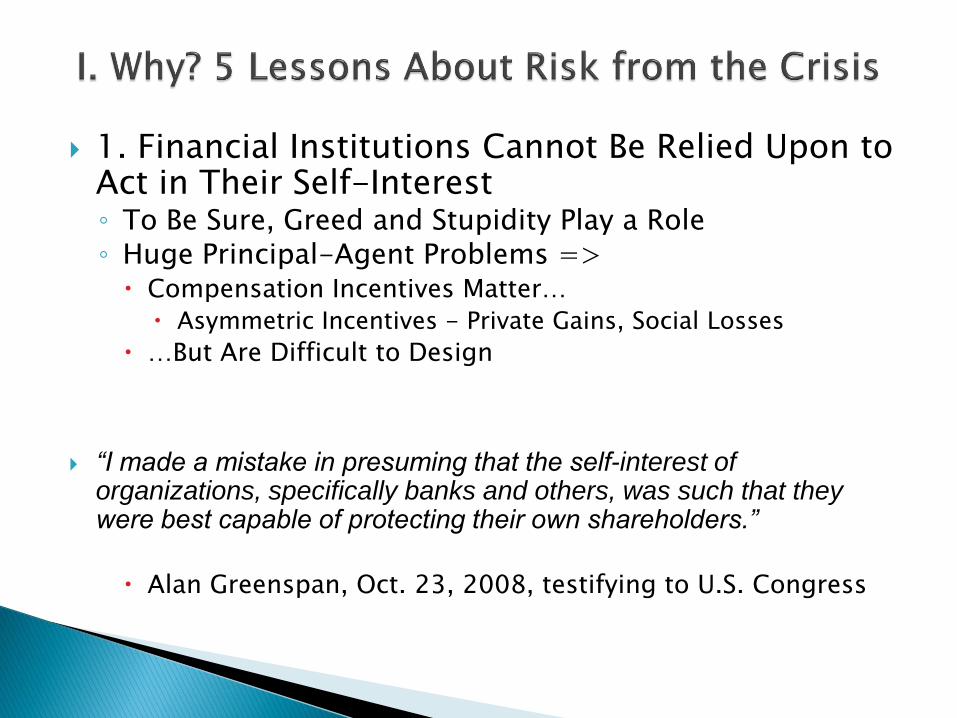
1. Financial Institutions Cannot Be Relied Upon to Act in Their Self-Interest◦ To Be Sure, Greed and Stupidity Play a Role◦ Huge Principal-Agent Problems => Compensation Incentives Matter…
Asymmetric Incentives - Private Gains, Social Losses
…But Are Difficult to Design
“I made a mistake in presuming that the self-interest of organizations, specifically banks and others, was such that they were best capable of protecting their own shareholders.”
Alan Greenspan, Oct. 23, 2008, testifying to U.S. Congress
In moments of crisis, there really may be institutions that are too important to fail
Policymakers err on the side of saving the system in the short-term, even at expense of adding long-run risk
Pre-Emptive Monitoring Approaches are Required for“TITF”◦ => Information Needs to be Shared in Advance of a Crisis
2. Non-Interventionist Stances Often Not “Time-Consistent”
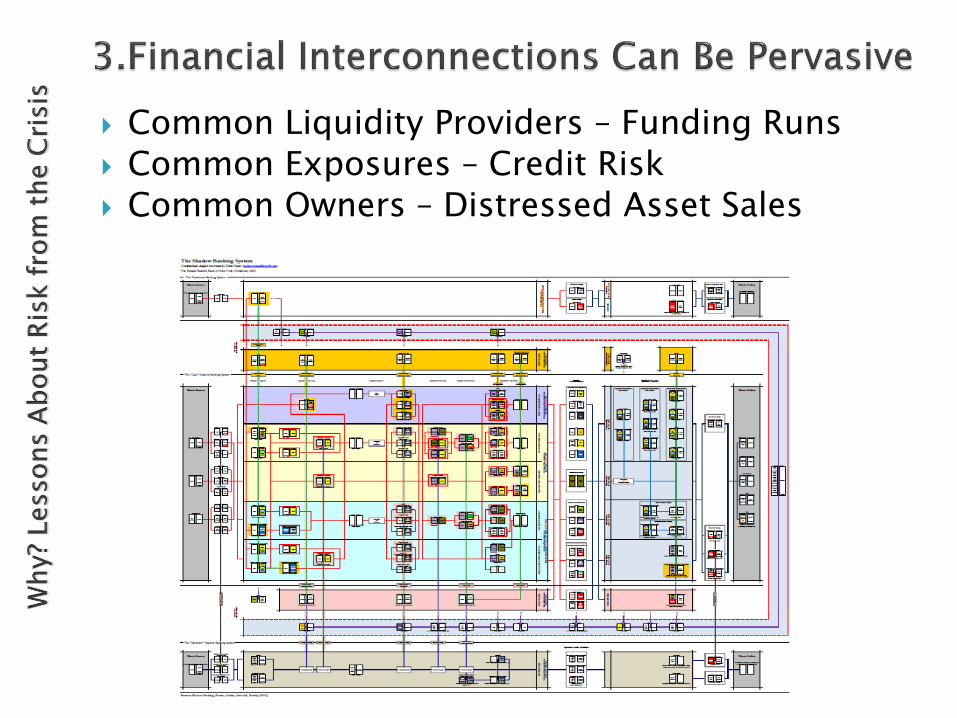
Common Liquidity Providers – Funding Runs
Common Exposures – Credit Risk
Common Owners – Distressed Asset Sales
Bank 1
Bank 2
Bank N-1
Bank 3
Bank N
.
.
.
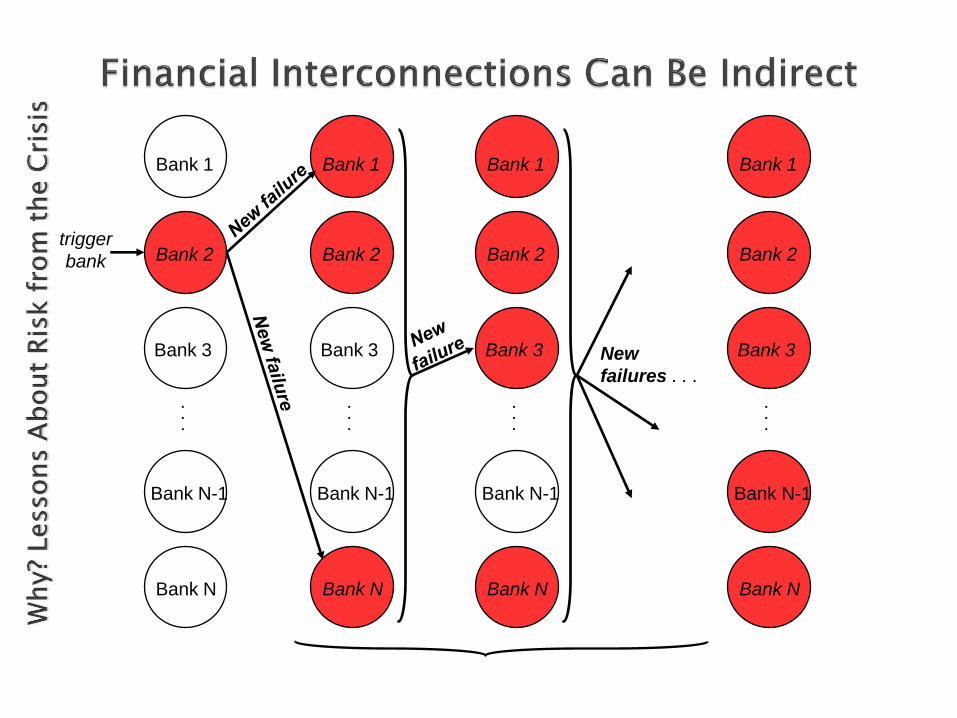
trigger
bank
Bank 1
Bank 2
Bank N-1
Bank 3
Bank N
.
.
.
Bank 1
Bank 2
Bank N-1
Bank 3
Bank N
.
.
.
Bank 1
Bank 2
Bank N-1
Bank 3
Bank N
.
.
.
New
failures . . .
LTCM◦ Creditor Banks Unaware of Each Other’s Funding
AIG◦ Almost Everyone Was Unaware of AIG-FP’s positions
Clico

Common Membership in Benchmark Indices
Hidden Risk Transfers◦ Explicit (but off balance sheet), e.g. CDS
◦ Implicit, e.g. via Reputational Risk
Bear Stearns’ Hedge Funds
Citi’s SIVs
Liquidity Runs – “Business Model Contagion”◦ Gary Gorton’s Tainted Beef Analogy
◦ Transparency Matters - But Is Hard to Achieve
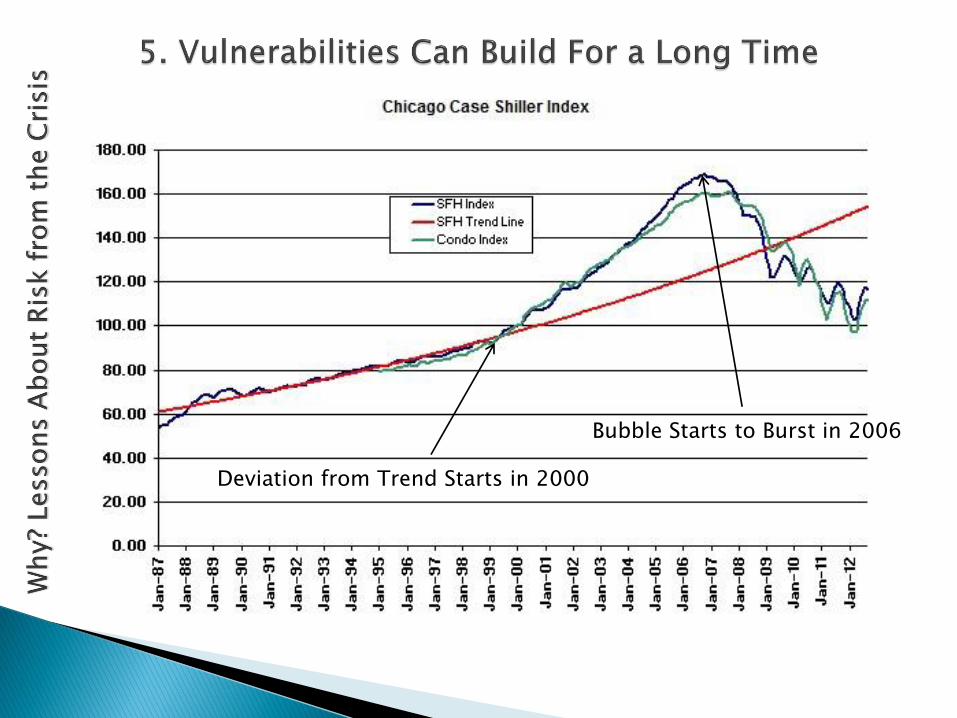
Deviation from Trend Starts in 2000
Bubble Starts to Burst in 2006
Lessons about RiskLessons for Risk-
Monitoring
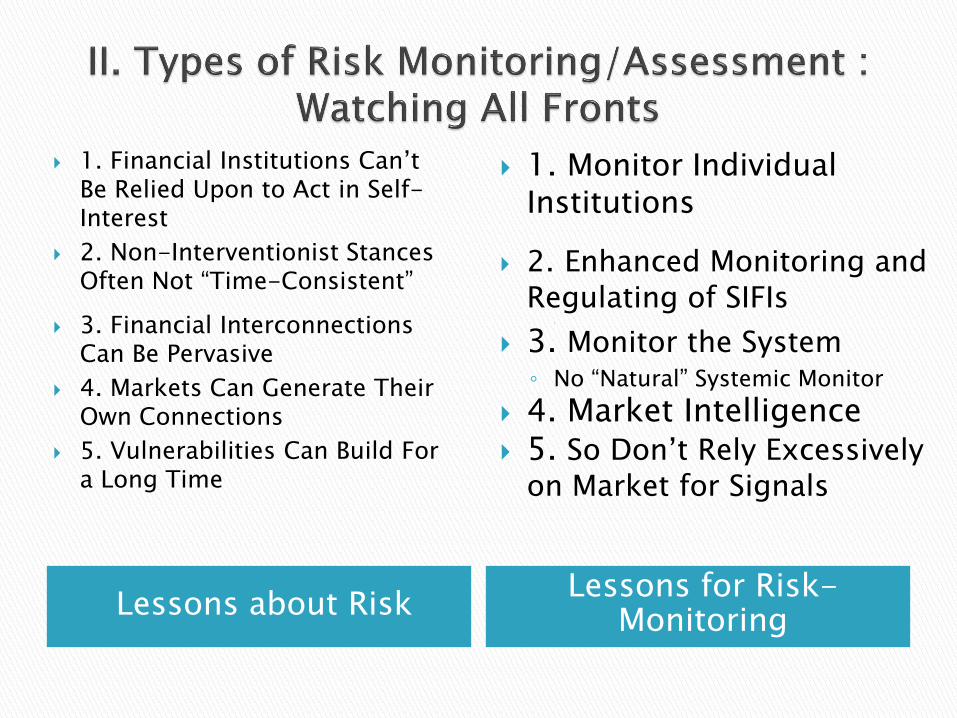
1. Financial Institutions Can’t Be Relied Upon to Act in Self-Interest
2. Non-Interventionist Stances Often Not “Time-Consistent”
3. Financial Interconnections Can Be Pervasive
4. Markets Can Generate Their Own Connections
5. Vulnerabilities Can Build For a Long Time
1. Monitor Individual Institutions
2. Enhanced Monitoring and Regulating of SIFIs
◦ \
3. Monitor the System◦ No “Natural” Systemic Monitor
4. Market Intelligence 5. So Don’t Rely Excessively
on Market for Signals
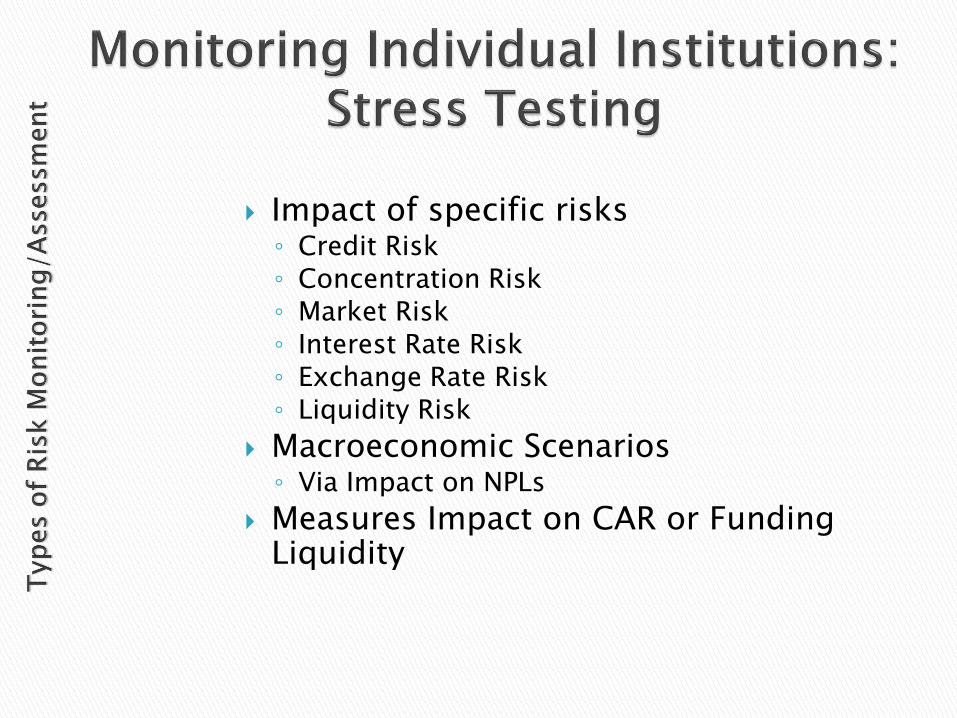
Impact of specific risks◦ Credit Risk◦ Concentration Risk◦ Market Risk◦ Interest Rate Risk◦ Exchange Rate Risk◦ Liquidity Risk
Macroeconomic Scenarios◦ Via Impact on NPLs
Measures Impact on CAR or Funding Liquidity
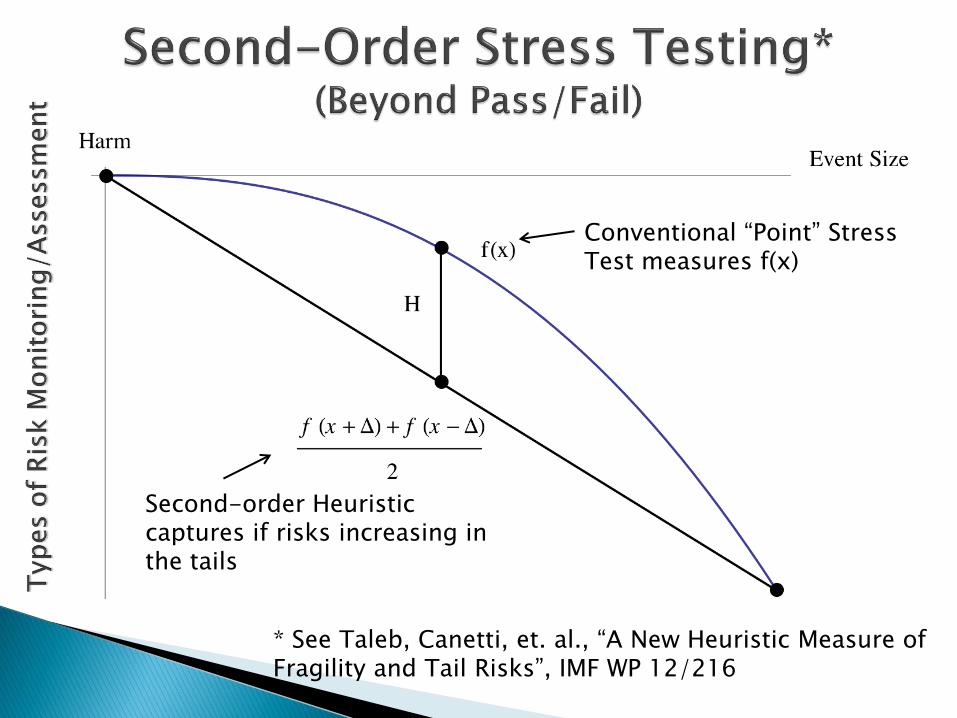
* See Taleb, Canetti, et. al., “A New Heuristic Measure of Fragility and Tail Risks”, IMF WP 12/216
Conventional “Point” Stress Test measures f(x)
Second-order Heuristic captures if risks increasing in the tails
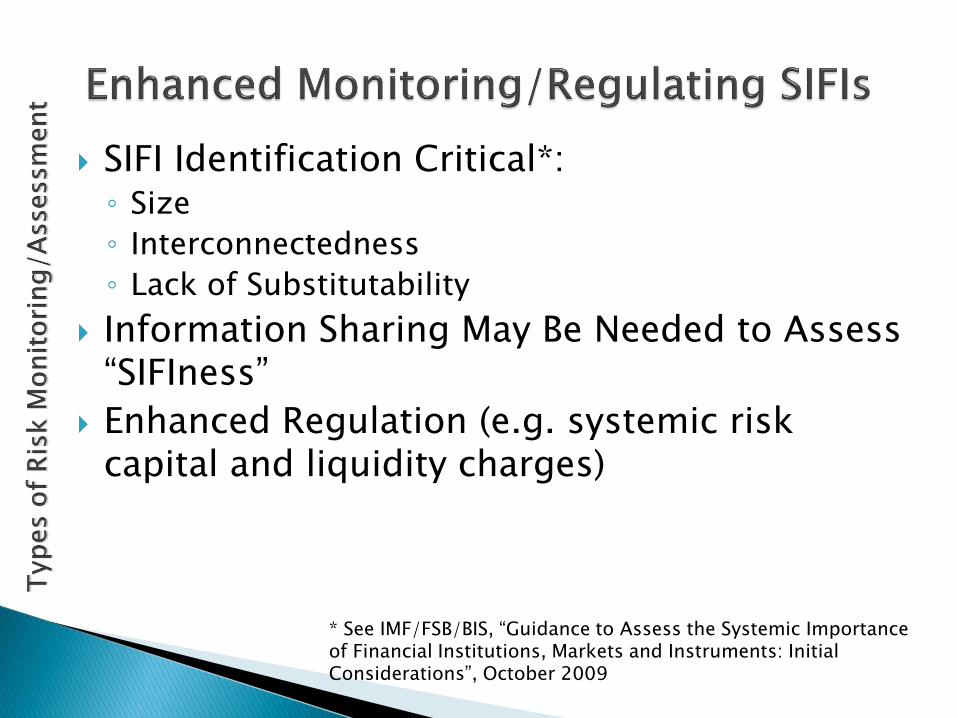
SIFI Identification Critical*:◦ Size
◦ Interconnectedness
◦ Lack of Substitutability
Information Sharing May Be Needed to Assess “SIFIness”
Enhanced Regulation (e.g. systemic risk capital and liquidity charges)
* See IMF/FSB/BIS, “Guidance to Assess the Systemic Importance of Financial Institutions, Markets and Instruments: Initial Considerations”, October 2009

Time Dimension◦ Total Credit Growth (credit/GDP or trend deviations)◦ Macro Imbalances◦ Leverage Ratios◦ Balance Sheet “Stretch” (e.g. debt service ratios)◦ Increased exposure to interest rate and currency risk◦ Asset Prices◦ Changes in Lending Standards
Structural Dimension ◦ Financial Linkages (Interconnectedness) Financial to Financial
Financial to Real
Cross-Border
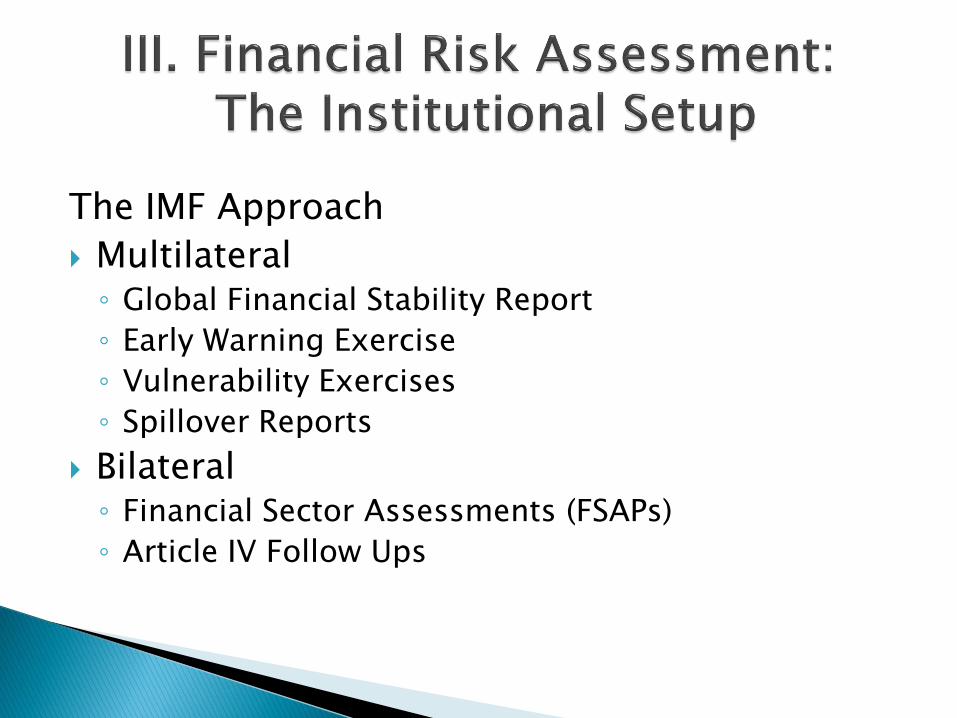
The IMF Approach
Multilateral ◦ Global Financial Stability Report
◦ Early Warning Exercise
◦ Vulnerability Exercises
◦ Spillover Reports
Bilateral ◦ Financial Sector Assessments (FSAPs)
◦ Article IV Follow Ups
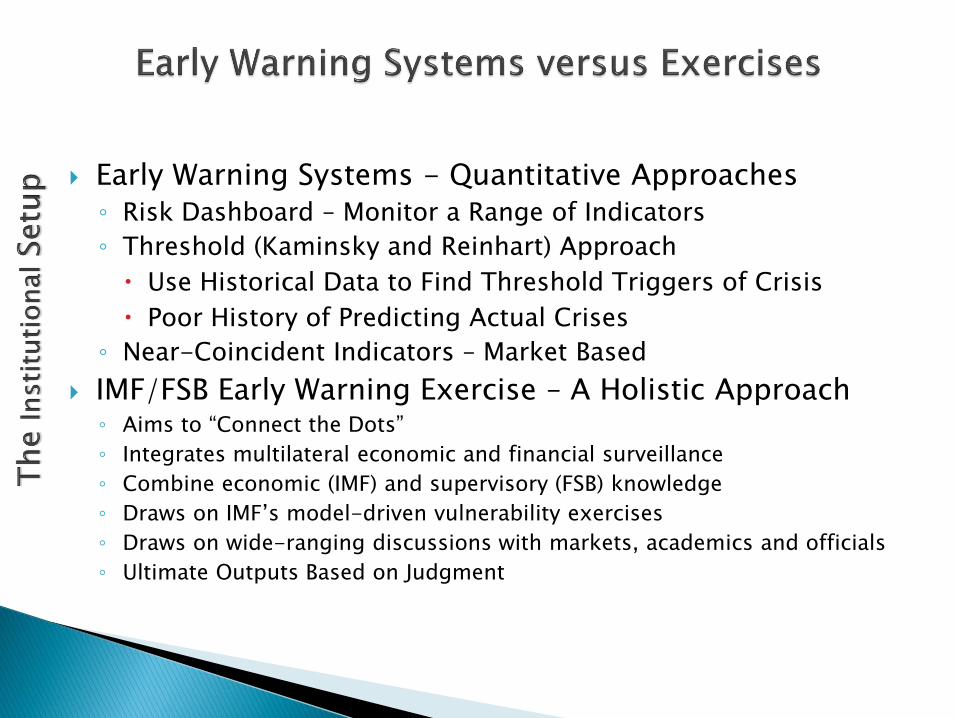
Early Warning Systems - Quantitative Approaches◦ Risk Dashboard – Monitor a Range of Indicators
◦ Threshold (Kaminsky and Reinhart) Approach
Use Historical Data to Find Threshold Triggers of Crisis
Poor History of Predicting Actual Crises
◦ Near-Coincident Indicators – Market Based
IMF/FSB Early Warning Exercise – A Holistic Approach◦ Aims to “Connect the Dots”
◦ Integrates multilateral economic and financial surveillance
◦ Combine economic (IMF) and supervisory (FSB) knowledge
◦ Draws on IMF’s model-driven vulnerability exercises
◦ Draws on wide-ranging discussions with markets, academics and officials
◦ Ultimate Outputs Based on Judgment

18
Sample Output: VEA RatingsCountry Flags Raised by the VEA
1
Cou
ntry
1
Cou
ntry
2
Cou
ntry
3
Cou
ntry
4
Cou
ntry
5
Cou
ntry
6
Cou
ntry
7
Cou
ntry
8
Cou
ntry
9
Cou
ntry
10
Cou
ntry
11
Cou
ntry
12
Cou
ntry
13
Cou
ntry
14
Cou
ntry
15
Cou
ntry
16
Cou
ntry
17
Cou
ntry
18
Cou
ntry
19
Cou
ntry
20
Cou
ntry
21
Cou
ntry
22
Cou
ntry
23
Cou
ntry
24
Cou
ntry
25
Cou
ntry
26
Cou
ntry
27
Cou
ntry
28
Cou
ntry
29
Cou
ntry
30
Cou
ntry
31
Cou
ntry
32
Overall VEA rating 5 4 2 2 3 6 6 2 6 11 7 4 8 8 4 3 4 3 6 7 6 7 9 8 8 6 4 5 6 5 5 3
External 0 1 0 0 1 1 1 0 1 2 2 0 1 0 0 0 0 0 0 1 1 1 2 1 2 1 0 0 0 0 0 0
External imbalances (empirical crisis model, thresholds for 3 external sector indicators) 0 2 0 0 0 2 2 0 2 2 2 1 2 0 0 0 0 0 0 2 2 2 2 2 2 n.a. n.a. 0 0 0 0 0
Overvalued exchange rate (CGER) 0 0 0 0 2 1 1 0 0 0 0 0 0 0 0 0 0 0 0 1 0 0 0 0 2 1 0 0 0 0 0 0
International Balance sheet analysis 0 0 n.a. n.a. 0 0 0 0 0 2 2 0 n.a. 0 n.a. 0 0 1 n.a. n.a. n.a. 0 2 1 0 n.a. n.a. n.a. 1 1 0 1
Macro 2 1 1 1 1 2 1 1 1 2 1 1 1 2 2 1 1 1 1 2 1 1 1 2 1 2 2 2 2 2 2 1
Growth risks 2 1 1 1 1 2 0 1 1 2 1 1 1 2 2 1 1 1 1 2 1 1 1 1 1 2 2 2 2 2 2 1
Growth risks (empirical crisis model) 1 1 1 1 1 1 0 1 1 2 1 1 1 2 2 1 1 1 1 2 1 1 1 1 1 2 2 2 2 0 1 1
GDP at risk 2 0 n.a. n.a. 0 2 0 0 1 1 n.a. 0 0 0 n.a. 1 0 0 n.a. n.a. n.a. 1 0 1 1 n.a. n.a. n.a. 2 2 2 0
Growth above potential (general equilibrium macro model) 0 n.a. n.a. n.a. 0 n.a. 0 0 0 n.a. n.a. 0 n.a. n.a. n.a. 0 n.a. n.a. n.a. n.a. n.a. 0 0 n.a. n.a. n.a. n.a. n.a. n.a. n.a. n.a. n.a.
Inflation risks 0 0 0 0 0 0 0 0 1 0 0 0 0 0 0 0 0 0 0 0 0 0 0 0 0 0 0 2 0 0 0 1
Loose monetary policy (Taylor rule) 0 0 0 0 0 0 0 0 0 0 0 0 0 0 0 0 0 0 0 0 0 0 0 0 0 0 0 2 0 0 0 1
Loose monetary conditions (general equilibrium macro model) 0 n.a. n.a. n.a. 0 n.a. 0 0 2 n.a. n.a. 0 n.a. n.a. n.a. 0 n.a. n.a. n.a. n.a. n.a. 0 0 n.a. n.a. n.a. n.a. n.a. n.a. n.a. n.a. n.a.
Denflation risks 2 0 0 0 1 0 1 0 0 2 0 0 1 0 0 0 0 0 0 0 0 1 1 2 0 1 0 0 0 1 0 0
Tight monetary policy (Taylor rule) 2 0 0 0 1 0 1 0 0 2 0 0 1 0 0 0 0 0 0 0 0 0 1 2 0 1 0 0 0 1 0 0
Tight monetary conditions (general equilibrium macro model) 2 n.a. n.a. n.a. 0 n.a. 0 0 0 n.a. n.a. 0 n.a. n.a. n.a. 0 n.a. n.a. n.a. n.a. n.a. 1 0 n.a. n.a. n.a. n.a. n.a. n.a. n.a. n.a. n.a.
Fiscal 2 0 0 0 0 0 1 0 1 2 2 1 1 1 1 0 0 0 1 0 1 2 2 2 2 1 0 2 0 0 0 0
Fiscal risks, overall indicator 2 0 n.a. n.a. 0 0 1 0 1 2 n.a. 1 1 1 n.a. 0 0 0 1 0 1 2 2 2 2 n.a. n.a. n.a. 0 0 0 0
Gross funding risk (sovereign financing risks analysis) 2 2 n.a. n.a. 0 0 2 1 0 0 2 1 2 0 n.a. 0 0 0 0 n.a. 0 2 0 1 1 n.a. n.a. n.a. 0 0 0 0
Market perception of sovereign default risk (CDS and RAS spreads, models for government
bond yields and term risk premium)1 2 n.a. n.a. 0 0 0 0 0 2 n.a. 0 1 1 n.a. 0 1 0 1 n.a. n.a. 2 1 2 2 n.a. n.a. n.a. 0 0 0 0
Medium-term fiscal adjustment need 2 0 n.a. n.a. 1 0 2 0 2 2 n.a. 1 0 1 n.a. 0 0 n.a. 0 n.a. 1 0 1 1 2 n.a. n.a. n.a. 0 0 0 0
Long-term fiscal adjustment need 1 2 n.a. n.a. 0 1 2 0 0 1 n.a. 0 1 1 n.a. 0 0 n.a. 2 0 2 0 2 0 2 2 n.a. n.a. 0 0 1 0
Fiscal vulnerability to an adverse growth shock 2 0 n.a. n.a. 0 0 1 0 0 1 n.a. 1 2 1 0 1 0 n.a. 0 0 0 2 1 2 2 0 0 n.a. 0 0 0 0
Contagion risk (distress dependence from other sovereigns) 0 n.a. n.a. n.a. n.a. n.a. 0 n.a. 1 1 n.a. 1 0 0 n.a. 0 0 n.a. n.a. n.a. n.a. 1 2 2 2 n.a. n.a. n.a. n.a. n.a. n.a. 0
Fiscal crisis risks (empirical crisis model) 1 0 0 0 0 1 1 1 1 2 2 2 2 1 1 1 1 0 1 1 2 2 1 1 2 2 0 2 1 1 0 0
Asset prices 0 1 n.a. n.a. 1 2 2 1 1 2 n.a. 0 2 2 n.a. 1 1 1 n.a. n.a. n.a. 1 2 n.a. n.a. n.a. n.a. n.a. 2 1 1 0
Real estate overall vulnerability 0 1 n.a. n.a. 1 2 2 0 1 2 n.a. 0 n.a. 2 n.a. 0 n.a. 1 n.a. n.a. n.a. 0 2 n.a. n.a. n.a. n.a. n.a. 1 1 1 0
Residential real estate 0 0 n.a. n.a. 1 2 0 0 1 2 n.a. 0 n.a. 2 n.a. 0 n.a. 0 n.a. n.a. n.a. 0 2 n.a. n.a. n.a. n.a. n.a. 1 1 0 0
House price misalignment 0 0 n.a. n.a. 2 2 0 1 2 0 n.a. 2 2 1 n.a. 0 0 0 n.a. n.a. n.a. 0 2 0 0 n.a. n.a. n.a. 1 0 2 2
Household debt burden 0 0 n.a. n.a. 1 1 1 1 1 1 n.a. 0 n.a. 2 n.a. 0 n.a. 1 n.a. n.a. n.a. 0 0 n.a. n.a. n.a. n.a. n.a. 2 0 0 0
Potential impact on GDP 0 0 n.a. n.a. 1 2 0 0 1 2 n.a. 0 n.a. 0 n.a. 0 n.a. 0 n.a. n.a. n.a. 0 0 n.a. n.a. n.a. n.a. n.a. 1 1 0 0
Mortgage market characteristics 0 0 n.a. n.a. 1 0 1 0 1 2 n.a. 0 n.a. 1 n.a. 0 n.a. 0 n.a. n.a. n.a. 2 2 n.a. n.a. n.a. n.a. n.a. 0 2 1 0
Commercial real estate 0 1 n.a. n.a. 1 0 2 0 1 1 n.a. 0 n.a. 0 n.a. 0 n.a. 1 n.a. n.a. n.a. 0 2 n.a. n.a. n.a. n.a. n.a. 1 1 1 0
Equity prices 0 n.a. n.a. n.a. 1 n.a. 0 1 0 1 n.a. 0 2 0 n.a. 1 1 0 n.a. n.a. n.a. 0 1 n.a. n.a. n.a. n.a. n.a. n.a. n.a. n.a. 0
Model based misalignments 0 n.a. n.a. n.a. 1 n.a. 0 2 0 0 n.a. 0 1 0 n.a. 0 2 0 n.a. n.a. n.a. 0 2 n.a. n.a. n.a. n.a. n.a. n.a. n.a. n.a. 0
Valuation multiples misalignments 0 n.a. n.a. n.a. 1 n.a. 0 0 0 1 n.a. 0 2 0 n.a. 1 0 0 n.a. n.a. n.a. 0 0 n.a. n.a. n.a. n.a. n.a. n.a. n.a. n.a. 0
Corporate sector vulnerability 0 0 0 1 0 2 n.a. 0 0 0 0 1 1 0 n.a. n.a. n.a. 1 0 1 0 n.a. n.a. n.a. 2 1 1 0
Financial sector and systemic models 1 1 0 0 0 0 1 0 1 1 0 1 1 1 0 0 1 0 1 1 1 1 1 1 1 0 0 0 1 1 1 1
Financial crisis (empirical crisis model) 0 0 0 0 0 0 0 0 0 1 0 0 1 1 0 0 0 0 0 0 0 1 0 1 1 0 0 0 0 0 0 0
Financial stability at risk 1 2 n.a. n.a. 0 0 0 0 2 0 n.a. 1 0 2 n.a. 0 1 0 n.a. n.a. n.a. 1 0 0 0 n.a. n.a. n.a. 2 2 2 1
Expected deterioration of asset quality (NPL model) 2 0 n.a. 0 0 0 2 0 1 n.a. n.a. 1 0 0 n.a. 2 2 0 2 n.a. n.a. 2 2 0 2 n.a. n.a. 0 0 0 0 0
Interbank spreads 0 1 0 0 1 0 0 0 0 1 n.a. 1 1 1 1 1 1 0 n.a. 1 1 1 1 1 1 1 1 n.a. 0 1 1 1
Distress from Large Complex Financial Institutions 0 1 0 0 0 n.a. 2 1 2 2 n.a. 1 1 n.a. n.a. 0 2 1 n.a. n.a. n.a. 1 1 2 2 n.a. n.a. n.a. 1 n.a. 0 2
Duration of crisis (duration model) 2 2 0 0 1 2 2 1 0 0 0 0 0 0 0 0 0 0 n.a. 2 2 1 1 0 1 0 0 n.a. 0 1 0 0
Contagion 0 0 0 0 0 1 0 0 1 2 1 1 2 2 0 1 1 1 2 2 1 1 1 1 1 1 1 0 1 1 1 1
Cross-border financial sector exposure (contagion through bank channels) 0 0 1 0 0 2 0 0 0 2 0 1 2 1 0 0 0 2 0 2 0 0 0 0 0 0 0 0 0 0 0 0
Financial sector exposure to vulnerable advanced economies 0 0 0 0 1 0 1 0 2 2 2 2 2 2 1 2 2 2 2 1 2 2 2 2 2 2 2 0 2 1 1 1
Financial sector exposure to vulnerable emerging economies 0 0 0 0 0 0 0 0 1 1 0 0 1 1 0 0 2 1 2 2 2 0 0 1 2 0 0 n.a. 1 0 0 2
Contagion through trade channels 0 1 0 0 0 1 0 1 0 1 1 0 2 2 0 1 1 0 2 2 0 1 0 0 0 0 0 1 1 1 1 1
1The table summarizes the main results of the VEA exercise. The colors indicate countries that were flagged as relatively vulnerable in each sector, with red, orange and green for high, medium and low vulnerabilities respectively. When "n.a.", the number of red and
orange flags needed to rank a country with H or M drops accordingly.

Evaluate Financial System Stability◦ Stress Tests
◦ Interconnectedness Tests
◦ Risk Assessment Matrix – Likelihood and Impact
Standards Assessments◦ Banking
◦ Insurance
◦ Securities
Safety Nets and Crisis Management◦ Deposit Insurance, etc.
◦ Crisis Management Arrangements
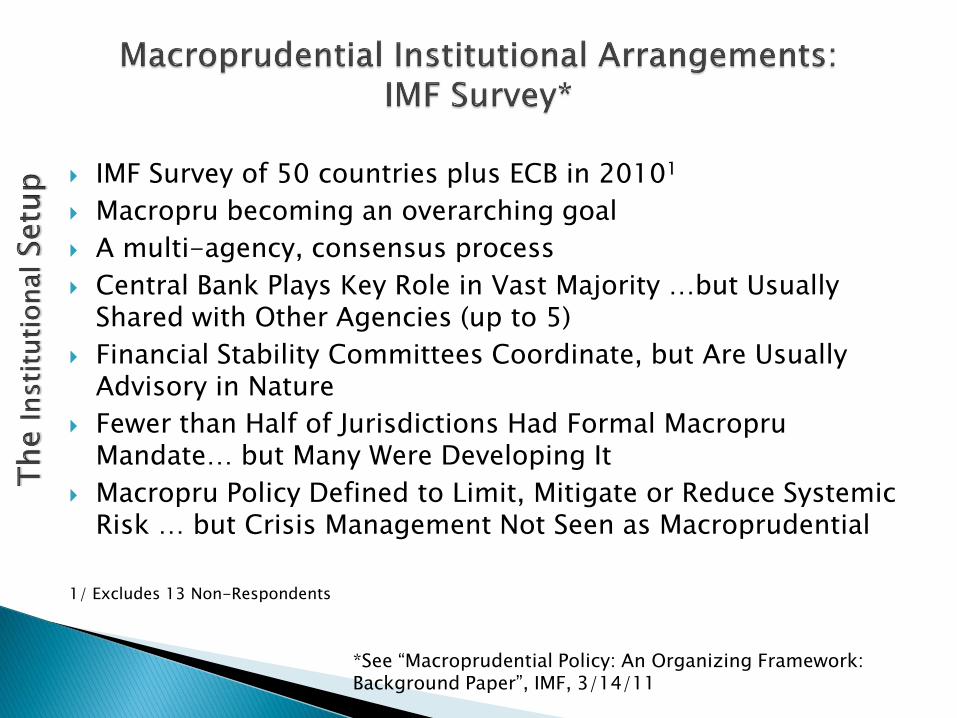
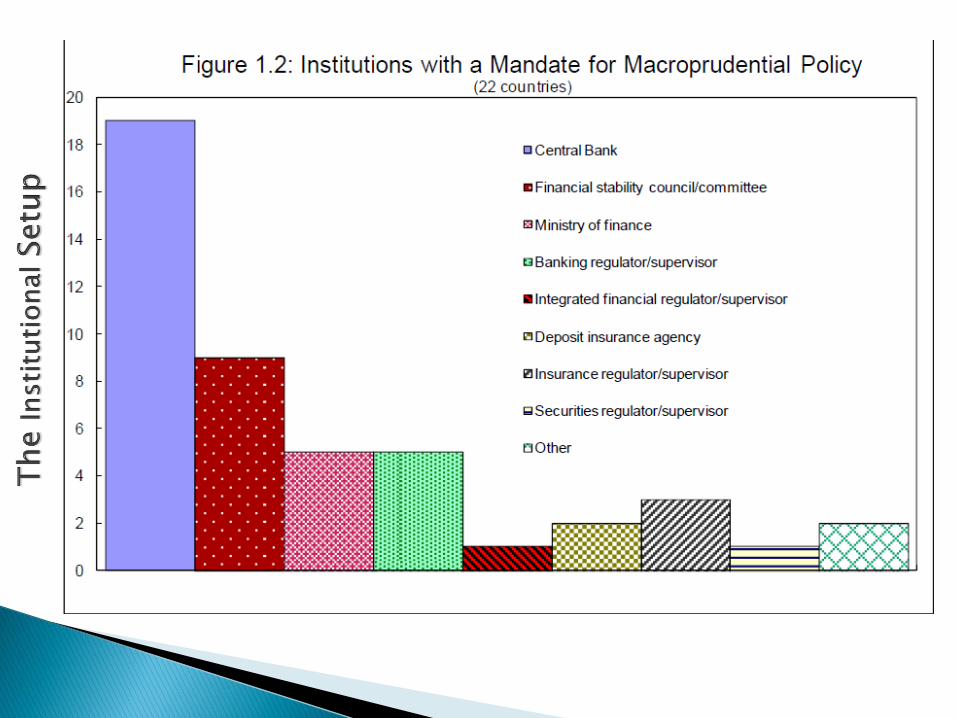
IMF Survey of 50 countries plus ECB in 20101
Macropru becoming an overarching goal
A multi-agency, consensus process
Central Bank Plays Key Role in Vast Majority …but Usually Shared with Other Agencies (up to 5)
Financial Stability Committees Coordinate, but Are Usually Advisory in Nature
Fewer than Half of Jurisdictions Had Formal MacropruMandate… but Many Were Developing It
Macropru Policy Defined to Limit, Mitigate or Reduce Systemic Risk … but Crisis Management Not Seen as Macroprudential
1/ Excludes 13 Non-Respondents
*See “Macroprudential Policy: An Organizing Framework: Background Paper”, IMF, 3/14/11
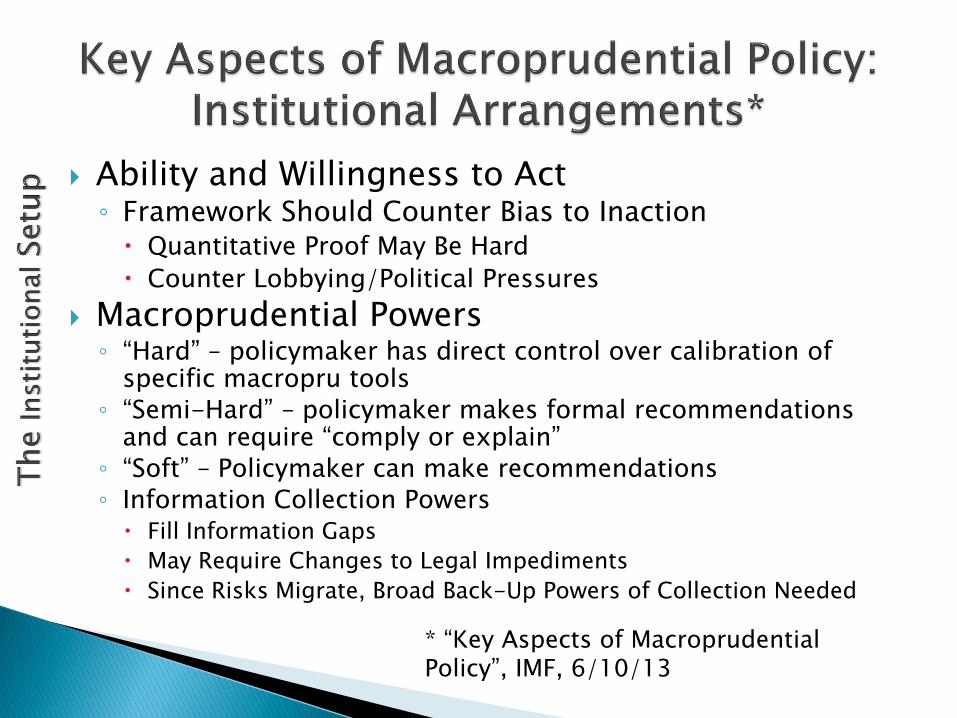
Ability and Willingness to Act◦ Framework Should Counter Bias to Inaction Quantitative Proof May Be Hard
Counter Lobbying/Political Pressures
Macroprudential Powers◦ “Hard” – policymaker has direct control over calibration of
specific macropru tools
◦ “Semi-Hard” – policymaker makes formal recommendations and can require “comply or explain”
◦ “Soft” – Policymaker can make recommendations
◦ Information Collection Powers Fill Information Gaps
May Require Changes to Legal Impediments
Since Risks Migrate, Broad Back-Up Powers of Collection Needed
* “Key Aspects of Macroprudential Policy”, IMF, 6/10/13
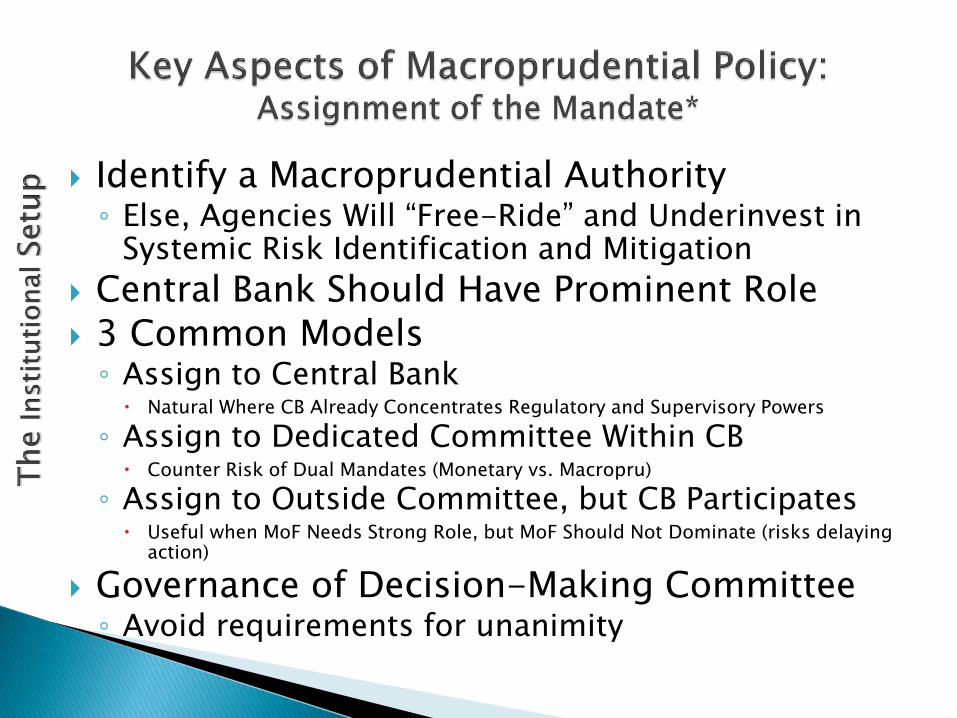
Identify a Macroprudential Authority◦ Else, Agencies Will “Free-Ride” and Underinvest in
Systemic Risk Identification and Mitigation
Central Bank Should Have Prominent Role 3 Common Models
◦ Assign to Central Bank Natural Where CB Already Concentrates Regulatory and Supervisory Powers
◦ Assign to Dedicated Committee Within CB Counter Risk of Dual Mandates (Monetary vs. Macropru)
◦ Assign to Outside Committee, but CB Participates Useful when MoF Needs Strong Role, but MoF Should Not Dominate (risks delaying
action)
Governance of Decision-Making Committee ◦ Avoid requirements for unanimity
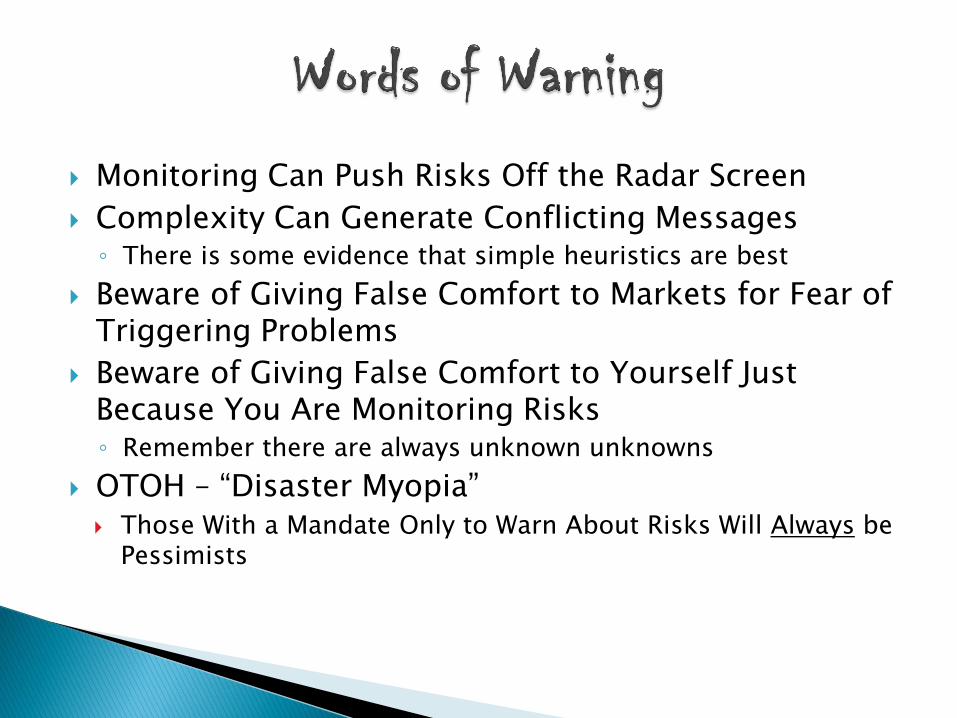
Monitoring Can Push Risks Off the Radar Screen
Complexity Can Generate Conflicting Messages◦ There is some evidence that simple heuristics are best
Beware of Giving False Comfort to Markets for Fear of Triggering Problems
Beware of Giving False Comfort to Yourself Just Because You Are Monitoring Risks◦ Remember there are always unknown unknowns
OTOH – “Disaster Myopia” Those With a Mandate Only to Warn About Risks Will Always be
Pessimists
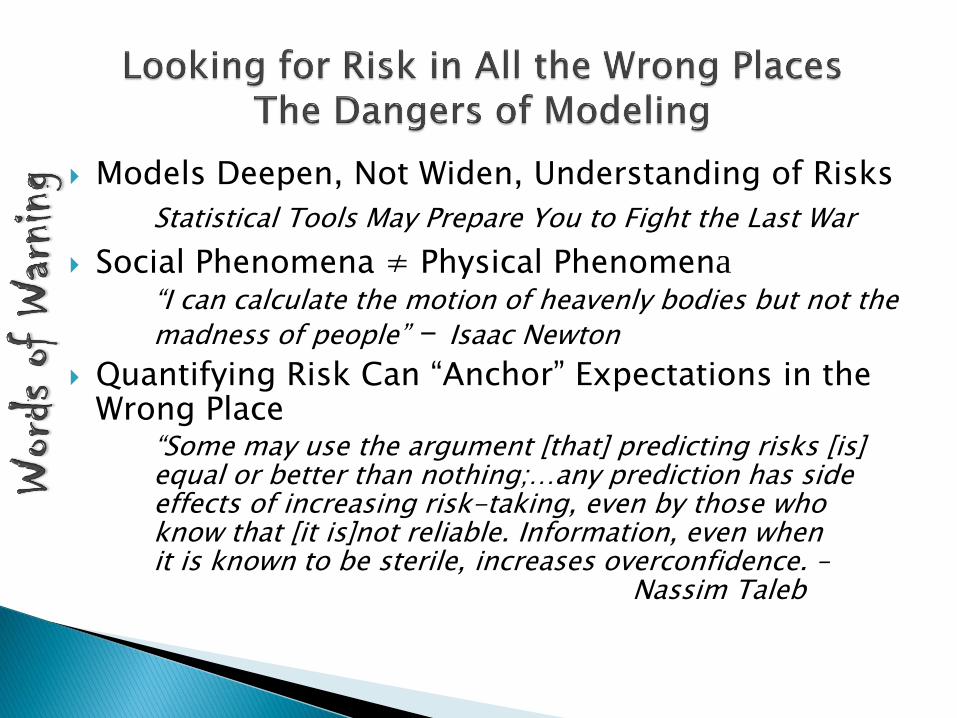
Models Deepen, Not Widen, Understanding of Risks
Statistical Tools May Prepare You to Fight the Last War
Social Phenomena ≠ Physical Phenomena“I can calculate the motion of heavenly bodies but not the
madness of people” – Isaac Newton
Quantifying Risk Can “Anchor” Expectations in the Wrong Place
“Some may use the argument [that] predicting risks [is]equal or better than nothing;…any prediction has side effects of increasing risk-taking, even by those who know that [it is]not reliable. Information, even when it is known to be sterile, increases overconfidence. –
Nassim Taleb