eliminating friction in financial services path to purchase · offered such as insurance on credit...
TRANSCRIPT

Eliminating Friction in Financial ServicesPath to Purchase

2
The content herein is based on the primary survey carried out and consequent data provided by Nielsen India on behalf of Facebook India Online Services
Private Limited (“Primary Data”) which has been relied upon while conducting the secondary survey by [KPMG in India] (“KPMG”). KPMG has also
referred to information from public domain and other secondary sources in conducting secondary survey (“Secondary Data”). KPMG has not verified or
investigated Primary Data or Secondary Data and assumes no responsibility for the veracity, accuracy and completeness of such information and will not
be held liable for it under any circumstances. KPMG accordingly disclaims all responsibility and liability for use of such Primary Data or Secondary Data,
including disclaims any warranty for accuracy, veracity, completeness or non-infringement.
This study is commissioned by Facebook. Zero Friction Future is intellectual property of Facebook and cannot be used without prior consent.
The information contained herein is of a general nature and is not intended to address the circumstances of any particular individual or entity. No one
should act on such information without appropriate professional advice after a thorough examination of the particular situation.
In connection with the report or any part thereof, KPMG does not owe duty of care (whether in contract or in tort or under statute or otherwise) to any
person or party to whom the report is circulated to and KPMG shall not be liable to any party who uses or relies on this report. KPMG thus disclaims all
responsibility or liability for any costs, claims, damages, losses, liabilities, expenses incurred by such third party arising out of or in connection with the
report or any part thereof including for any acts of commission or omission therein, howsoever caused.
Although we have attempted to provide correct and timely information, there can be no guarantee that such information is correct as of the date it is
received or that it will continue to be correct in the future.
Use of companies’ names in the report is only to exemplify the trends in the industry. We maintain our independence from such entities and no bias is
intended towards any of them in the report.
The report may make reference to ‘KPMG Analysis’; this merely indicates that we have (where specified) undertaken certain ana lytical activities on the
underlying data to arrive at the information presented; we do not accept responsibility for the veracity of the underlying data.
The views and opinions expressed herein are those of the interviewees, survey respondents and do not necessarily represent the views and opinions of
KPMG in India.
By reading this report, the reader of the report shall be deemed to have accepted the terms mentioned hereinabove.
Disclaimers

3

4
Credit cards Insurance LoansThe report aims to
cover three financial
products in the
industry - Credit
Cards, Insurance and
Loans.
Page: 13-37 Page: 38-67 Page: 68-97

5
Friction
Decoded —
Scope of
Opportunity
Friction
Mapping —
Understanding
Friction
Zero Friction
Future —
Reimagining
The Purchase
Journey
Executive
Summary
01 02
03
Friction Busting —
Increasing The
Sales Opportunity
With Mobile
0405
Sections covered

6
Executive summary
Against the backdrop of important structural reforms, India’s
financial sector has been recording strong growth in the recent
years. Increased diversification, disruptive digital business
models and technology driven-solutions have supported growth
of the financial industry. The retail credit outstanding is poised
for a robust growth of ~15 per cent to reach USD725 billion by
2022[1], while the insurance industry is expected to reach
USD160 billion by 2022 at a CAGR of ~15 per cent[2]. With the
cultivation of the digital payment ecosystem, the credit card
transaction market is expected to touch USD143 billion by 2022
at a robust grow rate of ~20 per cent[3].
Reducing cost of internet and government push to encourage
digitisation have accelerated the adoption of financial products.
India’s banking sector is at a crossroad as traditional financial
players face huge disruptions with digital growth propelling
changes in technology, consumer mindsets and their purchase
behaviour. More consumers now rely on the internet and mobile
phones to meet their banking needs.
The purchase of financial products, by their very nature, is a high
involvement process and requires assistance to make a sound
decision. This report aims to understand the consumers’
purchase behaviour and reasons that lead to consumer
dissatisfaction and their dropouts in the path to purchase of a
financial product, referred to as ‘friction’, which may lead to
potential loss of revenue for brands. The study focuses on the
retail business of credit cards, loans and insurance. Loans
include personal loans, which are unsecured, and other loans
such as home loans, auto loans and consumer durables loans.
Insurance captures life insurance and other insurance including
health and general insurance. The study does not cover the
sales of commercial financial products.
To understand the path to purchase and friction at different
stages of the purchase journey, a random listing study
was conducted by Nielsen India on 3,000 respondents to
understand the proportion of the population that falls at each
stage of the journey, and a further deep-dive study was
conducted among 1221 respondents in the financial products
category across varied demographic and socio-economic
groups. KPMG in India, also interacted with industry experts to
obtain their perspective on the possible approaches to reduce
friction and improve the conversion rates.
Our research indicates that:
• In the credit cards category, ~29 per cent of consumers drop
out due to friction, and nearly one-third of this friction is
caused by media
• In the insurance category, ~37 per cent of consumers drop
out due to friction, and nearly half of this friction is caused by
media
• In the loans category, ~32 per cent of consumers drop out
due to friction, and nearly one-fourth of this friction is caused
by media
• Mobile platforms are expected to influence about 8 out of 10
credit card and insurance purchases, while about 6 out of 10
personal loan purchases and about 7 out of 10 other loan
purchases by 2022
− Facebook is expected to influence nearly half of the
mobile-influenced purchases for life insurance and other
loan categories by 2022
− Facebook is expected to influence nearly one-third of the
mobile-influenced purchases for credit cards, other
insurance and personal loan categories by 2022
• Mobile-enabled purchase journeys are shorter than offline by
22 per cent for credit cards, 17 per cent for insurance and 8
per cent for loan categories
• Mobile could help brands tap into a credit card transaction
opportunity of ~USD38 billion, insurance premium income
opportunity of ~USD70 billion and loans outstanding
opportunity of ~USD219 billion, by reducing media friction
Sectoral development of Bank credit,
RBI, March 2018; India consumer
payment research, TransUnion CIBIL,
March 2017
Asia Insurance Market Report 2018,
Willis Towers Watson, February 2018;
IRDA Annual report 2016–17, IRDA, Jan
2018
Credit card transactions, Euromonitor,
July 2017
[1]
[2]
[3]
Sources:
Note: Retail lending under this study excludes agricultural loans, while credit cards have been studied separately

7

8
Understanding the multidimensional consumer
My attentionMy motivation My connection My watch My wallet
Motivational characteristics
that drive behaviours
and expectations
How consumers balance
constraints of time and
how they change across
life events
The ways consumers
direct their attention
and focus
How consumers connect
to devices, information
and each other
How consumers adjust
their share of wallet
across life events
The 5Mys framework to understand the financial product consumers*
Source:
*Me, my life, my wallet report by KPMG International, November 2017
• Credit cards integrated
for smart purchase
• Peer reviews and
recommendations
• Insurance covers
provided by employers
• Community insurance
• Existing relationship with
bank/NBFC
• Recommendations by
friends and families
• Easy and flexible
payment options
• Transparent payment
terms and conditions
• More partners/tie-ups for
usage options
• Easy points redemption
• Incentivised insurance
cover for loans
• Reduced
security/collateral
• Reduced miscellaneous
charges such as
processing fee
• Rewards aligned to usage
• Miscellaneous benefits
offered such as insurance
on credit cards
• Expansive partner tie-ups
• Extensive disease
coverage in terms of
health insurance
• Dynamic wealth creation
plans such as ULIP-unit
linked Insurance plans
• Option to customise plans
• Availability of online plans
• Attractive interest rates
• Financial safety
• Wealth creation
• Life goals, fear of an
unknown event,
unplanned/emergency
expenses
• Convenience of credit card
usage at point-of-sale
• Attractive usage offers and
rewards as on credit cards
• Tax benefits
• Easy and affordable
repayments
• Quick application and
prompt approval and
activation
• Instant gratification on
credit cards
• Special life event offers
• Prompt customer services
such as KYC verification
• Direct call to representative
instead of automated calls
in emergencies
• Convenience of pre-policy
medical examination at
home
• Quick claim settlement
Technology has redefined the manner in which consumers make financial decisions and purchase financial products. It is becoming increasingly important for brands to
cater to these changing needs with a smooth experience across the entire path to purchase. Understanding the complex underlying drivers of this evolving consumer
behaviour has become more important with the acceleration in the disruption caused by the digital age.
KPMG’s 5Mys framework is designed to help identify the real drivers of consumer behaviour, along with the critical trade-offs among purchase decisions across the breadth
of the consumer wallet, leading to more targeted and contextualised experiences, products and services that create value for both the consumer and company.

9
Understanding and defining friction
The traditional path to purchase is undergoing a
transformation with the advent of technology, smartphones
and digital assistants, and is expected to be replaced by
personalised journeys.
Today’s consumer expects and demands convenience,
speed, automation and simplicity that were not possible a few
years ago. Any unnecessary additional effort, incremental
steps or inconvenience that leads the consumers to abandon
their purchase journey is defined as ‘friction’.
Friction may occur offline or online, and includes subjecting
consumers to unnecessarily wait, queue, click, type, tap, add
information or fill-in forms. On their journey, they may also
have to load, buffer, switch channels/windows or hold for
service. It can hinder efficiency and impact the consumer
experience, adversely affecting the consumer purchase
journey. Any friction primarily caused by a media touchpoint is
defined as ‘media friction’.
Research shows that consumer pain points that lead to friction
can occur across three main stages of the consumer journey:
awareness, consideration and intent. Businesses may be
offering friction unknowingly, hindering efficiency and, in turn,
the consumer journey.
Awareness friction: Every touchpoint or missing touchpoint
that requires the consumers to make any effort to discover a
brand
Consideration friction: Every touchpoint or missing touchpoint
that requires the consumers to make any effort to consider a
brand
Intent friction: Every touchpoint or missing touchpoint that
requires the consumers to make any effort to purchase a
brand
Awareness
Consideration
Intent
Buyer
Discovering the
product and identifying
the need
Gathering information and
decision-making parameters
to narrow down the
consideration set
Displaying realistic intention
to understand the purchase
process
Completing the transaction
Buyer
Post
purchase
Consideration
friction
Intent friction
First-time purchaser of a financial
product: credit card, loan or insurance
Repeat purchaser of a financial product: credit card, loan or
insurance
Potential buyer
Path to purchase
Awareness
friction

10
Decoding a financial product buyer’s journey and friction across purchase stages
• The consumer is targeted with an advertisement (ad) that is not relevant to him/her
• The consumer observes an ad which is difficult to understand
• Financial institute brand/aggregator is not able to guide the consumer with the next steps
• Ad content is not catching consumers’ attention in terms of value/benefits
• Banks/NBFCs offer standardised products without any customisation
Friction in financial services journey
• Product comparison in terms of premium/EMI options and interest rates is not possible
• Policy rates/product information vary online and offline
• Consumers are unable to assess eligibility for product purchase
• Comparison on terms and conditions is time consuming
• Expert advice for understanding policy/loan terms and conditions is unavailable to consumers
• Preferred payment options such as EMIs and digital wallets are not possible• Response time from banks/NBFCs to address a consumer’s purchase
interest is slow• Consumers are unable to understand the fine print of the financial product• Bank/NBFC representatives could not address consumers’ queries• There is lack of trust/poor experience with the banks/NBFCs
Identify needs
Discover products
Research product
Compare financial product
Seek opinions
Visit bank/NBFCs
Understand terms and conditions
Visitaggregator
Understand after-sales services
Compare financing/payment
options
Recommend/Review
Contact customer service
Awareness
Consideration
Intent
Purchase
Postpurchase

11

12

13
Credit cards Insurance Loans

14
Friction Decoded —
Scope of Opportunity

15

16
• Deep dive is only among 40 per cent of the population who are ‘aware decision makers and
influencers’ for the ‘Credit Card' category
• At the intent stage, only banks/NBFCs and online touchpoints were evaluated in the media mix
to calculate friction
Buyers: Respondents who have applied/tried to apply for a credit card in the last six months
Considerers: Respondents who have considered applying for a credit card in the last six months, but are yet to apply
Aware non-considerers: Respondents who have not considered applying for a credit card in the last six months
Base = 325
As per the study conducted, 40 per cent of the prospects were actively planning to apply for a credit card. However, only 1 out of 4 consumers who enter the
purchase funnel, actually makes the purchase. The credit cards category shows a low purchase conversion rate of 11 per cent. Almost 50 per cent of the consumer
dropouts occur right at the top of the funnel. Almost 1 out of every 3 consumer dropouts occurs due to media friction. The reasons for these dropouts have been
discussed further in the report.
8%
15%
6%
Media
friction
5%
4%
2%
29% 11%
Total
friction
Awareness
friction
Consideration
Intent
Purchase
Consideration
friction
Intent
friction
40%
25%
17%
11%
Total population – 100%
Aware decision makers
and influencers
= =
60%
Media friction accounts for nearly one-third of the total friction in the credit card purchase journey
Consumers who are non-decision
makers or non-influencers
Overall friction
Credit
cards

17
Mobile could help credit card brands tap into a potential sales opportunity of ~USD38 billion by reducing media friction
Friction can impact marketing ROI and significantly hit a brand’s bottom line. The study suggests that nearly 1 out of 3 consumer dropouts of the purchase
journey takes place due to media friction. However, mobile has the potential to reduce media friction by 3 percentage points, creating a potential sales
opportunity of about USD38 billion[1][2]. Currently, nearly 3 out of 5 credit card purchases are influenced by mobile, and by 2022 nearly 4 out of 5 credit card
purchases would be mobile influenced[3]. Hence, it becomes imperative for marketers to strengthen their media mix by having a larger share of marketing
activities on mobile. Brands can reduce the impact of media friction by enhancing their media mix.
Note: Potential opportunity by KPMG in India is based on the potential reduction in consumer dropout. Modelling for reduction in dropouts is based on
the potential friction reduction, which may get impacted due to the usage of mobile-based media.
*This number can be achieved by reducing the friction, thus increasing the addressable market opportunity
Source:
[1] Forecast of Personal credit cards in India, Euromonitor, July 2018
[2] [3]KPMG in India's analysis, 2018 based on data obtained from multiple industry reports and primary survey conducted by Nielsen, 2018
By reducing media friction with mobile, credit card brands can tap into
~USD38 billion* transaction opportunity
11% 8%
2017 2022eEnhancing
mobile in
media mix
Media friction observed in purchase journey
Estimated media friction in purchase journey
Credit
cards

18
Friction Mapping—
Understanding
Friction

19

20
About 80 per cent media-led friction is observed at the awareness (5 per cent) and intent (4 per cent) stages. It is observed that TV as a medium offers less
friction at the top of the funnel due to the emotional appeal of the ads, which is in contrast to the more factual-based digital communication/ads. As per the
study, women face more inconvenience on digital medium leading to higher digital friction for the category at the awareness stage. At the consideration
stage, a lower digital friction score compared to print and outdoor suggests that consumers compare and research the best product fit through company and
aggregator websites, leading to more qualified leads for the brands. To enhance the impact of digital medium, brands can create differentiated
communication for both genders and focus on creating digital-only content.
Buyers: Respondents who have applied/tried to apply for a credit card in the last six months
Considerers: Respondents who have considered applying for a credit card in the last six months, but are yet
to apply
Aware non-considerers: Respondents who have not considered applying for a credit card in the last six
months
*Online includes the top five media touchpoints accessed by respondents at the respective stage of the
journey
• Deep dive is only among 40 per cent of the population who are ‘Aware decision makers
and influencers’ for the ‘Credit Card' category
• At the intent stage, only banks/NBFCs and online touchpoints were evaluated in the
media mix to calculate friction
Media
friction
5%
4%
2%
11%
Consideration
Intent
40%
17%
Purchase
Consideration
friction
Intent
friction
25%
11%
Total population – 100%
Awareness
friction
Aware decision makers
and influencers
=
Print and outdoor lead to maximum dropouts at the consideration stage of the credit card purchase journey
Overall media frictionBase = 325
29% 38% 50%40% 58%30%
30% 88% 93%33% 55%31%
76%66%
Outdoor PrintTV Digital medium Branch Radio
Outdoor PrintTV Digital medium Branch Radio
Digital medium Branch
Friction scores
Credit
cards

21
Despite high marketing focus by credit card brands towards men[1], a substantial number of women consumers enter the credit card purchase journey, which
makes them a lucrative consumer segment for brands. Women face high top-of-the-funnel friction as they seek better product targeting and information
customised to suit their financial needs. The digital medium has the potential to personalise and customise communication for different segments and can be
leveraged to target women audience. Towards the bottom of the funnel, women seek information from trusted sources and query resolution by the brand
representative whereas men expect prompt response from the brand to address their interest expressed towards the purchase of credit cards. Communicating
support centre numbers to ensure consumers do not miss the support centre calls and training support staff to address the queries of female consumers can
help reduce friction.
23%
6%
7%
Male Female
Prospect does not know what to do next after watching ads
Prospect did not pay enough attention to ads
Prospect did not find it easy to browse/find information
Offer communication is not clear to prospect
It took too long for the brand to contact the prospect and the need lapsed
Prospect found it difficult to express interest
9%
5%
8%
Prospect did not trust the medium of information
Representative could not address all the queries; prospect expressed interest but did not get response from banks/NBFCs
Prospect did not pay enough attention to ads
Prospect finds too little information from ads
Prospect did not find it easy to browse/find information
Limited trust on the source of information
Note: At the intent stage, only banks/NBFCs and online touchpoints were evaluated in the media mix to calculate friction
=36%
=22%
Aware decision makers
and influencers
Consideration
Intent
Purchase
Consideration
friction
Intent friction
29%
20%
12%
7%
Awareness
friction
Consideration
friction
Intent friction
50%
27%
20%
14%
Awareness
friction
Men seek prompt response for their queries, while women exhibit lack of trust on the source of information
Legend
Outdoor Print Television Digital medium*
Top friction media points
Banks/NBFCs Radio
Media friction (%)
Media friction (%)
Media friction (%)
Media friction (%)
Media friction (%)
Media friction (%)
Source: [1] Women are not a target market’: Confessions of a former finance marketer, Digiday, March 2018
14% 14%
38%38%
29% 17%
22% 20%
34%37%
6% 23%
Total population – 100%
Credit
cards

22
The 25–34 year-old consumers face the highest friction (34 per cent) throughout the purchase journey, primarily at the top of the funnel (20 per cent). Such consumers are new entrants in the workforce and seek detailed communication to understand the product. Slow turn-around time by brands to reach out to them can lead to dropouts. Comparatively, the 35–49 year-olds are an aware and evolved audience, who are existing credit card users. They use credit cards for big ticket purchases or traditional uses such as ‘mortgage costs’, ‘childcare expenses’ or ‘emergency funds’ and actively look out for offers. However, this segment faces trust issues at the intent stage as they are used to relationship-based banking. Hence, brands need to replicate an offline experience on the digital medium to facilitate their online purchase journey.
Friction points for 35–49 years
Prospect did not pay enough
attention to ads
Prospect does not know what to do
next after watching ads
Prospect did not find it easy to
browse/find information
Offer communication is not
clear to prospect
It took too long for the brand to
contact the prospect and the need
lapsed
Prospect did not trust the medium
of information
Friction points for 18–24 years
Prospect did not pay enough
attention to ads
Prospect finds too little information
from ads
Prospect did not find it easy to
browse/find information
Prospect did not get all the
relevant information
It took too long for the brand to
contact the prospect and the
need lapsed
Representative could not address
prospect's queries
Consideration
Intent
43%
23%
16%
Purchase
9%
40%
29%
20%
14%
25–34 years
9%
6%
35–49 years
Aware decision
makers and influencers
Total population
100%
Total population
100%
20%
7%
7%
= =26%34%
11%
Legend
Outdoor Print Television Digital medium*
Media with highest contribution to top-two friction points
Banks/NBFCs Radio
Note: At the intent stage, only banks/NBFCs and online touchpoints were evaluated in the media mix to calculate friction
Note: Excluding 18–24 year age group as they are not a key target segment for credit cards because of their low credit rating
since they are yet not a part of the earning segment
17% 19%
35%20%
18% 25%
13% 14%
26% 21%
41%40%
Credit
cards
Consumers in the 25–34 year age group need product understanding, while the consumers in the 35–49 year age group seek trusted online experience

23
Credit
cards
NCCS A consumers seek prompt response from banks while NCCS B consumers seek query resolution and reassurance for their purchase decision
NCCS A and NCCS B consumers face similar friction at the top of the funnel due to the print and outdoor mediums. Targeted communications at this stage can considerably reduce friction, and the digital medium can play a vital role in effectively targeting the segments. NCCS A consumers have a 1.5 times higher credit card purchase conversion rate than NCCS B consumers. This higher conversion rate for NCCS A consumers is mainly attributable to better financial literacy, credit awareness and better exposure to financial products. NCCS A consumers face friction at the intent stage as brands fail to swiftly address consumer queries leading to drop outs. NCCS B consumers depend on representative interaction to get reassurance on their financial decisions. Delayed responses and the inability of representatives to address queries are the key friction points at the intent stage for NCCS B consumers.
16%
7%
8%
Prospect did not pay enough
attention to ads
Prospect does not know what
to do next after watching ads
Prospect did not find it easy to
browse/find information
Offer communication is not clear
to prospect
It took too long for the brand to contact the prospect and the need lapsed
Prospect did not trust the medium of information
17%
4%
5%
Representative could not
address prospect's queries
Prospect expressed interest but
did not get response from the
banks/NBFCs
Prospect did not pay enough
attention to ads
Prospect does not know what to do
next after watching ads and finds
little information from ads
Prospect did not find it easy to
browse/find information
Offer communication is not clear
to prospect; prospect was not
given all the relevant information
Note: At the intent stage, only banks/NBFCs and online touchpoints were evaluated in the media mix to calculate friction
=31%
=26%
Aware decision makers
and influencers
Consideration
Intent
Purchase
Consideration
friction
Intent friction
33%
16%
11%
7%
Awareness
friction
Consideration
friction
Intent friction
45%
29%
21%
14%
Awareness
friction
Media friction (%)
NCCS A NCCS B
Media friction (%)
Legend
Outdoor Print Television Digital medium*
Media with highest contribution to top-two friction points
Banks/NBFCs Radio
Media friction (%)
Media friction (%)
Media friction (%)
Media friction (%)
16% 17%
35%34%
15% 20%
16% 14%
29%30%
28% 19%
Total population – 100%

24
Standard messaging on traditional mediums such as outdoor and print fails to capture consumers’ attention, and their inability to provide information on the next steps leads to maximum dropouts. The low emotional appeal of online advertisements, along with the difficulty in understanding the technical terms associated, contribute to the friction on the online medium. However, the online medium has the potential to address these friction areas. For instance, the Commonwealth Bank of Australia has developed interesting original and easy-to-understand content to tell their brand story and connect with consumers. In one of the brand communication videos titled, ‘The Psychology of Savings’, Commonwealth has crafted a message to encourage consumers to start saving more money[1]. In order to develop brand awareness, the banks should aim to create content that is interesting, engaging, relevant and most of all easy to understand.
Consumers seek engaging, relevant and simplified communication at the awareness stage
Awareness
Consideration
Intent
PurchaseTop friction points Television Print Outdoor Radio
Banks/
NBFCsOnline*
Prospect did not pay enough attention
to ads
Prospect does not know what to do next
after watching ads
Prospect finds too little information from
ads
Product was not relevant to the
prospect
Prospect did not understand the
language of the ads
31%
24%
23%
19%
18%
10% 24% 14% 13%16% 5%
18% 10% 9% 12%20% 5%
5% 8% 8% 13%9% 2%
3% 0% 2% 12%4% 5%
3% 7% 5% 12%7% 1%
Credit cards: Awareness friction
Credit
cards
Medium causing high friction
* Online includes the top five media touchpoints accessed by respondents at the respective stage of the journey
Percentage of respondents experiencing the mentioned
friction in the respective media touchpoints%
[1] ‘9-bank-marketing-ideas-for-2017’, enplug.com, March 2017
Media with the lowest to highest friction for the given friction point

25
The purchase consideration may be adversely impacted if consumers do not get detailed product communication including product offers, or if they do not trust the medium of communication. Often due to multiple brand communications, consumers find it difficult to distinguish brands and their products. Standard and cluttered messaging by multiple brands on traditional mediums such as print and outdoor results in consumer drop outs at the consideration stage.
Canada-based TD Bank supported its consumer-first approach by creating a campaign called #TDThanksYou to connect and communicate effectively with consumers on its personalised products and services, thereby presenting itself as a bank that understands consumers. Its team captured consumer reactions to the unexpected services provided, which resulted in a viral video on social media[1]. Customised creatives can potentially break clutter and help brands define themselves more distinctly in the marketplace.
Unclear offer communication and lack of trust for the medium cause friction at this stage
Awareness
Consideration
Intent
PurchaseTop friction points Television Print Outdoor Radio
Banks/
NBFCsOnline*
Prospect finds it difficult to
browse/find information
Offer communication is unclear to
prospect
Prospect does not trust the medium
as source of information
Prospect does not get all the required
information
Difficult to distinguish financial
institutions
Credit cards: Consideration friction
4% 8% 67% 12%50% 2%
10% 54% 5% 9%19% 5%
3% 38% 7% 12%23% 2%
3% 12% 7% 10%7% 1%
4% 5% 2% 12%6% 5%
38%
26%
23%
22%
19%
Credit
cards
*Online includes the top five media touchpoints accessed by respondents at the respective stage of the journey
Percentage of respondents experiencing the mentioned
friction in respective media touchpoints%
[1] ‘9-bank-marketing-ideas-for-2017’, enplug.com, March 2017
Medium causing high friction
Media with the lowest to the highest friction for the given friction point

26
At the bottom of the funnel, when consumers are looking at closing the transaction they find generic scripted responses from call centres inadequate and do not trust the information provided. An instant pop-up chat box on the website or a chat bot-powered medium can immediately assist consumer queries and connect the branch directly to the prospect. Sharing information from a verified brand handle (website/bots, etc.) helps in gaining the trust of consumers. consumers should also be updated regarding the progress of their application so that they can track their request and get an estimated time of approval.
Slow response time and inept query resolution by providers lead to drop outs closer to the purchase
Top friction pointsBanks/
NBFCsOnline*
It took too long for the brand to contact the prospect and the need lapsed
Representative could not address
all queries
Prospect did not trust the medium
of information
Prospect found it difficult to express
interest
Prospect could not connect with provider directly via branch/website
33%
29%
28%
26%
25%
Credit cards: Intent friction
32%
18%
16%
13%
14%
20%
5%
4%
13%
3%
Awareness
Consideration
Intent
Purchase
Credit
cards
Note: At the intent stage, only banks/NBFCs and online touchpoints were evaluated in the media mix to calculate friction
Percentage of respondents experiencing the mentioned friction in the respective media touchpoints%
* Online includes the top five media touchpoints accessed by respondents at the respective stage of the journey
Media with the lowest to the highest friction for the given friction point

27
Immediate application initiation and convenience of location of a bank branch are the key factors influencing the offline purchase of a credit card. By
strategically leveraging consumer-friendly digital technologies and adopting omni-channel strategies, brands can either replicate or complement the offline
experience to enhance consumer experience. For instance, online issuance of credit cards, migrating Know Your Customer (KYC) documentation
procedures online and eliminating the need for consumers to visit the bank branch for formalities could, in effect, reduce the number of visits to the bank,
while enriching the experience and engagement of the buyer with the brand. Brands can thus engage with consumers after the purchase and ease the
process of sharing their experiences on social media, thereby building a positive brand image.
Anytime application to purchase credit card and better credit card offers are the key drivers of online influence
Purchase channel
preferencePost purchase
activities
53%
50%
Recommended the
purchase to friends and
family members on
social media
55%Wrote reviews for the
product online on a
shopping site/website
Anytime application 72%
Better purchase deals on
other mediums61%
Easy product comparison 61%
Immediate availability of
product61%
Convenience of
branch location35%
Websites take too long to
load/websites are too slow31%
What
lacks in
offline?
Spoke about the
products purchased on
social media
What
lacks in
online?
Credit
cards

28
Friction Busting —
Increasing the Sales
Opportunity with
Mobile

29

30
The number of mobile internet users in India is expected to reach 677 million in 2022, from 420 million in 2017[1]. By 2022, Facebook influence on credit card purchases is likely to grow at a faster pace of nearly 1.5 times compared to mobile influence at nearly 1.3 times [2][3]. Brands have a potential sales opportunity of USD46 billion*, which will be mobile and Facebook influenced. Brands may consider redesigning their media mix to accommodate the influence of mobile on credit card purchases.
By 2022, mobile is expected to influence about 8 out of 10 credit card purchases
*This number can be achieved by reducing the friction, thus increasing the addressable market opportunity
Sources:
[1] Internet users to touch 420 million by June 2017: IAMAI report, The Economic Times, May 2017; Internet users in India expected to reach 500 million by June: IAMAI, Economic Times, February 2018;
eMarketer Forecasts Strong Growth in Facebook Users in India, eMarketer, June 2017
[2] Forecast Personal Credit Cards, Euromonitor, July, 2018; KPMG in India's analysis 2018 based on data obtained from multiple industry reports and primary survey conducted by Nielsen, 2018
Mobile influence
2017 2022e[2 ]
USD37
billion
62%
62%
75%
64%
76%
77%
87%
78%Average
influence
Awareness
Consideration
Intent
Incremental
sales
opportunity
USD46 billion1.25x
Credit
cards
Facebook influence
2017 2022e[2]
24%
18%
26%
23%
35%
28%
37%
33%Average
influence
Awareness
Consideration
Intent
Incremental
sales
opportunity
1.46x
USD13
billion
USD19 billion

31
User-friendly mobile-based platforms may help consumers with requisite information, easy application processes and convenience in product selection. Also,
with personalised offers and targeting, brands can provide highly relevant offers and discounts, reward points, cashbacks and gifts, tempting consumers to
apply. This study suggests that mobile purchase journeys are ~22 per cent shorter than offline-influenced journeys, helping marketers save considerably in
acquiring new consumers.
Mobile-heavy purchase journeys are ~22 per cent shorter than offline-influenced journeys for the credit card category
Note: *Offline-influenced journeys involve the use of at least one offline medium in the purchase journey
Mobile compacts
journeys
Mobile-influenced journeys are ~22 per cent
shorter than offline-influenced* journeys
Credit
cards

32
Methodology — friction reduction by enhancing the media mix
Interpret media-related friction individually at each stage of the journey — awareness, consideration and intent
Calculate the potential friction reduction opportunity for areas where mobile can help bring down friction
Calculate the potential opportunity for a brand to reduce friction in the future by enhancing mobile in the media mix
Recommend feasible and scalable approaches based on the identified friction areas and possibility of technology fitment

33
Source: KPMG in India’s Analysis, 2018 based on primary survey conducted by Nielsen, 2018
For all three stages - awareness, consideration and intent - the reduction in friction on offline media is based on the weighted average of friction scores for all online media, obtained from primary research.
The calculation took into account the reduction in friction that could be achieved if offline friction percentages are replaced with the weighted averages of online media. It has been assumed that the values of online media
can be used as a proxy for mobiles since more than 90 per cent of the online usage takes place via mobile devices.
2017
Media
friction
2022e
Media
friction
Friction points 2022e
Media
friction
2017
Media
friction
Friction points Friction points23% 36% 28%
Awareness friction Consideration friction Intent friction
2017
Media
friction
2022e
Media
friction
Mobile has the potential to reduce friction by 3 percentage points across the purchase journey for credit cards
No expert advice/answers
available
Offered communication
unclear to the prospect
Prospect does not trust the
medium as the source of
information
Prospect finds it difficult to
browse/find information
Prospect does not get
the relevant information
Difficult to distinguish financial
institutions
Prospect does not have enough
information for eligibility
Prospect does not know what
to do next after watching ads
Prospect does not pay enough
attention to ads
Prospect finds the ad
intrusive
Prospect finds too little
information from ads
Prospect did not trust the
medium of information
Ads not appealing
for the prospect
Prospect did not understand
the language of the ads
Product/brand was not
relevant to the prospect
Irrelevant offers or ads
sent
28%
24%
22%
16%
52%
20%
13%
18%
22%
52%
42%
40%
50%
21%
14%
18%
Representative could not
address prospect's queries
Prospect did not trust the
medium of information
Prospect expressed interest
but did not get a response
from the banks/NBFCs
Prospects not able to easily connect with the provider directly via branch/website/page/call-centre
Prospect not given
all relevant content
Prospect could not
express interest
It took too long for the brand to
contact the prospect and the
need lapsed
30%
33%
26%
20%
27%
26%
29%

34
A ~USD38 billion* opportunity can be generated within brands by improving the media efficiency with mobile-based solutions for the credit card category.
This can create value for credit card brands by increasing credit card purchases and their subsequent transactions. Compared to traditional mediums, mobile
is also expected to increase efficiency in the consumer acquisition spend by up to ~21 per cent.
Mobile in the media mix can help brands tap into ~USD38 billion transaction value opportunity and bring in efficiency in the customer acquisition cost by ~21 per cent for credit cards
~USD38 billion* Opportunity for the brands
~21% Efficiency in customer
acquisition cost by moving
spends from traditional media
such as print, outdoor and
radio to mobile
Awareness
Consideration
Intent
Purchase
2022e
8%
4%
1%
3%
2017
11%
5%
4%
2%
3 percentage
points
20%
reduction
in friction
50%
reduction
in friction
25%
reduction
in friction
Awareness
friction
Consideration
friction
Intent friction
Reduction
in friction
Credit
cards
*This number can be achieved by reducing the friction, thus increasing the addressable market opportunity
*Source: Digital Advertising in India 2018, Dentsu Aegis Network; RBI Bank-wise card statistics, RBI, 2018;
Forecast personal credit cards — Number of cards in circulation 2017–2022, Euromonitor, 2018; RBI Bank-
wise card statistics, RBI, 2018; KPMG in India's analysis 2018 based on data obtained from multiple industry
reports and primary survey conducted by Nielsen, 2018
Methodology: The projection is based on estimated ratio of average cost of consumer acquisition for online
and offline media in the FinServ industry. The ratio is assumed to be consistent in 2022, and is used to
project incremental spend on mobile-based digital advertisement to tap the USD38 billion transaction
opportunity.

35
Mobile-influenced opportunity of about USD84 billion in credit cards
2017 2022e
Market
opportunity
through
media
friction
reduction
Mobile-
influenced
market
*This number can be achieved by reducing the friction, thus increasing the addressable market opportunity
~USD84 billion
Credit cards
Credit cards
USD37
billion
Credit cards
USD46
billion
USD38
billion*
Mobile in the media mix can create value for credit card brands by increasing credit card purchases and their subsequent transactions. Enhancing mobile can create a
combined opportunity of USD84 billion by influencing credit card purchases and reducing media friction in consumers’ purchase journey.
Credit
cards

36

37

38

39
Credit cards
Insurance
Loans
This category includes policies that pay out a sum of money
either on the death of the insured person or after a
set period
Other insurance includes auto and health insurance excluding any commercial
insurance
Other insurance
Life insurance

40
Friction Decoded —Scope of Opportunity

41

42
Other insurance
Insurance is still a ‘push product’ in India. The study suggests that, while 1 out of 2 consumers enter the purchase journey, only 1 out of 5 actually completes the purchase
journey for both life insurance and other insurance. More than 60 per cent of consumer drop outs occur at the top of the funnel due the media friction for both life and other
insurance. 1 out of 2 consumer drop outs across the insurance purchase journey is due to media leading to a loss of revenue for the brands.
Media friction accounts for nearly half of the total friction in the life insurance and other insurance purchase journeys
Consumers who are non-decision makers or
non-influencers
Aware decision makers and influencers
Consideration
Intent
26%
18%
Purchase
12%
Total friction Media friction
51%
9%
5%
2%
Awareness
friction
Consideration
friction
Intent
friction
16%Overall friction
49%
23%
8%
6%
37%
Base = 191
==
Total population – 100%
Media friction Total friction
24%
7%
7%
38%
10%
2%
6%
18%
==
Awareness
friction
Consideration
friction
Intent
friction
Overall friction
Base = 203
51%Consumers who are non-decision makers
or non-influencers
25%
18%
11%
49%
Total population – 100%
• Deep dive is only among 49 per cent of the population who are ‘Aware decision makers and
influencers’ for the ‘Insurance' category
• At the intent stage, only banks/NBFCs and online touchpoints were evaluated in the media mix to
calculate friction
Buyers: Respondents who have purchased/tried to purchase an insurance policy in the last six months
Considerers: Respondents who have considered purchasing an insurance policy in the last six months but are yet to apply
Aware non-considerers: Respondents who have not considered purchasing a policy in the last six months
Life insurance

43
Other insurance
Mobile could help insurance brands tap into a potential sales opportunity of ~USD70 billion by reducing media friction
Friction can result in reduced sales, thus impacting the overall revenue for a brand. The study suggests that nearly 2 out of 5 consumers drop out of the insurance purchase
journey due to friction, with media contributing to more than 50 per cent of those drop outs. Mobile has the potential to reduce friction by 5 percentage points each for life
insurance and other insurance, creating a potential premium income opportunity of USD54 billion and USD16 billion, respectively. Hence, it becomes imperative for marketers to
strengthen their media mix by having a larger share of marketing activities on mobile, thereby reducing media friction.
By reducing media friction with mobile, life insurance brands
can tap into ~USD54 billion* opportunity
Media friction
observed in
purchase
journey 18%
2017 2022eUse of
mobile in
media mix
Media friction
observed in
purchase
journey 13%
By reducing media friction with mobile, other insurance
brands can tap into ~USD16 billion* of opportunity
Media friction
observed in
purchase
journey 16%
2017 2022eUse of
mobile in
media mix
Media friction
observed in
purchase
journey 11%
~USD70 billion* opportunity
Note: Potential opportunity by KPMG in India is based on the potential reduction in consumer drop out. Modelling for reduction in drop outs is based on the potential friction reduction, which may get
impacted due to the usage of mobile-based media.
*This number can be achieved by reducing the friction, thus increasing the addressable market opportunity
Source:
[1] IRDA Annual report 2016–17, www.irdai.gov.in, July 2018
[2] KPMG in India's analysis, 2018 based on data obtained from multiple industry reports and primary survey conducted by Nielsen, 2018
Life insurance

44
Friction Mapping—
Understanding
Friction

45

46
Other insurance
Insurance is a dynamic product which varies from person to person, hence standardised communication through mass mediums such as radio, outdoor, print and television can
create awareness but may not be convincing to consumers to make a purchase. Digital channels are dynamic and convenient mediums to browse, compare information and buy
insurance products. However, both branch and digital mediums show high friction at the intent stage, primarily due to miss-selling by agents or brokers to push high commission
products, while sidelining consumer needs.
Digital medium offers less friction over outdoor and print mediums at the consideration stage for other insurance
Intent
friction
Consideration
friction
Consideration
friction
Aware decision makers
and influencers
Consideration
Intent
25%
18%
Purchase
11%
Media
friction
9%
5%
2%
• Deep dive is only among 49 per cent of the population who are ‘Aware decision makers and
influencers’ for the ‘Insurance' category
• At the intent stage, only banks/NBFCs and online touchpoints were evaluated in the media mix
to calculate friction
Buyers: Respondents who have purchased/tried to purchase an insurance policy in the last six months
Considerers: Respondents who have considered purchasing an insurance policy in the last six months but are yet to
apply
Aware non-considerers: Respondents who have not considered purchasing a policy in the last six months
Intent
friction
16%Overall media
friction
49%
Base = 191
43%
79%66% =
* Online includes top five media touchpoints accessed by respondents at respective stage of the journey
TV
54%
57%
Digital
49%
Outdoor
29%
Branch
60%
Radio
DigitalBranch
TV
44%
45%
Outdoor
75%
Radio
45%
Digital
58%
Branch
38%
Awareness
friction
Awareness
friction
Media
friction
10%
6%
2%
18%
=Overall media
friction
26%
18%
12%
49%
Base = 203
Total population – 100%
Life insurance
73%60%
42%
TV
58%
59%
Digital
52%
Outdoor
24%
Branch
53%
Radio
31%
TV
52%
50%
Digital
79%
Outdoor
32%
Branch
48%
Radio
DigitalBranch
Friction scoresFriction scores

47

48
While a larger number of men enter the life insurance purchase funnel, women have a better purchase conversion rate than men. This suggests an opportunity for brands to target women. Women perceive insurance to be valuable, and their dropout rate along the consumer journey is lower in insurance compared to other products such as credit cards. Life insurance providers and aggregators can expand their women-specific product offerings to target salaried women and even those on a temporary work break. Assistance with understanding financial products, targeted promotions and quick response time by agents or insurance companies to their queries can increase women’s policy purchase rate.
36%
7%
5%
Male Female
Prospect finds too much/too little information from ads
Prospect did not pay enough attention to ads
Prospect did not find it easy to browse/find information
No expert advice/answers available
It took too long for the brand to contact the prospect and the need lapsed
Prospect did not trust the medium of information
9%
9%
9%
It took too long for the brand to contact the prospect and the need lapsed
Representative could not address all the queries
Prospect finds too much/too little information from ads
Prospect did not pay enough attention to ads
Offer communication is not clear to prospect
Prospect did not find it easy to browse/find information
Note: At the intent stage, only banks/NBFCs and online touchpoints were evaluated in the media mix to calculate friction
=48%
=27%
Aware decision makers
and influencers
Consideration
Intent
Purchase
Consideration
friction
Intent friction
38%
29%
20%
11%
Awareness
friction
Consideration
friction
Intent friction
59%
23%
18%
11%
Awareness
friction
Women have a better purchase conversion rate than men for life insurance policies
Legend
Outdoor Print Television Digital medium*
Media with highest contribution to top-two friction points
Banks/NBFCs Radio
Media friction (%)
Media friction (%)
Media friction (%)
Media friction (%)
Media friction (%)
Media friction (%)
13% 15% 26% 24%
40%18% 25%25%
17% 24% 29% 25%
Total population – 100%
Life insurance

49
Similar to the life insurance category, purchase conversion for both men and women is similar, despite fewer women entering the purchase funnel. Men face almost 80 per cent of the friction at the top of the funnel, while women face almost 50 per cent of the friction at the consideration stage. Unlike life insurance which is a one-time purchase, other insurance products require renewal. Hence, offer communications for other insurance is sought out by consumers. Men seek detailed information to assess the insurance and compare its utility with options such as index-linked insurance plans, especially when purchasing products with maturity benefits. Women’s purchase considerations are triggered by life events such as childbirth, and they actively seek expert assistance and clear offer communication at the consideration stage.
36%
5%
6%
Male Female
Prospect did not pay enough attention to ads
Prospect finds too much/too little information from ads
Prospect did not find it easy to browse/find information
Offer communication is not clear to prospect
It took too long for the brand to contact the prospect and the need lapsed
Prospect found it difficult to express interest
6%
8%
12%
Prospect was not able to easily connect to provider directly via branch/website
Prospect did not trust the medium of information
Prospect did not pay enough attention to ads
Prospect does not know what to do next after watching ads
Offer communication is not clear to prospect
No expert advice/answers available
Note: At the intent stage, only banks/NBFCs and online touchpoints were evaluated in the media mix to calculate friction
=47%
=26%
Aware decision makers
and influencers
Consideration
Intent
Purchase
Consideration
friction
Intent friction
38%
32%
20%
12%
Awareness
friction
Consideration
friction
Intent friction
59%
23%
17%
12%
Awareness
friction
Both men and women actively look out for offers when considering insurance purchase , however, women’s purchase journeys are triggered by life events
Legend
Outdoor Print Television Digital medium*
Media with highest contribution to top-two friction points
Banks/NBFCs Radio
Media friction (%)
Media friction (%)
Media friction (%)
Media friction (%)
Media friction (%)
Media friction (%)
15% 15%
17%
29%26%
15%
30% 25%
32%33%
11% 25%
Total population – 100%
Other insurance

50
While fewer consumers in the age group of 25–34 years enter the life insurance purchase funnel, they are more likely to purchase an insurance
than those in the age group of 35–49 years. The consumers in the age group of 25–34 years are the ‘early earners’ beginning to manage their
financial investments and they seek detailed and relevant product information for guidance towards a purchase. 35–49 years-old consumers are
more category aware and actively look out for better policy offers and seek advice to make a purchase. This segment is also more used to
relationship-based financial services. Assisted online sales can churn better conversion rates for consumers aged 35–49 years, while targeted
product communication with a quick call to action to purchase requests can increase purchase conversions for consumers aged 25–34 years.
Friction points for 35–49 years
Prospect finds too little information
from ads
Prospect does not know what to do
next after watching ads
Prospect did not find it easy to
browse/find information
No expert advice/answers
available; offer communication is
not clear to the prospect
It took too long for the brand to
contact the prospect and the need
lapsed
Prospect did not trust the medium
of information
Friction points for 25–34 years
Prospect finds too little information
from ads
Prospect did not pay enough attention
to ads; product/brand was not
relevant to the prospect
Prospect did not get all the relevant
information
Prospect did not find it easy to
browse/find information
It took too long for the brand to
contact the prospect and the need
lapsed
Prospect did not trust the medium of
information
Consideration
Intent
49%
27%
22%
Purchase
14%
56%
24%
17%
9%
25–34 years
7%
8%
35–49 years
Aware decision makers
and influencers
Total population
100%
Total population
100%
22%
5%
8%
= =47%35%
11%
Consumers in the age group of 25–34 years are more likely to purchase life insurance if provided with detailed product communication with a quick call to action
Legend
Outdoor Print Television Digital medium*
Media with highest contribution to top-two friction points
Banks/NBFCs Radio
Note: At the intent stage, only banks/NBFCs and online touchpoints were evaluated in the media mix to calculate friction
Note: Excluding the18–24 years old age group as they are not a key target segment for credit cards because of their low
credit rating since they are yet not a part of the earning segment
20% 21%
30%22%
23% 28%
15% 18%
27%17%
14% 20%
Life insurance

51
While consumers in the age group of 35–49 years are more active and aware insurance decision makers, those in the age group of 25–34 years have
a better policy purchase rate. The 25–34 year age group comprises young earners who are more inclined to make a policy purchase. This age group
seeks targeted product advertisement, product offers, and quick and prompt response from the insurer/representative to address their purchase
request.
Consumers aged over 35 are more aware and evolved purchase audience, and are aware decision makers and influencers. They actively look out for
offers, however, they face high friction at the top of the funnel due to premium affordability and lack of assistance in understanding the product.
Friction points for 35–49 years
Prospect did not pay enough
attention to ads
Prospect does not know what to
do next after watching ads;
prospect finds too little
information from ads
Prospect did not find it easy to
browse/find information
Offer communication is not
clear to prospect; no expert
advice/answers available
It took too long for the brand to
contact the prospect and the
need lapsed
Prospect found it difficult to
express interest
Friction points for 25–34 years
Prospect did not pay enough
attention to ads
Prospect found the ads to be
intrusive
Prospect did not find it easy to
browse/find information
Offer communication is not clear to
prospect
Prospect expressed interest but did
not get response from banks/NBFCs
Prospect could not connect with
provider directly via branch/website
Consideration
Intent
49%
29%
22%
Purchase
13%
56%
26%
18%
13%
25–34 years
8%
5%
35–49 years
Aware decision makers
and influencers
Total population
100%
Total population
100%
20%
7%
9%
= =43%36%
30%
Legend
Outdoor Print Television Digital medium*
Media with highest contribution to top-two friction points
Banks/NBFCs Radio
Note: At the intent stage, only banks/NBFCs and online touchpoints were evaluated in the media mix to calculate friction
22% 20%
29%28%
16% 20%
14% 16%
30%27%
28% 18%
Other insurance
25–34 year-olds are more likely to purchase a policy and actively seek product details and associated offers

52
NCCS A consumers purchase conversion is almost twice that of NCCS B consumers. However, more than 60 per cent of the friction for both categories occurs at the top of the funnel. NCCS A consumers are better placed with respect to financial exposure and hence they seek detailed information on products and offers to move ahead in their purchase journey. NCCS B consumers require more information to understand the product and relevant product advertising.
Limited trust on the medium in making financial decisions results in friction at the bottom of the funnel. Longer response time from agents and their inability to address consumer queries augments drop outs even further.
24%
8%
6%
Prospect finds too little information from ads
Prospect does not know what to do next after watching ads
Prospect did not find it easy to browse/find information
Offer communication is not clear to prospect
It took too long for the brand to contact the prospect and the need lapsed
Prospect did not trust the medium of information
27%
6%
7%
Prospect did not trust the medium of information
Representative could not address all queries
Prospect does not pay enough attention to ads
Prospect finds too little information from ads
Prospect did not find it easy to browse/find information
Prospect does not get all the relevant information
Note: At the intent stage, only banks/NBFCs and online touchpoints were evaluated in the media mix to calculate friction
=38%
=40%
Aware decision makers
and influencers
Consideration
Intent
Purchase
Consideration
friction
Intent friction
46%
19%
12%
6%
Awareness
friction
Consideration
friction
Intent friction
52%
28%
22%
14%
Awareness
friction
NCCS A consumers seek offer communication while NCCS B consumers seek relevant information
Legend
Outdoor Print Television Digital medium*
Media with highest contribution to top-two friction points
Banks/NBFCs Radio
Media friction (%)
Media friction (%)
Media friction (%)
Media friction (%)
Media friction (%)
Media friction (%)
16% 17%
36%32%
18% 22%
16% 16%
25%38%
6% 14%
Total population – 100%
NCCS A NCCS B
Life insurance

53
Both NCCS A and NCCS B consumers face high friction at the awareness stage. While NCCS A consumers are more category aware, they seek more product information to move ahead in the purchase journey. NCCS B consumers, on the other hand, need guidance right at the top of the funnel to move to the next step of the journey. NCCS A consumers are more digitally active when looking out for other insurance policies while NCCS B consumers seek trusted expert advice before they make the purchase and hence are more likely to be serviced by agents.
Other insurance such as travel insurance and motor insurance is often coupled with travel ticket and new vehicle purchases, and consumers are largely loyal to policy purchased at the point of sale. Hence, other insurance ads may go unnoticed unless brands try to catch consumers’ attention through competitive pricing, better policy services and seamless policy switching. Both NCCS A and NCCS B consumers actively look out for offers for other insurance polices.
26%
7%
8%
NCCS A NCCS B
Prospect finds too little information from ads
Prospect does not pay enough attention to ads
Prospect did not find it easy to browse/find information
Offer communication is unclear to prospect
It took too long for the brand to contact the prospect and the need lapsed
Prospect could not connect with provider directly via branch/website
19%
6%
8%
Prospect did not trust the medium of information
Representative could not address all queries
Prospect does not pay enough attention to ads
Prospect does not know what to do next after watching ads
Offer communication is not clear to prospect
No expert advice/answers available
Note: At the intent stage, only banks/NBFCs and online touchpoints were evaluated in the media mix to calculate friction
=41%
=33%
Aware decision makers
and influencers
Consideration
Intent
Purchase
Consideration
friction
Intent friction
46%
27%
19%
13%
Awareness
friction
Consideration
friction
Intent friction
52%
26%
18%
11%
Awareness
friction
NCCS A consumers seek availability of detailed product information while NCCS B consumers seek trusted advice and guidance to purchase
Legend
Outdoor Print Television Digital medium*
Media with highest contribution to top-two friction points
Banks/NBFCs Radio
Media friction (%)
Media friction (%)
Media friction (%)
Media friction (%)
Media friction (%)
Media friction (%)
17% 19%
39%30%
19% 18%
24% 23%
31%33%
19% 20%
Total population – 100%
Other insurance

54
Insurance: Awareness friction
Other insurance
Consumers seek detailed information to understand products such as life insurance and they seek ads that catch their attention in terms of product offers to purchase other insurance policies. Traditional mediums such as banks/NBFCs show low friction drop outs at the awareness stage as compared to other traditional mediums such as print, outdoor and radio. While radio presents high friction for life insurance communications due to its standard messaging, print advertisements for other insurance fail to catch consumers attention. Brands are increasingly customising insurance products to leverage the pervasive, faster, cost-effective online medium. However, consumers struggle with understanding complex financial jargons and figuring the next go-to steps. Customised communication, pop-up assistance to address a consumer’s interest can propel online sales. Friendsurance, a German insurer, is a unique aggregator leveraging social media to offer peer-to-peer insurance offering[1].The insurance provider receives a new mode of distribution, increasing its accessibility to attractive groups with a unique product offering.
Lack of a clear call to action and financial jargons can lead to friction for both life insurance and other insurance products
Online*Banks/
NBFCsRadio Outdoor Print Top friction points Print Outdoor Radio
Banks/
NBFCsOnline*
Prospect finds too
little information from
ads
Prospect did not pay
enough attention to
ads
Prospect does not
know what to do next
after watching ads
Prospect did not find
the ads to be
appealing
Prospect did not
understand the
language of the ads
Prospect found the
ads to be intrusive17%
TelevisionTelevision
• Online includes top five media touchpoints accessed by respondents at respective stage of the journey
[1] Friendsurance Germany makes insurance social again, The digital insurer, June 2018
Percentage of respondents experiencing the mentioned
friction in respective media touchpoints%
Awareness
Consideration
Intent
Purchase
18% 6% 13%10% 10%
8% 4% 18%12% 22%
11% 3% 4%2% 5%
8% 4% 0%24% 13%
6% 2% 4%10% 4%
9%
14%
4%
5%
4%
7% 0% 7%10% 17% 18% 15%15% 1%
5%5% 4%
18%1% 0%
4%6% 3%
5%10% 5%
9%
12%
10%
9%
7%
14%
10%26% 3%
12%
9%
8%
8%
7%
29%
15%
2%
4%
4%
9%
19%
29%
28%
24%
19%
19%
17%
25%
33%
26%
19%
18%
20%
Media with lowest to highest friction for the given friction point
Life insurance

55
Other insuranceLife insurance
Insurance: Consideration friction
Consumers depend on finding detailed product information on mediums and expert advice to purchase a policy. Due to the complexity associated with life insurance products,
consumers seek expert advice to decide on a purchase. Other insurance products are relatively easy to understand and consumers look out for product offers and compare products on
online medium. Hence, at the consideration stage, the best marketing response is clear communication, assisted online sales, and response to consumers’ queries or interest to build
consumer confidence. At this stage for life insurance, banks/NBFCs and representatives have emerged at the medium with the least friction as consumers get a personal assurance
while interacting with representatives in person. Other insurance categories such as automobile and travel are ahead in the digital purchase curve, closely followed by health insurance.
These insurance covers are digitally pervasive and can be purchased easily online. For example, disruptive business models in auto insurance leveraging telematics, such as usage-
based insurance (UBI), pay-as-you-drive (PAYD) and pay-how-you-drive (PHYD) by tracking drivers’ behaviour have made online medium a preferred channel for purchase.
Consumers look for relevant product information and assistance to conclude their insurance purchase considerations
Online*Banks/
NBFCsRadio Outdoor Print Top friction points Print Outdoor Radio
Banks/
NBFCsOnline*
Prospect finds it
difficult to browse/find
information
Prospect does not
get all the relevant
information
No expert
advice/answers
available
Offer communication
is not clear to
prospect
Prospect does not
trust the source for
information
Difficult to distinguish
financial institutions
TelevisionTelevision
• Online includes top five media touchpoints accessed by respondents at respective stage of the journey
Percentage of respondents experiencing the mentioned
friction in respective media touchpoints%
Awareness
Consideration
Intent
Purchase
38%
24%
23%
23%
18%
37%
37%
15%
27%
34%
20%
18%
12%
11%
19%
12%
12%
14%
10%
19%
13%
13%
3%
6%
8%
26%
10%
8%
8%
3%
25%
13%
9%
22%
9%
3%
2%
4%
2%
6%
2%
2%
64%
9%
9%
9%
18%
0%
7%
7%
21%
29%
7%
7%
33%
10%
23%
41%
18%
10%
44%
11%
11%
22%
4%
15%
0%
0%
0%
5%
0%
4%
8%
10%
8%
15%
0%
5%
6%
10%
13%
14%
18%
5%
Media with lowest to highest friction for the given friction point

56
Slow response time from the insurance brand is a key friction point at the intent stage. KYC paperwork, manual form filling, details verification, medical checkups, medical records verification or assessment of property to be insured, follow-ups and underwriting are time-consuming activities at this stage. Also, a non-standard list of documents or incomplete/wrong data captured in the proposal form leads to multiple visits by sales team and exacerbates the problem. Moreover, over commitment by agents due to lack of information at their end results in friction. Standardised list of documents, automation and AI integration enable companies to reduce the cost incurred on routine work and refocus on catering to consumers by providing them with quick resolutions and policy updates. Future of pop-up chat bots can address consumers’ queries at the time of purchase to significantly reduce intent friction. Fukoku Mutual Life Insurance is in the process of implementing AI and automating business processes, which is expected to boost productivity by 30 per cent after complete system integration. The firm not only expects to enhance its consumer experience but also estimates to save about USD1.25 million in the first year of AI use[1] .
52%
Longer response time and inability to answer product queries cause friction for life and other insurance products
Online*Banks/
NBFCsTop friction points
Banks/
NBFCsOnline*
It took too long for the brand to contact the
prospect and the need lapsed
Prospect did not trust the medium of information
Prospect could not connect with provider directly
via branch/website
Prospect expressed interest but did not get
response from banks/NBFCs
Representative could not address all queries
Prospect did not get all the relevant information
Prospect found it difficult to express interest
35%
29%
22%
21%
19%
Insurance: Intent friction
14%
25%
25%
25%
22%
11%
24%
Awareness
Consideration
Intent
Purchase
37%32%
0%18%
3%15%
3%14%
9%11%
15% 24%
3%5%
14%4%
2% 24%
13%7%
18%10%
8%2%
14%5%
Note: At the intent stage, only banks/NBFCs and online touchpoints were evaluated in the media mix to calculate friction
Percentage of respondents experiencing the mentioned
friction in respective media touchpoints%
* Online includes top five media touchpoints accessed by respondents at respective stage of the journey
[1] Insurance technology 7 disruptive ideas to transform traditional insurance company, AltexSoft blog, March 2018
20%31%
12% 11%
Media with lowest to highest friction for the given friction point
Other insuranceLife insurance

57
Other insuranceLife insurance
Trust on in-person communication at a convenient branch location has been one of the key reasons behind offline applications. Brands have been increasingly adopting
consumer-friendly technology solutions such as chatbots and integrating digital tools to their physical assets to either replicate or complement the offline consumer
experience. Digital medium provides them with the option to explore, compare and purchase a policy in a better manner at the click of a button. Omni-channel has offered a
solution where consumers are able to access physical touchpoints of bank branches by visiting them in person or scheduling a visit/call with the executives at a convenient
time. Both offline and online presence are vital to brands pursuing leads in a highly competitive insurance market.
Anytime application for insurance, deals and access to multiple insurance brands drive online insurance purchases
Purchase channel preference
Easy access to multiple
brands60%
Lower prices/better deals 60%
Anytime application 20%
What
lacks in
offline?
Immediate availability of
product55%
More certainty about
fit/suitability of the product39%
Convenience of location 34%
What
lacks in
online?
Post-purchase activities
39%
Spoke about the
products
purchased on
social media
39%
Recommended the
purchase to friends
and family
members on social
media or chat apps44%
Wrote reviews for
the product online
on a shopping
site/website
56%
Recommended
the purchase to
friends and
family members
on social media
44%
Recommended the
purchase to friends
and family
members on
direct chat
Purchase channel preference Post-purchase activities
Easier to compare and
research products/offers
Lower prices/better deals
Wider variety of products
67%
56%
56%
Convenience of location
Websites take too long to
load/websites are too slow
Immediate availability of
product
46%
37%
34%
What
lacks in
online?
What
lacks in
offline?
Recommended the
purchase to friends
and family members
on direct chat
39%
58
Friction Busting —
Increasing the Sales
Opportunity with
Mobile


60
The number of mobile internet users in India is expected to increase to 677 million by 2022 from 420 million users in 2017[1]. Facebook influences on life insurance purchases is expected to grow at 2.8 times compared to mobile influences at 2.3 times by 2022e. While for other insurance, Facebook influence is expected to grow at 3 times compared to mobile influence at 2.2 times by 2022e. This growth is expected to be driven by the organic penetration of the internet, social media and digital technologies over the next five years. Brands, therefore, have USD99 billion and USD31 billion worth of incentives for life insurance and other insurance[2], and may review to implement their marketing strategies and adapt to the fast-evolving mobile-first internet economy of India.
Sources:
[1] Internet users to touch 420 million by June 2017: IAMAI report, The Economic Times, May 2017; Internet users in India expected to reach 500 million by June: IAMAI, Economic Times, February 2018; eMarketer Forecasts
Strong Growth in Facebook Users in India, eMarketer, June 2017
[2] IRDA Annual report 2016–17, IRDA, July, 2018; Public disclosures — Standalone Health insurance companies, May 2018 ; KPMG in India's analysis 2018 based on data obtained from multiple industry reports and
primary survey conducted by Nielsen, 2018
Awareness
Consideration
Intent
2017 2022e[2] 2017 2022e
[2]
66%
64%
81%
68%
80%
78%
90%
82%
Mobile influence
22%
24%
36%
25%
35%
48%
36%
32%
USD44 billion
USD99 billion
USD16 billion
USD44 billion2.3x 2.8x
2017 2022e[2] 2017 2022e
[2]
65%
67%
82%
69%
79%
81%
91%
82%
19%
12%
12%
15%
19%
19%
24%
28%
USD14 billion
USD31 billion
USD3 billion
USD9 billion2.2x 3x
Mobile influence
Averageinfluence
Incremental
sales
opportunity
Other insuranceLife insurance
By 2022, mobile is expected to influence about 8 out of 10 purchases for both life insurance and other insurance
influence
influence

61
Mobile-influenced purchase journeys are ~17 per cent shorter than offline-influenced journeys in the insurance category
Note: *Offline-influenced journeys involve the use of at least one offline medium in the purchase journey
Mobile compacts
journeys
Mobile-influenced journeys are ~17 per cent
shorter than offline-influenced* journeys
Mobile platforms may provide prospective consumers with the ease of checking scheme conditions, policy sum insured, premium and coverage areas, and
seeking assistance and opinions based on their own convenience. With personalised offers and targeting, brands can provide new schemes and customised
offers to consumers tempting them to apply for insurance. This study suggests that mobile purchase journeys are ~17 per cent shorter than offline-influenced
journeys, helping marketers save considerably in acquiring new consumers.
Insurance

62
Methodology — friction reduction by enhancing the media mix
Interpret media-related friction individually at each stage of the journey — awareness, consideration and intent
Calculate the potential friction reduction opportunity for areas where mobile can help bring down friction
Calculate the potential opportunity for a brand to reduce friction in the future by enhancing mobile in the media mix
Recommend feasible and scalable approaches based on the identified friction areas and possibility of technology fitment

63

64
Mobile has the potential to reduce friction by 5 percentage points across the purchase journey for life insurance
Source: KPMG in India’s Analysis, 2018 based on primary survey conducted by Nielsen, 2018
For all three stages - awareness, consideration and intent - the reduction in friction on offline media is based on the weighted average of friction scores for all online media, obtained from primary research.
The calculation took into account the reduction in friction that could be achieved if offline friction percentages are replaced with the weighted averages of online media. It has been assumed that the values of online
media can be used as a proxy for mobiles since more than 90 per cent of the online usage takes place via mobile devices.
.
Awareness friction Consideration friction Intent friction
Prospect does not know what to
do next after watching ads
Prospect does not pay
enough attention to ads
Prospect finds the ad
intrusive
Prospect finds too little
information from ads
Prospect did not trust the
medium of information
Ads not appealing
to the prospect
Ad language not clear
to the prospect
Product/Brand was not
relevant to prospect
Irrelevant offers
or adverts sent
2017
Media
friction
2022e
Media
friction
Friction points
No expert
advice/answers available
Offered communication not
clear to the prospect
Prospect finds it difficult to
browse/find information
Prospect does not get
the relevant information
Actual benefits/offer details do not match prospect’s understanding of the ad
Too many insurance policies are
advertised
2022e
Media
friction
2017
Media
friction
Friction points
Representative could not
address prospect's queries
Prospect expressed interest but
did not get response from the
banks/NBFCs
Prospects not able to easily connect
with provider directly via
branch/website/page/call centre
Prospect not given
all relevant content
It took too long for the brand to
contact the prospect and the
need lapsed
Friction points26% 28% 32%
2017
Media
friction
2022e
Media
friction
34%
28%
26%
16%
53%
25%
25%
14%
25%
20%
29%
36%
27%
28%
23%
25%
32%
31%
32%
39%
51%
26%
Too many insurance agencies
are advertised 36%
23%
Prospect did not trust the
medium of information
Prospect found to difficult to
express interest
Prospect does not trust
the source for information

65
Mobile has a potential to reduce friction by nearly 5 percentage points across the purchase journey for other insurance
Source: KPMG in India’s Analysis, 2018 based on primary survey conducted by Nielsen, 2018
For all three stages - awareness, consideration and intent - the reduction in friction on offline media is based on the weighted average of friction scores for all online media, obtained from primary research.
The calculation took into account the reduction in friction that could be achieved if offline friction percentages are replaced with the weighted averages of online media. It has been assumed that the values of online
media can be used as a proxy for mobiles since more than 90 per cent of the online usage takes place via mobile devices.
Awareness friction Consideration friction Intent friction
2017
Media
friction
2022e
Media
friction
Friction points 2022e
Media
friction
2017
Media
friction
Friction points Friction points28% 42% 31%
2017
Media
friction
2022e
Media
friction
22%
49%
18%
19%
59%
24%
24%
15%
32%
48%
40%
58%
27%
37%
28%
41%
25%
17%
26%
30%
28%
47%
34%
21%
Prospect does not know what to
do next after watching ads
Prospect does not pay
enough attention to ads
Prospect finds the ad
intrusive
Prospect finds too little
information from ads
Prospect did not trust the
medium of information
Ads not appealing
to the prospect
Ad language not clear
to the prospect
Product/Brand was not
relevant to prospect
Irrelevant offers
or adverts sent
No expert
advice/answers available
Offered communication not
clear to the prospect
Prospect does not trust
the source for information
Prospect finds it difficult to
browse/find information
Prospect does not get
the relevant information
Actual benefits/offer details do not match prospect’s understanding of the ad
Too many insurance policies are
advertised
Representative could not
address prospect's queries
Prospect did not trust the
medium of information
Prospects not able to easily connect
with provider directly via
branch/website/page/call-centre
Prospect not given
all relevant content
Prospect found to difficult to
express interest
Too many insurance agencies
are advertised
It took too long for the brand to
contact the prospect and the
need lapsed
Prospect expressed interest but
did not get response from the
banks/NBFCs

66
Other insurance
Increasing the portion of mobile-based advertisement platforms in the marketing media mix can create a premium income opportunity of USD54 billion for life insurance
and USD16 billion* for other insurance brands. Mobile is also expected to increase efficiency in consumer acquisition spends when compared to traditional mediums by up
to ~31 per cent for life insurance and ~29 per cent for other insurance. Mobile-based marketing approaches could, therefore, not only enhance consumers’ experience in
the purchase journey, but can also improve the cost economics of the brand, providing them an edge in the ever-increasing competition for the insurance market.
Awareness
Consideration
Intent
Purchase
2022e
13%
7.4%
1.4%
4.2%
2017
18%
10%
6%
2%
5 percentage
points
26%
2022e
11%
7%
1%
3%
2017
16%
9%
5%
2%
~USD54 billion*Opportunity for the
brands
Mobile in the media mix can tap into a premium income opportunity of ~USD70 billion and bring in efficiency in customer acquisition cost by ~30 per cent
~USD16 billion* Opportunity for
the brands
~ 31% Efficiency in customer acquisition
cost by moving spends from
traditional media such as print,
outdoor and radio to mobile
~29% Efficiency in customer
acquisition cost by moving
spends from traditional
media such as print,
outdoor and radio to mobile
Reduction in friction Reduction in friction
5 percentage
points
28%
32%
28%
42%
31%
Life insurance
*This number can be achieved by reducing the friction, thus increasing the addressable market opportunity
Source: Digital Advertising in India 2018, Dentsu Aegis Network; IRDA handbook 2016–17, IRDA, Jan 2018;
New business performance, Life in council, 2018; Public disclosures — Standalone Health insurance
companies, May 2018; KPMG in India's analysis 2018 based on data obtained from multiple industry reports
and primary survey conducted by Nielsen, 2018
Methodology: The projection is based on estimated ratio of average cost of consumer acquisition for online
and offline media in the FinServ industry. The ratio is assumed to be consistent in 2022, and is used to
project incremental spend on mobile-based digital advertisement to tap the premium income opportunity.

67
Mobile-influenced potential sales opportunity of about USD200 billion in insurance
2017 2022e
Market
opportunity
through
media
friction
reduction
Mobile-
influenced
market Life
insurance
Other
insurance
USD44
billion
USD14
billion
*This number can be achieved by reducing the friction, thus increasing the addressable market opportunity
USD130 billion
USD99
billion
USD31
billion
~USD70 billion*
Life
insurance
Other
insurance
USD54
billion
USD16
billion
Life
insurance
Other
insurance
Mobile in the media mix can create value for insurance brands by increasing insurance premium income opportunity. Enhancing mobile in the media mix can create a
combined potential premium income opportunity of USD200 billion by influencing insurance purchases and reducing media friction in the consumer’s purchase journey.
Insurance

68

69
This category includes the unsecured loans opted by
individuals for debt consolidation, vacations, living expenses, weddings, and medical bills
Personal loans
Other loans include all other retail lending excluding unsecured
personal loans, agriculture loans and credit cards. E.g. home, auto,
education, and consumer durables, amongst others
Other loans
Credit cards
Loans
Insurance

70
Friction Decoded —
Scope of Opportunity

71
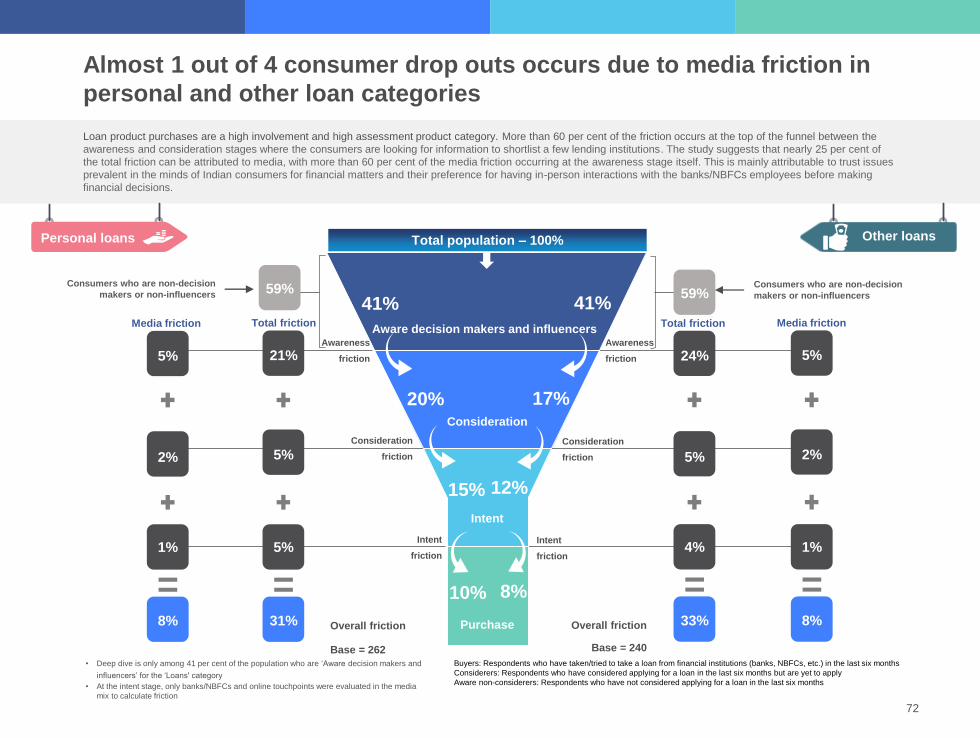
72
• Deep dive is only among 41 per cent of the population who are ‘Aware decision makers and
influencers’ for the ‘Loans' category
• At the intent stage, only banks/NBFCs and online touchpoints were evaluated in the media
mix to calculate friction
Loan product purchases are a high involvement and high assessment product category. More than 60 per cent of the friction occurs at the top of the funnel between the
awareness and consideration stages where the consumers are looking for information to shortlist a few lending institutions. The study suggests that nearly 25 per cent of
the total friction can be attributed to media, with more than 60 per cent of the media friction occurring at the awareness stage itself. This is mainly attributable to trust issues
prevalent in the minds of Indian consumers for financial matters and their preference for having in-person interactions with the banks/NBFCs employees before making
financial decisions.
Almost 1 out of 4 consumer drop outs occurs due to media friction in
personal and other loan categories
Aware decision makers and influencers
Consideration
Intent
17%
12%
Purchase
8%
Total friction Media friction
59%
5%
1%
2%
Awareness
friction
Consideration
friction
Intent
friction
8%Overall friction
41%
24%
5%
4%
33%
Base = 262
Consumers who are non-decision
makers or non-influencers
==
Total population – 100%
Media friction Total friction
21%
5%
5%
31%
5%
2%
1%
8%
==
Awareness
friction
Consideration
friction
Intent
friction
Overall friction
Base = 240
59%Consumers who are non-decision
makers or non-influencers
20%
15%
10%
41%
Buyers: Respondents who have taken/tried to take a loan from financial institutions (banks, NBFCs, etc.) in the last six months
Considerers: Respondents who have considered applying for a loan in the last six months but are yet to apply
Aware non-considerers: Respondents who have not considered applying for a loan in the last six months
Personal loans Other loansTotal population – 100%

73
Personal loans Other loans
Mobile could help lending brands tap into a potential sales opportunity of ~USD219 billion by reducing media friction
Friction can result in reduced sales, thus impacting the overall revenue for a brand. The study suggests that nearly 1 out of 4 consumers drops out of the loan securing
journey due to media friction. Mobile has the potential to reduce friction by 3 percentage points each for personal and other loans, creating a potential lending opportunity of
USD38 billion and USD181 billion[1][2], respectively. Hence, it becomes imperative for marketers to strengthen their media mix by having a larger share of marketing
activities on mobile thereby reducing media friction.
By reducing media friction with mobile, personal loan brands
can tap into ~USD38 billion* opportunity
Media friction
observed in
purchase
journey 8%
2017 2022eUse of
mobile in
media mix
Media friction
observed in
purchase
journey 5%
By reducing media friction with mobile, other loan brands
can tap into ~USD181 billion* opportunity
Media friction
observed in
purchase
journey 8%
2017 2022eUse of
mobile in
media mix
Media friction
observed in
purchase
journey 5%
~USD219 billion* lending opportunity
Note: Potential opportunity by KPMG in India is based on the potential reduction in consumer drop out. Modelling for reduction in drop outs is based on the potential friction reduction, which may get
impacted due to the usage of mobile-based media
*This number can be achieved by reducing the friction, thus increasing the addressable market opportunity
Source:
[1] Sectoral deployment of credit, RBI, July 2018; Annual FIBAC productivity report on Indian banking industry, FICCI, Aug 2018
[2] KPMG in India's analysis, 2018 based on data obtained from multiple industry reports and primary survey conducted by Nielsen, 2018

74
Friction Mapping—
Understanding
Friction

75

76
Loan application is a need-based decision where consumers look out for the best available deals in terms of interest rate, tenure, processing fees, etc. Almost 90 per cent
of the media-led friction is observed at the awareness and consideration stages. TV, print and radio contribute the maximum to friction at the consideration stage where
prospects are overwhelmed with standard offers on loans rather than customised offers based on their profiles. At the consideration stage, consumers leverage digital
media to research and compare relevant product offerings on aggregator websites or respective bank websites. They seek assistance when it comes to making financial
decisions and, thus, reach out to bank representatives during the application process for secured loans.
• Deep dive is only among 41 per cent of the population who are ‘Aware decision makers and
influencers’ for the ‘Loans' category
• At the intent stage, only banks/NBFCs and online touch-points were evaluated in the media mix to
calculate friction
Buyers: Respondents who have purchased/tried to purchase a loan in the last six months
Considerers: Respondents who have considered purchasing a loan in the last six months but are yet to apply
Aware non-considerers: Respondents who have not considered purchasing a loan in the last six months
* Online includes top five media touch points accessed by respondents at respective stages of the journey
The digital medium shows lower friction than traditional mediums at the
consideration stage for personal loans
Intent
friction
Consideration
friction
Consideration
friction
Aware decision makers
and influencers
Consideration
Intent
20%
15%
Purchase
10%
Media friction
5%
1%
2%
Intent
friction
8%Overall media
friction
41%
=
33%
64%
Digital
32%
Outdoor
26%
BranchRadio
18% 27%
TV
Awareness
friction
9%
Awareness
friction
Media friction
5%
1%
2%
8%
=Overall media
friction
17%
12%
8%
41%
Base = 262 Base = 240
74%
TV
30%
Outdoor
36%
Digital
67%
Print Radio
72% 77%
Branch
80%
Digital
59%
Branch
38%
66%
Digital
33%
Outdoor
30%
Branch Radio
30% 31%
TV
80%
Digital
54%
Branch
26%
61%
Digital
50%
Outdoor
17%
Branch Radio
69%45%
TV
Total population – 100%
Personal loans Other loans
Friction scoresFriction scores

77

78
It took too long for the brand to contact the prospect and the need lapsed
Prospect expressed interest but did not get response from banks/NBFCs
While a higher number of men than women enter the purchase funnel for personal loans, their dropout rate at the awareness stage is 2.5 times
compared to women. Male consumers drop out are due to difficulty in understanding the financial language of the ad, while women drop outs
are due to excessive information bundled together. Men look for clear communication from brands with focus on pricing and interest rates while
women seek clear offer communication with features such as distant support when on international trips and forex assistance. The dropouts at
the intent stage can be avoided by streamlining the processes for application response and status monitoring for progress made on the leads.
The digital medium can provide cost-effective solutions to such friction areas and considerably improve the turnaround time (TAT) for the
requests.
Aware decision makers and influencers
Consideration
Intent
50%
20%
16%
Purchase
10%
30%
18%
14%
9%
30%
6%
12%
4%
5%
4%
Prospect did not pay enough attention to ads
Prospect did not understand the language of the ad
Prospect did not find it easy to browse/find information
Difficult to distinguish financial institutions
It took too long for the brand to contact the prospect and the need lapsed
Prospect found it difficult to express interest
Prospect did not pay enough attention to ads
Prospect finds too much information from ads
Prospect did not find it easy to browse/find information
Offer communication is not clear to prospect
=
40%
=
21% Note: At the intent stage, only banks/NBFCs and online
touchpoints were evaluated in the media mix to
calculate friction
10% 12% 19% 11%
29%29% 35%41%
15% 27% 30% 15%
Men find it difficult to differentiate among advertised brands, while women seek information during the purchase journey
Male Female
Legend
Outdoor Print Television Digital medium*
Media with highest contribution to top-two friction points
Banks/NBFCs Radio
Total population – 100%
Personal loans

79
Male Female
Prospect did not trust the medium of information
Prospect expressed interest but did not get response from banks/NBFCs
While fewer women enter the purchase funnel for other loans, their purchase conversions are almost similar to men. Targeted loan product
communication focusing on women can further improve their conversion rate. Almost 80 per cent of the total friction for male consumers occurs at
the top of the funnel, which is almost 2.5 times the friction for female consumers at the same stage. Men are key decision makers in purchase of
high involvement-high value products and seek more detailed information on the offered deal. Men appreciate timely response from brands and
one-on-one interactions with brand representatives to validate their own research while women are more open to making their own purchase
decision and seek a clear call for action from a trusted medium during the purchase journey.
Aware decision makers and influencers
Consideration
Intent
50%
18%
12%
Purchase
9%
30%
17%
12%
7%
32%
3%
13%
5%
5%
6%
Prospect did not pay enough
attention to ads
Prospect finds too little
information from ads
Prospect did not find it easy to browse/find information
Offer communication is not clear to the prospect
Prospect did not trust the medium of information
Prospect expressed interest but did not get response from banks/NBFCs
Prospect does not know what to do
next after watching ads
Prospect did not pay enough
attention to ads
Prospect did not find it easy to browse/find information
Offer communication is not clear to the prospect
=
41%
=
23% Note: At the intent stage, only banks/NBFCs and online
touchpoints were evaluated in the media mix to
calculate friction
13% 15%22% 16%
42%24% 23%30%
8% 19%11% 31%
Total population – 100%
Legend
Outdoor Print Television Digital medium*
Media with highest contribution to top-two friction points
Banks/NBFCs Radio
Total population – 100%
Other loans
Both men and women look for detailed information while seeking loans for high involvement categories such as home and auto

80
Personal loans are unsecured loans provided even to young consumers with little credit history at a marginally high interest rate. Young
professionals and earners are more likely to purchase a personal loan. 1 out of 3 consumers who enter the purchase funnel in the age group of
25–34 years took a personal loan.
Consumers in the age group of 18–24 years seek guided understanding of the loan product and all relevant information. Those in the age group
of 25–34 years, on the other hand, are more category-aware. They seek distinguished brand communication, information to assess eligibility to
get a loan and expect quick response from the brand to process their purchase request. Consumers aged 35 and above are less likely to
purchase personal loans as they have better alternative lending options.
Legend
Outdoor Print Television Digital medium* Banks/NBFCs Radio
Media with highest contribution to top-two friction points
Consumers in the age group of 25–34 years look out for relevant information and timely response from brands
Note: At the intent stage, only banks/NBFCs and online touchpoints were evaluated in the media mix to calculate friction
Prospect did not find the ads appealing
Prospect does not pay enough attention to ads
Prospect finds too little information from ads
Friction points
for 18–24 years
Friction points for
25–34 years
Friction points for
35–49 years
Prospect did not find it easy to browse/find information
Difficult to distinguish financial institutions
It took too long for the brand to contact the prospect and the need lapsed
Prospect was not given all the relevant information
Prospect does not pay enough attention to ads
The product advertised was not meant for the prospect
Prospect did not find it easy to browse/find information
Difficult to distinguish financial institutions; prospect did not get enough information to check eligibility
It took too long for the brand to contact the prospect and the need lapsed
Prospect expressed interest but did not get response from banks/NBFCs
Prospect finds too little information from ads
Prospect does not pay enough attention to ads
Prospect did not find it easy to browse/find information
Prospect was suggested another option because of which he/she switched
It took too long for the brand to contact the prospect and the need lapsed
Prospect expressed interest but did not get response from banks/NBFCs
11% 15% 14% 20%
25%15% 23%21%
21% 22% 19% 18%
9% 14%
46%35%
20% 15%
25%
Consideration
Intent
33%
17%
12%
4%
44%
19%
14%
9%
16%
8%
5%
5%
5%
Aware decision makers and influencers
42%
22%
18%
13%
4%
20%
5%
Total population – 100%
=29%
=35%29%
18–24 years 25–34 years 35–49 years
Personal loans

81
Consumers aged over 35 more actively look out for other loans in the market than consumers in other age groups. Consumers in the age group
of 35–49 years are more likely to make large ticket purchases like buying a house, four-wheelers and, hence, exhibit a high loan purchase
conversion rate of 25 per cent. Consumers in the age group of 18–24 years are young professionals or college students who struggle with
securing a loan because of their credit rating and loan eligibility or loan guarantee. While 18–24-year-old consumers are more keen on
understanding eligibility criteria, young salaried consumers in the age group of 25–34 years seek product offers to make purchases. However, at
the intent stage, inability to connect with the loan provider and slow response time, lead to high dropouts across all age groups.
Note: At the intent stage, only banks/NBFCs and online touchpoints were evaluated in the media mix to calculate friction
Prospect finds too much/too little information from ads
Prospect does not pay enough attention to ads
Friction points
for 18–24 years
Friction points
for 25–34 years
Friction points
for 35–49 years
Prospect did not find it easy to browse/find information
Prospect was not provided with enough information to check eligibility
It took too long for the brand to contact the prospect and the need lapsed
Prospect was not given all the relevant information
Prospect does not pay enough attention to ads
Prospect finds too little information from ads; the product advertised was not meant for the prospect
Prospect did not find it easy to
browse/find information
Offer communication is not
clear to the prospect
Prospect did not trust the medium of information
Prospect expressed interest but did not get response from banks/NBFCs
Prospect does not pay enough attention to ads
Prospect finds too little information from ads
Prospect did not find it easy to browse/find information
Prospect did not trust the source of information
Prospect could not connect to provider directly via branch/website
It took too long for the brand to contact the prospect and the need lapsed
13% 19% 13% 20%
33%22% 38%38%
25% 32% 18% 28%
12% 15%
27%20%
8% 16%Legend
Outdoor Print Television Digital medium* Banks/NBFCs Radio
Media with highest contribution to top-two friction points
25%
Consideration
Intent
33%
14%
8%
4%
89%
64%
47%
25%
19%
4%
17%
22%
6%
Aware decision makers and influencers
42%
20%
15%
10%
5%
22%
5%
Total population – 100%
=29%
=64%32%
18–24 years 25–34 years 35–49 years
Other loans
Limited information from ads and long lead time of response on queries result in high friction for consumers aged over 35
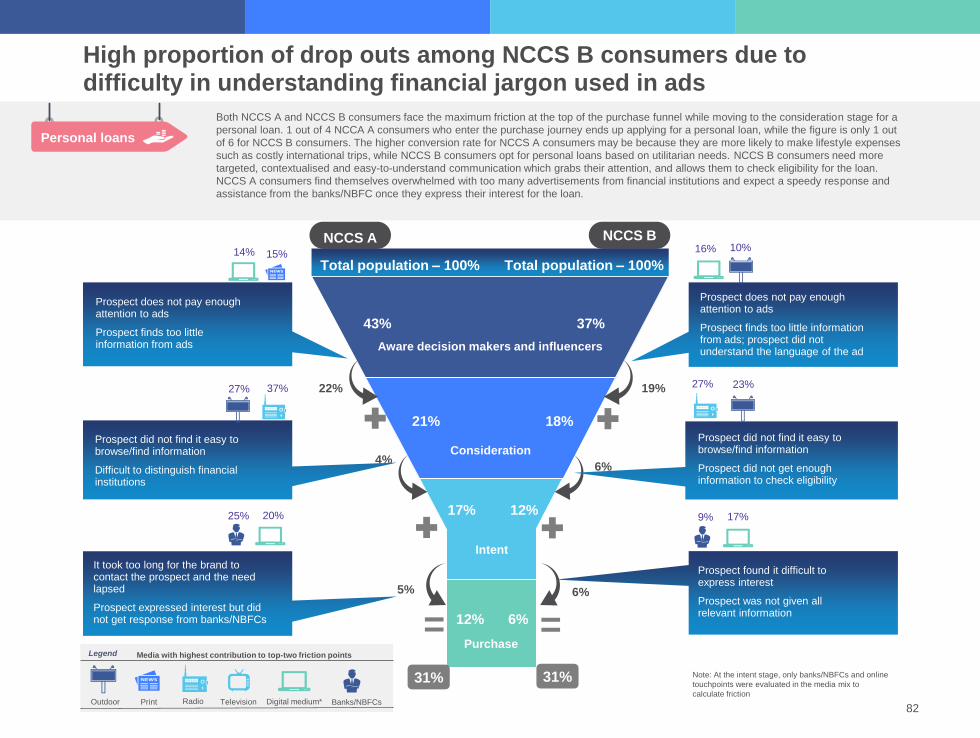
82
NCCS BNCCS A
Prospect found it difficult to express interest
Prospect was not given all relevant information
Both NCCS A and NCCS B consumers face the maximum friction at the top of the purchase funnel while moving to the consideration stage for a
personal loan. 1 out of 4 NCCA A consumers who enter the purchase journey ends up applying for a personal loan, while the figure is only 1 out
of 6 for NCCS B consumers. The higher conversion rate for NCCS A consumers may be because they are more likely to make lifestyle expenses
such as costly international trips, while NCCS B consumers opt for personal loans based on utilitarian needs. NCCS B consumers need more
targeted, contextualised and easy-to-understand communication which grabs their attention, and allows them to check eligibility for the loan.
NCCS A consumers find themselves overwhelmed with too many advertisements from financial institutions and expect a speedy response and
assistance from the banks/NBFC once they express their interest for the loan.
Aware decision makers and influencers
Consideration
Intent
43%
21%
17%
Purchase
12%
37%
18%
12%
6%
22%
5%
19%
6%
6%
4%
Prospect does not pay enough attention to ads
Prospect finds too little information from ads
Prospect did not find it easy to browse/find information
Difficult to distinguish financial institutions
It took too long for the brand to contact the prospect and the need lapsed
Prospect expressed interest but did not get response from banks/NBFCs
Prospect does not pay enough attention to ads
Prospect finds too little information from ads; prospect did not understand the language of the ad
Prospect did not find it easy to browse/find information
Prospect did not get enough information to check eligibility
Total population – 100% Total population – 100%
=
31%
=
31% Note: At the intent stage, only banks/NBFCs and online
touchpoints were evaluated in the media mix to
calculate friction
14% 15%16% 10%
37%27% 23%27%
25% 20% 9% 17%
High proportion of drop outs among NCCS B consumers due to difficulty in understanding financial jargon used in ads
Legend
Outdoor Print Television Digital medium* Banks/NBFCs Radio
Media with highest contribution to top-two friction points
Personal loans

83
Prospect expressed interest but did not get response from banks/NBFCs
Prospect could not connect to provider directly via branch/website
NCCS A consumers are twice more likely to purchase other loans as compared to NCCS B consumers. NCCS A consumers are digitally active,
and face top of the funnel friction on traditional mediums like print and radio. Consumers from both segments are more keen on exploring product
offers at the consideration stage for other loans compared to personal loans. At the intent stage, NCCS A consumers face friction when they do not
receive relevant responses or due to lack of trust on the medium while NCCS B consumers drop out when they are unable to connect with the
branch/representative or due to a lack of response from the brands despite expressing interest in purchases. consumers expect quick TAT and
instant approval/sanction, especially if the information provided is through sources which automate the entire process of financial checks, verification and extraction of financial data and credit score.
Aware decision makers and influencers
Consideration
Intent
43%
20%
15%
Purchase
10%
37%
14%
8%
5%
23%
5%
23%
6%
3%
5%
Prospect finds too little information from ads
Prospect does not pay enough attention to ads
Prospect did not find it easy to browse/find information
Offer communication is unclear to
the prospect; no expert
advice/answers available
Prospect did not trust the medium of information
Prospect was not given all relevant information
Prospect does not pay enough attention to ads
Prospect did not understand the language of the ad
Prospect did not find it easy to browse/find information
Offer communication is unclear to
the prospect
=
33%
=
32% Note: At the intent stage, only banks/NBFCs and online
touchpoints were evaluated in the media mix to
calculate friction
18% 18% 19% 17%
25%27% 21%50%
10% 22% 3% 14%
NCCS BNCCS A
Total population – 100% Total population – 100%
Legend
Outdoor Print Television Digital medium* Banks/NBFCs Radio
Media with highest contribution to top-two friction points
Other loans
NCCS A consumers seek expert advice from loan providers to close purchase decisions

84
Personal loans Other loans
Awareness
Consideration
Intent
Purchase
Consumers seek personalised loan offerings which cater to their specific needs and requirements. Traditional mediums like print and radio for personal and other loans, respectively, show high friction due to their standard messaging which fails to catch consumers’ attention. Ad relevance and ad language are the key reasons for drop out due to online medium. However, with the advent of aggregators, online medium has emerged as a preferred channel for loan comparison, and banks/NBFCs are providing competitive offers on such platforms. They are also utilising data analytics to promote pre-approved loans and marketing life event triggered loans such as marriages and higher education.
SoFi, a modern finance company in the United States, used Instagram and Facebook ads — particularly on mobile — to successfully boost brand awareness, educate prospective consumers and increase pre-approved loan applications. Their highly targeted and mobile-focused series of campaigns in 2016 delivered a 15-point lift in brand awareness, 39 per cent increase in pre-approved applications for student and personal loans and a 5-point increase in intent to get a loan from SoFi[1].
Online*Banks/
NBFCsRadio Outdoor Print Top friction points Print Outdoor Radio
Banks/
NBFCsOnline*
Prospect did not pay
enough attention to ads
Prospect finds
too little information
from ads
Prospects did not
understand the
language of the ad
The product
advertised was not
meant for the prospect
Product/Brand was not
relevant
to the prospect
Prospect does not
know what
to do next after
watching ads
Loans: Awareness friction
21%
19%
17%
17%
16%
14%
13% 1% 12% 7%10% 25%
24%
20%
19%
16%
20%
TelevisionTelevision
13% 1% 3% 6%3%
12% 3% 8% 1%4%
14% 0% 7% 0%1%
6% 3% 5% 4%1%
14%
10%
4%
4%
3%
11%
14%
5%
6%
8%
5%
5%9% 0% 5% 15%3%
13%
9%
4%
6%
4%
8%
17%
17%
16%
14%
8%
10%
23%
5%
11%
2%
4%
5%
1%
1%
2%
2%
1%
0%
7%
6%
2%
2%
2%
19%
* Online includes top five media touch points accessed by respondents at respective stage of the journey
[1] Reaching prospective borrowers, Facebook, Extracted on June 2018
Percentage of respondents experiencing the mentioned friction in
respective media touchpoints%
Media with lowest to highest friction for the given friction point
Consumers seek relevant, simplified and easy-to-understand brand messaging

85
Assessment of loan offerings becomes difficult through traditional mediums like television and radio due to their standard messaging. Loan consideration is largely dependent on the consumer’s relationship and engagement with his/her existing bank. Often, these existing relationships are leveraged to extend loans to consumers. While difficulty in distinguishing among multiple brands advertised is a major friction area for personal loans, difficulty in assessing eligibility and unclear offer communication are the friction areas for consumers looking to purchase secured other loans. Brands are increasingly leveraging online mediums through loan eligibility calculator tools, and response support through AI-based chat bots to immediately respond to queries. Akbank, a Turkish bank, used Facebook mobile app ads to promote its loan products, resulting in an average of over 500 consumer conversions per day during the campaign. They encouraged Akbank consumers to apply for a personal loan using Akbank's Direkt mobile app. They achieved 70 per cent lower cost per loan compared to other performance marketing channels along with 45 per cent approved loan applications via the Akbank Direkt mobile app originated with Facebook ads[1].
Awareness
Consideration
Intent
Purchase
Online*Banks/
NBFCsRadio Outdoor Print Top friction points Print Outdoor Radio
Banks/
NBFCsOnline*
Prospect found it difficult
to browse or find
information required
Difficult to distinguish
financial institutions
Prospect could not get
enough information to
check his/her eligibility
Prospect finds too little
information from ads
Offer communication is
unclear to prospect
Prospect does not trust
the medium as a source
of information
No expert
advice/answers available
Loans: Consideration friction
39%
17%
20%
19%
27%
22%
TelevisionTelevision
5%
0%
5%
13%
13%
8%
38%
19%
18%
17%
17%
12%
8% 21% 26%
23%
7%
10%
13%
23%
20%
20%
15%
17%
14%
14%
14%
11%
9%
8%
8%
16%
10%
21%
15%
5%
0%
11%
11%
13%
13%
9%
7%
4%
9%
7%
7%
2%
2%
13%
2%
2%
4%
2%
4%
0%
1%
64%
0%
8%
12%
4%
4%
0%
50%
7%
11%
4%
11%
4%
0%
38%
0%
6%
19%
38%
19%
6%
4%
6%
2%
2%
2%
2%
4%
20%
5%
7%
7%
17%
29%
2%
* Online includes top five media touchpoints accessed by
respondents at respective stage of the journey
[1] Promoting bank loan products with Facebook mobile app ads,
Facebook, Extracted on June 2018
Percentage of respondents experiencing the mentioned friction in
respective media touchpoints%
Personal loans Other loans
Media with lowest to highest friction for the given friction point
Clutter free brand communications and clear offer communication can reduce consumer friction

86
At the intent stage, consumers seek quick addressal of the product-related queries from a trusted source to complete their loan product purchase; they face friction if served otherwise. Complex application processes and slow response times by financial institutions in responding to consumers’ loan applications lead to consumer drop outs right before making a purchase.
However, the advent of digital lending platforms has significantly reduced the loan approval time. These platforms have reached the next level of automation in loan processing using holistic and sophisticated algorithms that process the data and give loan approvals or rejections. Automated systems and e-verifications have reduced the time consumed during loan disbursals. Rubique, an online financial marketplace, has leveraged artificial intelligence and algorithms to reduce the time taken to approve a loan request, compared to traditional lenders.[1]
Awareness
Consideration
Intent
Purchase
Online*Banks/
NBFCsTop friction points
Banks/
NBFCsOnline*
It took too long for the brand to contact the
prospect and the need lapsed
Prospect expressed interest but did not get
response from banks/NBFCs
The prospect found it difficult to express interest
Prospect could not connect to provider directly via
branch/website
Prospect did not get all the relevant information
Prospect does not trust the medium as a source of
information
Representatives could not address all queries
30%
20%
20%
18%
16%
Loans: Intent friction
14%
21%
30%
11%
23%
22%
32%
11% 23%
10%
18% 29%
10%
4%
6%
1%
0%
11%
21%
18%
14%
14%
18%
17%
17%
7%
11%
13%
25%
19%
Note: At the intent stage, only banks/NBFCs and online touch points were evaluated in the media mix to calculate friction
Percentage of respondents experiencing the mentioned friction in
respective media touchpoints
%
* Online includes top five media touch points accessed by respondents at respective stage of the journey
[1] India’s online lenders are looking at social media and other unconventional data to determine credit worthiness, Quartz India, Nov 2017
24%
9%
9%
3%
6%
3%
12%
Personal loans Other loans
Media with lowest to highest friction for the given friction point
Consumers seek quick response time and trusted source of information to close a deal

87
Online purchases are influenced mainly due to convenience of availing services anytime, while offline purchases are preferred due to their immediate availability at bank branches/NBFCs. The online medium not only provides better deals, pre-approved loans but also a thorough comparison of products at one’s fingertips. It also helps in cost optimisation for brands by minimising the offline process handling expenses, which in turn reflects in the brand’s profitability. The medium is no longer just a cheaper alternative to bank branches/NBFCs but a crucial mode of making communication, executing promotions and interacting with consumers. The integration of the physical and virtual environments is increasingly becoming important not just because it helps them convert leads into consumers but more so because majority of the decisions made by consumers are based on the quality of their experiences along the purchase journey. Thus, a smooth experience with timely updates becomes essential to the application process for loans.
Purchase channel preference
Anytime application 50%
Lower prices/Better deals 50%
Easy access to multiple
brands33%
What
lacks in
offline?
Immediate availability of
product38%
Convenience of branch
location34%
Websites take too long to
load/websites are too slow27%
Post-purchase activities
34%
Recommended the
purchase to friends,
family members on
social media
42%
Wrote reviews for
the product online
on a shopping
site/website
40%
Spoke about the
products
purchased on
social media
What
lacks in
online?
46%
44%
Recommended
the purchase to
friends, family
members on
direct chat
Recommended the
purchase to friends,
family members on
social media
40%Spoke about the
products purchased
on social media
Purchase channel preference Post-purchase activities
Easy comparison and
research of products/offers
Lower prices/better deals
Wider variety of products
67%
56%
56%
Immediate availability of
product
Convenience of branch
location
Fit/suitability of the product
50%
36%
36%
What
lacks in
online?
What
lacks in
offline?
Personal loans
Convenience of anytime application for loans, accessibility to multiple brands and better deals drive online purchases of loan products
Other loans

88
Friction Busting —
Increasing the Sales
Opportunity with
Mobile

89

90
Nearly 60 per cent of the personal loan purchases in 2022 are expected to be mobile influenced, while nearly 1 out of 4 purchases are expected to be Facebook influenced. For the other loan category, the value of mobile-influenced and Facebook-influenced purchases in 2022 will be more than 2.5 times the number of influenced purchases at present. Brands, therefore, have USD81 billion and USD401 billion worth of incentives for personal loans and other loans [1][2] respectively, and may relook to implement their marketing strategies, and adapt to the fast-evolving mobile-first internet economy of India.
Sources:
[1] Sectoral deployment of credit, RBI, July 2018; Annual FIBAC productivity report on Indian banking industry, FICCI, Aug 2018
[2] KPMG in India's analysis 2018 based on data obtained from multiple industry reports and primary survey conducted by Nielsen, 2018
Awareness
Consideration
Intent
2017 2022e[2] 2017 2022e
[2]
44%
34%
43%
41%
59%
47%
58%
56%
Mobile influence Facebook
influence
15%
14%
17%
15%
21%
25%
23%
22%
USD24 billion
USD81 billion
USD9 billion
USD33 billion3.4x 3.7x
2017 2022e[2] 2017 2022e
[2]
48%
54%
71%
54%
64%
70%
84%
69%
19%
23%
32%
22%
34%
43%
33%
29%
USD157 billion
USD401 billion
USD64 billion
USD192 billion
2.5x 3x
Mobile influence
Averageinfluence
Incremental
sales
opportunity
Personal loans Other loans
By 2022, mobile is expected to influence ~6 out of 10 purchases for personal loans and ~7 out of 10 purchases for other loans
influence

91
Mobile-influenced purchase journeys ending online are ~8 per cent shorter than offline ending journeys for loans category
Note: *Offline ending journeys are hybrid purchase journeys ending on an offline medium
Mobile compacts
journeys
Mobile-influenced journeys are ~8 per cent
shorter than offline-ending* journeys
Mobile platforms may help the consumers with ease of checking eligibility, clarifying conditions, and comparing offered rates based on their own convenience. With personalised offers and targeting, brands can provide new schemes, customised offers and competitive interest rates tempting consumers to apply for the loan. This study suggests that mobile ending purchase journeys are ~8 per cent shorter than offline ending journeys indicating an opportunity for marketers to reduce costs.*
Loans

92
Methodology — friction reduction by enhancing the media mix
Interpret media-related friction individually at each stage of the journey — awareness, consideration and intent
Calculate the potential friction reduction opportunity for areas where mobile can help bring down friction
Calculate the potential opportunity for a brand to reduce friction in the future by enhancing mobile in the media mix
Recommend feasible and scalable approaches based on the identified friction areas and possibility of technology fitment

93

94
Mobile has the potential to reduce friction by 3 percentage points across the purchase journey for personal loans
Source: KPMG in India’s Analysis, 2018 based on primary survey conducted by Nielsen, 2018
For all three stages - awareness, consideration and intent - the reduction in friction on offline media is based on the weighted average of friction scores for all online media, obtained from primary research.
The calculation took into account the reduction in friction that could be achieved if offline friction percentages are replaced with the weighted averages of online media. It has been assumed that the values of online
media can be used as a proxy for mobiles since more than 90 per cent of the online usage takes place via mobile devices.
Awareness friction Consideration friction Intent friction
Prospect does not
know what to do next
after watching ads
Prospect does not pay
enough attention to ads
Prospect finds the ad
intrusive
Prospect finds too little
information from the ads
Prospect did not trust the
medium of information
Ads not appealing
to the prospect
Ad language not clear
to the prospect
Product/Brand was not
relevant to prospect
Irrelevant offers
or ads sent
2017
Media
friction
2022e
Media
friction
Friction points
No expert
advice/answers available
Offered communication not
clear to the prospect
Prospect does not trust
the source of information
Prospect finds it difficult to
browse/find information
Prospect does not get
the relevant information
Difficult to distinguish financial institutions
Prospect is not provided with
enough information on eligibility
2022e
Media
friction
2017
Media
friction
Friction points
Representative could not
address prospect's queries
Prospect did not trust the
medium of information
Prospect expressed interest but
banks/NBFC did not respond
Prospects not able to easily connect
with provider directly via
branch/website/page/call centre
Prospect not given
all relevant content
Prospect could not
express interest
It took too long for the brand to
contact the prospect and the
need lapsed
Friction points24% 31% 30%
2017
Media
friction
2022e
Media
friction
32%
20%
25%
21%
45%
22%
14%
23%
40%
13%
17%
64%
18%
12%
16%
36%
35%
18%
37%
34%
20%
34%
20%

95
Mobile has the potential to reduce friction by 3 percentage points across the purchase journey for other loans
Source: KPMG in India’s Analysis, 2018 based on primary survey conducted by Nielsen, 2018
For all three stages - awareness, consideration and intent - the reduction in friction on offline media is based on the weighted average of friction scores for all online media, obtained from primary research.
The calculation took into account the reduction in friction that could be achieved if offline friction percentages are replaced with the weighted averages of online media. It has been assumed that the values of online
media can be used as a proxy for mobiles since more than 90 per cent of the online usage takes place via mobile devices.
Awareness friction Consideration friction Intent friction
2017
Media
friction
2022e
Media
friction
Friction points 2022e
Media
friction
2017
Media
friction
Friction points Friction points22% 33% 25%
2017
Media
friction
2022e
Media
friction
28%
19%
22%
18%
40%
16%
16%
24%
67%
22%
35%
50%
29%
24%
19%
20%
20%
18%
28%
21%
56%
29%
24%
Prospect does not
know what to do next
after watching ads
Prospect does not pay
enough attention to ads
Prospect finds the ad
intrusive
Prospect finds too little
information from the ads
Prospect did not trust the
medium of information
Ads not appealing
to the prospect
Ad language not clear
to the prospect
Product/Brand was not
relevant to prospect
Irrelevant offers
or ads sent
No expert
advice/answers available
Offered communication not
clear to the prospect
Prospect does not trust
the source of information
Prospect finds it difficult to
browse/find information
Prospect does not get
the relevant information
Difficult to distinguish financial institutions
Prospect is not provided with
enough information on eligibility
Representative could not
address prospect's queries
Prospect did not trust the
medium of information
Prospect expressed interest but
banks/NBFC did not respond
Prospects not able to easily connect
with provider directly via
branch/website/page/call-centre
Prospect not given
all relevant content
Prospect could not
express interest
It took too long for the brand to
contact the prospect and the
need lapsed

96
Personal loans Other loans
Opportunity of USD220 billion* can be generated within brands by improving media efficiency with mobile-based solutions for the loans category. This can create value for
lending brands by increasing loan purchases. Mobile is also expected to increase efficiency in consumer acquisition cost when compared to traditional mediums by up to
~21 per cent for personal loans and ~24 per cent for other loans.
By enhancing mobile in the media mix, brands can tap into a lending opportunity of ~USD220 billion and bring in efficiency in customer acquisition cost by ~21 per cent and ~24 per cent for personal and other loans respectively
Awareness
Consideration
Intent
Purchase
2022e 2017
5% 8%3 percentage
points
5%
1%
2%
4%
1%
1%
~21%
Efficiency in customer acquisition cost by
moving spends from traditional media
such as print, outdoor and radio to mobile
USD38 billion*
Opportunity for
the brand
Reduction in friction
28%
42%
31%
2017 2022e
8% 5%
5%
1%
2%
4%
1%
1%
3 percentage
points
Reduction in friction
~24%
Efficiency in customer acquisition cost by
moving spends from traditional media such
as print, outdoor and radio to mobile
28%
42%
31%
USD181 billion*
Opportunity for
the brand
*This number can be achieved by reducing the friction, thus increasing the addressable market opportunity
Source: Digital Advertising in India 2018, Dentsu Aegis Network; Productivity in Indian banking, FICCI, Nov
2017; India consumer payment research, TransUnion CIBIL, March 2017; KPMG in India's analysis 2018
based on data obtained from multiple industry reports and primary survey conducted by Nielsen, 2018
Methodology: The projection is based on estimated ratio of average cost of consumer acquisition for online
and offline media in the FinServ industry. The ratio is assumed to be consistent in 2022, and is used to
project incremental spend on mobile-based digital advertisement to tap the premium income opportunity.

97
Mobile-influenced lending opportunity of ~USD701 billion in loans
2017 2022e
Market
opportunity
through
media
friction
reduction
Mobile-
influenced
market Personal
loans
Other
loans
USD24
billion
USD157
billion
*This number can be achieved by reducing the friction, thus increasing the addressable market opportunity
USD482 billion
USD81
billion
USD401
billion
~USD219 billion*
Personal
loansOther
loans
USD38
billion
USD181
billion
Personal
loansOther
loans
Mobile in media mix can create value for lending brands by increasing lending opportunity. Enhancing mobile usage can create a combined opportunity of ~USD701
billion by influencing loan purchases and reducing media friction in consumer’s purchase journey.Loans

98
Credit cards Insurance Loans
Mobile can address
key friction in the
financial services
purchase journey

99
Ability to provide relevant, dynamic and engaging content, coupled with various targeting options, helps mobile address key friction in the financial services purchase journey
Friction points Friction busters
Awareness
Consideration
Intent
Purchase
Consideration
friction
Awareness
friction
Intent
friction
Prospect did not pay enough
attention to ads
Product was not relevant to
the prospect
Prospect did not understand
the language of the ad
Prospect finds too little
information from ads
Prospect does not know what
to do next after watching ads
Media deployment on mobile to drive ad recall retention/brand love and message association while maintaining minimum ad frequency (use of BAO/VV)
Consumer based targeting, lookalike modeling, A/B testing to find the most relevant prospects for ad copies
Use high intent signals on digital destinations to build the most relevant set of users
Use dynamic creative optimisation along with regional language ad creatives for effective ad impact
Have clear call to action along with ad copy to guide on next steps to follow
Messenger/automated chat bots and lead management systems to stay connected with consumers
Creative ad copies with motion visual content describing the process of application/approval (Create2Convert)
Use sequencing of ad communications to deliver detailed information through a combination of static images
Easy information accessibility through automated bots, emails, missed calls, IVRs, and well structured digital destinations of brand ads
Offer communication
is not clearUse sequenced combination of ad creative assets to ensure that details of the offer are made clear
Enable automated chatbots to deliver offer communications based on demand
Prospect finds it difficult to
browse/find informationEnable seamless mobile friendly digital experience that offers detailed information
Use the media channel's capabilities to display detailed information (E.g. canvas ads, carousels, collections)
Prospects find it difficult to
differentiate financial
institutions
No expert advice/answers
available
Use of lead management systems to regularly connect share product brochures or provide an automated IVR based menu to share product details
Enable automated chat bots or automated messaging to provide answers at the users' convenience
Build distinct brand identity and brand love that highlight key USPs using multiple creative assets, through sufficient media planning based on 'always on' method
Prospect could not get
enough information to check
his/her eligibility
Use market signal to identify the stage of user's purchase journey to target them with eligibility details
Build awareness about the process of checking eligibility at the top of the funnel, to ensure next stage movements post the eligibility check
It took too long for the brand
to contact the prospect and
the need lapsed
Enable better call centre processes to connect faster with the user, at a time convenient to the user
Enable the chat bots and automated messaging or automated IVR to provide on demand detailed information
Representative could not
address queries
Use creative communication to facilitate information sharing based on FAQs observed from the market
Enable representatives with interactive digital dashboards on their portable devices
Use a mix of assets to target specific communication to users at different stages based on the intent signals
Prospect does not trust
the mediumBuild awareness on medium using brand imagery and key product USPs, at regular intervals
Enable regularly updated brand communications synchronised on both digital and physical mediums
Prospect finds it difficult
to express interestsUse a combination of calls to actions to collect user's expressed interest, such as lead submission, click to call, click to automated messages and visit to website's specific pages

100
Zero Friction
Future — Reimagining
the Purchase Journey

101

102
AwarenessC
on
sid
era
tion
IntentP
urc
ha
seMobile wi l l change
consumer journeys
A zero friction future

103
Reimagining financial services path to purchase
Consumers in this category no longer belong to a homogenous segment. This has led to the emergence of different pathways, with digital playing a key role in shaping most, if not all, pathways. With increased adoption of digital and rapid enhancement in consumer-friendly technologies, such as AR/VR, consumer analytics through AI, machine learning and personalised offers, the path to purchase is expected to become shorter and smoother. With this increasingly non-linear journey, the purchase cycle seems to be gearing up for a frictionless future
Artificial intelligence leveraged for
financial and offer advisory
End-to-end digital solutions from disbursal
to repayments on FinTech platforms
Telematics, aerial imagery, Internet of Things to assist with claim settlement processes in case of accidents processes
Universal cards
Newer intelligent models to assist consumer
screening for eligibility of loans, cards or insurance
Social media/Messengers to facilitate
payments/purchases
Peer-to-peer lending optionsMobile-based microfinancing
Customised offers, freebies, payment options
Cashless person-to-person transactions
through credit cards
Intuitive form/application filling; one-click
purchase
Blockchain based consumer identification
system and efficient processing
Cognitive inputs to play a critical role in
financial product advisory
User-driven content to play a critical role in
influencing the purchase journey
Instant loan disbursals at the time of
purchase, one-click insurance purchases
Automated data capture, e-KYC and
automated financial checks and verifications

104
Methodology
Phase 2: Deep dive
• Purposive sampling to recruit
respondents for each category
and cohort
• Each cohort helped provide
detailed information at
different stages of the
purchase journey
Aware non-considerers
Considerers
Intenders
Buyers
Reasons for
non-consideration
Influence of media
touchpoints
Reasons for friction
Influence of media
touchpoints
Reasons for friction
Analysing different
paths to purchase
Influence of touchpoints
Reasons for friction
Primary research methodology
The study entails the following approach to identify in-depth understanding of the consumer purchase journey and friction areas therein
Primary research was undertaken by Nielsen India to cover the overall purchase journey of a consumer and understand the friction points at each step of the journey. The study is based on a random listing study on 3,000 respondents to understand the proportion of the population that falls at each stage of the journey. A deep-dive study for the financial services category was conducted on 1,221 respondents split as:
Primary interviews
Detailed interviews were conducted with sector experts to understand key industry trends, friction areas, future pathways and outlook.
Secondary research
Detailed secondary research was undertaken to understand the smartphone industry, market growth and future trends.
Primary research methodology
Phase 1: Listing
Aware decision makers
and influencers
Considerers
Intenders
Buyers
Loss due
to friction
(%)
Loss due to
friction (%)
Loss due
to friction
(%)
Total population
• Listing exercise was conducted to better
understand the proportion in the universe
that falls under each individual cohort at any
given time, and to derive the size of these
cohorts to be applied in the deep dive phase
• It captures incidence of respondents falling
under the different cohorts of consumers i.e.,
buyers, considerers and aware non-
considerers.
• NCCS — New Consumer Classification System
• Listing exercise conducted to derive the drop outs at each stage of the journey for the
categories separately among randomly selected respondents
• Base has been considered as those who are aware of the category and are primary
decision makers/have actively contributed to the decision-making process
• Credit card buyers — aware decision makers and influencers who have applied/tried
to apply for a credit card in the last six months
• Credit card considerers — aware decision makers and influencers who have
considered applying for a credit card in the last six months, but are yet to apply
• Credit card aware non-considerers — aware decision makers and influencers who have not considered applying for a credit card in the last six months
• Insurance buyers — aware decision makers and influencers who have purchased/tried to purchase an insurance policy in the last six months
• Insurance considerers — aware decision makers and influencers who have considered purchasing an insurance policy in the last six months, but are yet to
purchase
• Insurance aware non-considerers — aware decision makers and influencers who have not considered purchasing an insurance policy in the last six months
• Loan buyers — aware decision makers and influencers who have taken/tried to take a loan from financial institutions (Banks, NBFCs, etc.) in the last six
months
• Loan considerers — aware decision makers and influencers who have considered applying for loan in the last six months, but are yet to apply
• Loan aware non-considerers — aware decision makers and influencers who have not considered applying for a credit card in the last six months
Category GenderAge group
(years)NCCS* Cities
Credit cards:
325 Male:
795
18-24:
244 NCCS A:
736
Mumbai: 204
Delhi: 184
Life insurance:
191 Bengaluru:
14925-34:
470Other
insurance: 203
Female:
426NCCS B:
484
Chennai: 249
Personal
loans: 262 35-49:
506
Kolkata: 217
Other loans:
240Pune:218

ABOUT KPMG IN INDIA ABOUT FACEBOOK ABOUT NIELSEN
KPMG in India, a professional services firm, is
the Indian member firm affiliated with KPMG
International and was established in
September 1993. Our professionals leverage
the global network of firms, providing detailed
knowledge of local laws, regulations, markets
and competition. KPMG has offices across
India in Ahmedabad, Bengaluru, Chandigarh,
Chennai, Gurugram, Hyderabad, Jaipur, Kochi,
Kolkata, Mumbai, Noida, Pune, Vadodara and
Vijayawada.
KPMG in India offers services to national and
international clients in India across sectors.
We strive to provide rapid, performance-based,
industry-focussed and technology-enabled
services, which reflect a shared knowledge of
global and local industries and our experience
of the Indian business environment.
.
Founded in 2004, Facebook's mission is to
give people the power to build community and
bring the world closer together. Over 2.2 billion
people globally use Facebook every month to
stay connected with friends and family, to
discover what's going on in the world, and to
share and express what matters to them.
Millions of businesses, big and small, use
Facebook's apps and services to connect with
real people and grow their business.
Rooted in what we’ve learned from over 2
billion people on our platforms and the 6
million businesses that advertise with us,
Facebook IQ provides actionable insights
about people, marketing and measurement.
We offer studies, tools and resources built to
transform how marketers reach people and
deliver real results in this cross-channel, multi-
device world.
Whether you need inspiration for your next big
idea, research on how best to reach the people
that matter most, or the latest in ad
effectiveness, lean on Facebook IQ for insights
and strategies.
Nielsen Holdings plc (NYSE: NLSN) is a global
performance management company that
provides a comprehensive understanding of
what consumers watch and buy. Nielsen’s
Watch segment provides media and
advertising clients with Nielsen Total Audience
measurement services for all devices on which
content — video, audio and text — is
consumed. The Buy segment offers
consumers, packaged goods manufacturers
and retailers the industry’s only global view of
retail performance measurement. By
integrating information from its Watch and Buy
segments and other data sources, Nielsen also
provides its clients with analytics that help
improve performance. Nielsen, an S&P 500
company, has operations in over 100
countries, covering more than 90 per cent of
the world’s population. For more information,
visit www.nielsen.com

106

107
KPMG in India’s team:
Aditya Rath, Vrinda Narang,
Angad Singh, Piyushi Singh,
Rahul Kathuria, Priyam Modi,
Dipesh Agarwal, Sharon D'silva,
Venkatesh R, Nisha Fernandes,
Reema Pawa, Pavithra Sreekumar
Nielsen India:
Anupam Asthana, Kejal Gosar,
Priyanka Awasthi
Acknowledgements

KPMG in India contacts
Mritunjay KapurNational Head – Markets and StrategyHead – Technology Media and TelecomT: +91 124 307 4797E: [email protected]
Arvind GuptaHead – Management Consulting AdvisoryT: +91 124 336 9463E: [email protected]
Harsha RazdanPartner and Head – Consumer MarketsT: +91 22 6134 9663E: [email protected]
Gayathri Parthasarathy
Partner, Head – Financial Services, Advisory
T: +91 22 30902828
Aditya RathPartner – Customer and Channel T: +91 22 3090 2580E: [email protected]
Facebook in India contacts
Sunita G.R
Head of Marketing – India
© 2018 KPMG, an Indian Registered Partnership and a member firm of the KPMG network of independent member firms affiliated with KPMG International Cooperative (“KPMG International”), a Swiss entity. All rights reserved.
The KPMG name and logo are registered trademarks or trademarks of KPMG International.
Facebook Materials™ AND © Facebook, Inc. are used by permission. All rights reserved
This document is meant for e-communication only.
kpmg.com/socialmedia