ellenbrook public environmental review tables & …
TRANSCRIPT

ELLENBROOK MANAGEMENT PTY LTD
ELLENBROOK PUBLIC ENVIRONMENTAL REVIEW
TABLES & DIAGRAMS
Volume 2
711.58( 941)
1111111 1$~ ii
Feilnian Planning Consultants
FEI CopyA Vol 2 I 920277/2
Department of Environmenta' Protection Library


Table 1
Lexia Scheme Groundwater Scheme INCLUDED Groundwater Scheme EXCLUDED
Conservation Area 90 ha 410 ha 90 ha 410 ha
WATER LOAD (Mm3)
Catchment: Northern 0.9 0.7 1.3 1.0
Southern 1.4 1.4 1.4 1.4
Eastern 0.8 0.8 0.8 0.8
3,1 2.9 3.5 3.2 TOTAL
0.2 0.2 0.3 0.3 If No Intercatchment Pumping Increase by
If State Forest Excluded Decrease Load by 0.1 0.2
P EXPORTED (kg)
Catchment: Northern 20 19 46 44
Southern 7 7 8 8
Eastern 10 10 10 10
37 36 64 62 TOTAL
If No Intercatchment Pumping Increase by 5 5 14 15
If State Forest Excluded Decrease P by 1 4
P RETAINED (kg)
Catchment: Northern 105 98 339 316
Southern 66 68 75 77
Eastern 35 35 35 35
206 201 449 428 TOTAL
If No Intercatchment Pumping Increase by 5 5 14 16
7 26 If State Forest Excluded Decrease P by
Fcilrnan Planning Consultants/G.B. Hill & Partners

TABLE 2 I ELLENBROOK DEVELOPMENT ECONOMIC OUTPUT
Lot Construction Dwelling Construction Year No. of Lots Direct
Expenditure 1st Round
111$M Subsequent
III $M Total
Output No. of
Dwellings Direct
Expenditure 1st
Roundt11 Subsequentl'I Total
Output $M
1993 300 7.5 3.72 3.20 6.9 300 13.5 6.7 5.8 12.5
1994 620 15.4 7.7 6.6 14.3 620 27.9 13.0 11.9 24.9
1995 1040 25.8 12.9 11.1 24.0 1040 46.8 23.4 20.1 43.5
1996 1500 37.3 18.6 16.0 34.6 1500 67.5 33.7 29.0 62.7
1997 1500 37.3 18.6 16.0 34.6 1500 67.5 33.7 29.0 62.7
1998 1500 37.3 18.6 16.0 34.6 1500 67.5 33.7 29.0 62.7
1999 1500 37.3 18.6 16.0 34.6 1500 67.5 33.7 29.0 62.7
2000 1500 37.3 18.6 16.0 34.6 1500 67.5 33.7 29.0 62.7
2001 1500 37.3 18.6 16.0 34.6 1500 67.5 33.7 29.0 62.7 2002 1600 39.7 19.8 17.0 36.8 1600 72.0 36.0 30.9 66.9
2003 1600 39.7 19.8 17.0 36.8 1600 72.0 36.0 30.9 66.9
2004 1 1600 39.7 19.8 17.0 36.8 1600 72.0 36.0 30.9 66.9
2005 1600 39.7 19.8 17.0 36.8 1600 72.0 36.0 30.9 66.9
2006 1600 39.7 19.8 17.0 36.8 1600 72.0 36.() 30.9 66.9
2007 1600 39.7 19.8 17.0 36.8 1600 72.0 36.0 30.9 66.9
TOTAL 20560 510.7 254.7 218.9 473.6 20560 925.2 461.3 397.2 858.5 Total Direct Expenditure $510.7 Total Output $473.6
Total Direct Expenditure $925.2 Total Output $858.5

TABLE 3 I ELLENBROOK DEVELOPMENT EMPLOYMENT CREATION
Lot Construction Dwelling Construction Totals
Year No. of Lots
Direct [All
Indirect [Bli
No. of Dwellings
Direct
IA21
Indirect
[132]
[Al+A2] [131+1321
1993 300 63 56 300 114 102 177 158 1994 620 130 117 620 236 212 366 329 1995 1040 219 196 1040 397 355 616 551 1996 1500 316 283 1500 572 512 888 795 1997 1500 316 283 1500 572 512 888 795 1998 1500 316 283 1500 572 512 888 795 1999 1500 316 283 1500 572 512 888 795 2000 1500 316 283 1500 572 512 888 795 2001 1500 316 283 1500 572 512 888 795 2002 1600 337 302 1600 610 546 947 848 2003 1600 337 302 1600 610 546 947 848
2004 1600 337 302 1600 610 546 947 848
2005 1600 337 302 1600 610 546 947 848
2006 1600 337 302 1600 610 546 947 848
2007 1600 337 302 1600 610 546 947 848
TOTAL 20560 4330 3879 20560 7839 7010 12169 10896

Elleabrook Tran.secL
Al
A2
A3
A4
AS
7ype C1assificaion of Wetland A/kr Senteniuk et aL, 1990
sumpland micro concentriform open forest/closed heath/closed sedgeland
dampland meso maculiform open forest/closed heath/closed sedgeland
sumpland micro maculiform open forest/closed heath/closed sedgeland
sumpland micro zoniforin closed heath/closed sedgeland
dampla. I macro maculiform forest/closed heath
Table 4
CLASSIFICATION OF THE VEGETATION OF SOME TYPICAL WETLANDS OF THE ELLENBROOK PROJECT AREA
Ri sumpland micro concentriform forest/closed heath/low, woodland/closed sedgeland
Cl seepage lepto maculiform open woodland/closed heath
Dl seepage meso maculiform woodland/open woodland
El dampland lepto latifbrm closed heath
Fl sumpland micro concentriform forest/closed woodiandiclosed heath/closed sedgeland
Gi sumpland lepto concentriform open forest/closed heath/closed sedgeland
HI sumpland micro concentriform forest/dosed heath/closed sedgeland
II sumpland lepto concentriform open woodland/closed scrub/closed sedgeland
Ji dampland micro betero(orm closed low forest/closed 8edgeland/closed heath
Ki dampland micro concentriform open forest/dosed heath/closed sedgeland
Li dampland lepto maculi(brm closed low forest/closed scrub
Ml sumpland micro gradiform closed sedgeland/closed saub
Ni sumpland lepto concentriform closed woodland/dosed heath/closed sedgeland
Inue4tlory afA sembl4ges
Melaleuca psiasaIAstorea fascicularu/Bouni.ea ariiculata
Melakuaa preissio.nalHypocalymma angus4folium IAsto,rea (ascicuiaris-Baumea articu Iota
Melakuca preissianalPerica!ymma ellipticum lAxtartea fascicuiari.s/Baurnea articuIoa
A.starteo fascicularis/Baumse articu/ata
Melaleuca rhaphiophylla IPeria.i1ymina ellipticumlAztartea fascicuiarislEucalyptus spp.-Banksia app.'
Hypoca1yin,rsa aiigusti[olium/ Banksia littoralie/M. preissiana/Baumea acuta/Astartea fascicularis.Pericatyrarna ellipticum/Baumea artcuIata
M. preissianalA. fascicularis.Lepidosper,na ep.
B. littorolis-M. preissiwsa/E. rudis
Eremaea paucifzora
Metaleuca preissiwza/Bonksia lil&,r&&s. Lepidosperma gladiatum/ A. [ascicularis/ Bawnea acuta/B. orticulata
Melakuca priana.Hypocalymma wsgusti[oliuni /B.aurnea acuta lAstartea fascicuioris/B. art icu lata
Melaleuca preiuiaisalHypocalymma angusti(olium/Astartea (aacicuiaris/Baunseo art icu1ata
Banksia UuomlislAgtartea fascicuiaris/ Pericalymma ellipticum/Bawnea o.cuta/B. atticuiata
Banksia iitioroj.iz/Baumea acuta/Periaüymma ellipticum
MeIø.kuca preisuona-Banksia IUoraiis/C.ajotAwnnus kteroiie-Astargea fascicularis
Banküa IiUoraiislMelaleucc tereti(ojja.M. polygaloides
Baumea acuto ILepidosperina longitudinaZelMelakuca teret4folia.Astartea facicularis/Bauntea o.rticutata
M. preissiana-Banksia littorojis/Astartea fascsculorjg/Baunseo ocuta/Meloleuco iotritja/Baumeo articulata
The varioua assemblages are separated by a alash (I'): Di(Ierent specea which cecur within the same assemblage are separated by a dash (-). For descriptions of the floristics of the wetlands see Appendix A. This assemblage contains a mixture of woodland and wetland species.
DAMES & MOORE

CID

G h 1 Per Annum Output Creation rap
Lot & Dwelling Construction
$ Million 120 110 i g ]
80 - 70 - 60-
40
10
1992 1994 1996 1998 2000 2002 2004 2006 1993 1995 1997 1999 2001 2003 2005
Lots - Dwellings - Total
Cumulative Output Creation Graph 2
Lot & Dwelling Construction
S Million 1400 1300 - 1200 - 1100 - 1000-
II 400 300 2001 -
100 I I I I I I
1992 1994 1996 1998 2000 2002 2004 2006 1993 1995 1997 1999 2001 2003 2005
Lots Dwellings Total
Feilman Planning Consultants/Housing Industry Association

'Graph 3 Per Annum Employment Creation Total Lot & Dwelling Construction
No of Jobs 2000
1750 , .
1500
1250'
500 -
250
0 ' I I
1992 1994 1996 1998 2000 2002 2004 2006
1993 1995 1997 1999 2001 2003 2005
- Direct Employment —i--- Indirect Employment Total
Gra h 4 Cummulative Employment Creation Total Lot & Dwelling Construction
25000- No of Jobs
20000-
15000-
i:::o
1992 1994 1996 1998 2000 2002 2004 2006 1993 ' 1995 1997 1999 2001 2003 2005
Direct Employment —i-- Indirect Employment IK Total
Feilman Planning Consultants/Housing Industry Association


Feilman Planning Consultants
MARALCA ROAD
MT LAWLEY
SANVA VINES ? ty =iT \Pty Ltd \ '
CROWN LAND
HOMESWEST \\\\\\
.- S.E.C. W . A\
U
PINE PLANTATION : (STATE FORE
rn in
1------i \
ELLENBROOK DEVELOPMENT BOUNDARY
........ ......... OWNERSHIP BOUNDARY
\ \I ......... PROPOSED URBAN ZONING
kc\I-.I PROPOSED REGIONAL OPEN SPACE ZONING (Conservation Area)
AREA PROPOSED FOR DEVELOPMENT & LAND OWNERSHIp
Figure 1

I
SOURCE: METROPLAN REPORT PRODUCED BY D.P.U.D. METROPLAN
Feilman Planning Consultants
SCALE 10
kornrii)5
A\ \\\ wO I \\\\\\
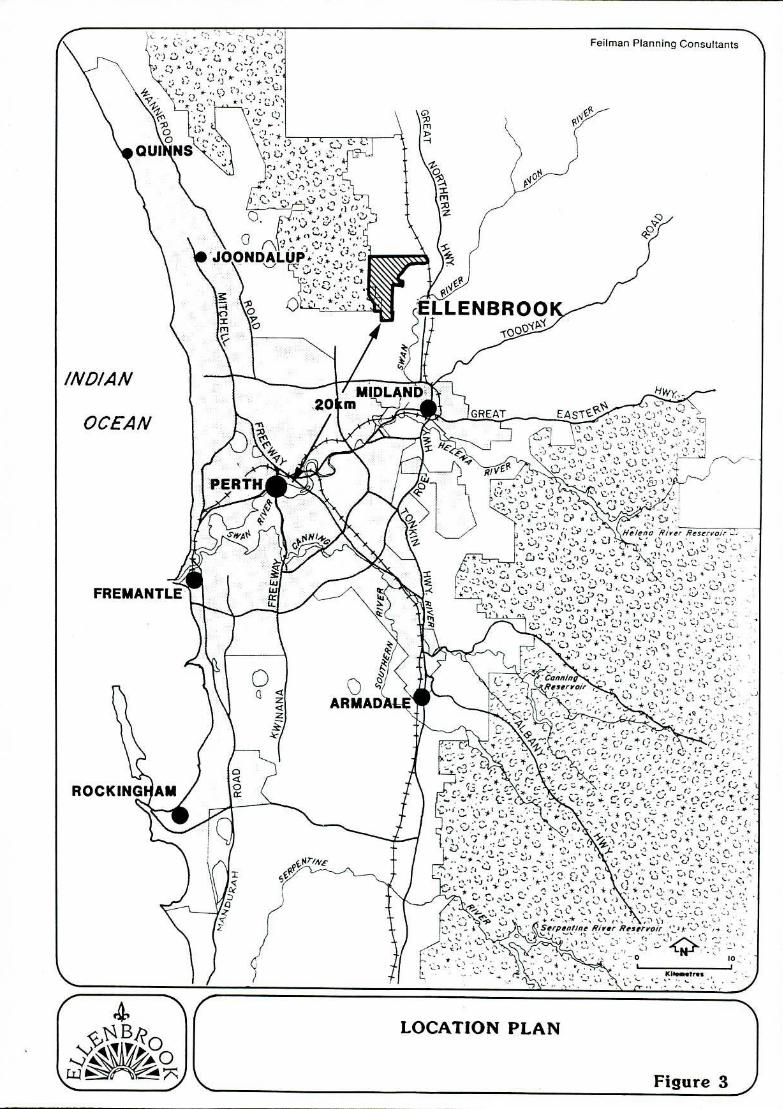
h Joond lup 00
/ZO .*ELLENBROOK\N\ INDIAN
Morley Midland
Stir hng 0 -
OCEAN • Peh
1 • ;annin
Fremantle
. :7FI-
%: :
0
/
}Aima
/o cc cc
Rockim °
- Cl)
LEGEND
LIII Urban Rural/Non-Urban (I) Airports
Future Urban Groundwater Catchment ' Harbours
Region Open Space Surface Water Catchment - Major Road System
Major Industry Proposed Surface Water Catchment
u'... Railway
Escarpment Protection • Strategic Regional Centre 4 Future Urban Growth Option
METROPLAN 1990: METROPOLITAN STRATEGY
Bj METROPLAN
Figure 2
T
E
'i33dd
14
cc avO
w
cc IL
Ul
C
)
cc —
S
I
OK
O
4I
) -
I.
)•.'
- 2
-
SI
)
Lj
) )
4
I
(J
A
'ck
v.
(2
& )
*
•
-
1 I
) • )(
J4
-
4 *
;
-)
I
:
4
-
AL Li
- 3
W
4
)
IIINY
1
j •1
)
( -
)
30
/\ R
WE
R
I
z
z
0
I.- 0
0
I.j

I
.SOURCE: URBAN EXPANSION REPORT PRODUCED BY D.P.U.D.
Feilman Planning Consultants
PERTH. WESTERN AUSTRALIA
-
------
---------------
1.8
"A~ 10 10
ir
Ji
Ii
A,
s' 22
.-
-
—j---,°' C
—
31
Allumos
S. Neerabup
- 9 Landodale / 10. lanceai.
0....! It. Befirue
— -r' 12. LipperSw.o
--C. ., ,•
13, Henley Brook - ¶4. Henley Brook
— \
39 I 15 Beeclrboro
— 16. kBl.rrdon
0 - 17. Hero. Hill
. .
Midde Swan WexCOnrbe
.Roeetriil
. 21. Helena Valley 22. High Wycombe 23. MaideVale 24. ForrietSeld - West
-_ 25. FOrTenSQId Wattle Grove Martin Casotltrg Vale C.rrrrirrg Vale Southern River
METROPOLITAN REGION SCHEME ZONES LAND SUITABLE FOR URBAN DEVELOPMENT 31. Armadele
[J Urban Special Indus Industrial end Raiways and Category A—Ralaliv.lv Unco.rgtreined tar Development 32. Wungong
trial Port ln.rali.tlorra Movement of Development Front 33. Byfotd
Urban Deterred [J Rural Category B—Constreinte to Development
Central City Area [J Public Purposes [J Store Foreate £ Major New Intlustlial Areas 36, Thomson. Lake
- - - Metropolitan Controlled Access Important Regional 37, Mandea1uP
Region Sc,eme and 0th.. Major "" Road. 38. Parmeba
Boorrdary Highways 39. BalcEvia 40. Kamup
URBAN EXPANSION POLICY
4rNO ~~k fl Y) I-
Figure 4

URBAN EXPANSION POLICY CATEGORY A. LAND
Figure 5

/
-
j - - -
- -
- ='I -.--'--'- -- - - ______i - ±I•$---
Feilman Planrilno Consultants
I
BJ?
CURRENT SHIRE OF SWAN ZONING
1-i-I 1 Figure 6A

Feilman Planning Consultants
CURRENT METROPOLITAN REGION SCHEME ZONING
Figure 6B

Feilman Planning Consultants
.,
r t jr- - -- a.- .• -.-r- . - &_ i. .s. ,.- - -
•1' 5
I
—j rFARMLAND
-
-
S. 5 :- ..S
.• -.
PINE I
PLANTATION - BANKSIA 1 — 'iWOODLAND-
1 ' ' 5SS 5' \ .
- \
- S..-. \
.
S •5 5 . - -. - . ---•...
'55S
- :-- s I.) . S...Sz S - JI7N
II 7.- THE i'
1 VINES " 1RESORT
.- •\... . - _.X5._ . -' .--- s.-'. . .-,
- ' — -- - .--'-- '
- — -- —i.--
q. PIN PLANTATION
'-±'--- /
X.
A. PINE PLANTATION
F r 1 7
:t
'S4.4SAND QUARRIES
.a. . ... --
-5' -5 -
— ç..5 -
..:t•$ -, -
Ob
WHITEMAN PARK
j r
— S SPECIAL RURAL h
BJ?
EXISTING LAND USES
Figure 7

IGHW
GR
EA
T
EL
-j
-
-------------------- LU
-
9
all
RO
AD
'I)
0
1.1 z 0
()
z 0
I
w
0
0
Co

Figure 9
DRAINAGE PATTERNS

PINE PLANTATION
- --- -- I -
SOURCE: DAMES & MOORE Feilman Planning Consultants
Sawpit Gully -
(•. .1 r-. 0 (-• •
I - ariksia'woodland I'
7 /Dç'
LEGEND
f WETLAND
ç.j VARIOUS TYPES OF DAMPLAND
Bj?
VEGETATION MAP
Figure 10

SOURCE: E.P.A. reiman ruannIrg oiiuitii
-----------------
-411
-- \\
iLLL tLL
( 4 Bj
~ 44,~-kk I o
LAKES AS DEFINED BY E.P.A. DRAFT ENVIRONMENTAL PROTECTION POLICY
Figure 11

Feilman Planning Consultants
It
FT
PROPOSED RESERVATION
Figure 12

Feilman Planning Consultants
SOURCE: W.A.W.A.
------------
w I \J
U
WANNEROO GWs
• U • .
• STATE
FOREST
No. 65 Io
-;o. MIRRASOOKA
UWPCA & PWSA
PAW
___.c.p/, •--.-7 \\\ f
/ . I
c
53C ';\ (
SWAN \\\ GROUNDWATER .__.__\ \\\ .'
AREA
terco Spp1v Bore
Sauce1
State Forest Bourdary
- — Surface Draunoce
Monstorung Bore
PropOsed Lexie Schere Bore
Bj
EXISTING MONITORING BORES
AND PROPOSED LEXIA BOREFIELD
Figure 13

SOURCE: G.B.HILL & PARTNERS Feilman Planning Consultants
SKETCH OF DETENTION BASIN
BASINS 10 BE SIZED TO ATTENUATE STORM FLOWS, TO REDUCE THROUGH FLOW VELOCITIES AND PROVIDE ADEQUATE DETENTION TIME 10 ACHIEVE SPECIFIED NUTRIENT REDUCTION.
T.W.L.
FLOW IN
FLOW OUT
SURCHARGE STORAGE
BASE STORAGE
SECTION THROUGH DETENTION BASIN
TYPICAL DETENTION BASIN
Figure 14

C 11I1 I I CI liii '.JJfl¼.'. rluI_l_ rn I
'
12
f26
i:
23
16
17
_ 29/6
EJTT* IftI I -
F 1 i 7 '1 T
9... PROPOSED DETENTION BASIN LOCATIONS
DRAFT E.P.P. WETLAND AREAS
WETLAND AREAS PROPOSED DETENTION BASINS
(2-15 ha each) Figure 15j
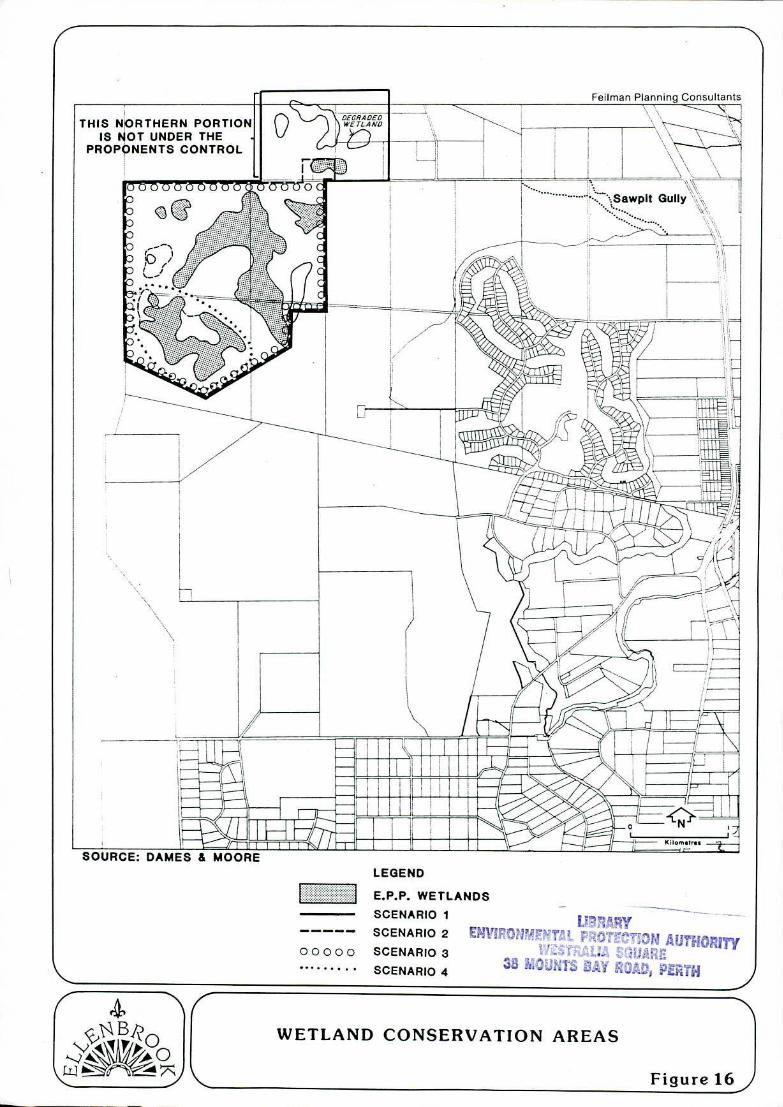
THIS NORTHERN PORTION IS NOT UNDER THE
PROPONENTS CONTROL
Feilman Planning Consultants
OEGRAOEO \WETLA#iD -
\ \
Saw pIt Gully
T4y
-T- -' I
NJ
vri.it: uAmtb 6 MVUH
LEGEND
E.P.P. WETLANDS --
SCENARIO 1
SCENARIO 2 'V r-,.. i: '
r >4 00000 SCENARIO 3 :--
SCENARIO 4
WETLAND CONSERVATION AREAS
Figure 16J