elsevier - why scopus
TRANSCRIPT
| 1
Why Scopus? Research Management moving forward
Scopus coverage, improvement and comparison with main competition Marina D’Ambrosio – Account Manager South Europe

| 2
1- Scopus adoptions worldwide 2- Scopus improvements in coverage and planned further improvements for 2016 3- Scopus and the competition overview 4- Regional focus of Scopus with content surplus and language specific coverage
Agenda

| 3
21,568 peer-reviewed journals 361 trade journals • Full metadata, abstracts
and cited references (ref’s post-1995 only)
• Pre-1996 cited ref’s expansion >5M out of >10M
• Going back to 1823 • Funding data from
acknowledgements
Physical Sciences 11,725
Health Sciences 12,912
Social Sciences 9,810
Life Sciences 6,318
JOURNALS
88K events 7.2M records (12%) Conf. expansion (2005 – 2013) 1,017 conferences 6,022 conf. events 410K conf. papers 5M citations Mainly Engineering and Physical Sciences
CONFERENCES
531 book series - 30K Volumes - 1.2M items 114,266 stand-alone books - 917K items Books expansion: 120K books by early 2016 - Focus on Social Sciences and A&H
BOOKS
Different source types are added to ensure that coverage, discoverability, profiles and impact measurement for research in all subject fields is accounted for in Scopus.
Source: Scopus.com and Scopus title list (November 2015)
Scopus is the largest abstract and citation database of peer-reviewed research literature

| 4
Scopus article growth over years
0
500.000
1.000.000
1.500.000
2.000.000
2.500.000
3.000.000
3.500.000
2004 2005 2006 2007 2008 2009 2010 2011 2012 2013
Physical Sciences Health Sciences Life Sciences Social Sciences
Source: Scopus data 13 May 2014

| 5
More than 3500 organizations, including more than 150 funding and assessment bodies, use Scopus

| 6
Scopus vs. Main Competitor subject area compared
Scopus 22,245
Main Competitor 12,410
Scopus 7,443 (+73%)
Comp 4,291
Scopus 6,795 (+96%)
Comp 3,472
Scopus 4,492 (+50%)
Comp 3,002
Scopus 8,086 (+99%)
Comp 4,060
Physical Sciences Health Sciences Life Sciences Social Sciences
~12K titles (Core Collection) 3,300 publishers Updated weekly
~22K titles >5,000 publishers Updated daily
Sources: Main competitor Real Facts, Main Competitor list and Scopus’ own data (April 2015)
MAIN COMPETITOR
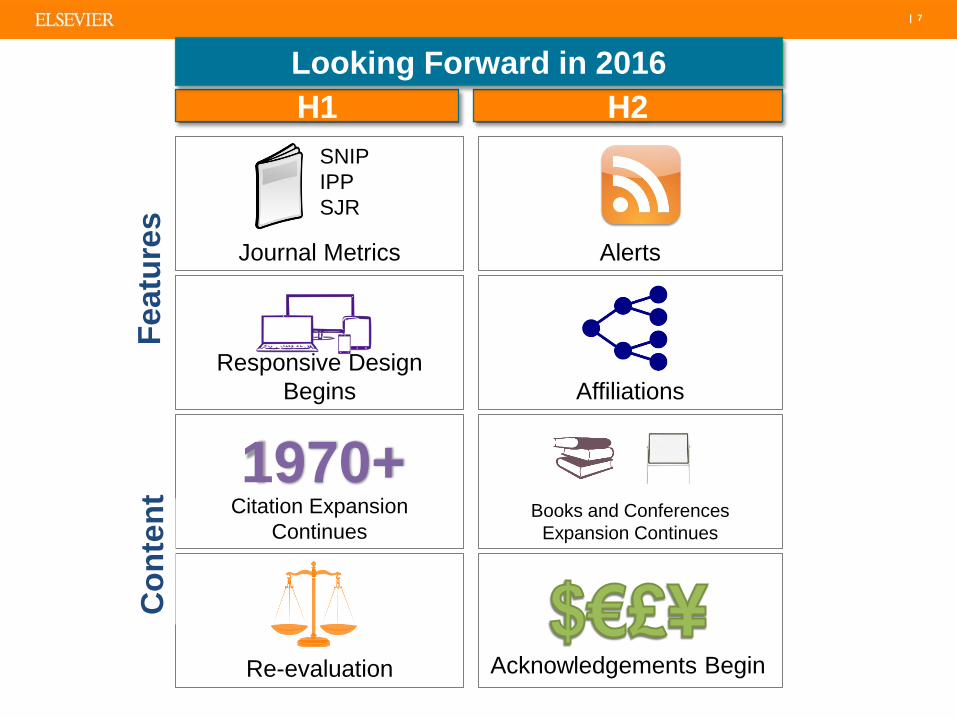
| 7
Journal Metrics
Responsive Design Begins
Citation Expansion Continues
Alerts
Affiliations
Books and Conferences Expansion Continues
H1 H2
1970+
SNIP IPP SJR
Looking Forward in 2016
Feat
ures
C
onte
nt
Re-evaluation Acknowledgements Begin

| 8
Journal Indexing Differences
Scopus offers access to more than 10,000 titles not included in the Main Competitor (Scopus Unique titles) and a total of almost 23,000 indexed titles Competitor indexes around 50-70 titles that do not meet the Scopus Content Selection Criteria and are therefore not covered in Scopus

| 9
Scopus content surplus per region in %
Scopus
Main Competitor
0
2.000
4.000
6.000
8.000
0
200
400
600
800
+267%
0
2.000
4.000
6.000
8.000
10.000
12.000
0
500
1.000
1.500
2.000
2.500Asia Pacific
+326%
Eastern Europe incl Russia
0
500
1.000
1.500
0
200
400
600
800
1000+305%
Latin America Middle East & Africa
Western Europe
0
100
200
300
400
500
+246%
+248%
North America
Australia/New Zealand
+160% +168%

| 10
22245
12410
0
5000
10000
15000
20000
25000
Number of titles
5000
3300
0
1000
2000
3000
4000
5000
6000
Number of publishers covered
58 M
53.2 M
0
10
20
30
40
50
60
70
Number of Records (million)
Main Indexing records differences between Scopus and Competitor
Scopus
Main Competitor

| 11
This increased visibility is true for all member states although it varies from one country to another, from +5% to +71%
32%
25%
36% 42%
39%
26% 26% 24% 29%
32% 29%
33% 34% 32% 28%
16%
5%
43%
71%
25% 29% 28%
15%
30% 27% 25% 25%
21%
Percentage of additional publications visible in Scopus or Main Competitor(2009-2013)
Scopus Scopus Competitor
Source: Web of Science and Scopus, 2009-2013 data * The sum of document types in Web of Science does not add up (multiple counting)
Average: +29.5%

| 12
Scopus also gives a much better view of local content in local languages
Scopus Scopus Competitor
Source: Web of Science and Scopus, 2009-2013 data
1,3 1.7 2.0 2.0
2.6 3.0 2.1
3.7
2.3 2.9
4.2
2.4 2.3
4.2
3.1
37.2
3.2
5.1
NA
14.6
43.8
1.5
Ratio between the number of publications in Scopus versus Main Competitor per publication language
(2009-2013)

| 13
Scopus displays ~5% more peer-reviewed publications of Amílcar Falcão than the Competition
Distribution of Amílcar Falcão’s publications in Scopus and Competition
Source: Scopus and Web of Science, data extracted on September 4th, 2015
120 common publications
50 unique publications All meeting abstracts,
which are not covered in Scopus (not considered as
peer-reviewed content) and gathering all together
5 citations
7 unique publications - 4 articles - 2 book chapters - 1 review
100% of Amílcar Falcão peer-reviewed publications indexed in Main Competitor are also covered in Scopus. In addition, Scopus displays 7 additional peer-reviewed publications
Main Competitor
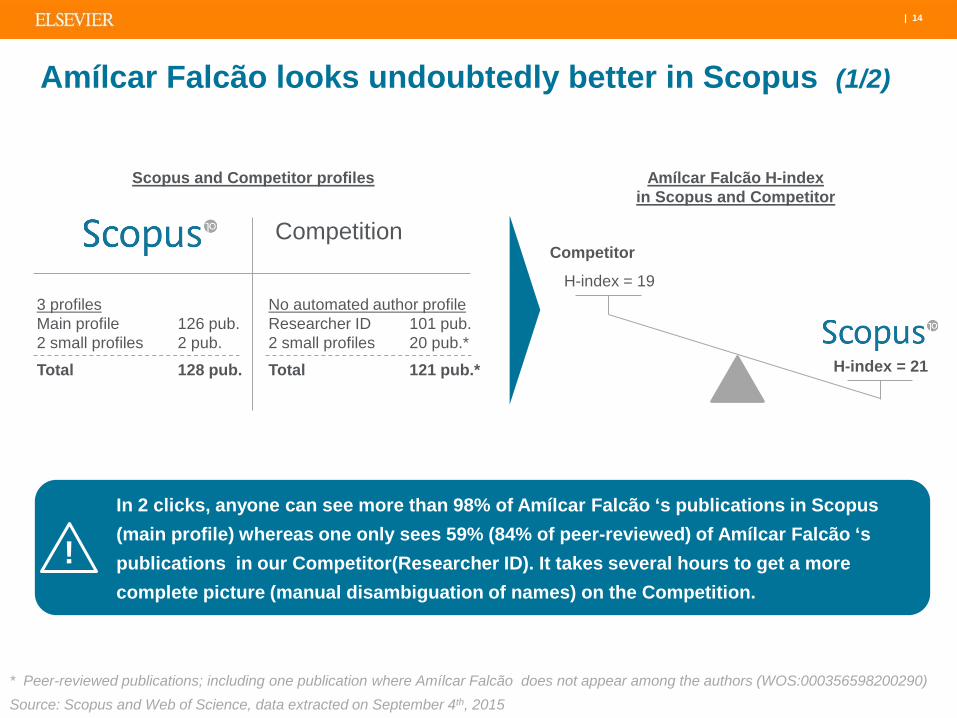
| 14
Amílcar Falcão looks undoubtedly better in Scopus (1/2)
Scopus and Competitor profiles
Source: Scopus and Web of Science, data extracted on September 4th, 2015
In 2 clicks, anyone can see more than 98% of Amílcar Falcão ‘s publications in Scopus (main profile) whereas one only sees 59% (84% of peer-reviewed) of Amílcar Falcão ‘s publications in our Competitor(Researcher ID). It takes several hours to get a more complete picture (manual disambiguation of names) on the Competition.
Amílcar Falcão H-index in Scopus and Competitor
3 profiles Main profile 126 pub. 2 small profiles 2 pub.
Total 128 pub.
!
No automated author profile Researcher ID 101 pub. 2 small profiles 20 pub.*
Total 121 pub.*
* Peer-reviewed publications; including one publication where Amílcar Falcão does not appear among the authors (WOS:000356598200290)
H-index = 19
H-index = 21
Competition Competitor

| 15
Amílcar Falcão looks undoubtedly better in Scopus (2/2)
Amílcar Falcão top-cited publications in Scopus and the competition (number of citations in each database)
Source: Scopus and Web of Science, data extracted on September 4th, 2015
Article Delta
Linear regression for calibration lines revisited: weighting schemes for bioanalytical methods 216 230 +6,5%
Pharmacokinetic and safety profile of trans-resveratrol in a rising multiple-dose study in healthy volunteers 117 153 +30,8%
Intranasal Drug Delivery: How, Why and What for? 74 100 +35,1%
Single-dose and steady-state pharmacokinetics of eslicarbazepine acetate (BIA 2-093) in healthy elderly and young subjects 61 66 +8,2%
Effect of renal impairment on the pharmacokinetics of eslicarbazepine acetate 50 57 +14,0%
Lamotrigine analysis in blood and brain by high-performance liquid chromatography 41 46 +12,2%
Pharmacokinetics of Trans-resveratrol Following Repeated Administration in Healthy Elderly and Young Subjects 39 46 +17,9%
Effect of food on the pharmacokinetic profile of trans-resveratrol 37 45 +21,6%
Effect of gender on the pharmacokinetics of eslicarbazepine acetate (BIA 2-093), a new voltage-gated sodium channel blocker 37 41 +10,8%
Pharmacokinetics, efficacy, and tolerability of eslicarbazepine acetate in children and adolescents with epilepsy 27 29 +7,4%
Total 699 813 +16,3%
Competitor

| 16
What is more: Scopus brings you much more information about your publications and who is interested in your research
Metrics available in Scopus for the article “Linear regression for calibration lines revisited: weighting schemes for bioanalytical methods”
Source: Scopus, data extracted on September 4th, 2015
More details on Mendeley readers

| 17
What is more: 100% of Amílcar Falcão ORCID profile is indexed in Scopus
Amílcar Falcão’s ORCID profile vs. Scopus
Source: Scopus and ORCID, data extracted on September 4th, 2015
122 common publications
138 publications (including 16 duplicates – duplicate imports from Pubmed and
Scopus)
6 unique publications
Scopus automatically updates ORCID profiles of researchers who’ve linked their ORCID and Scopus profiles !

| 18
Questions? Comments?
Thank you for your attention