eltd1, a potential new biomarker for gliomas.12
TRANSCRIPT
ELTD1, a Potential New Biomarker for Gliomas
BACKGROUND: Glioblastoma multiforme (GBM), a high-grade glioma, is characterizedby being diffuse, invasive, and highly angiogenic and has a very poor prognosis.Identification of new biomarkers could help in the further diagnosis of GBM.OBJECTIVE: To identify ELTD1 (epidermal growth factor, latrophilin, and 7 trans-membrane domain-containing protein 1 on chromosome 1) as a putative glioma-associated marker via a bioinformatic method.METHODS: We used advanced data mining and a novel bioinformatics method topredict ELTD1 as a potential novel biomarker that is associated with gliomas. Validationwas done with immunohistochemistry, which was used to detect levels of ELTD1 inhuman high-grade gliomas and rat F98 glioma tumors. In vivo levels of ELTD1 in rat F98gliomas were assessed using molecular magnetic resonance imaging.RESULTS: ELTD1 was found to be significantly higher (P = .03) in high-grade gliomas(50 patients) compared with low-grade gliomas (21 patients) and compared well withtraditional immunohistochemistry markers including vascular endothelial growth factor,glucose transporter 1, carbonic anhydrase IX, and hypoxia-inducible factor 1a. ELTD1 geneexpression indicates an association with grade, survival across grade, and an increase inthe mesenchymal subtype. Significantly high (P , .001) in vivo levels of ELTD1 wereadditionally found in F98 tumors compared with normal brain tissue.CONCLUSION: Results of this study strongly suggests that associative analysis was ableto accurately identify ELTD1 as a putative glioma-associated biomarker. The detection ofELTD1 was also validated in both rodent and human gliomas and may serve as anadditional biomarker for gliomas in preclinical and clinical diagnosis of gliomas.
KEYWORDS: ELTD1, Glioblastomamultiforme, Gliomas, Immunohistochemistry, Molecular magnetic resonance
imaging, Rat F98 glioma model
Neurosurgery 72:77–91, 2013 DOI: 10.1227/NEU.0b013e318276b29d www.neurosurgery-online.com
Gliomas represent 40% of all primarycentral nervous system tumors diagnosed.Among them, glioblastoma multiformes
(GBMs) are the most malignant, with a very poorsurvival time of approximately 15 months for mostpatients with this tumor.1 High-grade gliomas arethe most common primary brain tumors in adults,and their malignant nature ranks them highlyregarding cause of cancer death.1 Grading andidentification criteria that can be used to provideinformation regarding tumor behavior includecell proliferation (cellularity and mitotic activ-ity), nuclear atypia, neovascularization, and thepresence of necrosis and/or apoptotic regions.2,3
Differences in molecular composition betweentissue types or biomarkers can be used diagnos-tically to classify tumors and assess prognosis.Molecular markers have increasingly beenused to assess and manage adult malignant
Rheal A. Towner, PhD*
Randy L. Jensen, MD, PhD¶
Howard Colman, MD, PhD¶
Brian Vaillant, MDjjNataliya Smith, PhD*
Rebba Casteel, BSc*
Debra Saunders, BSc*
David L. Gillespie, PhD¶
Robert Silasi-Mansat, PhD‡
Florea Lupu, PhD‡
Cory B. Giles, BSc§
Jonathan D. Wren, PhD§
*Advanced Magnetic Resonance Center;
‡Cardiovascular Biology; §Arthritis and
Clinical Immunology, Oklahoma Medical
Research Foundation, Oklahoma City,
Oklahoma; ¶Huntsman Cancer Institute,
University of Utah Health Sciences Cen-
ter, Salt Lake City, Utah; jjThe Methodist
Hospital (BV), The Methodist Neurolog-
ical Institute, Houston, Texas
Correspondence:
Rheal A. Towner, PhD,
Advanced Magnetic Resonance Center,
Oklahoma Medical Research
Foundation,
825 NE 13th Street,
Oklahoma City, OK 73104.
E-mail: [email protected]
Received, October 27, 2011.
Accepted, September 18, 2012.
Published Online, October 23, 2012.
Copyright ª 2012 by the
Congress of Neurological Surgeons
WHAT IS THIS BOX?
A QR Code is a matrix
barcode readable by QR
scanners,mobilephones
with cameras, and
smartphones. The QR
Code above links to
Supplemental Digital
Content from this
article.
ABBREVIATIONS: AA, anaplastic astrocytoma; Ab,
antibody; AO, anaplastic oligodendroglioma; CAIX,
carbonic anhydrase IX; CLIO, cross-linked iron oxide;
EGF, epidermal growth factor; ELTDI, endothelial
growth factor, latrophilin, and 7 transmembrane-
containing protein 1 on chromosome 1; GAMMA,
global microarray meta-analysis; GBM, glioblastoma
multiforme; Gd, gadolinium; Gd-DTPA, gadolinium-
diethylenetriaminepentaacetic acid; IHC, immuno-
histochemistry; iNOS, inducible nitric oxide synthase;
LGA, low-grade astrocytoma; TE, echo time; TCGA,
The Cancer Genome Atlas; VEGF, vascular endothe-
lial growth factor; VEGFR2, vascular endothelial
growth factor receptor 2
Supplemental digital content is available for this article.
Direct URL citations appear in the printed text and are
provided in the HTML and PDF versions of this article on
the journal’s Web site (www.neurosurgery-online.com).
RESEARCH—ANIMALTOPIC RESEARCH—ANIMAL
NEUROSURGERY VOLUME 72 | NUMBER 1 | JANUARY 2013 | 77
Copyright © Congress of Neurological Surgeons. Unauthorized reproduction of this article is prohibited.
gliomas.2,4-8 The most useful are markers that can predictresponse to certain therapies and guide clinical decisions. Themost recent biomarkers are from genome-wide surveys associat-ing somatic mutations with the risk of glioma development.Molecular biomarkers most commonly used to evaluate adultmalignant gliomas from biopsy samples include 1p/19qco-deletion, methylation of the O6-methylguanine–DNA meth-yltransferase gene promoter, alterations in the epidermal growthfactor (EGF) receptor pathway and isocitrate dehydrogenase 1and isocitrate dehydrogenase 2 gene mutations.2,4-9 Dozens ofproteomics-based approaches have sought to find proteins thatare unique to gliomas,10 but have been severely limited by issuesof sample size, ability to detect low-abundance proteins, andreproducibility. Many of these studies have generated hundredsand even thousands of putative candidates, yet have not beenable to follow them up with subsequent validation andcharacterization.
Via a bioinformatics method developed by our group,11-14
we conducted a global meta-analysis of approximately 18 000microarray experiments from the National Center for Bio-technology Information database to identify gene sets con-sistently coexpressed across heterogeneous conditions. Afteridentifying these gene sets, an automated, large-scale analysis ofthe peer-reviewed literature was conducted12,13 to identify genesthat are consistently transcribed with established glioma-relatedgenes, but which have themselves never been associated withgliomas in the literature. This process was used to identifyELTD1 (EGF, latrophilin, and 7 transmembrane domain-containing protein 1 on chromosome 1) as a novel gene thatmay be an important biomarker for the confirmation anddetection of gliomas.
ELTD1 is not well characterized. Based on its sequence,ELTD1 is a member of the secretin family of G protein–coupledpeptide hormone receptors and belongs to the EGF-7 trans-membrane subfamiliy.15 Structurally, it contains a large extra-cellular domain with EGF-like repeats, a 7-transmembranedomain, and a short cytoplasmic tail.15 ELTD1 was firstidentified to be developmentally regulated in rat fetal andpostnatal cardiomyocytes.15 ELTD1 has also been identifiedwith its ligand dermatan sulfate in rheumatoid synovial tissue inrheumatoid arthritis patients.16 In more obscure roles, variationsin ELTD1 have been thought to be a risk factor for cannabis usedisorders,17,18 tick burden in cattle,19 and subcutaneous fatthickness.20 Of more importance to cancer, ELTD1 has beenconsidered an endothelial marker in microvasculature.21 Our goalin this study was to determine whether ELTD1 could be used asa marker for glioma-related processes, and use immunohisto-chemistry (IHC) and molecular magnetic resonance imaging(MRI) to validate its presence in human and rodent gliomas.
MRI is becoming one of themost commonly used techniques toprovide information on brain tumor growth, vasculature, bio-chemical metabolism, and molecular changes in preclinicalmodels, as MRI is the optimal imaging tool used in the diagnosticprocess for human gliomas.22 Molecular alterations can be
assessed with the use of targeting magnetic resonance (MR)contrast agents, which can specifically indicate levels of cancerbiomarkers that may be elevated in malignant tumors.22 Thedevelopment of targeted imaging ligands attached to MRIcontrast agents allows the in vivo evaluation of tumor biology,such as tumor cell apoptosis, angiogenic blood vessels, and theexpression of specific tumor antigens or signaling pathways.23
Molecular imaging involves the coupling of a targeting moiety(antibody [Ab] or peptide targeted to a protein of interest) toa reporter molecule (eg, MRI contrast agent). Commonly usedMRI contrast agents are gadolinium (Gd)-based compounds andiron oxide–based nanoparticles.In this study, we identified ELTD1 as a putative glioma-
associated marker via a bioinformatic method and experimentallyvalidated its presence in both rodent and human gliomas via IHCand molecular MRI analyses in an F98 rodent glioma model. ForIHC, ELTD1 was compared with traditional IHC markers forhuman gliomas including vascular endothelial growth factor(VEGF), glucose transporter 1 (GLUT-1), carbonic anhydraseIX (CAIX), and hypoxia inducible factor-1a (HIF-1a). ELTD1expression in human gliomas was also evaluated from geneexpression databases (Rembrandt, Erasmus, and The CancerGenome Atlas [TCGA]) to establish whether this biomarker isdifferentially expressed in varying glioma grades.
PATIENTS AND METHODS
Immunohistochemistry
The human tissue sample portion of the study was conducted incompliance with the University of Utah Health Sciences CenterInstitutional Review Board. For IHC analysis, GBMs, anaplastic astrocy-tomas (AAs), and anaplastic oligodendrogliomas (AOs) (high-gradegliomas: 50 patients, 21 female and 29 male; 40 GBMs: 6 AAs, 4 AOs)were comparedwith tumors classified as low-grade gliomas (21 patients: 10female, and 11 male; 11 oligodendrogliomas: 10 low-grade astrocytomas(LGAs), including benign oligodendrogliomas. Abs to ELTD1 wereavailable commercially (human specific Abs all used for IHC: all are rabbitpolyclonal anti-human Abs; CLS-C40639 [LifeSpan BioSciences, Inc,Seattle, Washington]; NBP1-84775 [Novus Biologicals, Novus USA,Littleton, Colorado]; and PA1-32729 [Thermo Fisher Scientific Inc.,Rockford, Illinois]; all human Abs were assessed and found to providesimilar results; dilution was 1:500 and rodent Ab specific for both mouseand rat, recommended use for IHC and Western blotting: ETL (N-20):sc-46951; goat polyclonal anti-mouse, peptide mapping near theN-terminus of ETL [Santa Cruz Biotechnology, Inc, Santa Cruz,California; dilution was 1:100]). A lack of cross-reactivity between humanand rodent Abs is illustrated in supplementary Ab data (see Appendix 1,Supplemental Digital Content 1, http://links.lww.com/NEU/A501. Lackof cross-reactivity between human and rat ELTD antibodies. IHC slidesfor human GBMs and rat F98 gliomas, in which human GBM and ratF98 tumor tissues were stained with either anti-human ELTD or anti-ratELTD antibodies. Note only positive staining of human GBMs whenstained with anti-human ELTD Ab or when rat F98 tumors are stainedwith anti-rat ELTD Ab. First slide is ·10 magnification, second slide is·20 magnification, and third slide is ·40 magnification.) A toluidine blue(0.1%) counterstain was used (15 seconds). For human tissues, IHC was
TOWNER ET AL
78 | VOLUME 72 | NUMBER 1 | JANUARY 2013 www.neurosurgery-online.com
Copyright © Congress of Neurological Surgeons. Unauthorized reproduction of this article is prohibited.
performed using the Vectastain ABC Kit (Vector Laboratories, Burlingame,California). Negative controls were performed by replacing the primary Abwith nonimmune serum. Slides were examined using an Olympus BX41microscope (Center Valley, PA, USA). Under ·200 (10 ocular · 20objective) magnification, slides were scored by 2 investigators blinded to thespecimen tumor grade and patient information. A score of 0 to 4 (0, 0-25%;1, 25%-50%; 2, 50%-75%; 3, 75%-100%; 4, 100%) was assigned basedon the number of cells stained in a given field. In previous studies wedemonstrated that this method was very reproducible as demonstrated bygood interrater reliability (P = .99, 95% confidence interval: 0.99-1.00) andintrarater reliability (P = .96; 95% confidence interval: 0.92-0.99).24 Eachinvestigator reviewed the slide at low power and at random high-powerfields independently of the other investigator when determining the IHCscore. Scores of 2 to 4 were considered positive expression, whereas scores of0 and 1 were considered negative expression.For the rat F98 glioma tissues, IHC fluorescence staining was done for
the endothelial cell marker, CD31 (fluorescein isothiocyanate–labeleddonkey anti-mouse Ab). For ELTD1, a secondary Ab (Cy3-labeleddonkey anti-goat; Jackson ImmunoResearch, Suffolk, England) was usedto detect the anti-ELTD1 Ab in the anti-ELTD1 probe. Rat brains wereextracted after the 3-hour molecular MRI protocol; the tumor side andcontralateral side of the brain were cut and fixed in Z-fixative (zincformalin: formaldehyde 3.7%, zinc sulfate). The tissue was then washedwith phosphate-buffered saline and incubated with 15% sucrose beforeembedding in an OCT (optimal cutting temperature) compound andfreezing in liquid nitrogen. The cryosections were then stained witha secondary Ab (Cy3 [blue]-labeled donkey anti-goat [Jackson Immu-noResearch]) to target the anti-ELTD1 (ETL) Ab, and a fluoresceinisothiocyanate (red)–labeled donkey anti-mouse Ab to target the anti-CD31 (CD31; mouse monoclonal anti-rat; Dako Denmark, Glostrup,Denmark) Ab within the brain tissue. The nucleus was stained with4’,6-diamidino-2-phenylindole (blue). Stained tissue slices were exam-ined with a Nikon C1 confocal laser scanning microscope (NikonInstruments, Melville, New York). Colocalization analysis was doneusing an Imaris Coloc module (version 6.4), and data were presented asthe percentage of colocalization and the Pearson colocalizationcoefficient.25
Rat Glioma Cell Implantation
The rat portion of the study was conducted in compliance with theOklahoma Medical Research Foundation Institutional Animal Care andUseCommittee. The rat glioma cell implantationmodel was conducted aspreviously described by our group.26 Briefly, 3-month-old male Fischer344 rats (Harlan Inc, Indianapolis, Indiana) were anesthetized andimmobilized on a stereotactic unit. A hole was drilled through the skull at2 mm anterior and 2 mm lateral to the bregma on the right-hand side ofthe skull. Then 10 000 F98 cells suspended in a 10-µL volume wereinjected at a depth of 3 mm from the dura into the cerebral cortex ata rate of 2 µL/min followed by a waiting time of 2 minutes. The F98 cellswere originally obtained from the ATCC (Manassas, Virginia), passagedonce, and then infected with a modified pMMP retrovirus fused with thecoding sequences for luciferase and hygromycin (pMMP-LucHygro;obtained from Dr Stephen Lessnick, University of Utah, HuntsmanCancer Institute). They were selected for hygromycin resistance andcolonies were screened for luciferase expression. Stocks were frozen 1passage after infection and colony screening. Cells were also found tohave no mycoplasma infection (Hoechst dye 33258 nuclear (DNA)staining detection kit; Roche Diagnostics, Indianapolis, Indiana).
Synthesis of ELTD1 Nanoprobes
The dextran-coated NH2 base iron oxide nanoparticle constructunderwent conjugation with an ELTD1-specific Ab using a protocolpreviously reported by our group26 via the formation of a stable thioetherlinkage between the activated polyethylene glycol nano particles andactivated Ab. The Ab is activated with N-succinimidyl-S-acetylthioace-tate to introduce a sulfhydryl group.26 The amine groups were activatedwith N-succinimidyl 3-(2-pyridyldithio)-propionate.
MRI Experiments
In vivo MRI experiments on rats with F98 gliomas were carried outwith the rats under general anesthesia (1%-2% isoflurane, 0.8-1.0 L/minO2). The MRI equipment used was a Bruker Biospec 7.0-T/30-cmhorizontal-bore imaging spectrometer (Bruker BioSpin MRI GmbH,Ettlingen, Germany). Animals were imaged at 7 to 10 days after the cellswere injected and then every 2 to 3 days until the desired volume of thetumor was obtained (75-150 mm3). Anesthetized (2% isoflurane)restrained rats were placed in a MR probe and their brains localizedby MRI. Images were obtained using a Bruker S116 gradient coil (2.0mT/m/A), a 72-mm quadrature multirung radiofrequency coil forradiofrequency transmission, and a rat head coil for radiofrequency signalreceiving. MRI was performed for the purpose of determining theincidence, number, growth rate, and volume of each tumor for the F98gliomas. Multiple 1H-MRI slices were taken in the transverse plane usinga spin-echo multislice (repetition time, 0.8 seconds; echo time (TE); 23ms; 128 · 128 matrix; 4 steps per acquisition; 4 · 5-cm2 field of view; 1-mm slice thickness).26-28
For determination of T2* values of the IO nanoprobes in gliomas,a multiple gradient echo method was used with the following parameters:TE (first echo) = 4 ms, echo spacing of 4-ms repetition time = 1500ms, 10echoes (TE = 4, 11, 18, 25, 32, 39, 46, 53, 60, 67 ms), 2 coronal(horizontal) slices, number of averages = 2, 256 · 256 matrix, 1-mm slicethickness with a spatial resolution of 0.137 mm/pixel, and an estimatedtotal scan time of 10 minutes. T2* maps were generated from themultiecho data sets. Rat brains were imaged at 0 (pre-nanoprobe [cross-linked iron oxide (CLIO) anti-ELTD1 nanoprobe] or precontrast agent[control CLIO-IgG] administration), 10-minute intervals post-nanoprobeor IgG contrast agent injections for up to 3 hours. Rats were injected witha single intravenous dose via a tail vein catheter with either the anti-ELTD1 nanoprobe (anti-ELTD1 antibodies [goat anti-mouse] taggedwith an IO-based contrast agent [CLIO-based] (200 mL/200 g rat; 1 mgAb/kg; 0.05 mmol Fe31/kg]), or the normal rat IgG control contrast agent(same dose as anti-ELTD1 nanoprobe).Multiple regions of interest (10 regions of interest within tumor and
nontumor tissues) were selected (in various representative tumor andcorresponding contralateral nontumor regions by 2 operators withinterobserver agreement) from T2-weighted images and T2* maps tocalculate relative changes in MR signal intensities and T2 values in F98glioma-bearing rats administered either the CLIO-anti-ELTD1 nanop-robe (n = 3) or the CLIO-IgG contrast agent (n = 2). MR angiographicimages were obtained as previously described.28
MRI Analysis
AMathematica-based T2* program was used to crop the data/matrixto an area of interest, and it then fit each pixel of a designated image sliceto the T2* relation: I = a 1 I0 * exp(TE/T2*), where a is a constantdetermined by the FindFit function of Mathematica, I is the intensity attime t, I0 is the signal intensity at time 0, TE is the set of defined echo
GLIOMA BIOMARKER ELTD1
NEUROSURGERY VOLUME 72 | NUMBER 1 | JANUARY 2013 | 79
Copyright © Congress of Neurological Surgeons. Unauthorized reproduction of this article is prohibited.

times, and T2* is the parameter of interest. The FindFit function ofMathematica optimizes the values not explicitly defined to produce thebest possible fit. This method is applied to both pre- and postcontrastimages. The percentage of difference is then taken from the fitted data/matrix using the following equation: % difference = [(after-before)/before] · 100. ArrayPlot graphical images are produced for the originalcropped image, the fitted pre- and postcontrast image, and thepercentage of difference of the fitted images. A contour plot is madeusing the percentage of difference data to highlight the regions where thegreatest intensity change occurred. The contour plot is then overlaid onthe original cropped imaged to provide a more visual display of wherechanges in signal intensity occurred.
Prussian Blue Staining of the Nanoprobes
Detection of the iron oxide–based nanoprobes in tissue cryosectionswas done using Prussian blue staining, which involves the treatment ofsections with acid solutions of ferrocyanides. The ferric ion (13) presentin the iron oxide–based nanoprobes from tissue sections combines withthe ferrocyanide and results in the formation of ferric ferrocyanide,visible as a blue pigment in bright-field imaging. Stained tissue sliceswere viewed and photographed with a Nikon Eclipse 800 microscope(Nikon Instruments).
Gene Expression Analysis
For the glioblastoma expressionmicroarray analysis, raw Affymetric .celfiles were downloaded for TCGA (National Cancer Institute) (CancerGenome Atlas; www.cancergenome.nih.gov/; 529 GBM samples),Rembrandt (National Cancer Institute Repository for Molecular BrainNeoplasia Data; www.rembrandt.nci.nih.gov/; 229 total astrocytomas,of which 151 are GBMs), and Erasmus (National Center for Bio-technology Information Gene Expression Omnibus; GEO SeriesGSE16011; total of 187 astrocytomas, of which 159 are GBMs), aswell as the corresponding clinical annotations for each. The .cel files werethen processed using R and Bioconductor, using a custom chipdefinition files with background correction, log transformation, andquantile normalization performed using the robust multiarray averagealgorithm implemented in R.For mesenchymal and proneural gene signature definition, we used
a composite of signatures from Phillips et al29 and Verhaak et al.30 Fora given tumor, the metagene mesenchymal and proneural signaturescores were both calculated. Within a data set, the mesenchymal andproneural metascores were z-score–corrected to allow their comparison.Tumors were then assigned to one of the signatures based on the higherexpressing metagene.
Western Blot
Frozen tissue was weighed, 200 mg was thawed in 1 mL red blood celllysis buffer (Sigma-Aldrich, R7757, St. Louis, MO, USA) with proteaseinhibitors (Sigma, p8340), Na3V04 (1 mM), dithiothreitol (1 mM) andphenylmethanesulfonyl fluoride; 1 mM, then diced using surgicalmicroscissors. Tissue was centrifuged at 1500 rpm, supernatant removed,and 500mL lysis buffer containing proteases and phosphatase inhibitorsadded. Tissues were homogenized with a rotor-stator at 4�C for1 minute, incubated on ice for 30 minutes with shaking, and thencentrifuged (42 000g, 20 minutes, 4�C). The clear supernatant wastransferred to a clean 1.5-mL tube. After determining the total proteinconcentrations, 40 mg of total protein was separated by sodium dodecylsulfate polyacrylamide gel electrophoresis using a Novex 4% to 12% gel
(Invitrogen, Carlsbad, California), and transferred to polyvinylidenedifluoride membranes. Western analysis was done using antibodiesagainst ELTD1 (ETL (N-20): sc46951; Santa Cruz Biotechnology Inc).Secondary antibodies were labeled with horseradish peroxidase. TheSupersignal West Pico chemiluminescent substrate kit (#34077; ThermoScientific) was used for detection.
Statistical Analyses
Statistical differences in MR signal intensities and T2* relaxations,which indicated specific binding of the nanoprobes in glioma tissue, wereanalyzed in the treatment and control groups and in tumor andnontumor regions with an unpaired, 2-tailed Student t test usingcommercially available software (InStat; GraphPad Software, San Diego,California). A P value of ,.05 was considered to indicate a statisticallysignificant difference. For IHC scoring and ELTD1 expression, statisticaldifferences were compared between groups using the Welch 2-samplet test (unpaired, 2 sided), with P values ,.05 considered significant.
RESULTS
Bioinformatics
A global microarray meta-analysis (GAMMA) of all genesdifferentially expressed across 3651 human 2-color microarrayexperiments was conducted as previously described11 to identifygene–gene coexpression patterns that were consistent and specificacross heterogeneous microarray experiments. The significanceand reproducibility of the GAMMA predictions from the 2-colorarray data have since been corroborated by normalization31 andmeta-analysis of 16 000 additional 1-color human microarrays.32
This “guilt-by-association” approach identifies gene sets that arelikely to be associated in biologically relevant ways such asphenotype, disease, and genetic network. GAMMA has beenused successfully to identify the mitotic role of a formerlyuncharacterized gene called C13ORF3 (now Ska3)33 and a role incoagulation for C6ORF105 (now ADTRP)34 and to identifyOLFM4 as a novel neutrophil subset marker associated withgranule secretion.35
With the GAMMA approach, genes are not analyzed directly,but the top 20 genes most consistently coexpressed with them areanalyzed for what they have in common in the peer-reviewedliterature using a large-scale computational analysis.12,14 This way,even if a protein has no known function, its function can beinferred. Then, using the Human Proteome Reference Data-base34 and other experimental sources on protein cellularlocalizations, we screened this list of predicted glioma-associatedproteins for those that were extracellular or membrane boundbecause these proteins were thought to be ideal targets formolecular imaging probes and targeting therapies because theyare more likely to be accessible to injected antibodies. Using ourprocedure, we identified membrane-bound proteins that have notyet been associated with gliomas, but whose expression consis-tently correlates with genes reported to be associated withgliomas. This circumvents a problem inherent in the lists ofexpressed genes derived by microarrays, which identify only thosegenes that are being actively transcribed at the time of the
TOWNER ET AL
80 | VOLUME 72 | NUMBER 1 | JANUARY 2013 www.neurosurgery-online.com
Copyright © Congress of Neurological Surgeons. Unauthorized reproduction of this article is prohibited.
experiment without detecting proteins that are present but notactively transcribed. That is, GAMMA associates genes frequentlycotranscribed regardless of the condition, and then if a statisticallysignificant set of genes has been reported as glioma-associated inthe literature, these associations need not be transcriptional to beidentified by GAMMA (eg, they could be from proteomics orgenome-wide association studies). The enormous sample size ofboth microarray data and analyzed abstracts enables us to screenout genes that do not pass a threshold of statistical significance.This associative method works for glioma-derived, literature-based associations as well as searches on associated processes (suchas angiogenesis, apoptosis, and cell migration), helping corrob-orate any putative roles in tumorigenesis that we uncover. Foreach association, we calculate mutual information (a measure ofvariable dependency) between literature terms to prioritize thestrength of association between each protein and a role ingliomas.14 Finally, we obtained increased confidence in thepredictions because GAMMA also successfully predicted manyestablished glioma-related genes (eg, EGF receptor, matrixmetalloproteinase 2, glial fibrillary acidic protein, fibroblastgrowth factor 2). These identifications serve as positive controlsfor predictive capacity. We identified 195 putative candidatemarkers, all genes predicted or known to be membrane boundand not appearing in any MEDLINE article that mentionedgliomas (or synonymous terms). Of these 195, only 75 hadcommercial antibodies. ELTD1 was chosen from among this listof 75 because it had the highest score. With this analysis set tostringent thresholds, we empirically observed that the ELTD1 geneis found to be consistently transcribed with known glioma-associated genes (see Appendix 2, Supplemental Digital Content 2,http://links.lww.com/NEU/A502, which list GAMMA predictedassociations for the ELTD1 gene; predicted associations that weretested in this study are shown in red).
GAMMAscores are basedon a combinationof (1) howmanygenesout of the 20 top coexpressed analyzed genes showed associations withgliomas based on published reports and (2) their statistical significancebased on random network simulations to estimate the probabilitythat a set of equally frequent terms would be associated withgliomas. Only proteins with P , .01 significance were selected aspotential candidates. A flow diagram of the GAMMA approachis illustrated in supplementary data (see Appendix 3, Supple-mental Digital Content 3, http://links.lww.com/NEU/A503,which includes steps for the GAMMA approach. Slide 1 describesthe steps in the GAMMA approach. Slide 2 provides descriptivediagrams for gene comparisons [Figure S1], gene function asso-ciations [Figure S2], and reported commonalities in peer-reviewedliterature [Figure S3].).
Immunohistochemistry and Western Blot
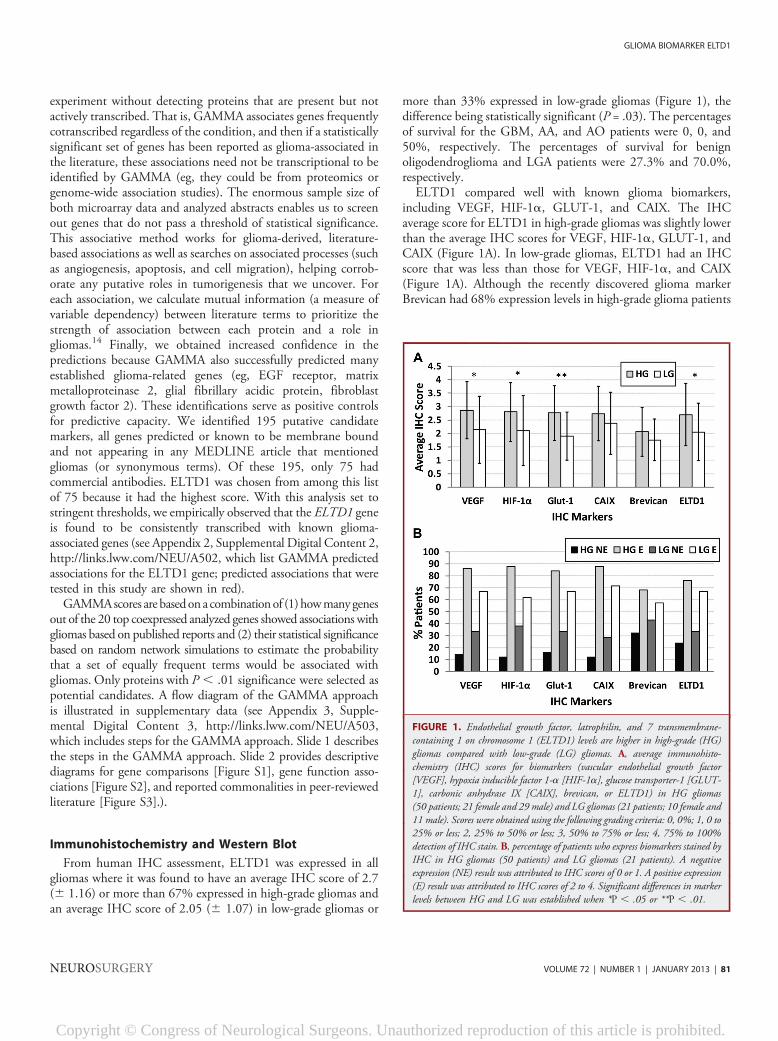
From human IHC assessment, ELTD1 was expressed in allgliomas where it was found to have an average IHC score of 2.7(6 1.16) or more than 67% expressed in high-grade gliomas andan average IHC score of 2.05 (6 1.07) in low-grade gliomas or
more than 33% expressed in low-grade gliomas (Figure 1), thedifference being statistically significant (P = .03). The percentagesof survival for the GBM, AA, and AO patients were 0, 0, and50%, respectively. The percentages of survival for benignoligodendroglioma and LGA patients were 27.3% and 70.0%,respectively.ELTD1 compared well with known glioma biomarkers,
including VEGF, HIF-1a, GLUT-1, and CAIX. The IHCaverage score for ELTD1 in high-grade gliomas was slightly lowerthan the average IHC scores for VEGF, HIF-1a, GLUT-1, andCAIX (Figure 1A). In low-grade gliomas, ELTD1 had an IHCscore that was less than those for VEGF, HIF-1a, and CAIX(Figure 1A). Although the recently discovered glioma markerBrevican had 68% expression levels in high-grade glioma patients
FIGURE 1. Endothelial growth factor, latrophilin, and 7 transmembrane-containing 1 on chromosome 1 (ELTD1) levels are higher in high-grade (HG)gliomas compared with low-grade (LG) gliomas. A, average immunohisto-chemistry (IHC) scores for biomarkers (vascular endothelial growth factor[VEGF], hypoxia inducible factor 1-a [HIF-1a], glucose transporter-1 [GLUT-1], carbonic anhydrase IX [CAIX], brevican, or ELTD1) in HG gliomas(50 patients; 21 female and 29 male) and LG gliomas (21 patients; 10 female and11 male). Scores were obtained using the following grading criteria: 0, 0%; 1, 0 to25% or less; 2, 25% to 50% or less; 3, 50% to 75% or less; 4, 75% to 100%detection of IHC stain. B, percentage of patients who express biomarkers stained byIHC in HG gliomas (50 patients) and LG gliomas (21 patients). A negativeexpression (NE) result was attributed to IHC scores of 0 or 1. A positive expression(E) result was attributed to IHC scores of 2 to 4. Significant differences in markerlevels between HG and LG was established when *P , .05 or **P , .01.
GLIOMA BIOMARKER ELTD1
NEUROSURGERY VOLUME 72 | NUMBER 1 | JANUARY 2013 | 81
Copyright © Congress of Neurological Surgeons. Unauthorized reproduction of this article is prohibited.
(Figure 1B), it was found to be the lowest for all biomarkers tested(Figure 1A). Brevican and the biomarker CAIX were not found tobe significantly higher (P = .19 for both) when comparing high-grade with low-grade gliomas, whereas all other biomarkers (VEGF,HIF-1a, and GLUT-1) had significance levels of P = .01, P = .02,and P = 0.001, respectively, including ELTD1 (P = .03) and weresignificantly higher in high-grade compared with low-grade gliomas(Figure 1A).
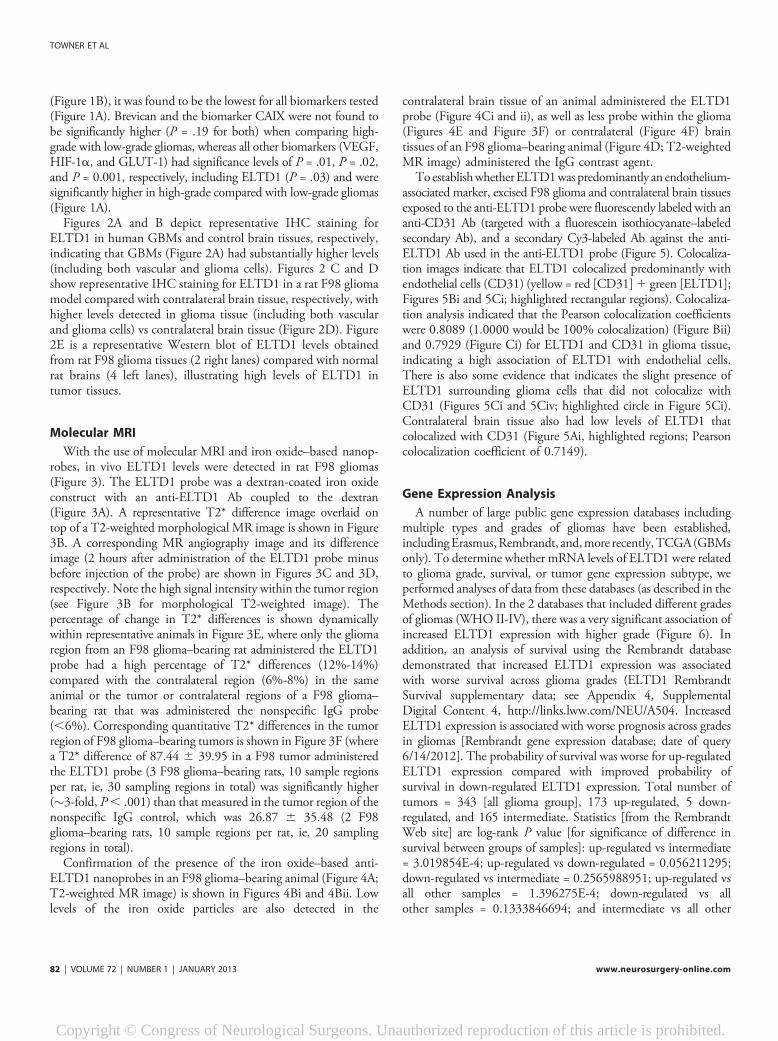
Figures 2A and B depict representative IHC staining forELTD1 in human GBMs and control brain tissues, respectively,indicating that GBMs (Figure 2A) had substantially higher levels(including both vascular and glioma cells). Figures 2 C and Dshow representative IHC staining for ELTD1 in a rat F98 gliomamodel compared with contralateral brain tissue, respectively, withhigher levels detected in glioma tissue (including both vascularand glioma cells) vs contralateral brain tissue (Figure 2D). Figure2E is a representative Western blot of ELTD1 levels obtainedfrom rat F98 glioma tissues (2 right lanes) compared with normalrat brains (4 left lanes), illustrating high levels of ELTD1 intumor tissues.
Molecular MRI
With the use of molecular MRI and iron oxide–based nanop-robes, in vivo ELTD1 levels were detected in rat F98 gliomas(Figure 3). The ELTD1 probe was a dextran-coated iron oxideconstruct with an anti-ELTD1 Ab coupled to the dextran(Figure 3A). A representative T2* difference image overlaid ontop of a T2-weighted morphological MR image is shown in Figure3B. A corresponding MR angiography image and its differenceimage (2 hours after administration of the ELTD1 probe minusbefore injection of the probe) are shown in Figures 3C and 3D,respectively. Note the high signal intensity within the tumor region(see Figure 3B for morphological T2-weighted image). Thepercentage of change in T2* differences is shown dynamicallywithin representative animals in Figure 3E, where only the gliomaregion from an F98 glioma–bearing rat administered the ELTD1probe had a high percentage of T2* differences (12%-14%)compared with the contralateral region (6%-8%) in the sameanimal or the tumor or contralateral regions of a F98 glioma–bearing rat that was administered the nonspecific IgG probe(,6%). Corresponding quantitative T2* differences in the tumorregion of F98 glioma–bearing tumors is shown in Figure 3F (wherea T2* difference of 87.44 6 39.95 in a F98 tumor administeredthe ELTD1 probe (3 F98 glioma–bearing rats, 10 sample regionsper rat, ie, 30 sampling regions in total) was significantly higher(�3-fold, P, .001) than that measured in the tumor region of thenonspecific IgG control, which was 26.87 6 35.48 (2 F98glioma–bearing rats, 10 sample regions per rat, ie, 20 samplingregions in total).
Confirmation of the presence of the iron oxide–based anti-ELTD1 nanoprobes in an F98 glioma–bearing animal (Figure 4A;T2-weighted MR image) is shown in Figures 4Bi and 4Bii. Lowlevels of the iron oxide particles are also detected in the
contralateral brain tissue of an animal administered the ELTD1probe (Figure 4Ci and ii), as well as less probe within the glioma(Figures 4E and Figure 3F) or contralateral (Figure 4F) braintissues of an F98 glioma–bearing animal (Figure 4D; T2-weightedMR image) administered the IgG contrast agent.To establishwhetherELTD1was predominantly an endothelium-
associated marker, excised F98 glioma and contralateral brain tissuesexposed to the anti-ELTD1 probe were fluorescently labeled with ananti-CD31 Ab (targeted with a fluorescein isothiocyanate–labeledsecondary Ab), and a secondary Cy3-labeled Ab against the anti-ELTD1 Ab used in the anti-ELTD1 probe (Figure 5). Colocaliza-tion images indicate that ELTD1 colocalized predominantly withendothelial cells (CD31) (yellow = red [CD31]1 green [ELTD1];Figures 5Bi and 5Ci; highlighted rectangular regions). Colocaliza-tion analysis indicated that the Pearson colocalization coefficientswere 0.8089 (1.0000 would be 100% colocalization) (Figure Bii)and 0.7929 (Figure Ci) for ELTD1 and CD31 in glioma tissue,indicating a high association of ELTD1 with endothelial cells.There is also some evidence that indicates the slight presence ofELTD1 surrounding glioma cells that did not colocalize withCD31 (Figures 5Ci and 5Civ; highlighted circle in Figure 5Ci).Contralateral brain tissue also had low levels of ELTD1 thatcolocalized with CD31 (Figure 5Ai, highlighted regions; Pearsoncolocalization coefficient of 0.7149).
Gene Expression Analysis
A number of large public gene expression databases includingmultiple types and grades of gliomas have been established,includingErasmus,Rembrandt, and,more recently,TCGA(GBMsonly). To determine whether mRNA levels of ELTD1 were relatedto glioma grade, survival, or tumor gene expression subtype, weperformed analyses of data from these databases (as described in theMethods section). In the 2 databases that included different gradesof gliomas (WHO II-IV), there was a very significant association ofincreased ELTD1 expression with higher grade (Figure 6). Inaddition, an analysis of survival using the Rembrandt databasedemonstrated that increased ELTD1 expression was associatedwith worse survival across glioma grades (ELTD1 RembrandtSurvival supplementary data; see Appendix 4, SupplementalDigital Content 4, http://links.lww.com/NEU/A504. IncreasedELTD1 expression is associated with worse prognosis across gradesin gliomas [Rembrandt gene expression database; date of query6/14/2012]. The probability of survival was worse for up-regulatedELTD1 expression compared with improved probability ofsurvival in down-regulated ELTD1 expression. Total number oftumors = 343 [all glioma group], 173 up-regulated, 5 down-regulated, and 165 intermediate. Statistics [from the RembrandtWeb site] are log-rank P value [for significance of difference insurvival between groups of samples]: up-regulated vs intermediate= 3.019854E-4; up-regulated vs down-regulated = 0.056211295;down-regulated vs intermediate = 0.2565988951; up-regulated vsall other samples = 1.396275E-4; down-regulated vs allother samples = 0.1333846694; and intermediate vs all other
TOWNER ET AL
82 | VOLUME 72 | NUMBER 1 | JANUARY 2013 www.neurosurgery-online.com
Copyright © Congress of Neurological Surgeons. Unauthorized reproduction of this article is prohibited.
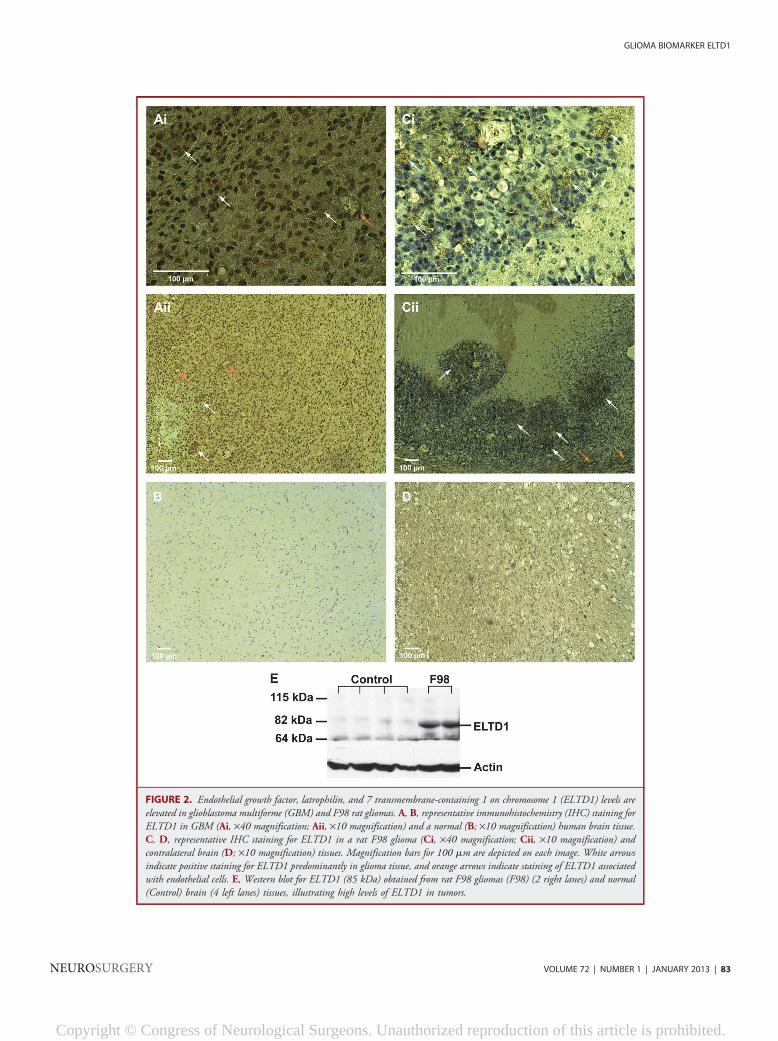
FIGURE 2. Endothelial growth factor, latrophilin, and 7 transmembrane-containing 1 on chromosome 1 (ELTD1) levels areelevated in glioblastoma multiforme (GBM) and F98 rat gliomas. A, B, representative immunohistochemistry (IHC) staining forELTD1 in GBM (Ai, ·40 magnification; Aii, ·10 magnification) and a normal (B; ·10 magnification) human brain tissue.C, D, representative IHC staining for ELTD1 in a rat F98 glioma (Ci, ·40 magnification; Cii, ·10 magnification) andcontralateral brain (D; ·10 magnification) tissues. Magnification bars for 100 mm are depicted on each image. White arrowsindicate positive staining for ELTD1 predominantly in glioma tissue, and orange arrows indicate staining of ELTD1 associatedwith endothelial cells. E, Western blot for ELTD1 (85 kDa) obtained from rat F98 gliomas (F98) (2 right lanes) and normal(Control) brain (4 left lanes) tissues, illustrating high levels of ELTD1 in tumors.
GLIOMA BIOMARKER ELTD1
NEUROSURGERY VOLUME 72 | NUMBER 1 | JANUARY 2013 | 83
Copyright © Congress of Neurological Surgeons. Unauthorized reproduction of this article is prohibited.
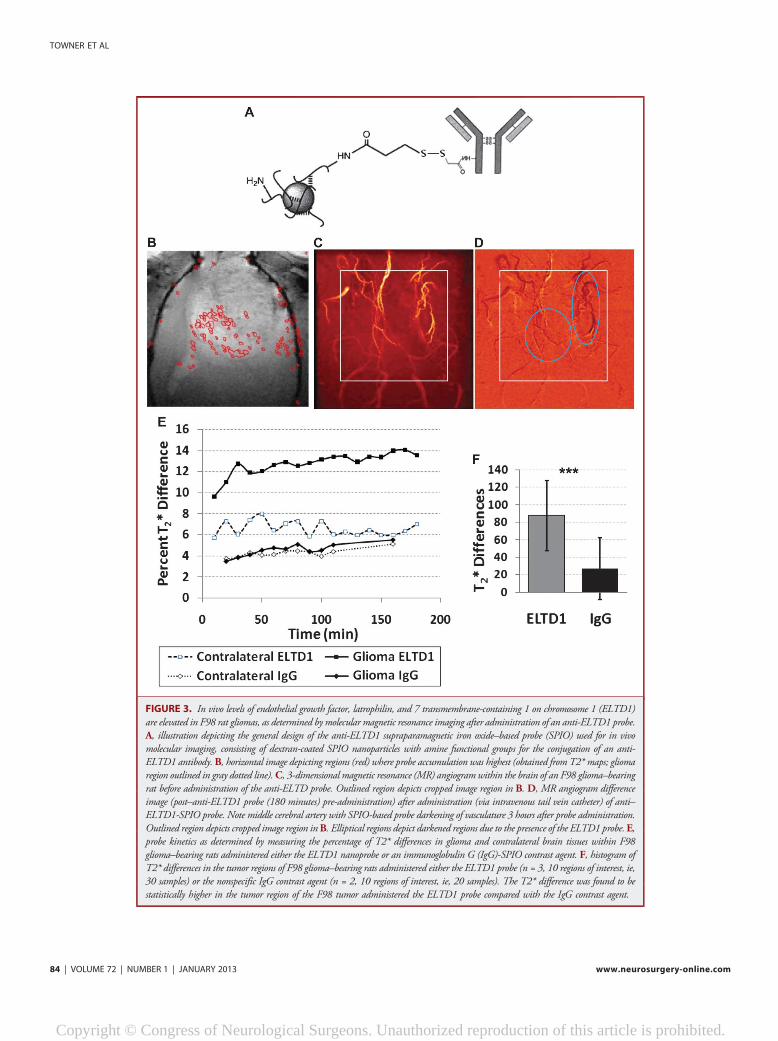
FIGURE 3. In vivo levels of endothelial growth factor, latrophilin, and 7 transmembrane-containing 1 on chromosome 1 (ELTD1)are elevated in F98 rat gliomas, as determined by molecular magnetic resonance imaging after administration of an anti-ELTD1 probe.A, illustration depicting the general design of the anti-ELTD1 supraparamagnetic iron oxide–based probe (SPIO) used for in vivomolecular imaging, consisting of dextran-coated SPIO nanoparticles with amine functional groups for the conjugation of an anti-ELTD1 antibody. B, horizontal image depicting regions (red) where probe accumulation was highest (obtained from T2* maps; gliomaregion outlined in gray dotted line).C, 3-dimensional magnetic resonance (MR) angiogram within the brain of an F98 glioma–bearingrat before administration of the anti-ELTD probe. Outlined region depicts cropped image region in B. D, MR angiogram differenceimage (post–anti-ELTD1 probe (180 minutes) pre-administration) after administration (via intravenous tail vein catheter) of anti–ELTD1-SPIO probe. Note middle cerebral artery with SPIO-based probe darkening of vasculature 3 hours after probe administration.Outlined region depicts cropped image region inB. Elliptical regions depict darkened regions due to the presence of the ELTD1 probe.E,probe kinetics as determined by measuring the percentage of T2* differences in glioma and contralateral brain tissues within F98glioma–bearing rats administered either the ELTD1 nanoprobe or an immunoglobulin G (IgG)-SPIO contrast agent. F, histogram ofT2* differences in the tumor regions of F98 glioma–bearing rats administered either the ELTD1 probe (n = 3, 10 regions of interest, ie,30 samples) or the nonspecific IgG contrast agent (n = 2, 10 regions of interest, ie, 20 samples). The T2* difference was found to bestatistically higher in the tumor region of the F98 tumor administered the ELTD1 probe compared with the IgG contrast agent.
TOWNER ET AL
84 | VOLUME 72 | NUMBER 1 | JANUARY 2013 www.neurosurgery-online.com
Copyright © Congress of Neurological Surgeons. Unauthorized reproduction of this article is prohibited.

samples = 8.958061E-4.) Analysis of survival within GBM tumorsfrom these databases did not demonstrate significant survivalassociation within grade IV tumors. However, we did find thatwhen we analyzed ELTD1 expression as a function of tumor geneexpression subtype30 within grade IV tumors, there was a potentialassociation of higher ELTD1 expression in the mesenchymal vsproneural subtype, which was significant in the Rembrandt data setand showed a trend in the TCGA data set (Figure 7). Takentogether, these data indicate that ELTD1 is potentially a strongbiomarker of glioma grade and survival and may be preferentiallyassociated with the mesenchymal subtype of GBM.
DISCUSSION
We have demonstrated that the differential presence of ELTD1in gliomas compared with nondiseased regions could potentiallyserve alone or in combination with other glioma-specific bio-markers because it is detected in both human GBM and rodentmodels for gliomas. Despite current therapies, GBM is a devastatingcancer, and the validation of more biomarkers for GBM could bebeneficial in the diagnosis and therapeutic intervention of this disease.ELTD1, as shown in our human IHC data (Figures 1 and 2),fares well in comparison with more traditional IHC markers
FIGURE 4. Prussian blue staining confirmation for the presence of the endothelial growth factor, latrophilin, and 7 transmembrane-containing 1 on chromosome 1 (ELTD1)probe in F98 gliomas. Depiction of Prussian blue staining for iron oxide nanoparticles in F98 rat gliomas administered either the ELTD1 probe (A, T2-weighted magneticresonance [MR] image) in glioma (Bi and Bii) or contralateral (Ci and Cii) brain tissues, or the nonspecific immunoglobulin G contrast agent (D, T2-weighted MR image) intumor (E) or contralateral (F) brain tissues, 5 hours after administration of contrast agents. High magnification (·100).
GLIOMA BIOMARKER ELTD1
NEUROSURGERY VOLUME 72 | NUMBER 1 | JANUARY 2013 | 85
Copyright © Congress of Neurological Surgeons. Unauthorized reproduction of this article is prohibited.

FIGURE 5. Endothelial growth factor, latrophilin, and 7 transmembrane-containing 1 on chromosome 1 (ELTD1) is stronglyassociated with endothelial cells. Fluorescence staining for CD31 (red; iii) and the ELTD1 probe (green; iv) in A. Contralateralbrain tissue and (B, C) glioma tissue, 3 hours after administration of the anti-ELTD1 probe in an F98–glioma bearing rat. i,colocalization of CD31 and ELTD1 (yellow) indicate that most of the ELTD1 is endothelial cell associated (highlighted inrectangular regions); however, low levels are also detected surrounding glioma cells (Ci, highlighted in a circular region).Colocalization analysis images are shown in ii, where the Pearson coefficients for ELTD1 and CD31 were 0.8089 (Bii) and0.7929 (Ci) in glioma tissue, and 0.7149 (Aii) in contralateral brain tissue. C, enlarged image (·2 zoomed image) of the gliomatissue. Nuclei are stained with 4’,6-diamidino-2-phenylindole (blue). Magnification ·60. Magnification bars in Ai, Bi, and Ciare 50, 80, and 70 mm, respectively.
TOWNER ET AL
86 | VOLUME 72 | NUMBER 1 | JANUARY 2013 www.neurosurgery-online.com
Copyright © Congress of Neurological Surgeons. Unauthorized reproduction of this article is prohibited.
currently used to diagnose GBM.36 IHC staining in human high-grade gliomas (GBM1 AAs1 AOs) and low-grade gliomas (LGAs1 benign oligodendrogliomas) indicated higher levels of ELTD1for high-grade compared with low-grade gliomas. The level ofELTD1 was similar to currently investigated glioma markersincluding VEGF, HIF-1a, and GLUT-1. It is well-known thatHIF-1a is an important diagnostic marker and can be targeted fortherapeutic intervention.24,37-43 ELTD1 also can be detected in anaggressive rodent model for gliomas. Within a rat F98 gliomamodel, ELTD1 levels from IHC assessment were found to be higherin glioma tissue; however, the contralateral tissue seemed to still havesome staining for ELTD1 (Figures 2C and Figure 5A).Western blotdata indicate high levels of ELTD1 compared with normal rat brain(Figure 2E). Lower levels of ELTD1 in normal brain tissue may bedue to decreased vasculature (compared with a tumor). Humannormal brain tissue had very low ELTD1 levels (Figure 2B)compared with extremely high levels in a GBM patient (Figure 2A).
Preclinical glioma models, induced by orthotopic (into nativetumor sites) injection of primary tumor cells or tumor cell lines,represent the most frequently used in vivo cancer model systemsfor glioma research.23,44 F98 glioma cell lines were obtained fromchemical induction as a result of administering ethylnitrosoureato pregnant rats, where the progeny developed brain tumors thatwere isolated, propagated, and cloned in cell culture.45 F98gliomas are classified as anaplastic malignant tumors, which have
an infiltrative pattern of growth, which is an attribute associatedwith human GBM.45,46 MRI techniques have been used by ourgroup to demonstrate the aggressive nature of F98 gliomas. Withthe use of diffusion tensor imaging, we were able to demonstratethat the F98 glioma model is much more infiltrative than the ratC6 glioma model.47 With the use of MR angiography, we haveshown that the F98 model predominantly uses preexisting bloodvessels in tumor angiogenesis, but has longer and thicker newblood vessels compared with other glioma models.48
In this study in the F98 glioma model, we were also able todemonstrate, with the use of molecular MRI and an anti-ELTD1probe, that substantial levels of ELTD1 are found in the tumortissue of F98 glioma–bearing animals. ELTD1 was only found tobe in high levels within glioma tissue with an approximately�4-fold increase compared with contralateral brain tissue (Figure3F). A decrease in T2 relaxation would indicate the presence ofthe anti-ELTD1 probe, which would be indicative of thepresence of ELTD1. Colocalization images staining for ELTD1and CD31 and subsequent analysis indicated that most of theELTD1 detected by fluorescence confocal imaging was associatedwith endothelial cells (Figure 5). There is also some indication
FIGURE 6. Increased endothelial growth factor, latrophilin, and 7 trans-membrane-containing 1 on chromosome 1 (ELTD1) expression is associated withhigher grade in gliomas in both Rembrandt and Erasmus gene expressiondatabases. ELTD1 expression was found to be significantly higher in grade IVgliomas compared with grade II gliomas in both Rembrandt (P , .001) andErasmus (P , .001) databases. ELTD1 was found to be significantly higher ingrade IV vs grade III in the Rembrandt database (P, .001), and higher in gradeIII gliomas vs grade II in the Erasmus database (P , .01).
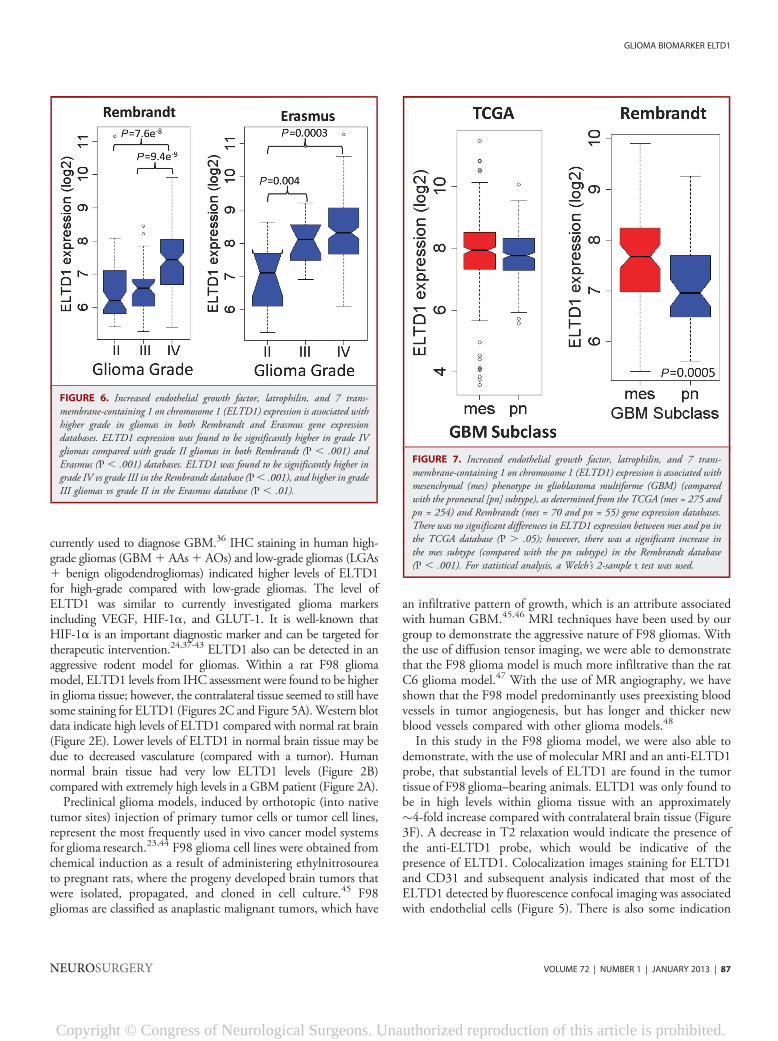
FIGURE 7. Increased endothelial growth factor, latrophilin, and 7 trans-membrane-containing 1 on chromosome 1 (ELTD1) expression is associated withmesenchymal (mes) phenotype in glioblastoma multiforme (GBM) (comparedwith the proneural [pn] subtype), as determined from the TCGA (mes = 275 andpn = 254) and Rembrandt (mes = 70 and pn = 55) gene expression databases.There was no significant differences in ELTD1 expression between mes and pn inthe TCGA database (P . .05); however, there was a significant increase inthe mes subtype (compared with the pn subtype) in the Rembrandt database(P , .001). For statistical analysis, a Welch’s 2-sample t test was used.
GLIOMA BIOMARKER ELTD1
NEUROSURGERY VOLUME 72 | NUMBER 1 | JANUARY 2013 | 87
Copyright © Congress of Neurological Surgeons. Unauthorized reproduction of this article is prohibited.
that ELTD1 may be expressed on some glioma cells at muchlower levels. Therefore, any increase in ELTD1 will more thanlikely be associated with increased angiogenesis or neovasculari-zation in gliomas. Decreased levels of ELTD1 in glioma cellscompared with high levels in tumor vasculature from the in vivodata may reflect either predominant uptake by the endothelialcells before they reach the glioma cells or decreased uptake of theanti-ELTD1 probe in tumor tissue. IHC staining (Figure 2)indicates ELTD1 staining in tumor cell nuclei as well as aroundendothelial cells, indicating that the in vivo targeting may berestricted to the distribution of the probe to endothelial cells andonly some tumor cells. Prussian blue staining for the anti-ELTD1probe (Figure 4) seems to indicate intravascular staining based onthe well-individualized pattern and distinct shapes, which couldindicate an endothelial association and limited distribution of theprobe to these cells. However, previous studies using the sameprobe construct to assess in vivo c-Met28 or VEGF receptor 2(VEGFR2)26 levels in rat gliomas do not indicate that theseprobes only reach vascular cells, but do reach glioma cells, whichwould suggest that the ELTD1 probe has a preferred associationwith endothelial cells. To confirm ELTD1 expression withvascular endothelial cells, future experiments may also need toevaluate the levels of ELTD1 in association with the inhibition ofneovascularization using antiangiogenic therapies (eg, bevacizu-mab or sunitinib). Additionally, verification of ELTD1 expres-sion in neoplastic cells should be done, such as assessing EGFreceptor gene amplification by fluorescence in situ hybridizationcolocalization with ELTD1-expressed cells.
It is interesting to note that theHuman Protein Atlas shows verylittle positive staining for ELTD1 inmalignant gliomas, but strongAb staining for other cancers, such as thyroid cancer andmalignantmelanoma (http:///www.proteinatlas.org/ENSG00000162618/cancer; accessed 07/24/12). This database is ideal for the initialdetermination of general expression levels of a particular proteinthat could indicate further study. However, more extensivestudies, as we have done with the use of IHC staining for ELTD1in numerous patient samples and in vivo expression levels ofELTD1 in a preclinical model, strongly suggest that malignantgliomas do have high levels of ELTD1. Also worthy of mention,according to SymAtlas (http://biogps.org/#goto=genereport&id= 170757; accessed 07/24/12), ELTD1 mRNA expression seemsto be highest in hematopoietic stem cells as well as lung andcommon myeloid progenitor tissues. Whether hematopoieticstem cells are the source of neovascularization that we observe ingliomas would need to be further investigated.
From the gene expression results, we have also demonstrated thatthere was a strong association of ELTD1 expressionwith increasinggrade (Figure 6). This results in a strong survival association whendata across all grades (ELTD1 Survival supplementary data) arecompared. However, there was not a survival association withexpression level within GBM, suggesting that it is mainlya biomarker of grade. Alternatively, when we looked at GBMtumor subtype, it looked like there was a possible association withthe mesenchymal subtype vs the proneural subtype that was
significant in Rembrandt, but not in TCGA (Figure 7). It isreasonable to conclude that ELTD1 expression is a strongbiomarker of grade (also supported by the IHC data), associatedwith survival across grades and may be increased in themesenchymal subtype. ELTD1 expression and associated survivalshould, in the future, be evaluated by IHC via a glioma tissuemicroarray to confirm survival differences observed in Rembrandt.Others have previously used molecular MRI to also assess
neovascularization. For example, the expression of cell adhesionmolecules, such as integrins, has been found to be up-regulatedduring tumor growth and angiogenesis, and aVb3 expression,which has been correlated with tumor aggressiveness, can bemeasured by MRI with targeted paramagnetic-labeled cyclicarginine-glycine-aspartic acid peptides.23,49 In another study,within U87MG xenograft tumors in nude mice, arginine-glycine-aspartic acid–labeled ultrasmall superparamagnetic iron oxideprobes were found to accumulate only within the neovasculatureassociated with tumors and not within tumor cells.50 Tumorangiogenesis was also monitored via the expression of CD105 inF98 tumor–bearing rats with the use of Gd-diethylenetriamine-pentaacetic acid (Gd-DTPA) liposomes targeted to CD105(CD105-Gd-SLs) and MRI.51
In our laboratories, MRI probes (either Gd or iron oxide based)have also been developed to monitor in vivo levels of molecularmarkers known to be overexpressed in malignant brain tumors,such as the angiogenic marker VEGFR2)26,52; the tumor cellmigration/invasion marker c-Met, a tyrosine kinase receptor forthe scatter factor (also known as the hepatocyte growthfactor)27,28; and the inflammatory marker inducible nitric oxidesynthase (iNOS).53 With the use of a Gd-DTPA–albumin–anti-VEGFR2–biotin probe, regional differences in VEGFR2 levelswere detected by MRI in vivo in a C6 glioma model, and probespecificity for glioma tissue, particularly in the peritumor andperinecrotic regions, was confirmed by tagging the biotin moietyof the probe in excised tissues with streptavidin-Cy3.52 Thecontrol nonspecific probe had rat IgG conjugated to the albumininstead of the VEGFR2 Ab. A similar result was obtained whenan aminated dextran-coated iron-oxide nanoparticles conjugatedwith an anti-VEGFR2 Ab was used in a C6 glioma model, wheredistribution of the probe was mainly in the peritumor andperinecrotic regions of the tumor.26 Confirmation of the presenceof the nanoprobes was obtained by using Prussian blue stain forthe VEGFR2-targeting iron oxide nanoparticles in excised tumortissues.26 Both Gd- and iron oxide–based probes were alsodeveloped to characterize c-Met levels in C6 gliomas. c-Met isa tumor marker that is overexpressed in many malignant cancers,indicative of the invasive nature of a tumor. The distribution ofc-Met was found to be more widely dispersed, but mainlyconcentrated in peritumor regions.27,28 As detected witha Gd-DTPA–albumin–anti-iNOS–biotin (anti-iNOS) probe,iNOS levels were found to vary in different rat glioma models,where the percentage of MRI signal intensity changes werehighest in the C6 tumor compared with the RG2- and ethyl-nitrosourea-induced tumors.53 Dynamic kinetic monitoring of the
TOWNER ET AL
88 | VOLUME 72 | NUMBER 1 | JANUARY 2013 www.neurosurgery-online.com
Copyright © Congress of Neurological Surgeons. Unauthorized reproduction of this article is prohibited.
anti-iNOS probe indicated sustained uptake over 3 hours withintumor tissue regions and no specific uptake of a control Gd-DTPA–albumin-IgG-biotin contrast agent within tumors.53 Fluo-rescence imaging of the anti-iNOS probe by targeting the biotinmoiety with streptavidin-Cy3 verified higher levels of probe uptakein C6 tumors vs RG2 gliomas, despite the increased perfusion andmicrovascularity detected in the RG2 tumors.53
For this study, an iron oxide–based nanoparticle constructcovalently bound to an anti-ELTD1 Ab was used to detect highlevels of ELTD1 in the tumor regions of F98 glioma–bearing rats(Figures 4 and 5). Specificity of the ELTD1 probe seems to beassociated with neovascularization.
CONCLUSION
The results presented strongly suggest that the associativeanalysis method used in this study was able to accurately identifyELTD1 as a glioma-associated biomarker, possibly due toincreased angiogenesis. Both ex vivo and in vivo validation studiesindicate that ELTD1 is a biomarker that can be used to confirm ordetect the presence and grade of gliomas, particularly high-gradegliomas in humans, and that this biomarkermay play an importantdiagnostic role in addition to currently used markers for gliomas,particularly as a histological marker for identifying vascularproliferation.
Disclosures
Supported by OklahomaMedical Research Foundation, the National Institutesof Health (grant 5P20RR020143-07 to J.D.W.), and Oklahoma Center for theAdvancement of Sciences and Technology (OCAST grant AR092-049 to R.A.T.).The authors have no personal financial or institutional interest in any of the drugs,materials, or devices described in this article.
REFERENCES
1. Central Brain Tumor Registry of the United States (CBTRUS). 2011 CBTRUSStatistical Report: Primary brain and central nervous system tumors diagnosed inthe United States in 2004-2007. Available at: http://www.cbtrus.org/2011-NPCR-SEER/WEB-0407-Report-3-3-2011.pdf. Accessed January 6, 2011.
2. Louis DN. Molecular pathology of malignant gliomas. Annu Rev Pathol. 2006;1:97-117.
3. Gudinaviciene I, Pranys D, Juozaityte E. Impact of morphology and biology onthe prognosis of patients with gliomas. Medicina (Kaunas). 2004;40(2):112-120.
4. Cancer Genome Atlas Research Network. Comprehensive genomic characteriza-tion defines human glioblastoma genes and core pathways. Nature. 2008;455(7216):1061-1068.
5. Riemenschneider MJ, Jeuken JW, Wesseling P, Reifenberger G. Moleculardiagnostics of gliomas: state of the art. Acta Neuropathol. 2010;120(5):567-584.
6. Jansen M, Yip S, Louis DN. Molecular pathology in adult gliomas: diagnostic,prognostic, and predictive markers. Lancet Neurol. 2010;9(7):717-726.
7. Colman H, Zhang L, Sulman EP, et al. A multigene predictor of outcome inglioblastoma. Neuro Oncol. 2010;12(1):49-57.
8. Farias-Eisner G, Bank AM, Hwang BY, et al. Glioblastoma biomarkers from benchto bedside: advances and challenges. Br J Neurosurg. 2012;26(2):189-194.
9. Silber JR, Bobola MS, Blank A, Chamberlain MC. O(6)-Methylguanine-DNAmethyltransferase in glioma therapy: promise and problems. Biochim Biophys Acta.2012;1826(1):71-82.
10. Niclou SP, Fack F, Rajcevic U. Glioma proteomics: status and perspectives.J Proteomics. 2010;73(10):1823-1838.
11. Wren JD. A global meta-analysis of microarray expression data to predict unknowngene functions and estimate the literature-data divide. Bioinformatics. 2009;25(13):1694-1701.
12. Wren JD, Garner HR. Shared relationship analysis: ranking set cohesion andcommonalities within a literature-derived relationship network. Bioinformatics.2004;20(2):191-198.
13. Giles CB, Wren JD. Large-scale directional relationship extraction and resolution.BMC Bioinformatics. 2008;9(suppl 9):S11.
14. Wren JD. Extending the mutual information measure to rank inferred literaturerelationships. BMC Bioinformatics. 2004;5(1):145.
15. Nechiporuk T, Urness LD, Keating MT. ETL, a novel seven-transmembranereceptor that is developmentally regulated in the heart. ETL is a member of thesecretin family and belongs to the epidermal growth factor-seven-transmembranesubfamily. J Biol Chem. 2001;276(6):4150-4157.
16. Kop EN, Kwakkenbos MJ, Teske GJ, et al. Identification of the epidermal growthfactor-TM7 receptor EMR2 and its ligand dermatan sulfate in rheumatoid synovialtissue. Arthritis Rheum. 2005;52(2):442-450.
17. Agrawal A, Pergadia ML, Saccone SF, et al. An autosomal linkage scan for cannabisuse disorders in the nicotine addiction genetics project. Arch Gen Psychiatry. 2008;65(6):713-721.
18. Agrawal A, Lynskey MT. Candidate genes for cannabis use disorders: findings,challenges and directions. Addiction. 2009;104(4):518-532.
19. Porto Neto LR, Bunch RJ, Harrison BE, Barendse W. DNA variation in thegene ELTD1 is associated with tick burden in cattle. Anim Genet. 2011;42(1):50-55.
20. Lee KT, Byun MJ, Kang KS, et al. Neuronal genes for subcutaneous fat thicknessin human and pig are identified by local genomic sequencing and combined SNPassociation study. PLoS One. 2011;6(2):e16356.
21. Wallgard E, Larsson E, He L, et al. Identification of a core set of 58 gene transcriptswith broad and specific expression in the microvasculature. Arterioscler ThrombVasc Biol. 2008;28(8):1469-1476.
22. Towner RA, He T, Doblas S, Smith N. Assessment of rodent glioma modelsusing magnetic resonance imaging techniques. In: Chen CC, ed. Advances in theBiology, Imaging and Therapies for Glioblastoma. Rijeka, Croatia: InTech; 2011:251-272.
23. Waerzeggers Y, Monfared P, Viel T, Winkeler A, Jacobs AH. Mouse models inneurological disorders: applications of non-invasive imaging. Biochim Biophys Acta.2010;1802(10):819-839.
24. Flynn JR, Wang L, Gillespie DL, et al. Hypoxia-regulated protein expression,patient characteristics, and preoperative imaging as predictors of survival in adultswith glioblastoma multiforme. Cancer. 2008;113(5):1032-1042.
25. Zinchuk V, Zinchuk O, Okada T. Quantitative colocalization analysis ofmulticolor confocal immunofluorescence microscopy images: pushing pixels toexplore biological phenomena. Acta Histochem Cytochem. 2007;40(4):101-111.
26. Towner RA, Smith N, Asano Y, et al. Molecular magnetic resonance imagingapproaches used to aid in the understanding of angiogenesis in vivo: implicationsfor tissue engineering. Tissue Eng Part A. 2010;16(2):357-364.
27. Towner RA, Smith N, Doblas S, et al. In vivo detection of c-Met expression in a ratC6 glioma model. J Cell Mol Med. 2008;12(1):174-186.
28. Towner RA, Smith N, Asano Y, et al. Molecular magnetic resonance imagingapproaches used to aid in the understanding of the tissue regeneration markerMet in vivo: implications for tissue engineering. Tissue Eng Part A. 2010;16(2):365-371.
29. Phillips HS, Kharbanda S, Chen R, et al. Molecular subclasses of high-gradeglioma predict prognosis, delineate a pattern of disease progression, and resemblestages in neurogenesis. Cancer Cell. 2006;9(3):157-173.
30. Verhaak RG, Hoadley KA, Purdom E, et al. Integrated genomic analysis identifiesclinically relevant subtypes of glioblastoma characterized by abnormalities inPDGFRA, IDH1, EGFR, and NF1. Cancer Cell. 2010;17(1):98-110.
31. Dozmorov MG,Wren JD. High-throughput processing and normalization of one-color microarrays for transcriptional meta-analyses. BMC Bioinformatics. 2011;12(suppl 10):S2.
32. Dozmorov MG, Giles CB, Wren JD. Predicting gene ontology from a globalmeta-analysis of 1-color microarray experiments. BMC Bioinformatics. 2011;12(suppl 10):S14.
33. Daum JR, Wren JD, Daniel JJ, et al. Ska3 is required for spindle checkpointsilencing and the maintenance of chromosome cohesion in mitosis. Curr Biol.2009;19(17):1467-1472.
GLIOMA BIOMARKER ELTD1
NEUROSURGERY VOLUME 72 | NUMBER 1 | JANUARY 2013 | 89
Copyright © Congress of Neurological Surgeons. Unauthorized reproduction of this article is prohibited.

34. Lupu C, Zhu H, Popescu NI, Wren JD, Lupu F. Novel protein ADTRP regulatesTFPI expression and function in human endothelial cells in normal conditions andin response to androgen. Blood. 2011;118(16):4463-4471.
35. Clemmensen SN, Bohr CT, Rørvig S, et al. Olfactomedin 4 defines a subset ofhuman neutrophils. J Leukoc Biol. 2012;91(3):495-500.
36. Goel R, Muthusamy B, Pandey A, Prasad TS. Human protein reference databaseand human proteinpedia as discovery resources for molecular biotechnology. MolBiotechnol. 2011;48(1):87-95.
37. Jensen RL. Brain tumor hypoxia: tumorigenesis, angiogenesis, imaging, pseudo-progression, and as a therapeutic target. J Neurooncol. 2009;92(3):317-335.
38. Gillespie DL, Flynn JR, Ragel BT, et al. Silencing of HIF-1alpha by RNAinterference in human glioma cells in vitro and in vivo. Methods Mol Biol. 2009;487:283-301.
39. Ragel BT, Couldwell WT, Gillespie DL, Jensen RL. Identification of hypoxia-induced genes in a malignant glioma cell line (U-251) by cDNA microarrayanalysis. Neurosurg Rev. 2007;30(3):181-187.
40. Gillespie DL, Whang K, Ragel BT, Flynn JR, Kelly DA, Jensen RL. Silencing ofhypoxia inducible factor-1a by RNA interference attenuates human glioma cellgrowth vivo. Clin Cancer Res. 2007;13(8):2441-2448.
41. Rong Y, Hu F, Huang R, et al. Early growth response gene-1 regulates hypoxia-induced expression of tissue factor in glioblastoma multiforme throughhypoxia-inducible factor-1-independent mechanisms. Cancer Res. 2006;66(14):7067-7074.
42. Jensen RL. Hypoxia in the tumorigenesis of gliomas and as a potential target fortherapeutic measures. Neurosurg Focus. 2006;20(4):E24.
43. Jensen RL, Ragel BT, Whang K, Gillespie D. Inhibition of hypoxia induciblefactor-1alpha (HIF-1alpha) decreases vascular endothelial growth factor (VEGF)secretion and tumor growth in malignant gliomas. J Neurooncol. 2006;78(3):233-247.
44. Sibenaller ZA, Etame AB, Ali MM, et al. Genetic characterization of commonlyused glioma cell lines in the rat animal model system. Neurosurg Focus. 2005;19(4):E1.
45. Barth RF, Kaur B. Rat brain tumor models in experimental neuro-oncology: theC6, 9L, T9, RG2, F98, BT4C, RT-2 and CNS-1 gliomas. J Neurooncol. 2009;94(3):299-312.
46. Barth RF. Rat brain tumor models in experimental neuro-oncology: the 9L, C6, T9,F98, RG2 (D74), RT-2 and CNS-1 gliomas. J Neurooncol. 1998;36(1):91-102.
47. Asanuma T, Doblas S, Tesiram YA, et al. Visualization of the protective ability ofa free radical trapping compound against rat C6 and F98 gliomas with diffusiontensor fiber tractography. J Magn Reson Imaging. 2008;28(3):574-587.
48. Doblas S, He T, Saunders D, et al. Glioma morphology and tumor-inducedvascular alterations revealed in seven rodent glioma models by in vivo magneticresonance imaging and angiography. J Magn Reson Imaging. 2010;32(2):267-275.
49. Sipkins DA, Cheresh DA, Kazemi MR, Nevin LM, Bednarski MD, Li KC.Detection of tumor angiogenesis in vivo by alphaVbeta3-targeted magneticresonance imaging. Nat Med. 1998;4(5):623-626.
50. Kiessling F, Huppert J, Zhang C, et al. RGD-labeled USPIO inhibits adhesion andendocytotic activity of alpha v beta3-integrin-expressing glioma cells and onlyaccumulates in the vascular tumor compartment. Radiology. 2009;253(2):462-469.
51. Zhang D, Feng XY, Henning TD, et al. MR imaging of tumor angiogenesis usingsterically stabilized Gd-DTPA liposomes targeted to CD105. Eur J Radiol. 2009;70(1):180-189.
52. He T, Smith N, Saunders D, et al. Molecular MRI assessment of vascularendothelial growth factor receptor-2 in rat C6 gliomas. J Cell Mol Med. 2011;15(4):837-849.
53. Towner RA, Smith N, Doblas S, et al. In vivo detection of inducible nitric oxidesynthase in rodent gliomas. Free Radic Biol Med. 2010;48(5):691-703.
Supplemental digital content is available for this article. Direct URL citationsappear in the printed text and are provided in the HTML and PDF versions of thisarticle on the journal’s Web site (www.neurosurgery-online.com).
Acknowledgments
The authors thank Dr Stephen Lessnick, PhD, (University of Utah, HuntsmanCancer Institute) for the kind gift of the modified pMMP retrovirus fused withthe coding sequences for luciferase and hygromycin (pMMP-LucHygro). Theyalso thank Charity Njoku, BSc, (OMRF) for the culturing and maintenance ofthe F98 cells used in the orthotopic rodent model.
COMMENTS
I n this article, the authors found ELTD1, a transmembrane protein witha large extracellular domain with EGF-like repeats, to be probably
a glioma-associated marker by using the bioinformatic method that theyhad used before. Then they confirmed preliminarily that ELTD1 wasexpressed in human gliomas and the expression of ELTD1 correlatedpositively with the grading of gliomas through immunohistochemistry(IHC). The results of in vivo MR experiments on rats with F98 gliomawere also promising for ELTD1 to be a biomarker of gliomas, especially ofhigh-grade gliomas and GBM. The results of the study indicate thatELTD1 could be a new useful marker in the diagnosis and grading ofgliomas, especially with molecular MRI. With further corroborativestudies, ELTD1 could be a clinically useful marker for the diagnosis andtreatment of gliomas.
Qi PangJinan, China
T he authors have identified a novel tumor biomarker, ELTD1, forhigh-grade gliomas via a unique bioinformatics meta-analysis of
approximately 18 000 publicly available gene expression profiles. Theirprotocol identified glioma-associated genes not previously reported in theliterature. ELTD1 protein is preferentially expressed by tumor endo-thelial cells of high-grade gliomas. Antibody-based nanoprobes forELTD1 were synthesized and shown to localize to an F98 rat gliomaorthotopic model. Finally, ELTD1 expression was positively correlatedwith glioma grade in the Rembrandt and Erasmus databases, associatedwith decreased survival across all glioma grades, and associated with themesenchymal GBM subclass.1 This work highlights the utility ofcomprehensive, unbiased screens for novel glioma biomarkers, for suchwork opens up new avenues of investigation.Discovery of novel biomarkers such as ELTD1 may aid in determining
more precise subtypes and histopathological classifications of gliomas thatpotentially have clinical significance in tumor biology and assessing thera-peutic response. One crucial future study is to validate ELTD1 proteinexpression and associated change in patient survival via clinically annotatedglioma tissue microarrays to confirm the survival differences observed inRembrandt. The positive correlation of ELTD1 mRNA expression acrossincreasing grades of glioma; its origins in the epidermal growth factor, 7-transmembrane subfamily; and localized expression to endothelial cells allsuggest potential ELTD1 involvement in tumorigenic mechanisms, andfurther study could yield new therapeutic targets. Such novel biomarkersmay also be useful for assessing therapeutic response, especially with newlyavailable targeted therapies. In the era of personalized medicine, researchdedicated to systematically characterizing predictive tumor biomarkers isincreasingly useful for classifying tumor patients for designing efficientclinical trial assessment of new targeted therapies.
Michael ZorniakJohn S. Kuo
Madison, Wisconsin
1. Phillips HS, Kharbanda S, Chen R, et al. Molecular subclasses of high-grade gliomapredict prognosis, delineate a pattern of disease progression, and resemble stages inneurogenesis. Cancer Cell. 2006;9:157-173.
T he authors have demonstrated the utility of ELTD1, a novel bio-marker likely related to endothelial neovascularization, in the diagnosis
and grading of glioblastoma (GBM). Extensive immunohistochemical
TOWNER ET AL
90 | VOLUME 72 | NUMBER 1 | JANUARY 2013 www.neurosurgery-online.com
Copyright © Congress of Neurological Surgeons. Unauthorized reproduction of this article is prohibited.

analysis of the rat and humanGBM tissue, aswell asmolecularMRI analysisof the F98 glioma model in rats, demonstrated a significant associationbetween ELTD1 expression and glioma grade. It is also suggested thatincreasedELTD1 expressionwas indicativemesenchymal subtype ofGBM.Although an increase in ELTD1 negatively correlated with survival acrossdifferent grades of glioma, it was not useful for predicting survival of GBMpatients.The authors should be commended for both their advanced approach
to identifying a candidate biomarker (via sophisticated bioinformatics toanalyze 3651microarrays, followed by computer-assisted meta-analysis ofpublished literature on the top 20 candidates), as well as their rigorousevaluation in both animal and human tissue. The association betweenELTD1 and CD31, an endothelial cell marker, suggests that ELTD1expression is amarker for endothelial proliferation and neovascularization,important histological and radiological features of aggressive gliomas.1
Another study2 of the transcriptional profile of human GBM tissuesuggests similar results. As the authors correctly state, further study of theeffects of current antiangiogenic therapy (bevacizumab or sunitinib) onELTD1 expression could help confirm such an association. Whencombined with the emerging techniques of molecular MRI, neuro-oncologists could eventually use ELTD1 probes in the presurgicaldiagnosis and grading of suspected glioma, as well as quantifying theefficacy of subsequent antiangiogenic therapy.The goal of biomarker research in glioma is twofold: first, aiding in the
diagnosis of the disease and its grades and subtypes, and second, identi-fying potential therapeutic targets. The authors have taken the first step byproviding evidence that ELTD1 is useful in the detection and grading ofgliomas in humans and is an important histological marker of theirneovascularization.
Michael R. LevittDaniel L. SilbergeldSeattle, Washington
1. Russell SM, Elliott R, Forshaw D, Golfinos JG, Nelson PK, Kelly PJ. Gliomavascularity correlates with reduced patient survival and increased malignancy. SurgNeurol. 2009;72(3):242-246; discussion 246-247.
2.. Dieterich LC, Mellberg S, Langenkamp E, et al. Transcriptional profiling of humanglioblastoma vessels indicates a key role of VEGF-A and TGFbeta2 in vascularabnormalization. J Pathol. 2012;228:378-390.
M olecular biomarkers have increasingly been used to assess andmanagecancer. In this article, the authors used a very "high-tech" method-
ology (advanced laboratory and imaging techniques1 bioinformatic toolsin humans as well as in animal models) to propose ELTD1 as a novel and
potential glioma-associated biomarker. ELTD1 expression was found to behigher in high-grade than low-grade gliomas with a clear association withtumor grade and patient survival. Moreover, ELTD1 was validated asa specific marker of neoplastic angiogenesis, showing an extremely lowerexpression in normal brain tissue than in tumors.From the technical point of view, the article is highly detailed, giving
information for the reproducibility of the experimental design, even if,obviously, many tools described are not familiar to a large neurosurgicalaudience. Notwithstanding this, the article appears very interesting andinformative for the neuroscientific community, and the authors should becommended for their results as well as for the experimental background(7T MR and bioinformatics applied in neuropathology).It should be emphasized that new "biomarkers" are proposed daily in
the scientific literature; however, just a few of them have been successfullytranslated into clinical practice. Our opinion is that finding and statisti-cally demonstrating that a "biomarker" is a meaningful biomarker doesnot mean that a real clinically useful parameter has been found, butsomething like an "epiphenomenon" occurring along the pathology. Theproposal of a protein as a biological biomarker or of a morphometricparameter as an image biomarker should undergo systematic validation,after the technical and statistical steps, in a more specific way. The pro-posed biomarkers should undergo a step-by-step hierarchical validationsystem before being proposed as clinically meaningful, in the same way asfor drugs, from experimentation to clinical application, from bench tobedside.1 Moreover, it is our opinion that molecular biomarkers shouldbe investigated in parallel with objective morphometric parameters; inthe case of ELTD1, which is associated with neoangiogenesis, forexample, the analyses should run in parallel with the morphometricanalyses of the microvessels, in terms of number, density, and geometriccomplexity of the microvascular networks, which are geometricallydifferent in physiological vs pathological states as well as in different typesand subtypes of tumors.2,3 There is no doubt that further investigationscould give ELTD1 the “dignity” to become a clinically meaningfulbiomarker, being added in the near future to the family of other glioma-specific biomarkers.
Antonio Di IevaToronto, Ontario, Canada
1. Hainfellner JA, Heinzl H. Neuropathological biomarker candidates in brain tumors:key issues for translational efficiency. Clin Neuropathol. 2010;29:41-54.
2. Di Ieva A. Angioarchitectural morphometrics of brain tumors: are there anypotential histopathological biomarkers? Microvasc Res. 2010;80:522-533.
3. Di Ieva A. Fractal analysis of microvascular networks in malignant brain tumors.Clin Neuropathol. 2012;31:342-351.
GLIOMA BIOMARKER ELTD1
NEUROSURGERY VOLUME 72 | NUMBER 1 | JANUARY 2013 | 91
Copyright © Congress of Neurological Surgeons. Unauthorized reproduction of this article is prohibited.