eltinga centre for real estate research and mta krtk kti Áron horváth gábor révész eres...
TRANSCRIPT

ELTINGA Centre for Real Estate Research and
MTA KRTK KTI
Áron HorváthGábor Révész
ERES Istanbul26 June, 2015
Office Market Turning Points in the Financial
Crisis

Office market turning points in the Crisis – on average
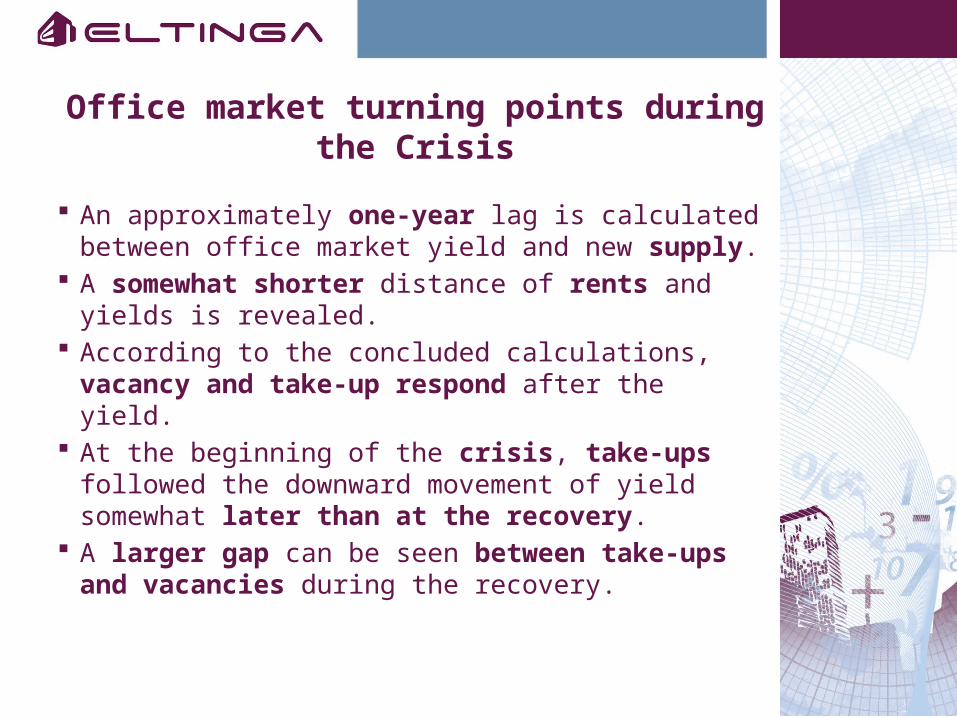
Office market turning points during the Crisis
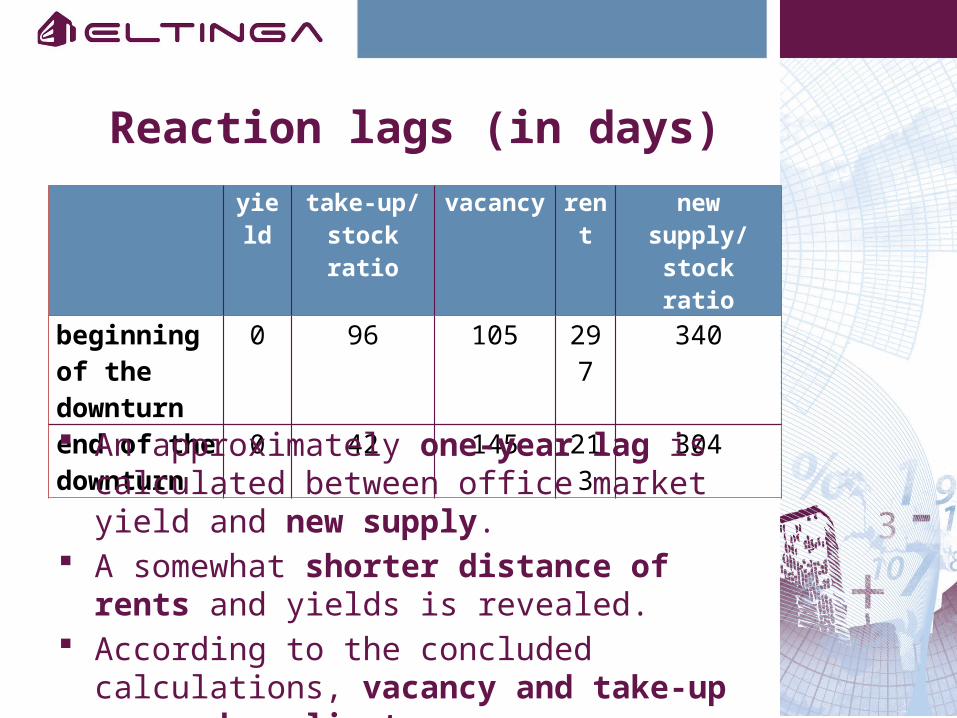
An approximately one-year lag is calculated between office market yield and new supply.
A somewhat shorter distance of rents and yields is revealed.
According to the concluded calculations, vacancy and take-up respond after the yield.
At the beginning of the crisis, take-ups followed the downward movement of yield somewhat later than at the recovery.
A larger gap can be seen between take-ups and vacancies during the recovery.

Presentation plan
1. Lead-lag correspondences of office market indicators.
2. Turning point method.3. Results.
1. LEAD-LAG CORRESPONDENCES OF OFFICE MARKET INDICATORS
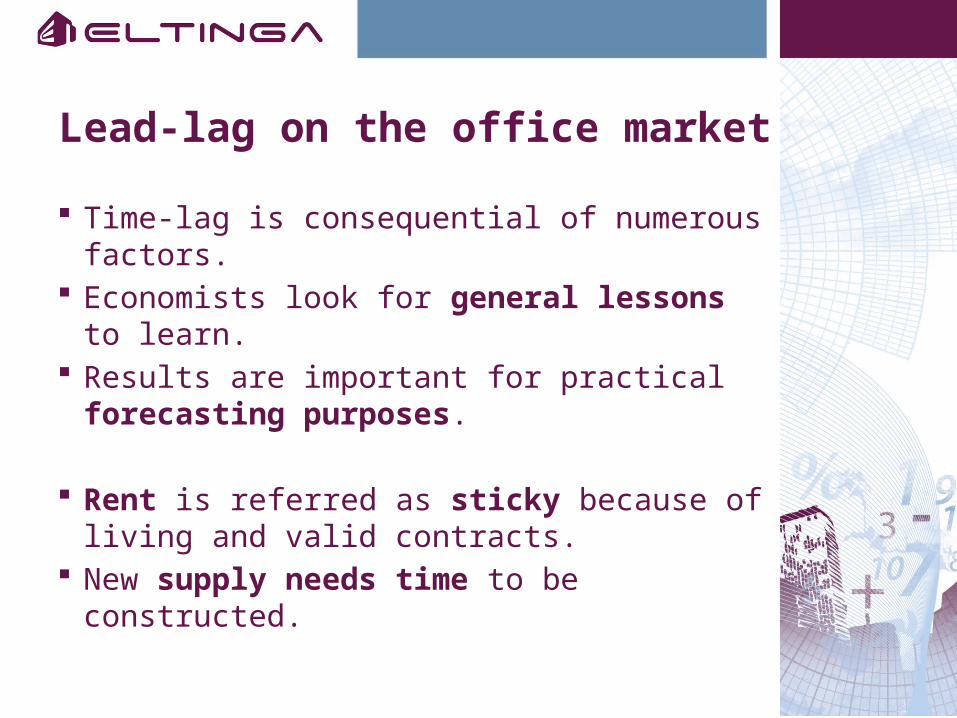
Lead-lag on the office market
Time-lag is consequential of numerous factors.
Economists look for general lessons to learn.
Results are important for practical forecasting purposes.
Rent is referred as sticky because of living and valid contracts.
New supply needs time to be constructed.

2. TURNING POINT METHOD
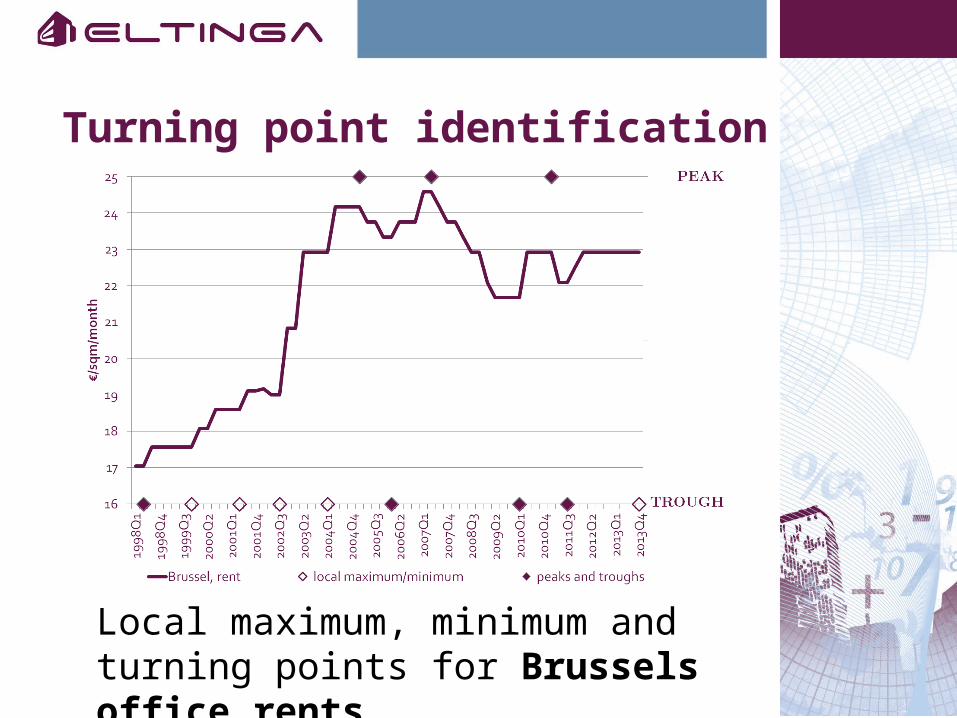
Turning point identification
Local maximum, minimum and turning points for Brussels office rents
Turning point identification
Data series of more than 80 cities from Europe and Asia.
Local maximum and minimum points were identified.
Among local maximums and minimums, turning points are selected.
The series were broken down to upturns and downturns.
How many days on average do the turning points of indicators follow the turning point in yields during the Great Financial Crisis?

Turning point identification
Local maximum, minimum and turning points for Berlin new supply / stock ratio.

3. RESULTS
yield
take-up/stock ratio
vacancy
rent
new supply/
stock ratiobeginning of the downturn
0 96 105 297 340
end of the downturn
0 42 145 213 304
An approximately one-year lag is calculated between office market yield and new supply.
A somewhat shorter distance of rents and yields is revealed.
According to the concluded calculations, vacancy and take-up respond earliest.
Reaction lags (in days)

yield
take-up/stock ratio
vacancy
rent
new supply/
stock ratiobeginning of the downturn
0 96 105 297 340
end of the downturn
0 42 145 213 304
At the beginning of the crisis, take-ups followed the downward movement of yield somewhat later than at the recovery.
A larger gap can be seen between take-ups and vacancies during the recovery.
The reaction of Supply is shorter to some extent during the upturn.
Reaction asymmetries
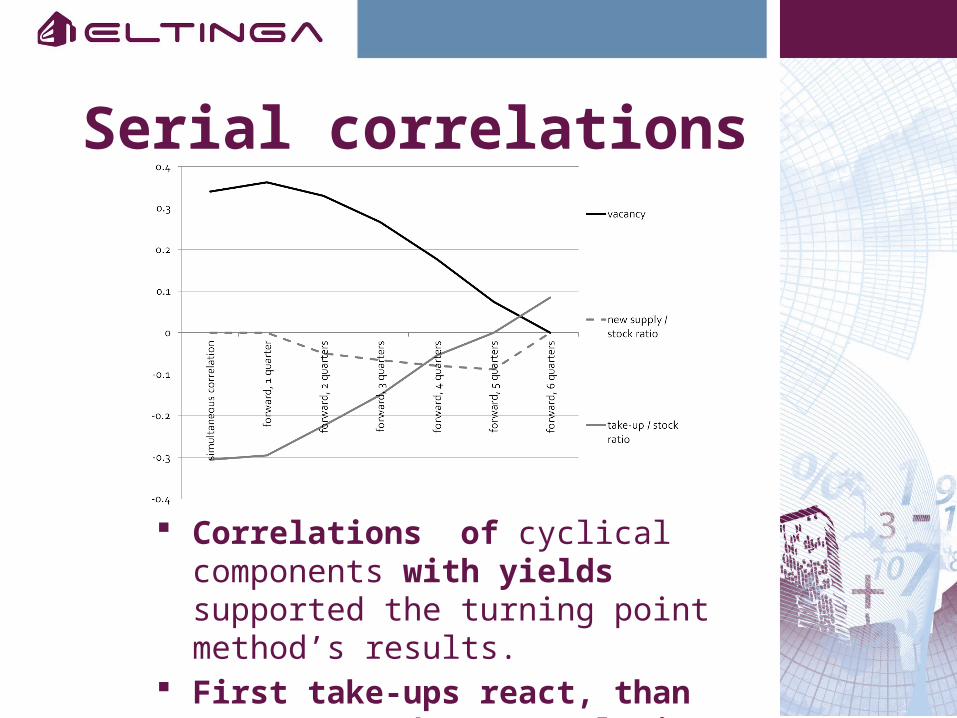
Serial correlations
Correlations of cyclical components with yields supported the turning point method’s results.
First take-ups react, than vacancy, and new supply in the end.
(Conclusion) Further research
Robustness check. Forecast performance focusing
on completion. Cross sectional explanatory
factors of the distances.