elucidating undecipherable chemical structures usi - figshare
TRANSCRIPT
1
Elucidating "Undecipherable" Chemical Structures Using Computer Assisted
Structure Elucidation Approaches
Short title:
Elucidating "Undecipherable" Chemical Structures Using CASE Approaches
Mikhail Elyashberg1*, Kirill Blinov1, Sergey Molodtsov2, Antony Williams3*
1Advanced Chemistry Development, Moscow Department, 6 Akademik Bakulev Street, Moscow
117513, Russian Federation,
2Novosibirsk Institute of Organic Chemistry, Siberian Division, Russian Academy of Sciences, 9
Akademik Lavrent'ev Av., Novosibirsk, 630090 Russian Federation
3Royal Society of Chemistry, 904 Tamaras Circle, Wake Forest, NC-27587, USA
2
Elucidating "Undecipherable" Chemical Structures Using Computer Assisted
Structure Elucidation Approaches
Mikhail Elyashberg1*, Kirill Blinov1, Sergey Molodtsov2, Antony Williams3*
Abstract
Structure elucidation using 2D NMR data and application of traditional methods of structure
elucidation is known to fail for certain problems. In this work it is shown that Computer-Assisted
Structure Elucidation (CASE) methods are capable of solving such problems. We conclude that
it is now impossible to evaluate the capabilities of novel NMR experimental techniques in
isolation from expert systems developed for processing fuzzy, incomplete and contradictory
information obtained from 2D NMR spectra.
Introduction
During the last two decades we have witnessed dramatic developments in new approaches
to elucidate molecular structures. 1D, and especially 2D NMR spectroscopy, are the main
sources of structural information utilized to extract chemical structures from analytical data.
Even when reference 1D 13C spectra are unavailable the chemical shifts can be extracted from
the 2D spectra (HSQC and HMBC spectra). However, it is frequently difficult to unambiguously
elucidate a single molecular structure from the experimental spectra. Detailed analysis of 2D
NMR data commonly shows that the data are fuzzy in nature[1]. For example, there may be
severe overlap in the 2D crosspeaks, 2D NMR correlations in long-range heteronuclear
experiments can vary from 2-4 bonds in length (such non-standard correlations were detected in
~45% of 2D spectra of 250 natural products analyzed[2]), data may be incomplete (not all
expected 2D NMR correlations are observable), and, rather frequently, contradictory strong and
medium 2D NMR peaks related to correlations of nJHH,CH type, n>3 can be present. 2D NMR has
continued to be extended with new experimental techniques on an ongoing basis: for instance
H2BC, 1,1-ADEQUATE, 1,n-ADEQUATE and a combination of hyphenated approaches such
3
as HSQC-TOCSY (see reviews[3, 4]). The application of these techniques can help in removing
the uncertainties in the topological distances between some of the correlating nuclei and directly
influences the ability to elucidate the structure of an unknown compound.
In parallel with the development of new 2D NMR techniques, new approaches for Computer-
Assisted Structure Elucidation (CASE) have been developed. Starting from pioneering works[5-8]
published in the late 1960s, researchers created several generations of CASE expert systems[9].
Contemporary expert systems are powerful analytical tools capable of assisting in the elucidation
of very complex molecular structures. These systems adequately mimic the systematic reasoning
of spectroscopists but significantly outperform the human expert in logical-combinatorial
reasoning. All assumptions used during the structure elucidation process can be considered as a
set of ‘axioms”[1]. An expert system deduces all logical corollaries (structures) that follow from
this set of “axioms” without exclusion. The number of corollaries (structures) is finite because
the number of isomers corresponding to a molecular formula is limited. The selection of the most
probable structure from those enumerated can be performed using NMR chemical shift
prediction methods[10, 11]. Experience accumulated in the application of expert systems[9] shows
that CASE methods can dramatically accelerate the procedure of structure elucidation, provide
improved reliability of the structure elucidation and, as a result, save researchers significant
amounts of time. Ultimately expert systems should be considered as synergistic tools to support
spectroscopists. They are unlikely to ever fully replace experts as situations will certainly occur
where existing algorithms will be unable to outperform human intellect and expertise. The
capabilities and limitations have been reviewed in detail elsewhere[9]. It should be noted that the
processing of 2D NMR spectra, and specifically the extraction of the 1H and X nucleus peak
shifts, especially 13C, can be a very time consuming process. In many cases the extraction of the
shifts from the data can be the main component of the total time for solving the problem using an
expert system.
4
In this article we will try to show that modern CASE expert systems should be considered
as an integral part of a spectroscopist’s armory for the quick and reliable structure elucidation of
molecular structures. Two examples of structure elucidation from 1D and 2D NMR data will be
considered where experienced spectroscopists were confronted with insuperable difficulties[12,
13]. Solution of these problems using CASE approach allows us to assert that it is now impossible
to evaluate the capabilities of NMR experimental techniques in isolation from expert systems
developed for processing fuzzy, incomplete and contradictory information obtained from 2D
NMR spectra.
Results and Discussion
Example 1. Structure Elucidation from Extremely Contradictory 2D NMR Data.
Kummerlöwe and co-workers[12] investigated one of the products obtained by reacting an
azide-containing 1,5-enyne in the presence of electrophilic iodine sources. Initially the
researchers tried to elucidate the structure of this new compound using classical methods
commonly employed in such cases. High resolution mass spectrometry unambiguously provided
the molecular formula for the unknown: C16H18NI, m/z = 351.0486 [351.0484 calculated for
C16H18NI (M+)]. The following spectroscopy data were acquired at the first stage of the
investigation: IR spectrum, 1D 1H and 13C spectra in combination with two-dimensional COSY,
HSQC, 1H-13C HMBC and 1H-15N HMBC experiments. Eleven fragments were identified from
the data: a phenyl group, a methyl group, five methylene groups (three forming an isolated
chain), a tertiary nitrogen atom, an iodine atom, and four quaternary carbon atoms. The 1H-13C
HMBC spectrum revealed 63 long-range correlations and the 1H-15N HMBC spectrum exposed
seven cross peaks thereby correlating almost every fragment with every other fragment and
indicating a very compact structure. Because it was difficult to deduce the structure from these
data, a 2D 1,1-ADEQUATE spectrum[14] was also recorded on a Bruker Avance 900 MHz
spectrometer equipped with a 5 mm cryogenically cooled TXI probehead optimized for proton
5
detection. The 1,1-ADEQUATE data did identify adjacent quaternary carbons unequivocally.
While this was useful information this additional data did not help to elucidate the structure.
Since classical NMR analysis failed, the authors[12] decided to make an attempt to solve the
problem in an unconventional way by using residual dipolar couplings (RDC’s)[15]. In
accordance with the methodology associated with RDC they assumed that as long as sufficient
anisotropic parameters can be measured, and a large enough set of structural models can be
constructed, it should be possible to identify the correct chemical structure.
In order to measure the RDC’s the compound was aligned in a stretched
polystyrene/chloroform gel. The corresponding scalar couplings were measured in a chloroform
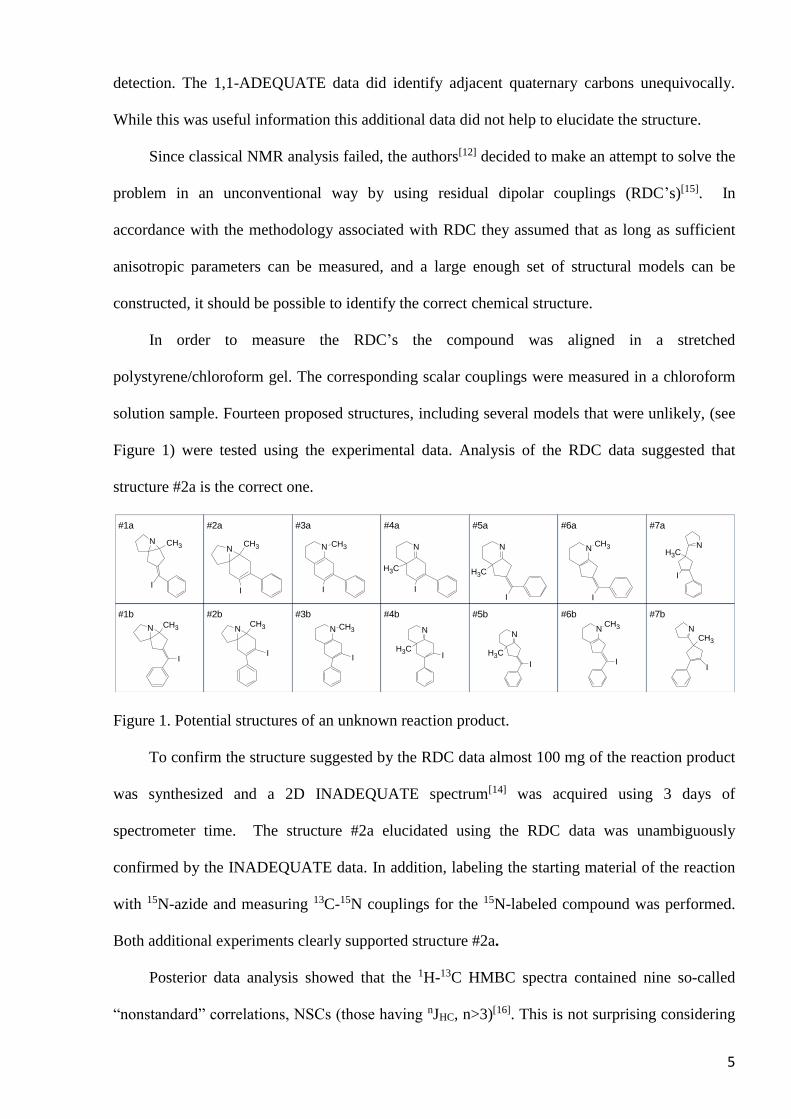
solution sample. Fourteen proposed structures, including several models that were unlikely, (see
Figure 1) were tested using the experimental data. Analysis of the RDC data suggested that
structure #2a is the correct one.
N
I
CH3
#1a
NCH3
I
#2a
N
I
CH3
#3a
N
I
CH3
#4a
N
I
CH3
#5a
N
I
CH3
#6a
NCH3
I
#7a
N
I
CH3
#1b
NCH3
I
#2b
N CH3
I
#3b
N
CH3I
#4b
N
CH3
I
#5b
NCH3
I
#6b
NCH3
I
#7b
Figure 1. Potential structures of an unknown reaction product.
To confirm the structure suggested by the RDC data almost 100 mg of the reaction product
was synthesized and a 2D INADEQUATE spectrum[14] was acquired using 3 days of
spectrometer time. The structure #2a elucidated using the RDC data was unambiguously
confirmed by the INADEQUATE data. In addition, labeling the starting material of the reaction
with 15N-azide and measuring 13C-15N couplings for the 15N-labeled compound was performed.
Both additional experiments clearly supported structure #2a.
Posterior data analysis showed that the 1H-13C HMBC spectra contained nine so-called
“nonstandard” correlations, NSCs (those having nJHC, n>3)[16]. This is not surprising considering
6
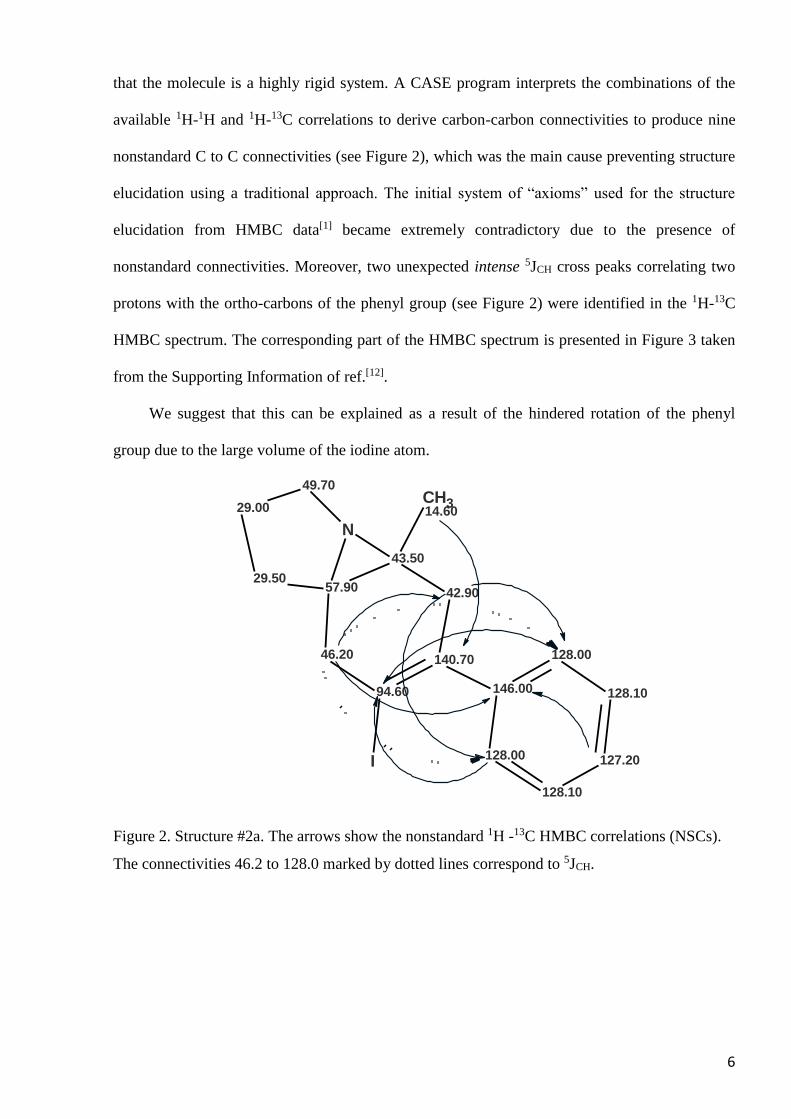
that the molecule is a highly rigid system. A CASE program interprets the combinations of the
available 1H-1H and 1H-13C correlations to derive carbon-carbon connectivities to produce nine
nonstandard C to C connectivities (see Figure 2), which was the main cause preventing structure
elucidation using a traditional approach. The initial system of “axioms” used for the structure
elucidation from HMBC data[1] became extremely contradictory due to the presence of
nonstandard connectivities. Moreover, two unexpected intense 5JCH cross peaks correlating two
protons with the ortho-carbons of the phenyl group (see Figure 2) were identified in the 1H-13C
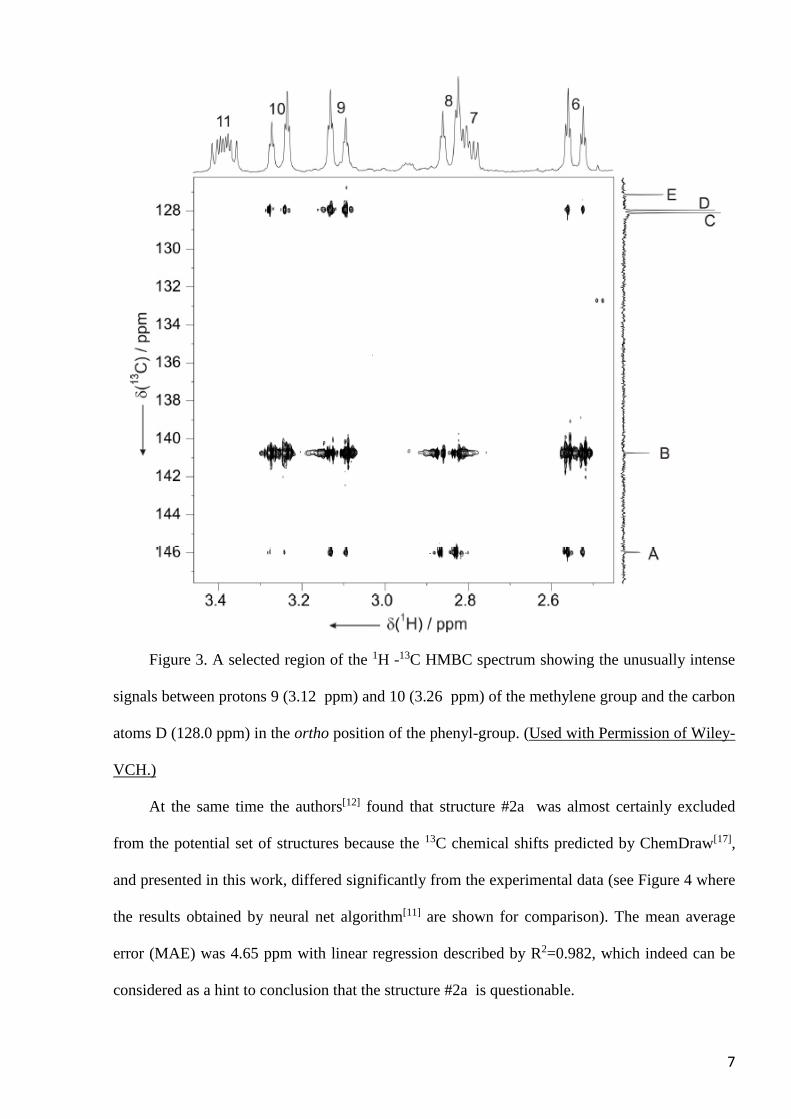
HMBC spectrum. The corresponding part of the HMBC spectrum is presented in Figure 3 taken
from the Supporting Information of ref.[12].
We suggest that this can be explained as a result of the hindered rotation of the phenyl
group due to the large volume of the iodine atom.
CH314.6029.00
29.50
46.20
49.70
42.90
127.20
128.00
128.00
128.10
128.10
57.90
94.60
43.50
140.70
146.00
N
I
Figure 2. Structure #2a. The arrows show the nonstandard 1H -13C HMBC correlations (NSCs).
The connectivities 46.2 to 128.0 marked by dotted lines correspond to 5JCH.
7
Figure 3. A selected region of the 1H -13C HMBC spectrum showing the unusually intense
signals between protons 9 (3.12 ppm) and 10 (3.26 ppm) of the methylene group and the carbon
atoms D (128.0 ppm) in the ortho position of the phenyl-group. (Used with Permission of Wiley-
VCH.)
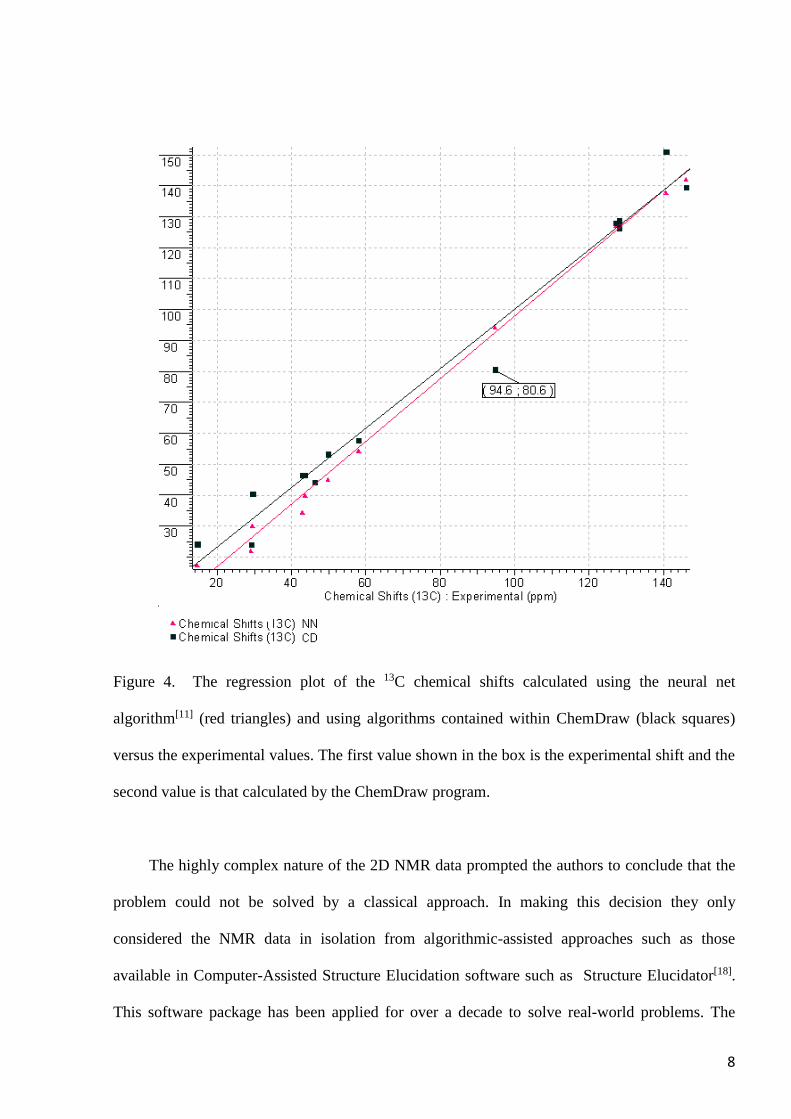
At the same time the authors[12] found that structure #2a was almost certainly excluded
from the potential set of structures because the 13C chemical shifts predicted by ChemDraw[17],
and presented in this work, differed significantly from the experimental data (see Figure 4 where
the results obtained by neural net algorithm[11] are shown for comparison). The mean average
error (MAE) was 4.65 ppm with linear regression described by R2=0.982, which indeed can be
considered as a hint to conclusion that the structure #2a is questionable.
8
Figure 4. The regression plot of the 13C chemical shifts calculated using the neural net
algorithm[11] (red triangles) and using algorithms contained within ChemDraw (black squares)
versus the experimental values. The first value shown in the box is the experimental shift and the
second value is that calculated by the ChemDraw program.
The highly complex nature of the 2D NMR data prompted the authors to conclude that the
problem could not be solved by a classical approach. In making this decision they only
considered the NMR data in isolation from algorithmic-assisted approaches such as those
available in Computer-Assisted Structure Elucidation software such as Structure Elucidator[18].
This software package has been applied for over a decade to solve real-world problems. The
9
experimental data presented in the work[12] were therefore analyzed using the software program
with several modes of problem solving examined.
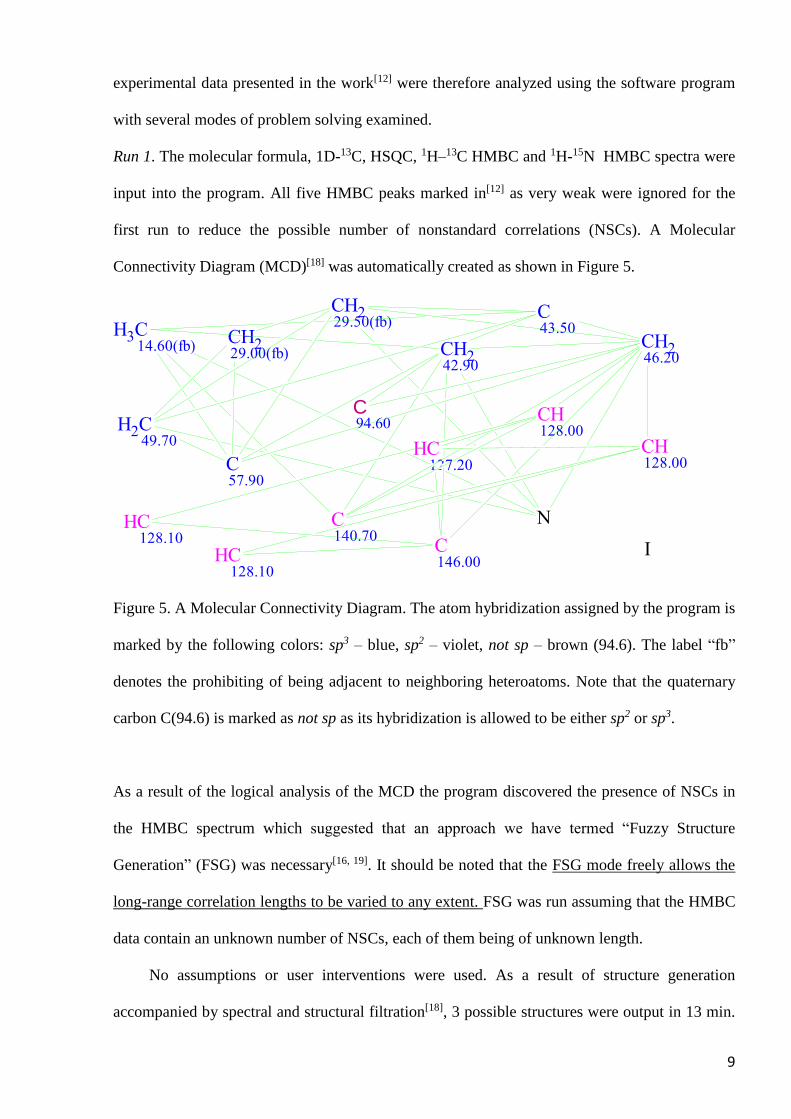
Run 1. The molecular formula, 1D-13C, HSQC, 1H–13C HMBC and 1H-15N HMBC spectra were
input into the program. All five HMBC peaks marked in[12] as very weak were ignored for the
first run to reduce the possible number of nonstandard correlations (NSCs). A Molecular
Connectivity Diagram (MCD)[18] was automatically created as shown in Figure 5.
CH314.60(fb)
CH229.00(fb)
CH229.50(fb)
CH242.90
C43.50
CH246.20
CH249.70
C57.90
C94.60
CH127.20
CH128.00
CH128.00
CH128.10
CH128.10
C140.70
C146.00
N
I
Figure 5. A Molecular Connectivity Diagram. The atom hybridization assigned by the program is
marked by the following colors: sp3 – blue, sp2 – violet, not sp – brown (94.6). The label “fb”
denotes the prohibiting of being adjacent to neighboring heteroatoms. Note that the quaternary
carbon C(94.6) is marked as not sp as its hybridization is allowed to be either sp2 or sp3.
As a result of the logical analysis of the MCD the program discovered the presence of NSCs in
the HMBC spectrum which suggested that an approach we have termed “Fuzzy Structure
Generation” (FSG) was necessary[16, 19]. It should be noted that the FSG mode freely allows the
long-range correlation lengths to be varied to any extent. FSG was run assuming that the HMBC
data contain an unknown number of NSCs, each of them being of unknown length.
No assumptions or user interventions were used. As a result of structure generation
accompanied by spectral and structural filtration[18], 3 possible structures were output in 13 min.

10
13C and 1H chemical shift predictions using the neural net algorithms[10, 11] incorporated into
Structure Elucidator were performed and the structural file was then ranked in ascending order of
the 13C chemical shift average deviation (Figure 6). While 1H NMR prediction is generally a
“weaker” nucleus for rank-ordering the structures, in this case it proved to be of value in terms of
providing additional confirmation of the structure.
CH3N
I
dN(13C): 2.638
dN(1H): 0.170
#1
CH3
N
I
dN(13C): 3.178
dN(1H): 0.184
#2
CH3
N
I
dN(13C): 4.135
dN(1H): 0.378
#3
Figure 6. The output structural file ranked in ascending order of average 13C chemical shift
deviation.
Figure 6 shows that the correct structure #2a was identified as the most probable structure
and its 13C deviation is significantly (almost twice) smaller than that calculated with ChemDraw
(see also Figure 4). The chemical shift assignment for structure #1 (as shown in Figure 6)
suggested by the prediction algorithms fully coincided with that suggested by the authors[12].
The proposed structure #2b (#2 in Figure 6) was also generated but was declined based on the
chemical shift predictions. Structure #3 results as a logical consequence from the experimental
data but can be rejected due to the higher chemical shift deviations: both the 1H and 13C
prediction deviations are almost twice the size of those for the first ranked structure and our
experience[9] shows that such large differences remove the structure from consideration.
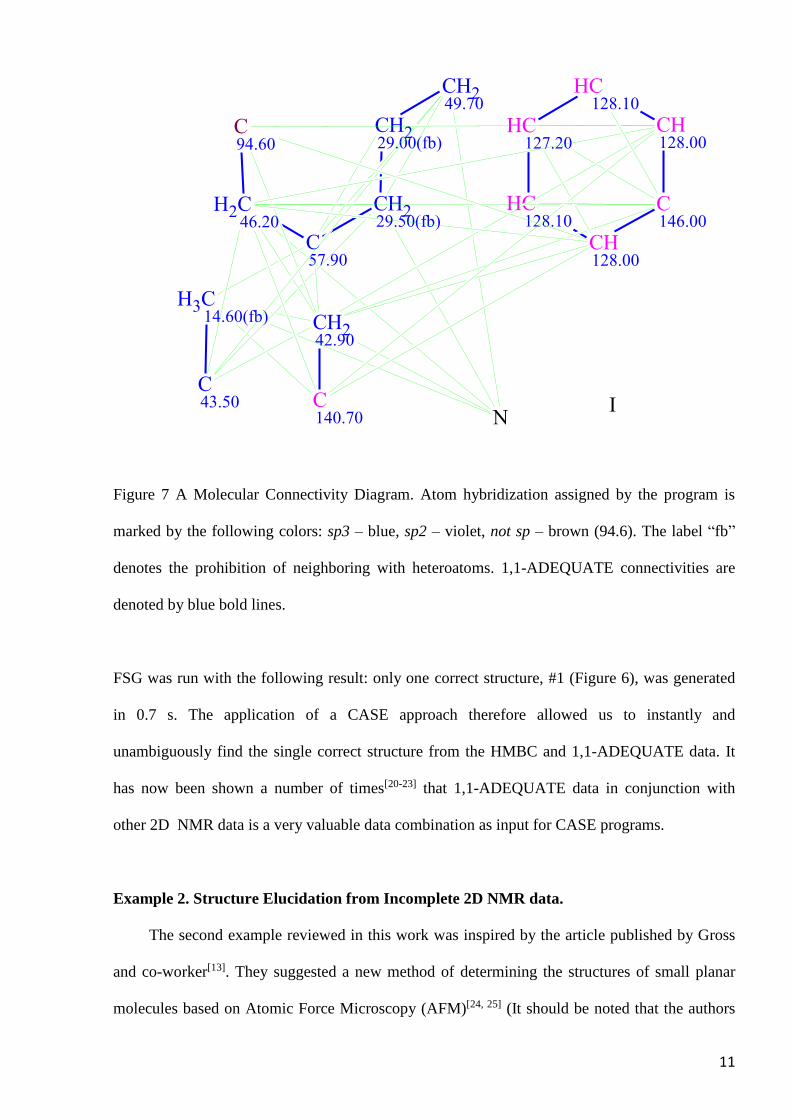
Run 2. All HMBC correlations, without any exclusion and including the set of 9 NSCs, were
used and 1,1-ADEQUATE correlations were also added to the 2D NMR data (see MCD in
Figure 7).
11
CH314.60(fb)
CH229.00(fb)
CH229.50(fb)
CH242.90
C43.50
CH246.20
CH249.70
C57.90
C94.60
CH127.20
CH128.00
CH128.00
CH128.10
CH128.10
C140.70
C146.00
NI
Figure 7 A Molecular Connectivity Diagram. Atom hybridization assigned by the program is
marked by the following colors: sp3 – blue, sp2 – violet, not sp – brown (94.6). The label “fb”
denotes the prohibition of neighboring with heteroatoms. 1,1-ADEQUATE connectivities are
denoted by blue bold lines.
FSG was run with the following result: only one correct structure, #1 (Figure 6), was generated
in 0.7 s. The application of a CASE approach therefore allowed us to instantly and
unambiguously find the single correct structure from the HMBC and 1,1-ADEQUATE data. It
has now been shown a number of times[20-23] that 1,1-ADEQUATE data in conjunction with
other 2D NMR data is a very valuable data combination as input for CASE programs.
Example 2. Structure Elucidation from Incomplete 2D NMR data.
The second example reviewed in this work was inspired by the article published by Gross
and co-worker[13]. They suggested a new method of determining the structures of small planar
molecules based on Atomic Force Microscopy (AFM)[24, 25] (It should be noted that the authors
12
interchangeably used the terms AFM and SPM in their article and we are adhering to the use of
AFM only in this article). This approach would clearly make an excellent adjunct to the other
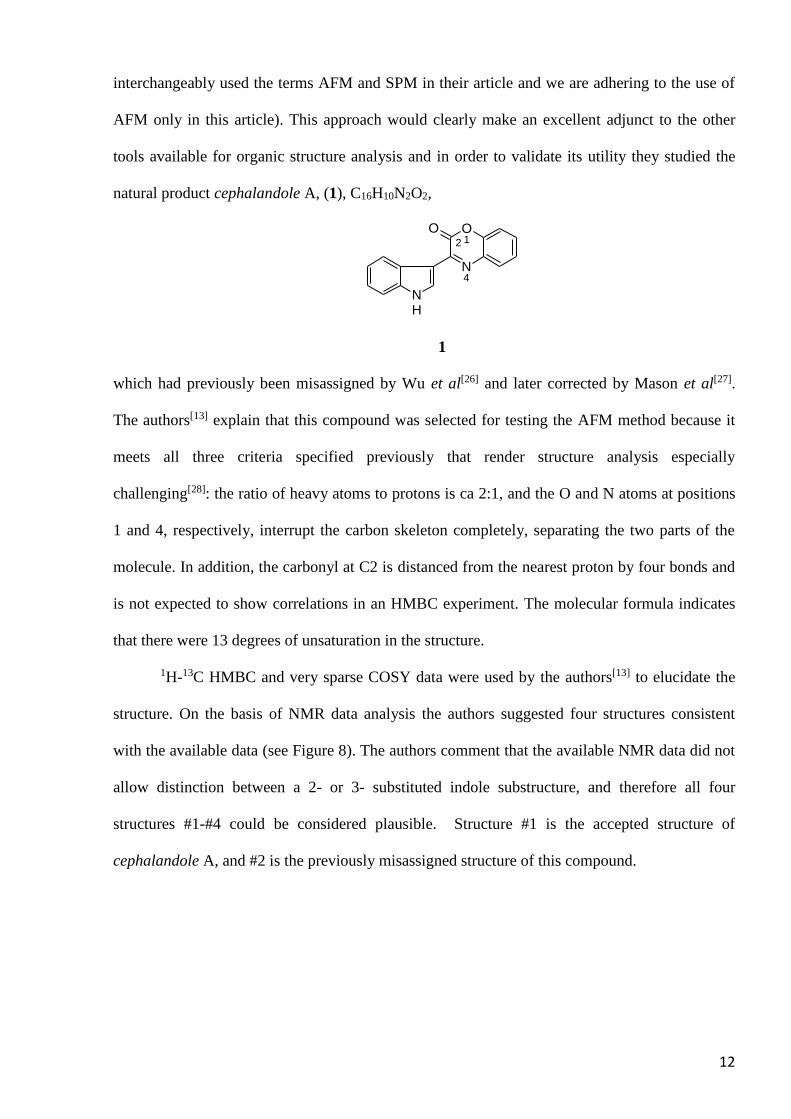
tools available for organic structure analysis and in order to validate its utility they studied the
natural product cephalandole A, (1), C16H10N2O2,
NH
O1
N4
2
O
1
which had previously been misassigned by Wu et al[26] and later corrected by Mason et al[27].
The authors[13] explain that this compound was selected for testing the AFM method because it
meets all three criteria specified previously that render structure analysis especially
challenging[28]: the ratio of heavy atoms to protons is ca 2:1, and the O and N atoms at positions
1 and 4, respectively, interrupt the carbon skeleton completely, separating the two parts of the
molecule. In addition, the carbonyl at C2 is distanced from the nearest proton by four bonds and
is not expected to show correlations in an HMBC experiment. The molecular formula indicates
that there were 13 degrees of unsaturation in the structure.
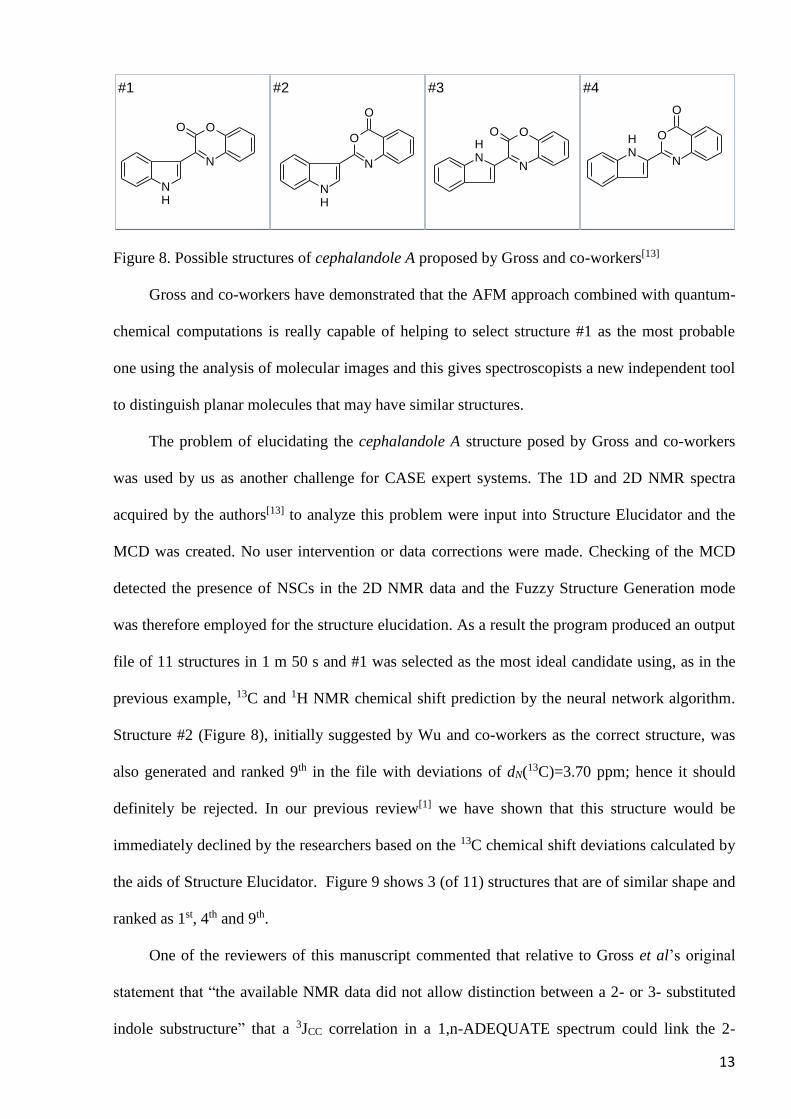
1H-13C HMBC and very sparse COSY data were used by the authors[13] to elucidate the
structure. On the basis of NMR data analysis the authors suggested four structures consistent
with the available data (see Figure 8). The authors comment that the available NMR data did not
allow distinction between a 2- or 3- substituted indole substructure, and therefore all four
structures #1-#4 could be considered plausible. Structure #1 is the accepted structure of
cephalandole A, and #2 is the previously misassigned structure of this compound.
13
NH
O
N
O
NH
O
N
O
NH
N
O
O
NH
N
O
O
#1 #2 #3 #4
Figure 8. Possible structures of cephalandole A proposed by Gross and co-workers[13]
Gross and co-workers have demonstrated that the AFM approach combined with quantum-
chemical computations is really capable of helping to select structure #1 as the most probable
one using the analysis of molecular images and this gives spectroscopists a new independent tool
to distinguish planar molecules that may have similar structures.
The problem of elucidating the cephalandole A structure posed by Gross and co-workers
was used by us as another challenge for CASE expert systems. The 1D and 2D NMR spectra
acquired by the authors[13] to analyze this problem were input into Structure Elucidator and the
MCD was created. No user intervention or data corrections were made. Checking of the MCD
detected the presence of NSCs in the 2D NMR data and the Fuzzy Structure Generation mode
was therefore employed for the structure elucidation. As a result the program produced an output
file of 11 structures in 1 m 50 s and #1 was selected as the most ideal candidate using, as in the
previous example, 13C and 1H NMR chemical shift prediction by the neural network algorithm.
Structure #2 (Figure 8), initially suggested by Wu and co-workers as the correct structure, was
also generated and ranked 9th in the file with deviations of dN(13C)=3.70 ppm; hence it should
definitely be rejected. In our previous review[1] we have shown that this structure would be
immediately declined by the researchers based on the 13C chemical shift deviations calculated by
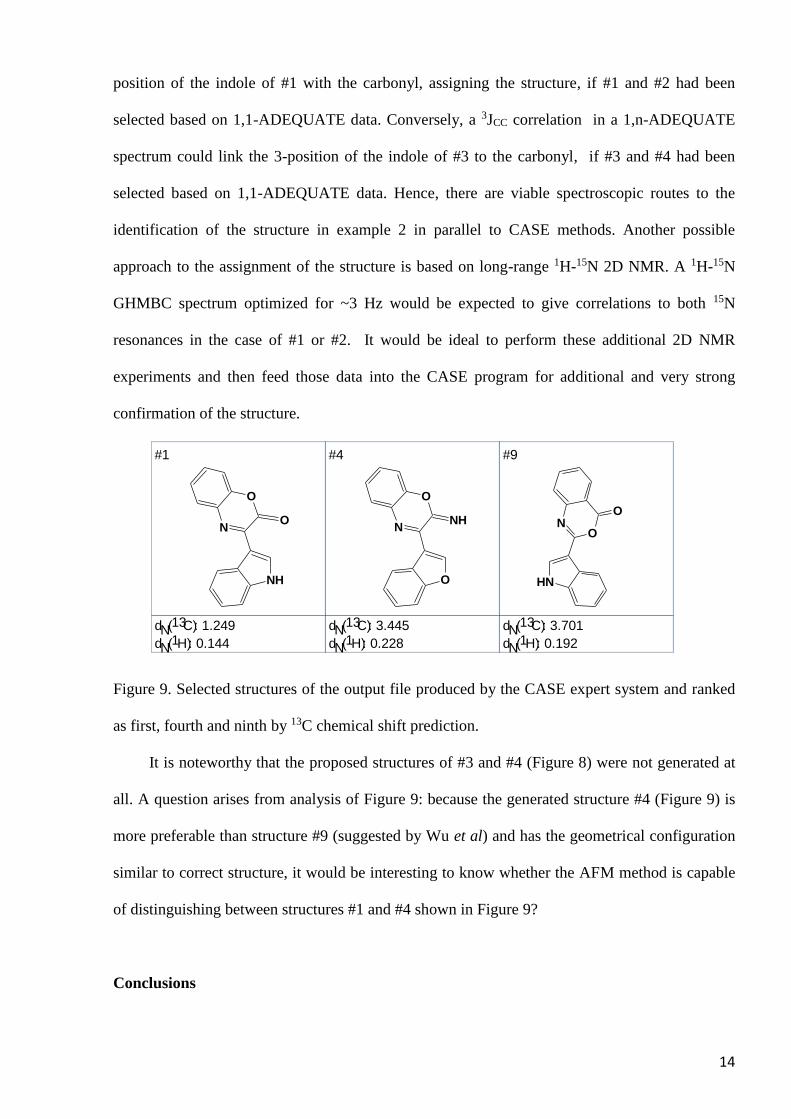
the aids of Structure Elucidator. Figure 9 shows 3 (of 11) structures that are of similar shape and
ranked as 1st, 4th and 9th.
One of the reviewers of this manuscript commented that relative to Gross et al’s original
statement that “the available NMR data did not allow distinction between a 2- or 3- substituted
indole substructure” that a 3JCC correlation in a 1,n-ADEQUATE spectrum could link the 2-
14
position of the indole of #1 with the carbonyl, assigning the structure, if #1 and #2 had been
selected based on 1,1-ADEQUATE data. Conversely, a 3JCC correlation in a 1,n-ADEQUATE
spectrum could link the 3-position of the indole of #3 to the carbonyl, if #3 and #4 had been
selected based on 1,1-ADEQUATE data. Hence, there are viable spectroscopic routes to the
identification of the structure in example 2 in parallel to CASE methods. Another possible
approach to the assignment of the structure is based on long-range 1H-15N 2D NMR. A 1H-15N
GHMBC spectrum optimized for ~3 Hz would be expected to give correlations to both 15N
resonances in the case of #1 or #2. It would be ideal to perform these additional 2D NMR
experiments and then feed those data into the CASE program for additional and very strong
confirmation of the structure.
NH
NO
O
dN(13C): 1.249
dN(1H): 0.144
#1
NNH
O
O
dN(13C): 3.445
dN(1H): 0.228
#4
NH
NO
O
dN(13C): 3.701
dN(1H): 0.192
#9
Figure 9. Selected structures of the output file produced by the CASE expert system and ranked
as first, fourth and ninth by 13C chemical shift prediction.
It is noteworthy that the proposed structures of #3 and #4 (Figure 8) were not generated at
all. A question arises from analysis of Figure 9: because the generated structure #4 (Figure 9) is
more preferable than structure #9 (suggested by Wu et al) and has the geometrical configuration
similar to correct structure, it would be interesting to know whether the AFM method is capable
of distinguishing between structures #1 and #4 shown in Figure 9?
Conclusions
15
We have considered two examples of structures that were deemed too difficult to elucidate
using traditional methods of 1D and 2D NMR spectra structural interpretation. In both cases the
researchers[12,13] used new, more challenging experimental techniques[15,24,25] to perform small
molecule structure elucidation. Using these examples we have tried to demonstrate that the
application of a computer-assisted structure elucidation (CASE) approach is a viable alternative
to rather sophisticated and laborious methods and, in these cases at least, could solve both
problems quickly and reliably. As pointed out by Reynolds and Enriquez[29] the optimization of
the experimental parameters associated with commonly used pulse sequence experiments can
provide access to additional data that were initially unavailable using default parameters.
We conclude that a modern CASE expert system should be considered as an integral part
of a spectroscopists’ armory for quick and reliable structure elucidation. Our research has shown
that it is now impossible to evaluate the capabilities of NMR experimental techniques in
isolation from mathematical algorithms developed for 2D NMR data analysis and logically
inferring all structures consistent with the experimental data and additional information. We
believe that in future CASE software will become a common tool for NMR spectroscopists to
apply, much like the software that is today an integral part of X-ray crystallography. While this
manuscript has demonstrated that CASE approaches can be applied to existing data we do not
wish to discourage the development of new and improved methods for generating new data to
improve the success of correctly elucidating molecular structures. In particular we are extremely
encouraged by the work of Gross et al to produce microscopy images of single molecules and
are excited by the future possibilities of such an approach.

16
REFERENCES
[1] M. E. Elyashberg, A. J. Williams, K. A. Blinov, Nat. Prod. Rep. 2010, 27, 1296.
[2] M. E. Elyashberg, K. A. Blinov, A. J. Williams, S. G. Molodtsov, G. E. Martin, J. Chem.
Inf. Model. 2006, 46, 1643.
[3] G. E. Martin, Ann. Rep. NMR Spectrosc. 2011, 74, 215.
[4] G. E. Martin, Ann. Rep. NMR Spectrosc. 2002, 46, 37.
[5] J. Lederberg, G. L. Sutherland, B. G. Buchanan, E. A. Feigenbaum, A. V. Robertson, A.
M. Duffield, C. Djerassi, J. Am. Chem. Soc 1968, 91, 2973.
[6] D. B. Nelson, M. E. Munk, K. B. Gasli, D. L. Horald, J. Org. Chem. 1969, 34, 3800.
[7] S. I. Sasaki, H. Abe, T. Ouki, M. Sakamoto, S. I. Ochia, Anal. Chem. 1968, 40, 2220.
[8] M. E. Elyashberg, L. A. Gribov, Zh. Prikl. Spectrosk. 1968, 8, 296.
[9] M. E. Elyashberg, A. J. Williams, G. E. Martin, Prog. NMR Spectr. 2008, 53, 1.
[10] K. A. Blinov, E. D. Smurnyy, T. S. Curanova, M. E. Elyashberg, A. J. Williams,
Chemom. Intell. Lab. Syst. 2009, 97, 91.
[11] Y. D. Smurnyy, K. A. Blinov, T. S. Churanova, M. E. Elyashberg, A. J. Williams, J.
Chem. Inf. Model. 2008, 48, 128.
[12] G. Kummerlowe, B. Crone, M. Kretschmer, S. F. Kirsch, B. Luy, Angew Chem Int Ed
Engl 2011, 50, 2643.
[13] L. Gross, F. Mohn, N. Moll, G. Meyer, R. Ebel, W. M. Abdel-Mageed, M. Jaspars, Nat.
Chem. 2010, 2, 821.
[14] S. Berger, S. Braun, 200 and More NMR Experiments, Wiley-VCH, Weinheim, 2004.
[15] G. Kummerlowe, S. Schmidt, B. Luy, Open Spectroscopy J. 2010, 4, 16.
[16] S. G. Molodtsov, M. E. Elyashberg, K. A. Blinov, A. J. Williams, E. R. Martirosian, G.
E. Martin, B. Lefebvre, J. Chem. Inf. Comput. Sci. 2004, 44, 1737.
[17] Cambridge Soft Corporation, CS Chem Draw PRO
17
[18] M. E. Elyashberg, K. A. Blinov, S. G. Molodtsov, A. J. Williams, G. E. Martin, J. Chem.
Inf. Comput. Sci. 2004, 44, 771.
[19] M. E. Elyashberg, K. A. Blinov, A. J. Williams, S. G. Molodtsov, G. E. Martin, J. Chem.
Inf. Model. 2007, 47, 1053.
[20] T. Lindel, J. Junker, M. Kock, J. Mol. Model. 1997, 3, 364.
[21] J. Junker, W. Maier, T. Lindel, M. Kock, Org. Lett. 1999, 1, 737.
[22] S. W. Myer, M. Kock, J. Nat. Prod. 2008, 71, 1524.
[23] S. F. Cheatham, M. Kline, R. R. Sasaki, K. A. Blinov, M. E. Elyashberg, S. G.
Molodtsov, Magn. Reson. Chem. 2010, 48, 571.
[24] F. J. Giessibl, Rev. Mod. Phys. 2003, 75, 949.
[25] L. Gross, F. Mohn, N. Moll, P. Liljeroth, G. Meyer, Science 2009, 325, 1110.
[26] P.-L. Wu, Y.-L. Hsu, C.-W. Jao, Nat. Prod. 2006, 69, 1467.
[27] J. J. Mason, J. Bergman, T. Janosik, J. Nat. Prod. 2008, 71, 1447.
[28] P. Crews, J. Rodriguez, M. Jaspars, Organic Structure Analysis Oxford Univ. Press,
Oxford, 2010.
[29] W. F. Reynolds, R. G. Enriquez, J. Nat. Prod. 2002, 65, 221.