ely hospital 20170331 -...
TRANSCRIPT

Minnesota Department of Natural Resources
Ely Bloomenson
Community Hospital Biomass Energy System
Preliminary Feasibility Report
FINAL
3/31/2017
Wilson Engineering Services, PC
Meadville, PA ● Charlo�e, NC
www.WilsonEngineeringServices.com

Preliminary Feasibility Report Version: Final Ely Bloomenson Community Hospital Date Modified: March 31, 2017 Ely, MN
WES ● Wilson Engineering Services, PC
Minnesota Department of Natural Resources 500 Lafayette Road St. Paul, MN 55155-4040 (651) 296-6157 (888) 646-6367 [email protected] TTY: (651) 296-5484 or (800) 657-3929 www.dnr.state.mn.us Prepared by: Wilson Engineering Services, PC 902 Market Street Meadville, PA 16335 Phone: 814-337-8223 Fax: 814-333-4342 www.wilsonengineeringservices.com

Preliminary Feasibility Report Version: Final Ely Bloomenson Community Hospital Date Modified: March 31, 2017 Ely, MN
WES ● Wilson Engineering Services, PC
Table of Contents 1.0 Executive Summary ........................................................................................................................... 1
2.0 Introduction ...................................................................................................................................... 5
2.1 MN SWET Program ........................................................................................................................ 5
2.2 Ely Bloomenson Community Hospital Opportunity ...................................................................... 5
3.0 Facility Overview ............................................................................................................................... 5
3.1 Boiler Plant .................................................................................................................................... 5
4.0 Building Heat Demand ...................................................................................................................... 7
5.0 Biomass Availability and Price......................................................................................................... 10
5.1 Pellets .......................................................................................................................................... 11
5.2 Wood Chips ................................................................................................................................. 11
6.0 Evaluated Biomass Systems ............................................................................................................ 12
6.1 Option 1 – Wood Chip Boiler System .......................................................................................... 13
6.2 Option 2 – Wood Pellet and Dry Chip Boiler System .................................................................. 15
6.3 Option 3 – Wood Pellet Boiler System ........................................................................................ 18
6.4 Underground Piping .................................................................................................................... 18
7.0 Grants and Incentives ..................................................................................................................... 19
7.1 Biomass Thermal Production Incentive ...................................................................................... 19
7.2 IRRRB Business Energy Retrofit ................................................................................................... 19
7.3 Rural Energy for America Program (REAP) .................................................................................. 20
7.4 Community Facilities Direct Loan and Grant .............................................................................. 20
7.5 PACE (Property Assessed Clean Energy) ..................................................................................... 20
7.6 IRRRB Development Infrastructure ............................................................................................. 20
7.7 DEED ............................................................................................................................................ 20
8.0 Biomass System Analysis................................................................................................................. 20
8.1 Capital Cost Estimates and Operating Cost Savings .................................................................... 21
9.0 Emissions, Permitting, and Licensing .............................................................................................. 23
9.1 Particulate Matter Emissions ...................................................................................................... 23
9.2 Gaseous Emissions ...................................................................................................................... 24
9.3 Greenhouse Gas Emissions Benefits ........................................................................................... 25
9.4 Air Permitting .............................................................................................................................. 25
9.5 Use of Wood Residuals as Fuel ................................................................................................... 25
9.6 Ash ............................................................................................................................................... 26
9.7 Boiler Operator Requirements .................................................................................................... 26
10.0 Conclusions and Recommendations ............................................................................................... 27

Preliminary Feasibility Report Version: Final Ely Bloomenson Community Hospital Date Modified: March 31, 2017 Ely, MN
WES ● Wilson Engineering Services, PC
Appendix A – Drawings Appendix B – Capital Cost Estimates Appendix C – Financial and Fuel Cost Analyses Appendix D – UMN Extension By-Products Program Brochure

Preliminary Feasibility Report Version: Final Ely Bloomenson Community Hospital Date Modified: March 31, 2017 Ely, MN
WES ● Wilson Engineering Services, PC Page 1 of 29
1.0 EXECUTIVE SUMMARY
The Ely Bloomenson Community Hospital is located in Ely, MN. This 77,000 ft2 facility is heated by propane and fuel oil and uses an average of 81,373 gallons of propane per year costing an average of approximately $93,756 per year (based on the past 2 years). A wood heating system utilizing wood chips or pellets has the potential to reduce fuel costs and greenhouse gas emissions for this facility, while utilizing a renewable, local fuel source.
Modern biomass combustion systems can efficiently and cleanly utilize a variety of fuels with a wide range of moisture content. Due to the variations in the potential fuels available in various locations, there are differing systems for each fuel type. Options evaluated in this report would require an estimated annual use of up to 775 tons of green wood chips or 438 tons of wood pellets. Table ES1 compares the cost of delivered heat for wood and fossil fuels.
Table ES1 – Fuel Pricing and Cost per mmBtu
Technology, Unit Cost/Unit Input
mmBtu /Unit
Assumed Efficiency
Output mmBtu /Unit
Output Cost
/mmBtu Green Wood Chip1, ton $40 10 70% 7 $5.71 Dry Wood Chip2, ton $80 12 75% 9 $8.89 Wood Pellet3, ton $206 16.4 80% 13.1 $15.72 Propane (2-year average), gal $1.15 0.091 85% 0.078 $14.84 Propane (2018 estimate), gal $0.95 0.091 85% 0.078 $12.24 #2 Fuel Oil, gal $3.00 0.14 80% 0.11 $26.79 Note 1: Green wood chips are approximately 40-45% moisture content wet basis. Note 2: Dry wood chips are approximately 25-30% moisture wet basis. They are not commercially available in Ely. Cost for dry wood chips is estimated by WES as a fair market price. Note 3: Wood pellets are 6-8% moisture content wet basis. Price includes delivery by auger truck. Note 4: Table 8 contains the assumptions used to develop the above values.
Three biomass boiler options are evaluated for this facility.
Option 1 – Wood Chip Boiler: A wood chip hot water boiler, rated 1.7 mmBtu/hr, would be installed in a new boiler plant located between the ambulance garage and the propane tank. An automatic fuel reclaim and feeding system, and a 1,700 gallon thermal storage tank(s) would be installed with the boiler. The automatic indoor fuel storage would be sized to hold approximately 50 tons of wood chips. The wood chip boiler would tie into the hospital’s heating system in the existing central boiler room, and would offset approximately 85% of the fossil fuel used annually by the hospital.
Option 2 – Wood Pellet and Dry Chip Boiler: One wood pellet hot water boiler, rated 1.7 mmBtu/hr, would be installed in a new boiler plant located between the ambulance garage and the propane tank. An automatic fuel reclaim and feeding system, and a 1,300 gallon thermal storage tank(s) would be installed with the boiler. The fuel handling system and boiler would be capable of utilizing dry chips or pellets for maximum fuel flexibility. The automatic indoor fuel storage would be sized to hold approximately 68 tons of wood pellets or 25 tons of dry wood chips. The pellet boiler would tie into the hospital’s heating system in the existing central boiler room, and would offset approximately 95% of the fossil fuel used annually by the hospital.
Option 3 – Wood Pellet Boiler: One wood pellet hot water boiler, rated 1.7 mmBtu/hr, would be installed in a new boiler plant located at the northwest corner of the hospital. A 40 ton pellet silo and a 1,300 gallon thermal storage tank(s) would be installed with the boiler. The fuel handling system would

Preliminary Feasibility Report Version: Final Ely Bloomenson Community Hospital Date Modified: March 31, 2017 Ely, MN
WES ● Wilson Engineering Services, PC Page 2 of 29
automatically feed pellets from the silo to the boiler. The pellet boiler would tie into the hospital’s heating system in the existing central boiler room, and would offset approximately 95% of the fossil fuel used annually by the hospital.
A proposed system fuel use profile is provided in Table ES2 showing the estimated annual fuel use compared to the existing propane system.
Table ES2 – Proposed System Fuel Use Profile
Option
Current Annual Fuel Use
Annual Fuel Use with Proposed Biomass System
Propane and Propane
Equivalent (gal)
Biomass Demand Coverage
Estimated Biomass
Use (tons)
Estimated Propane Use with Biomass System (gal)
1 – Chip Boiler 81,373 85% 776 12,206 2 – Pellet and Dry Chip Boiler using pellets 81,373 95% 463 4,069 2 – Pellet and Dry Chip Boiler using dry chips1 81,373 95% 675 4,069 3 – Pellet Boiler 81,373 95% 457 4,069
Note 1: Usage of dry chips is shown for comparison purposes only, as dry chips are not available at this time. Note 2: Table 8 contains the assumptions used to develop the above values.
Table ES3 provides a comparison of fuel costs and operating costs for the options.
Table ES3 – Fuel and Operating Cost Comparison
Option
Current Annual
Fuel Cost
Estimated Annual Costs with Proposed Biomass
System
Estimated First Year
Operational Savings
Thermal Production Incentive
Estimated Net Cash
Flow Propane Cost
Biomass Cost
Propane Cost
O&M Increase
1 – Chip Boiler $93,756 $31,058 $14,063 $11,005 $37,629 $27,176 $64,805 2 – Pellet and Dry Chip Boiler using pellets $93,756 $95,516 $4,688 $5,251 ($11,698) $30,380 $18,681 2 – Pellet and Dry Chip Boiler using dry chips1 $93,756 $54,009 $4,688 $5,251 $29,809 $30,380 $60,189 3 – Pellet Boiler $93,756 $94,343 $4,688 $3,764 ($9,039) $30,007 $20,968
Note 1: Usage of dry chips is shown for comparison purposes only, as dry chips are not available at this time. Note 2: Table 8 contains the assumptions used to develop the above values.
A summary of the estimated capital costs and payback is provided in Table ES4. This table also evaluates the options with an assumed 25% grant. Detailed financial analyses were generated for all options and are included in Appendix C.

Preliminary Feasibility Report Version: Final Ely Bloomenson Community Hospital Date Modified: March 31, 2017 Ely, MN
WES ● Wilson Engineering Services, PC Page 3 of 29
Table ES4 – Cost and Payback Analysis
Option Estimated
Capital Cost
Assumed Grant
Funding
Financed Amount
Simple Payback Period2 (years)
Net Present Value
(25 years) 1 – Chip Boiler $1,189,240 $0 $1,189,240 24 $167,436 2 – Pellet and Dry Chip Boiler using pellets $959,365 $0 $959,365 - ($706,724) 2 – Pellet and Dry Chip Boiler using dry chips1 $959,365 $0 $959,365 22 $261,904 3 – Pellet Boiler $519,500 $0 $519,500 - ($209,893) 1 – Chip Boiler $1,189,240 $297,310 $891,930 16 $464,746 2 – Pellet and Dry Chip Boiler using pellets $959,365 $239,841 $719,524 - ($466,883) 2 – Pellet and Dry Chip Boiler using dry chips1 $959,365 $239,841 $719,524 14 $501,745 3 – Pellet Boiler $519,500 $129,875 $389,625 - ($80,018)
Note 1: Usage of dry chips is shown for comparison purposes only, as dry chips are not locally available at this time. Note 2: Simple payback is calculated taking into account the assumption that thermal production incentive payments end after 10 years.
A modern biomass boiler system would allow Ely Bloomenson Community Hospital to reduce fossil fuel usage while utilizing a local and renewable source of energy. The options evaluated in this report would provide benefits to EBCH as summarized:
• Option 1 is a boiler system capable of utilizing green wood chips. This project would provide a first year net operating savings of $37,629, not including payments from the thermal production incentive, and would have a capital cost of $1,189,240.
• Option 2 is a boiler system capable of utilizing wood pellets or dry wood chips. If pellet fuel was utilized, this project would increase annual operating costs by $11,698, before taking into account payments from the thermal production incentive, and if dry wood chips were utilized, first year net operating savings would be $29,809, not including payments from the thermal production incentive. This project would have a capital cost of $959,365.
• Option 3 is a boiler system capable of utilizing wood pellets. This project would increase annual operating costs by $9,039, before taking into account payments from the thermal production incentive, and would have a capital cost of $519,500.
Financial performance of the evaluated options is heavily dependent on the cost of fossil fuels and wood fuels, as shown by the sensitivity analyses in Appendix C. If the cost of fossil fuels rises, then the savings will increase fairly dramatically.
Payments from the Minnesota Biomass Thermal Production Incentive are a major driver of savings. For Option 1 the annual payment would be approximately $27,176, for Option 2 the annual payment would be approximately $30,380, and for Option 3 the annual payment would be approximately $30,007. It is important to note that these payments only occur for 10 years following startup of the project.
Without the incentive payments, use of pellet fuel is not economical based on current fossil fuel prices. For a pellet project to even be worthy of consideration, the cost of fossil fuels (propane and fuel oil) would have to rise to the equivalent of a propane cost of approximately $1.50/gallon ($19.32/mmBtu output).
Additional benefits provided through the use of local biomass at the facility include:
• Net reduction of greenhouse gas emissions by 282-393 metric tonnes annually,

Preliminary Feasibility Report Version: Final Ely Bloomenson Community Hospital Date Modified: March 31, 2017 Ely, MN
WES ● Wilson Engineering Services, PC Page 4 of 29
• Keeping $31,000-$95,000 per year spent on energy within the region, • Diversification of fuels used by the Ely Bloomenson Community Hospital, • Reduction in operating budget volatility due to wide fluctuations in fossil energy pricing, • Creating markets for low-value woody biomass to enhance opportunities for forest
management activities to reduce pests and disease, prevent fires, and manage for ecological diversity, soil health, and water quality.
A new ambulance garage is planned north of the new propane tank. There is undeveloped land west of the hospital which is owned by the city, which may be developed eventually. Interconnection of these future loads to the biomass plant would improve the economics of the biomass plant, but the boiler size should not be increased at this time in anticipation of these or future loads. Even if the boiler size is not increased, and significant additional load is connected, the biomass boiler will be able to supply more renewable energy overall, just not at the peak times, which occur for a few weeks per year. These peaks would be seamlessly covered by propane. If significant additional load is expected to be connected in the future, it could be prudent to leave space in the plant to install a second boiler at a later date, taking into account that this second boiler would share the fuel storage bin and the stack.
Should EBCH be interested in pursuing a biomass option, WES recommends that staff visit modern biomass boiler installations to develop a detailed understanding of the equipment and its capabilities. The MN SWET is available to assist in arranging tours of existing facilities. As EBCH continues to pursue renewable biomass energy options, WES recommends that the next level of evaluation includes detailed consideration of the following items:
• Work with the MN SWET to identify alternative funding sources (low interest loans, grants, and incentives).
o Thermal Production Incentive o IRRRB Business Energy Retrofit o Rural Energy for America Program (REAP) o Community Facilities Direct Loan & Grant Program o PACE o IRRRB Development Infrastructure o DEED
• Perform site investigations (utility, geotechnical) for the new boiler room and fuel storage building and further develop the biomass plant layout and capital cost based on investigation results.
• Continue to explore viable options for the wood chip supply, taking into consideration chip size, moisture content, and fuel quality, relative to boiler capabilities.
• Network with regional planning agencies to encourage widespread community support for this renewable energy project.

Preliminary Feasibility Report Version: Final Ely Bloomenson Community Hospital Date Modified: March 31, 2017 Ely, MN
WES ● Wilson Engineering Services, PC Page 5 of 29
2.0 INTRODUCTION
2.1 MN SWET PROGRAM The Minnesota Statewide Wood Energy Team (MN SWET) is working to implement commercially available wood energy systems by strategically identifying businesses, government buildings and other institutions that are:
• Currently using propane or fuel oil for heating and do not have direct access to natural gas • Located in an area of the state with sufficient wood resources and in need of forest market
expansion and/or wildfire risk management • Capable of meeting the space and operational requirements needed for contemporary wood
heating systems, and • Financially committed to thermal wood energy options.
Wilson Engineering Services, PC (WES) was contracted by the Minnesota Department of Natural Resources (MN DNR), on behalf of the MN SWET, to provide Intermediate Woody Biomass Thermal Energy feasibility assessments. The feasibility assessments provide a preliminary engineering and financial analysis for potential projects that are recommended by MN SWET after preliminary screening. The purpose of the feasibility assessments is to facilitate sound decision making by the facilities regarding the installation of wood energy systems. The feasibility assessments address key design parameter choices, such as fuel type (chips, pellets, and cord wood), layout, thermal storage needs, heat distribution, and estimated capital and operating costs.
2.2 ELY BLOOMENSON COMMUNITY HOSPITAL OPPORTUNITY Ely Bloomenson Community Hospital is located in Ely, MN and provides a full range of medical care to the community. The hospital was built in 1958 and was expanded in 1966, 1970 and 1973. The hospital is currently heated with propane and fuel oil. Because of the abundance of wood resources in the area, the hospital is investigating whether it is feasible to install a wood energy system to supply heat. In recent years, studies have been conducted in Ely to look at the possibility of implementing a community-wide biomass district heating system; however, this was determined to be infeasible. This study takes a fresh look at the hospital by itself to determine what the costs and benefits would be of a biomass system sized and situated to best serve the hospital alone.
3.0 FACILITY OVERVIEW
WES personnel conducted a site visit on June 21, 2016 in order to evaluate the existing systems and become familiar with the physical plant layout.
Ely Bloomenson Community Hospital (EBCH) is a community hospital located in Ely, MN, which consists of a hospital, clinic, and nursing home that make up one building complex. The facility was converted from steam to hot water in 2014. Heat is supplied to the building via air handlers with hot water coils. The facility is occupied at all times.
3.1 BOILER PLANT The central plant operates in a summer mode and a winter mode. There are two boilers that provide the needed heating demands in the winter, and three smaller boilers that provide the heating demands in the summer. The summer load consists of several zones for reheats as well as domestic hot water

Prelimina
WES ● W
(DHW) frobeing met
The facilitfrom steaof NashwdishwasheFeb 22, 20summer, heating D
The plant 3,000 MBMBH. Theyet been 399 MBH and a bypthe DHW
ry Feasibility
ilson Enginee
om the centrat by one Weil
ty is set up tom and fuel oauk, MN. Theer. The overa016, the outsthe water tem
DHW.
has two KN-3BH, the rated oese two meetneeded. For sinput each a
pass of the mafrom the larg
Report
ering Services
al plant. At thl McLain boile
supply all heil to hot wate
e system runsall system is oide air tempemperature va
30 boilers (Figoutput is 2,78all of the win
summer opernd 365 MBH ain building loger system.
VeDate Modif
, PC
he time of theer. The plant w
eating needs fer and propans on 30% glycon outside res
erature was 2aries to maint
gure 1) which81 MBH, mininter load, andration, there aoutput (whenoop is turned
Figure 1 – KN
ersion: Finalfied: March 3
e site visit, thewas on summ
from the centne. The 2014 ol. In the kitc
set and can op2°F and the hotain the neede
h were installeimum input isd anecdotallyare (3) Weil Mn condensing to isolate the
N-30 Propane
Ely Blo1, 2017
e plant was rumer operation
tral plant, andrenovation when there is aperate as higot water looped temperatu
ed in 2014. Ts 600 MBH, a
y, full fire on bMcLain Ultra 3g). The small bese boilers w
e Boilers
oomenson Co
unning at 145n mode (typic
d was recentlwas done by Jan electric boh as 190°F. Fo
p setpoint wasure to the hea
The rated inpuand minimumboth at the sa399 CT boilerboilers are us
with a few hyd
ommunity HoEly
Page 6
5°F, with the cally May – O
ly converted K Mechanical
ooster for theor example, os 182°F. In that exchanger
ut to each bom output is 55ame time has rs (Figure 2) red in the sum
dronic zones a
ospital y, MN
6 of 29
load ct).
over l out
e on e for
iler is 6.2 not
ated mmer, and

Prelimina
WES ● W
There is aheat exchrated for 4could fire since the
The 2 pumexchangeoperationthe visit, ton the inl1AF008LE
The only rflow throusystem inboilers anthrough eboilers whthrough t
The main mechanicpipes to tmechanic
4.0 B
EBCH provheating se
ry Feasibility
ilson Enginee
steam boilerhanger which 4,184 MBH oon propane, purpose of th
mps used in thr as well as th
n, there are twthe (summer)et and 31 psi
EK31.
real issue theugh the two pthe winter is
nd the heat exeach. The issuhen they bothhe heat exch
pipes in the bcal room nearhis room star
cal room.
BUILDING H
vided WES weasons 2014-
Report
ering Services
F
r left over frois plumbed inutput (125 Hbut it couldn
his boiler is to
he winter for he building lowo inline pum) inline circulaon the outle
facility has spropane boiles setup to runxchanger for t
ue with this is h hit their fullanger for the
boiler room ar the NW cornrt out as 3” in
HEAT DEM
ith propane f2015 and 201
VeDate Modif
, PC
Figure 2 – We
m the old sten parallel withP). This boile
n’t be tuned ro provide an a
circulating thoops are B&G mps which circator pump wat. This circula
een since opeers when theyn all the waterthe steam bothat there is
l firing rate. Te steam boiler
are 6”. Pipes tner of the buin the boiler ro
MAND
fuel delivery d15-2016. Tabl
ersion: Finalfied: March 3
eil McLain Ult
eam plant whh the two KNr runs on fueight for whatalternative fu
hrough the twe-1510 4BD,
culate water as supplying t
ator is B&G 80
eration of they do their perr flow that go
oiler. Balancinsometimes in
This has been r.
to the clinic mlding where t
oom and then
data and weele 1 lists the p
Ely Blo1, 2017
tra Boilers
ich only supp-30 boilers. Tl oil with a pr
tever reason,uel choice.
wo KN-30 boi761 GPM, 69through the rthe summer z0 4X7 6.375, 2
e new hydronriodic (short) oes to the buing valves are nadequate flo alleviated by
mechanical rothere are som
n reduce to 2.
ekly propane propane deliv
oomenson Co
plies steam toThe steam boiropane pilot. Tand this was
lers and the s9 FT, 1800 RPreduced systezones with a 238 GPM, 30
nic system is afull fire cycle
ilding throughused to propoow through ty manually lim
oom are 4”. Tme air handle.5” by the tim
and #2 fuel overy amounts
ommunity HoEly
Page 7
o a shell and tiler is a KewaTheoretically not importan
steam heat M. For summem. At the timpressure of 2FT, S/N
a lack of adeqe for cleaning.h the two proortion the flohe propane
miting the flow
here is a remrs. The hot w
me they get to
oil tank levels s and costs.
ospital y, MN
7 of 29
tube nee
y it nt
mer me of 22 psi
quate . The
opane ow
w
ote water o the
for

Preliminary Feasibility Report Version: Final Ely Bloomenson Community Hospital Date Modified: March 31, 2017 Ely, MN
WES ● Wilson Engineering Services, PC Page 8 of 29
Table 1 – Propane Fuel Deliveries
Date Gallons Price/Gal Cost7/17/2014 8,901 $1.3250 $11,794 10/9/2014 9,000 $1.3250 $11,925
11/13/2014 8,901 $1.3250 $11,794 12/3/2014 9,000 $1.3250 $11,925
12/29/2014 9,001 $1.3250 $11,926 1/26/2015 9,000 $1.3250 $11,925 2/24/2015 9,001 $1.3250 $11,926 3/13/2015 9,075 $1.3250 $12,024 4/20/2015 9,001 $1.3250 $11,926 5/26/2015 9,075 $1.3250 $12,024 10/7/2015 9,001 $0.9215 $8,294
11/19/2015 9,001 $0.9215 $8,294 12/22/2015 9,001 $0.9215 $8,294 1/13/2016 9,001 $0.9215 $8,294 2/3/2016 9,001 $0.9215 $8,294 3/1/2016 9,001 $0.9215 $8,294
3/30/2016 9,637 $0.9215 $8,881 5/5/2016 9,000 $0.9215 $8,294
Table 2 summarizes the propane and fuel oil usage for the past 2 heating seasons. Because so little fuel oil was used, and because it is considered a backup fuel, the fuel oil usage was converted to propane equivalent in order to simplify analysis, based on the efficiencies and heating values listed in Table 8.
Table 2 – Fuel Usage Summary
Heating Year
Starting Amount in Propane
Tank (gal)
Ending Amount in Propane
Tank (gal)
Propane Delivered
(gal)
Propane Used (gal)
Cost of Propane
Used
Weighted Unit Price
for Propane ($/gal)
#2 Fuel Oil
Used (gal)
Propane Equivalent of #2 Fuel Oil (gal)
Total Propane
and Propane
Equivalent Used (gal)
2014-2015 1,602 12,870 89,955 78,687 $104,260 $1.325 3,796 5,476 84,163 2015-2016 12,870 6,930 72,643 78,583 $76,961 $0.979 0 0 78,583
Average . $1.15 81,373 Note: Assumptions are listed in Table 8.
Daily mean temperature weather data from Ely Municipal Airport were obtained for the time period encompassed by the fuel usage data. Daily temperatures are used to calculate the heating degree days for each day of the year, which are then used to proportionally distribute the weekly fuel usage totals derived from the tank level records, to individual days in each week.
Figure 3 shows modeled daily average heat demand for heating seasons 2014-2015 and 2015-2016 (July-June), including propane and fuel oil usage. These models are based on the weekly tank level measurements, and use a HDD base temperature of 70°F.

Preliminary Feasibility Report Version: Final Ely Bloomenson Community Hospital Date Modified: March 31, 2017 Ely, MN
WES ● Wilson Engineering Services, PC Page 9 of 29
Figure 3 – Daily Average Demand for the Past 2 Heating Seasons
Note: Assumptions regarding system efficiencies are listed in Table 8. Values shown are daily average demands. During the course of a 24-hr period, it is anticipated that the hourly demand would fluctuate both above and below the values shown.
Figure 4 presents load duration curves (LDC) for FY 2014 and FY 2015. These charts are sorted to present the daily heating loads in order from largest to smallest, not the order in which they actually occurred in time. It is important to note how these curves can be used appropriately. The curves shown in Figure 4 present the daily average demand. Over the course of a 24 hour period the loads at each facility will vary above and below the daily averages. Thus, the load curves are useful for sizing a biomass boiler to ensure it will run efficiently and cover significant portions of the system demand, but they do not indicate the peak or minimum demands.
0.00.20.40.60.81.01.21.41.61.82.0
daily
ave
rage
dem
and
(mm
Btu/
hr)
2014-2015 2015-2016

Preliminary Feasibility Report Version: Final Ely Bloomenson Community Hospital Date Modified: March 31, 2017 Ely, MN
WES ● Wilson Engineering Services, PC Page 10 of 29
Figure 4 – Load Duration Curves
Note: Assumptions regarding system efficiencies are listed in Table 8. Values shown are daily average demands. During the course of a 24-hr period, it is anticipated that the hourly demand would fluctuate both above and below the values shown.
From Figure 4, it is apparent that the coldest day’s average heat demand is approximately 1.6 mmBtu/hr. Using the models and values previously discussed, WES estimates that the peak hourly demand for the facility is approximately 3.0-3.5 mmBtu/hr. It is important to remember that peak demands are only seen for an hour or two in a specific 24-hr period, on the coldest days of the year.
5.0 BIOMASS AVAILABILITY AND PRICE
Modern biomass combustion systems can efficiently and cleanly utilize a variety of fuels with a wide range of moisture content. Due to the variations in the potential fuels available in various locations, there are differing systems for each fuel type. Wood pellet systems are commonly limited to firing on pelletized fuel or dry wood chips with allowable moisture content (wet basis) typically in the range of 5-30%. Systems capable of utilizing green wood chips are typically designed for fuel with a moisture content of 20-50%. Some manufacturers offer equipment able to utilize pellets or green chips, although the control parameters and system options may need to be adjusted when targeting one of these fuels in order to maintain efficiency. Cordwood systems are typically designed to use cordwood with a moisture content of approximately 20% wet basis, which is what can be achieved by air drying. Some cordwood systems are able to also use wood pellets following a manual adjustment of the grates.
The options evaluated in this report would require an estimated annual use of up to 821 tons of wood chips assuming 40% moisture content wet basis, or 463 tons of wood pellets.
Table 3 compares the cost of delivered heat for wood and fossil fuel (propane). The propane cost shown is the average of the past 2 years.
0.00.20.40.60.81.01.21.41.61.82.0
1 31 61 91 121 151 181 211 241 271 301 331 361
daily
ave
rage
dem
and
(mm
Btu/
hr)
2014-2015 2015-2016

Preliminary Feasibility Report Version: Final Ely Bloomenson Community Hospital Date Modified: March 31, 2017 Ely, MN
WES ● Wilson Engineering Services, PC Page 11 of 29
Table 3 – Fuel Pricing and Cost per mmBtu
Technology, Unit Cost/Unit Input
mmBtu /Unit
Assumed Efficiency
Output mmBtu /Unit
Output Cost
/mmBtu Green Wood Chip1, ton $40 10 70% 7 $5.71 Dry Wood Chip2, ton $80 12 75% 9 $8.89 Wood Pellet3, ton $206 16.4 80% 13.1 $15.72 Propane (2-year average), gal $1.15 0.091 85% 0.078 $14.84 Propane (2018 estimate), gal $0.95 0.091 85% 0.078 $12.24 #2 Fuel Oil, gal $3.00 0.14 80% 0.11 $26.79 Note 1: Green wood chips are approximately 40-45% moisture content wet basis. Note 2: Dry wood chips are approximately 25-30% moisture wet basis. They are not commercially available in Ely. Cost for dry wood chips is estimated by WES as a fair market price. Note 3: Wood pellets are 6-8% moisture content wet basis. Price includes delivery by auger truck. Note 4: Table 8 contains the assumptions used to develop the above values.
5.1 PELLETS Wood pellets are typically delivered in bulk loads of 10-30 tons. Wood pellets can be delivered in a variety of ways, depending on the storage system at the facility, and the capabilities of local truckers. Options include:
• End dump tractor trailer • Walking floor tractor trailer • Grain truck or trailer with auger • Grain truck with pneumatic hose discharge (not available in MN) • Mulch blower truck (nearest is in Minneapolis)
Delivery by grain truck is often the most convenient, because the pellets can be discharged directly into the top of a silo. Auger trucks in this region generally have a maximum height capability of 24’. Deliveries by a pneumatic delivery truck would involve the driver attaching a hose to a tube near the base of the silo. This tube would be permanently attached to the silo and would run up to the top to discharge the pellets. The higher cost and/or lower capacity of grain trucks can make walking floor or end dump delivery slightly cheaper. These methods would require a conveyor system to carry the pellets up to the top of the silo. Due to space constraints at the facility, a pellet silo using auger delivery trucks is the storage and delivery method considered. Wood pellets would be stored in the silo and conveyed to the pellet boilers automatically via a flexible auger.
The nearest wood pellet plant that could supply the hospital is Great Lakes Renewable Energy, located in Hayward, WI. Bulk pricing at the gate is approximately $170/ton, and trucking costs are in the range of $4-$5 per loaded mile, depending on the delivery vehicle. If a silo was used to store pellets, the most appropriate delivery vehicle for this site would be a grain auger truck, which can carry up to 24 tons of pellets. The cost of this type of vehicle would be closer to $5 per loaded mile. Because Option 2 is designed with below-grade storage, it could receive deliveries from walking floor trailers. Option 3, which utilizes a silo, could only take deliveries from auger, pneumatic, or mulch blower trucks. A delivery cost of $5 per loaded mile is reflected in the pellet cost shown in Table 3.
5.2 WOOD CHIPS Sources of wood chips could be local loggers, regional wood products manufacturers, MN DNR, or the US Forest Service. Wood chip CHP (combined heat and power) plants in Virginia and Hibbing are the

Preliminary Feasibility Report Version: Final Ely Bloomenson Community Hospital Date Modified: March 31, 2017 Ely, MN
WES ● Wilson Engineering Services, PC Page 12 of 29
primary outlets for low value residuals. WES spoke with several local loggers and learned that there are a significant number of logging operations which are doing in-woods chipping. The in-woods chipping is done in conjunction with harvesting of saw timber or pulpwood. The general unofficial chip spec in the woods is a 2” whole tree chip, and these are for the most part delivered to the power plants in Virginia and Hibbing, or their wood yard in Mountain Iron, for a delivered cost of $30 to $40 per ton.
Wood chip moisture content and quality are important considerations when selecting a biomass boiler and fuel handling system. Some boilers require moisture contents of 30% (wet basis) or less and chip size of 1-1/2” or less, while others can tolerate wetter/larger chips. In addition to moisture content, ash content is another quality measure. Bark, leaves, and twigs all have a higher ash content than debarked roundwood. Paper and OSB mills use debarked roundwood chips as their primary feedstocks, and therefore these materials will command a higher price. Boilers which burn green chips are generally designed for larger scale installations, while the dry chip boilers are tailored to smaller facilities. The heating demand at EBCH is at the low end of the range covered by green chip boilers, and is ideally covered by equipment available for dried chips. However, dry chips are not available locally. Local loggers would most likely be able to supply “whole tree chips” which would be generated by in-woods chipping operations and would contain bark, sticks, needles, leaves, and the occasional oversized chip.
Boiler fuel quality is also affected by what equipment is used in chipping or grinding the feedstock. Chips are produced by equipment with knives which cleanly slice through wood. Options include drum or disc chippers. Hog fuel is produced by pulverizing wood using hammers or blunt force. Options include hammermills and tub grinders. Chips are preferred to grindings because chips are smoother and flow better. Hog fuel tends to be stringy and “fuzzy” which increases the chances of bridging. With the proper handling system, such as that proposed for Option 1, either fuel will work fine. The design of Option 2 is such that carefully screened chips (or pellets) are preferred.
Dried or partially dried chips are able to be used in many commercial pellet boilers, and represent a lower-cost fuel compared to wood pellets. Compared to the 2” whole tree chips being produced by in-woods chippers, these chips must be sized less than 1.5” and oversize pieces must be removed. These chips can be commercially produced by screening chips and then drying chips using a rotary dryer heated by a wood chip furnace. In some cases, facility owners themselves produce dry chips from dry residuals and use them in their own boilers. Rather than using a dryer, 30% moisture or less can be achieved if logs are air dried for a year prior to being chipped. There is the potential that a local logging or tree service company could be willing to stage logs and chip them, however, no potential suppliers have been identified at this time. Delivery of screened dry chips into a silo can be performed by a mulch blower truck. Although no such trucks exist in the local area, if this option was available, it would significantly reduce the capital cost for a dry chip system by allowing the use of an above grade silo rather than a below grade storage bunker.
Unacceptable feedstocks for wood chip boilers would include contaminated C&D waste, treated lumber, painted lumber, non-wood fuels such as coal or tires, or garbage of any kind. These fuels have the potential to generate significantly elevated emissions, and may damage the combustion unit or boiler.
6.0 EVALUATED BIOMASS SYSTEMS
Three biomass fueled hot water boiler systems are evaluated for Ely Bloomenson Community Hospital. These biomass system options were sized and evaluated using the analysis in Section 4. The options include the following equipment:

Preliminary Feasibility Report Version: Final Ely Bloomenson Community Hospital Date Modified: March 31, 2017 Ely, MN
WES ● Wilson Engineering Services, PC Page 13 of 29
Option 1 – Wood Chip Boiler: A wood chip hot water boiler, rated 1.7 mmBtu/hr, would be installed in a new boiler plant located between the ambulance garage and the propane tank. An automatic fuel reclaim and feeding system, and a 1,700 gallon thermal storage tank(s) would be installed with the boiler. The wood chip boiler would tie into the hospital’s heating system in the existing central boiler room.
Option 2 – Wood Pellet and Dry Chip Boiler: One wood pellet hot water boiler, rated 1.7 mmBtu/hr, would be installed in a new boiler plant located between the ambulance garage and the propane tank. An automatic fuel reclaim and feeding system, and a 1,300 gallon thermal storage tank(s) would be installed with the boiler. The fuel handling system and boiler would be capable of utilizing dry chips or pellets for maximum fuel flexibility. The pellet boiler would tie into the hospital’s heating system in the existing central boiler room.
Option 3 – Wood Pellet Boiler: One wood pellet hot water boiler, rated 1.7 mmBtu/hr, would be installed in a new boiler plant located adjacent to the hospital. A 40 ton pellet silo with a flexible auger would be installed to provide automatic fuel feed to the boiler. A 1,300 gallon thermal storage tank(s) would also be installed with the boiler. The pellet boiler would tie into the hospital’s heating system in the existing central boiler room.
6.1 OPTION 1 – WOOD CHIP BOILER SYSTEM A new boiler room and fuel storage building would be built adjacent to the ambulance garage. A 1.7 mmBtu/hr boiler would be installed to burn woodchips which would be automatically fed from a fuel storage bunker. The wood chip fuel for this boiler would be wood chips sized 2.5” minus, with a moisture content of approximately 40% wet basis.
The boiler would be used to heat a 1,700 gallon hot water thermal storage tank(s). The thermal storage tank(s) would be typically maintained around 200°F. Using a mixing valve and a variable speed injection pump, hot water from the thermal storage would be blended with cooler return water from the heating distribution system to maintain a distribution supply water temperature based on an outside reset schedule. Storing water at temperatures that are higher than distributed allows maximization of the potential storage in the fixed tank volume and allows coverage of temporary peaks above wood boiler capacity.
A new 1,300 ft2 building would be constructed as a boiler room and fuel bunker. The fuel bunker would be sized to hold approximately 50 tons of wood chips. Table 4 shows the approximate amount of time that a full bunker would last at different boiler firing rates. The fuel storage is designed to be emptied one side at a time to allow space for a new delivery on one side before the other side is exhausted. A traveling auger or rake system in the fuel bunker would automatically pull wood chips from the floor of the bunker onto a conveyor system. The conveyors will move the chips through a screening system to remove oversize chips, and then into a metering bin. Wood chips from the metering bin will be fed into the combustion unit to maintain the required boiler output.
Table 4 – Option 1 Fuel Storage Capacity
Firing Rate Days of Fuel Supply
Option 1 (Green Chips)
Summer (0.3 mmBtu/hr) 47 Winter (1.7 mmBtu/hr) 8
Note: Assumptions regarding system efficiencies and heating values are listed in Table 8.

Preliminary Feasibility Report Version: Final Ely Bloomenson Community Hospital Date Modified: March 31, 2017 Ely, MN
WES ● Wilson Engineering Services, PC Page 14 of 29
Because the chip boiler is sized smaller than the peak load of the hospital, it will require fossil fuel boilers for peaking and backup. The existing boiler plant has an excellent size range of boilers and can fulfill this function.
Appendix A includes a site plan, conceptual boiler plant layout, and schematics for the system.
Wood chip fueled biomass boilers operate most efficiently between 25% and 100% of their rated heating output. The 1.7 mmBtu/hr wood chip boiler would have an efficient operating range of 425,000 Btu/hr to 1.7 mmBtu/hr. Coverage for the biomass boiler is evaluated in both heating seasons for which data is available. Figure 5 shows the chip boiler covering approximately 88% of the 2014-2015 load, while Figure 6 shows the chip boiler covering approximately 86% of the 2015-2016 load.
Figure 5 – 2014-2015 LDC and Coverage of 1.7 mmBtu/hr Chip Boiler
Note: Assumptions regarding system efficiencies are listed in Table 8. Values shown are daily average demands. During the course of a 24-hr period, it is anticipated that the hourly demand would fluctuate both above and below the values shown.
0.00.20.40.60.81.01.21.41.61.82.0
1 31 61 91 121 151 181 211 241 271 301 331 361
daily
ave
rage
dem
and
(mm
Btu/
hr)
Coverage of 1.7 mmBtu/hr Wood Chip Boiler 2014-2015 LDC

Preliminary Feasibility Report Version: Final Ely Bloomenson Community Hospital Date Modified: March 31, 2017 Ely, MN
WES ● Wilson Engineering Services, PC Page 15 of 29
Figure 6 – 2015-2016 LDC and Coverage of 1.7 mmBtu/hr Chip Boiler
Note: Assumptions regarding system efficiencies are listed in Table 8. Values shown are daily average demands. During the course of a 24-hr period, it is anticipated that the hourly demand would fluctuate both above and below the values shown.
A value of 85% coverage of the load by the chip boiler is estimated for the economic analysis in an average year. Exact sizing of the boiler would depend on the vendor selected, and their product offerings.
6.2 OPTION 2 – WOOD PELLET AND DRY CHIP BOILER SYSTEM A new boiler room and fuel storage building would be built adjacent to the ambulance garage. A pellet boiler sized at 1.7 mmBtu/hr would be installed to burn pellets which would be automatically fed from a fuel storage bunker. The boiler and fuel storage would be set up to alternatively burn dry wood chips sized 1.5” minus.
The boiler would be used to heat a 1,300 gallon hot water thermal storage tank(s). The thermal storage tank(s) would be typically maintained around 200°F. Using a mixing valve and a variable speed injection pump, hot water from the thermal storage would be blended with cooler return water from the heating distribution system to maintain a distribution supply water temperature based on an outside reset schedule. Using the mixing valve and storing water at temperatures that are higher than distributed allows maximization of the potential storage in the fixed tank volume and allows coverage of temporary peaks above wood boiler capacity.
A new 830 ft2 building would be constructed as a boiler room and fuel bunker. The fuel bunker would be sized to hold approximately 68 tons of pellets or 25 tons of dry wood chips. Table 5 shows the approximate amount of time that a full bunker would last at different boiler firing rates for each fuel type. The fuel storage is designed to be emptied one side at a time to allow space for a new delivery on one side before the other side is exhausted. Depending on truck capacity, a truck carrying dry chips may have to partially unload on one side and then move over to empty the remainder, due to the low density of dry chips. Two spring agitators in the bottom of the fuel bunker would automatically pull pellets or chips from the bottom of the bunker into an auger system. The augers would feed the fuel into the boiler to maintain the required boiler output. Because pellets are a manufactured product, they are a
0.00.20.40.60.81.01.21.41.61.82.0
1 31 61 91 121 151 181 211 241 271 301 331 361
daily
ave
rage
dem
and
(mm
Btu/
hr)
Coverage of 1.7 mmBtu/hr Wood Chip Boiler 2015-2016 LDC

Preliminary Feasibility Report Version: Final Ely Bloomenson Community Hospital Date Modified: March 31, 2017 Ely, MN
WES ● Wilson Engineering Services, PC Page 16 of 29
consistent size and shape, and can easily be handled by small diameter augers. For this reason, screening equipment will not be installed in the fuel handing system. If the system is fired on dry wood chips, it will be essential that the fuel be of a consistent size and quality to prevent any bridging or jams.
Table 5 – Option 2 Fuel Storage Capacity
Firing Rate Days of Fuel Supply
Option 2 (Pellets)
Option 2 (Dry Chips)
Summer (0.3 mmBtu/hr) 123 32 Winter (1.7 mmBtu/hr) 22 6
Note: Assumptions regarding system efficiencies and heating values are listed in Table 8.
Pellet fuel is able to be stored in silos with sloping bottoms; however, dry wood chips cannot be stored in this way. A pellet-only system could utilize a smaller building, a less costly boiler, and a simple silo, but it would sacrifice fuel flexibility. Based on Table 3, pellets are more costly per Btu than propane currently, although that may change in the future. Provided that a supplier of screened chips can be located, a system set up for pellets or dry chips provides a cost effective alternative to the green chip boiler presented in Option 1. A pellet-only system is proposed in Option 3.
The boiler proposed in this option is representative of equipment which is able to be supplied from several U.S. manufacturers. Different manufacturers have different fuel specifications, but all generally require pellets or screened chips in order to prevent jams. In terms of moisture content, some manufacturers allow for screened green chips, while others require the chips to be no more than 30% moisture content wet basis. If green chips are used, the boiler output will be derated due to the energy required to evaporate the extra water. Depending on the available fuel options, however, this may be an acceptable tradeoff.
Because the rated output of the pellet boiler is smaller than the peak load of the hospital, it will require fossil fuel boilers for peaking and backup. The existing boiler plant has an excellent size range of boilers and can fulfill this function.
Appendix A includes a site plan, conceptual boiler plant layout, and schematics for the system.
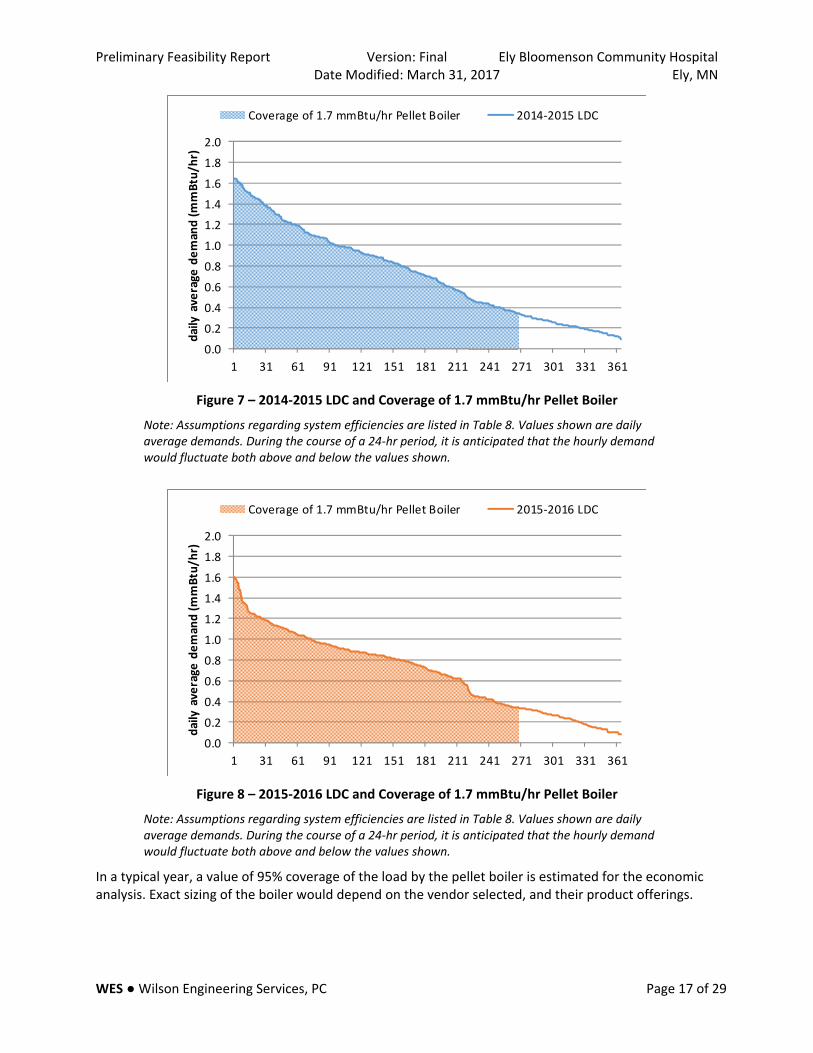
Wood pellet fueled biomass boilers operate most efficiently between 20% and 100% of their rated heating output. The pellet boiler would have an efficient operating range of 340,000 Btu/hr to 1.7 mmBtu/hr. Coverage for the biomass boiler is evaluated in both heating seasons for which data is available. Figure 7 shows the pellet boiler covering approximately 92% of the 2014-2015 load, while Figure 8 shows the pellet boiler covering approximately 91% of the 2015-2016 load.
Preliminary Feasibility Report Version: Final Ely Bloomenson Community Hospital Date Modified: March 31, 2017 Ely, MN
WES ● Wilson Engineering Services, PC Page 17 of 29
Figure 7 – 2014-2015 LDC and Coverage of 1.7 mmBtu/hr Pellet Boiler
Note: Assumptions regarding system efficiencies are listed in Table 8. Values shown are daily average demands. During the course of a 24-hr period, it is anticipated that the hourly demand would fluctuate both above and below the values shown.
Figure 8 – 2015-2016 LDC and Coverage of 1.7 mmBtu/hr Pellet Boiler
Note: Assumptions regarding system efficiencies are listed in Table 8. Values shown are daily average demands. During the course of a 24-hr period, it is anticipated that the hourly demand would fluctuate both above and below the values shown.
In a typical year, a value of 95% coverage of the load by the pellet boiler is estimated for the economic analysis. Exact sizing of the boiler would depend on the vendor selected, and their product offerings.
0.00.20.40.60.81.01.21.41.61.82.0
1 31 61 91 121 151 181 211 241 271 301 331 361
daily
ave
rage
dem
and
(mm
Btu/
hr)
Coverage of 1.7 mmBtu/hr Pellet Boiler 2014-2015 LDC
0.00.20.40.60.81.01.21.41.61.82.0
1 31 61 91 121 151 181 211 241 271 301 331 361
daily
ave
rage
dem
and
(mm
Btu/
hr)
Coverage of 1.7 mmBtu/hr Pellet Boiler 2015-2016 LDC

Preliminary Feasibility Report Version: Final Ely Bloomenson Community Hospital Date Modified: March 31, 2017 Ely, MN
WES ● Wilson Engineering Services, PC Page 18 of 29
6.3 OPTION 3 – WOOD PELLET BOILER SYSTEM A new boiler room and fuel silo would be at the northwest corner of the hospital. A pellet boiler sized at 1.7 mmBtu/hr would be installed to burn pellets which would be automatically fed from the silo.
The boiler would be used to heat a 1,300 gallon hot water thermal storage tank(s). The thermal storage tank(s) would be typically maintained around 200°F. Using a mixing valve and a variable speed injection pump, hot water from the thermal storage would be blended with cooler return water from the heating distribution system to maintain a distribution supply water temperature based on an outside reset schedule. Using the mixing valve and storing water at temperatures that are higher than distributed allows maximization of the potential storage in the fixed tank volume and allows coverage of temporary peaks above wood boiler capacity.
A new 400 ft2 building would be constructed as a boiler room. Adjacent to the boiler room would be a silo capable of holding 40 tons of wood pellets. Table 6 shows the approximate amount of time that a full bunker would last at different boiler firing rates for each fuel type. A flexible auger would feed the fuel into the boiler to maintain the required boiler output.
Table 6 – Option 3 Fuel Storage Capacity
Firing Rate
Days of Fuel Supply
Option 3 (Pellets)
Summer (0.3 mmBtu/hr) 73 Winter (1.7 mmBtu/hr) 13
Note: Assumptions regarding system efficiencies and heating values are listed in Table 8.
Based on Table 3, pellets are more costly per Btu than propane currently, although that may change in the future. This option would not be economically viable unless the prices of propane and fuel oil were to rise compared to the price of pellets.
Because the rated output of the pellet boiler is smaller than the peak load of the hospital, it will require fossil fuel boilers for peaking and backup. The existing boiler plant has an excellent size range of boilers and can fulfill this function.
Appendix A includes a site plan, conceptual boiler plant layout, and schematics for the system.
Wood pellet fueled biomass boilers operate most efficiently between 20% and 100% of their rated heating output. The pellet boiler would have an efficient operating range of 340,000 Btu/hr to 1.7 mmBtu/hr. Coverage for the biomass boiler is evaluated in both heating seasons for which data is available, and is the same as that shown in Figure 7 and Figure 8 for Option 2. In a typical year, a value of 95% coverage of the load by the pellet boiler is estimated for the economic analysis. Exact sizing of the boiler would depend on the vendor selected, and their product offerings.
6.4 UNDERGROUND PIPING The new boiler plant for Options 1 and 2 would be connected to the hospital via underground PEX piping. The PEX piping is pre-insulated with polyurethane foam and is encased in a protective but flexible plastic jacket. The pipe comes in continuous rolls up to 600 feet long, which eliminates the need for underground joints in almost all cases. To allow for vehicle traffic, it is normally buried 2 feet below the ground surface. Because water is continuously circulating, there is no risk of freezing. The relatively shallow depth of burial can avoid the need for expensive ledge removal, which is a concern in Ely.
Preliminary Feasibility Report Version: Final Ely Bloomenson Community Hospital Date Modified: March 31, 2017 Ely, MN
WES ● Wilson Engineering Services, PC Page 19 of 29
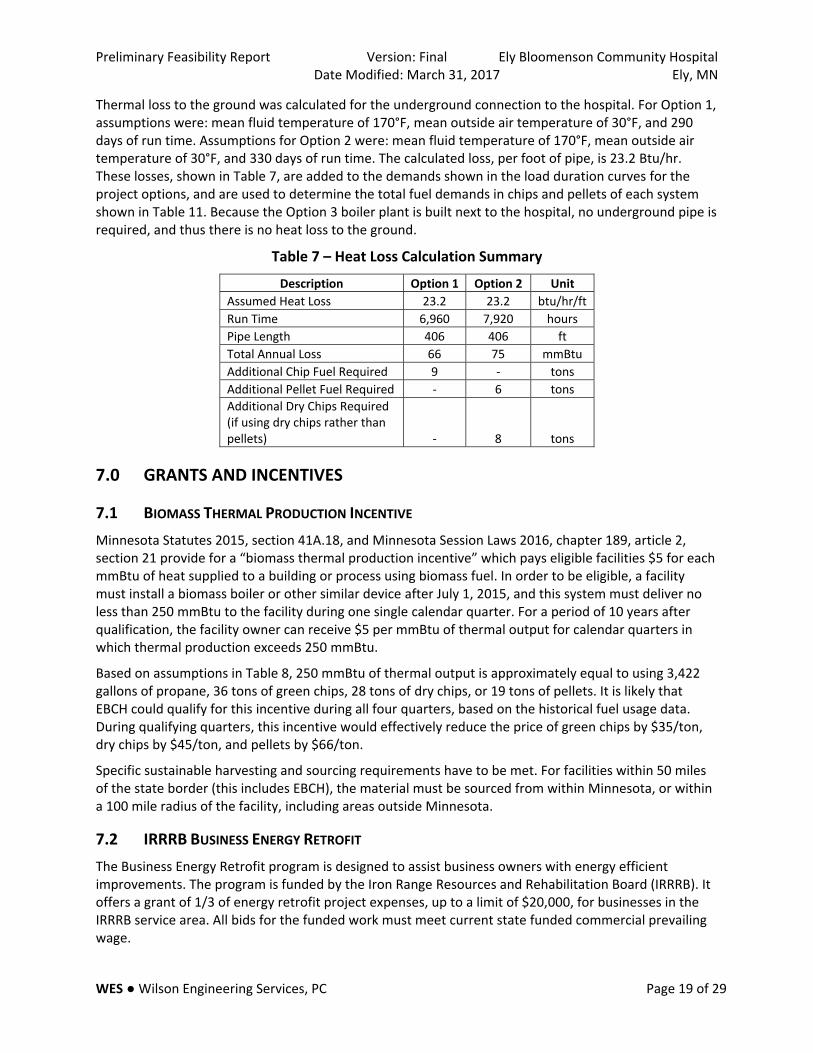
Thermal loss to the ground was calculated for the underground connection to the hospital. For Option 1, assumptions were: mean fluid temperature of 170°F, mean outside air temperature of 30°F, and 290 days of run time. Assumptions for Option 2 were: mean fluid temperature of 170°F, mean outside air temperature of 30°F, and 330 days of run time. The calculated loss, per foot of pipe, is 23.2 Btu/hr. These losses, shown in Table 7, are added to the demands shown in the load duration curves for the project options, and are used to determine the total fuel demands in chips and pellets of each system shown in Table 11. Because the Option 3 boiler plant is built next to the hospital, no underground pipe is required, and thus there is no heat loss to the ground.
Table 7 – Heat Loss Calculation Summary Description Option 1 Option 2 Unit
Assumed Heat Loss 23.2 23.2 btu/hr/ft Run Time 6,960 7,920 hours Pipe Length 406 406 ft Total Annual Loss 66 75 mmBtu Additional Chip Fuel Required 9 - tons Additional Pellet Fuel Required - 6 tons Additional Dry Chips Required(if using dry chips rather than pellets) - 8 tons
7.0 GRANTS AND INCENTIVES
7.1 BIOMASS THERMAL PRODUCTION INCENTIVE Minnesota Statutes 2015, section 41A.18, and Minnesota Session Laws 2016, chapter 189, article 2, section 21 provide for a “biomass thermal production incentive” which pays eligible facilities $5 for each mmBtu of heat supplied to a building or process using biomass fuel. In order to be eligible, a facility must install a biomass boiler or other similar device after July 1, 2015, and this system must deliver no less than 250 mmBtu to the facility during one single calendar quarter. For a period of 10 years after qualification, the facility owner can receive $5 per mmBtu of thermal output for calendar quarters in which thermal production exceeds 250 mmBtu.
Based on assumptions in Table 8, 250 mmBtu of thermal output is approximately equal to using 3,422 gallons of propane, 36 tons of green chips, 28 tons of dry chips, or 19 tons of pellets. It is likely that EBCH could qualify for this incentive during all four quarters, based on the historical fuel usage data. During qualifying quarters, this incentive would effectively reduce the price of green chips by $35/ton, dry chips by $45/ton, and pellets by $66/ton.
Specific sustainable harvesting and sourcing requirements have to be met. For facilities within 50 miles of the state border (this includes EBCH), the material must be sourced from within Minnesota, or within a 100 mile radius of the facility, including areas outside Minnesota.
7.2 IRRRB BUSINESS ENERGY RETROFIT The Business Energy Retrofit program is designed to assist business owners with energy efficient improvements. The program is funded by the Iron Range Resources and Rehabilitation Board (IRRRB). It offers a grant of 1/3 of energy retrofit project expenses, up to a limit of $20,000, for businesses in the IRRRB service area. All bids for the funded work must meet current state funded commercial prevailing wage.

Preliminary Feasibility Report Version: Final Ely Bloomenson Community Hospital Date Modified: March 31, 2017 Ely, MN
WES ● Wilson Engineering Services, PC Page 20 of 29
7.3 RURAL ENERGY FOR AMERICA PROGRAM (REAP) REAP is administered by the USDA and provides grant and/or loan funding to for-profit businesses for energy projects in rural areas (Ely is a qualifying area). Grant funding of up to $500,000 per project can be used to cover up to 25% of total project costs. Because EBCH is a nonprofit corporation, it would not qualify directly for this grant, but the potential exists for a creative ownership model for a biomass plant which could allow the project to qualify for this program.
7.4 COMMUNITY FACILITIES DIRECT LOAN AND GRANT The program, administered by the USDA, provides funding in the form of loans and grants to develop community facilities in rural communities. The program is open to public bodies, and community-based nonprofit corporations. The program is primarily geared towards loans, which can have terms of up to 40 years. Grant funding awards are determined with preference for smaller communities with lower household income relative to state medians.
7.5 PACE (PROPERTY ASSESSED CLEAN ENERGY) PACE is available in specific cities and counties in Minnesota, including Ely. This program provides funding for clean energy projects through increased property tax assessments on the property receiving the upgrades, for a term of 5-20 years. This is similar to a loan, except the amount does not appear “on the books” since the property tax is considered an operating cost. The host entity obtains financing on behalf of the project owner to provide the upfront funding, and repays the bond via the increased property t axes. For projects of the size being considered for EBCH, the funding would be equivalent to a loan with an interest rate of approximately 6-7%. Funding through this vehicle can be obtained either before or after a project is implemented. If funding is obtained prior to a project, then project must adhere to Davis-Bacon wage rates.
7.6 IRRRB DEVELOPMENT INFRASTRUCTURE Another IRRRB program known as Development Infrastructure is a grant program for funding community development projects up to 50%. If future development west of the hospital is a possibility, then this program could be applicable, because the biomass plant could become a low-cost source of heat for other commercial and industrial buildings which would be constructed. IRRRB was contacted, and the recommendation was that EBCH should meet with IRRRB’s head of this program to discuss the project if they are interested in pursuing it.
7.7 DEED The Minnesota Department of Employment and Economic Development (DEED) administers numerous tax incentive, loan, and grant programs. Especially if EBCH’s project has the potential to affect logging jobs or provide low cost heat to other local businesses, then there may be an opportunity for funding. It is recommended that a meeting be scheduled with DEED to discuss the project if the EBCH is interested in pursuing the project.
8.0 BIOMASS SYSTEM ANALYSIS
Table 8 lists the values and assumptions used in the analysis.

Preliminary Feasibility Report Version: Final Ely Bloomenson Community Hospital Date Modified: March 31, 2017 Ely, MN
WES ● Wilson Engineering Services, PC Page 21 of 29
Table 8 – Values and Assumptions Assumption Value Unit Source
Propane HHV 0.091333 mmBtu/gal WES Assumption Propane Cost (2 year average) $1.15 $/gal EBCH Propane Cost (2018 estimate) $0.95 $/gal EBCH Propane Boiler Efficiency 85% percent WES Assumption #2 Fuel OIl HHV 0.14 mmBtu/gal WES Assumption #2 Fuel Oil Cost $3.00 $/gal WES Assumption #2 Fuel Oil Boiler Efficiency 80% percent Nameplate Wood Chip HHV (40% moisture wet basis) 10 mmBtu/ton WES Assumption Wood Chip Cost $40 $/ton WES Assumption Wood Chip Boiler Efficiency 70% Percent WES Assumption Wood Chip Density 0.01 tons/ft3 WES Assumption Dry Wood Chip HHV (30% moisture wet basis) 12 mmBtu/ton WES Assumption Dry Wood Chip Cost $80 $/ton WES Assumption Dry Wood Chip Boiler Efficiency 75% Percent WES Assumption Wood Pellet HHV 16.4 mmBtu/ton WES Assumption Wood Pellet Cost $206 $/ton WES Assumption Wood Pellet Boiler Efficiency 80% Percent WES Assumption HDD Base Temp 70 ˚F WES Assumption Electric Cost $0.10 $/kWh EBCH Labor Cost (at Biomass Plant) $30 $/hr WES Assumption CO2 emitted during combustion of Propane 62.87 kg/mmBtu EPA CH4 emitted during combustion of Propane 0.003 kg/mmBtu EPA N2O emitted during combustion of Propane 0.0006 kg/mmBtu EPA CO2 emitted due to use of Electricity (includes line losses) 3.32 kg/kWh EPA CH4 emitted due to use of Electricity (includes line losses) 0.0000644 kg/kWh EPA N2O emitted due to use of Electricity (includes line losses) 0.0000566 kg/kWh EPA CH4 100-year Global Warming Potential 25 * CO2 IPCC N2O 100-year Global Warming Potential 298 * CO2 IPCC
8.1 CAPITAL COST ESTIMATES AND OPERATING COST SAVINGS Estimated capital costs for each option are listed in Table 9.
Table 9 – Capital Cost Estimate Summary
Option Estimated Capital Cost
1 – Chip Boiler $1,189,240 2 – Pellet and Dry Chip Boiler $959,365 3 – Pellet Boiler $519,500
Installed costs for the new systems include the combustion unit and hot water boilers, new boiler building, automatic fuel handling, underground hot water piping, and interconnection with the main boiler room. A detailed breakdown of capital costs for each option is provided in Appendix B.
Table 10 gives a breakdown of estimated operating and maintenance costs for each option. During the heating season, Option 1 is estimated to require an average of 45 minutes of maintenance per day,

Preliminary Feasibility Report Version: Final Ely Bloomenson Community Hospital Date Modified: March 31, 2017 Ely, MN
WES ● Wilson Engineering Services, PC Page 22 of 29
Option 2 is estimated to require an average of 15 minutes per day, and Option 3 is estimated to require an average of 12 minutes per day. This daily time estimate includes the annual tube cleaning, which can be done by facility staff, and would alternatively cost $4,000-$5,000 if done by the boiler manufacturer.
Table 10 – Estimated Operating and Maintenance Costs
Option Electric Usage
Maintenance / Wear Parts
Staff Time
Total O&M Cost
1 – Chip Boiler $3,480 $1,000 $6,525 $11,005 2 – Pellet and Dry Chip Boiler $2,376 $400 $2,475 $5,251 3 – Pellet Boiler $1,584 $200 $1,980 $3,764
Note: No cost is included for ash disposal as this is a valuable soil amendment.
A proposed system fuel use profile is provided in Table 11 showing the estimated annual fuel use for each option compared to the existing fossil fuel system.
Table 11 – Proposed System Fuel Use Profile
Option
Current Annual Fuel Use
Annual Fuel Use with Proposed Biomass System
Propane and Propane
Equivalent (gal)
Biomass Demand Coverage
Estimated Biomass
Use (tons)
Estimated Propane Use with Biomass System (gal)
1 – Chip Boiler 81,373 85% 776 12,206 2 – Pellet and Dry Chip Boiler using pellets 81,373 95% 463 4,069 2 – Pellet and Dry Chip Boiler using dry chips1 81,373 95% 675 4,069 3 – Pellet Boiler 81,373 95% 457 4,069
Note 1: Usage of dry chips is shown for comparison purposes only, as dry chips are not available at this time. Note 2: Table 8 contains the assumptions used to develop the above values.
Table 12 provides a comparison of fuel costs and operating costs for the options.
Table 12 – Fuel and Operating Cost Comparison
Option
Current Annual
Fuel Cost
Estimated Annual Costs with Proposed Biomass
System
Estimated First Year
Operational Savings
Thermal Production Incentive
Estimated Net Cash
Flow Propane Cost
Biomass Cost
Propane Cost
O&M Increase
1 – Chip Boiler $93,756 $31,058 $14,063 $11,005 $37,629 $27,176 $64,805 2 – Pellet and Dry Chip Boiler using pellets $93,756 $95,516 $4,688 $5,251 ($11,698) $30,380 $18,681 2 – Pellet and Dry Chip Boiler using dry chips1 $93,756 $54,009 $4,688 $5,251 $29,809 $30,380 $60,189 3 – Pellet Boiler $93,756 $94,343 $4,688 $3,764 ($9,039) $30,007 $20,968
Note 1: Usage of dry chips is shown for comparison purposes only, as dry chips are not available at this time. Note 2: Table 8 contains the assumptions used to develop the above values.
A summary of the estimated capital costs and payback is provided in Table 13. This table also evaluates the options with an assumed 25% grant.

Preliminary Feasibility Report Version: Final Ely Bloomenson Community Hospital Date Modified: March 31, 2017 Ely, MN
WES ● Wilson Engineering Services, PC Page 23 of 29
Table 13 – Cost and Payback Analysis
Option Estimated
Capital Cost
Assumed Grant
Funding
Financed Amount
Simple Payback Period2 (years)
Net Present Value
(25 years) 1 – Chip Boiler $1,189,240 $0 $1,189,240 24 $167,436 2 – Pellet and Dry Chip Boiler using pellets $959,365 $0 $959,365 - ($706,724) 2 – Pellet and Dry Chip Boiler using dry chips1 $959,365 $0 $959,365 22 $261,904 3 – Pellet Boiler $519,500 $0 $519,500 - ($209,893) 1 – Chip Boiler $1,189,240 $297,310 $891,930 16 $464,746 2 – Pellet and Dry Chip Boiler using pellets $959,365 $239,841 $719,524 - ($466,883) 2 – Pellet and Dry Chip Boiler using dry chips1 $959,365 $239,841 $719,524 14 $501,745 3 – Pellet Boiler $519,500 $129,875 $389,625 - ($80,018)
Note 1: Usage of dry chips is shown for comparison purposes only, as dry chips are not locally available at this time. Note 2: Simple payback is calculated taking into account the assumption that thermal production incentive payments end after 10 years.
Detailed financial analyses were generated for all options and are included in Appendix C.
9.0 EMISSIONS, PERMITTING, AND LICENSING
9.1 PARTICULATE MATTER EMISSIONS All fuel combustion equipment emits some level of particulate matter from the combustion process. For all fossil fuels and renewable fuels, properly tuned systems are critical to ensure optimal conversion efficiencies and minimal emissions. Modern biomass boilers utilize oxygen sensors and variable speed drives to optimize the combustion process with the proper air/fuel mixture. This results in high combustion efficiencies and low emissions, and this section compares particulate matter emission rates for various fuels and equipment.
Note that in this section, the term lb/mmBtu refers to pounds of a certain pollutant emitted in the flue gas per million Btu of fuel (HHV) input. Based on the assumed efficiencies in Table 8, the wood chip boiler proposed in Option 1 would have a maximum fuel input rate of 2.4 mmBtu/hr and the pellet boiler proposed in Options 2 and 3 would have a maximum fuel input rate of 2.1 mmBtu/hr.
Minnesota Administrative Rules section 7011.0550 Table II sets the maximum particulate emissions from a boiler at 0.4 lb/mmBtu. This emission requirement can be met by modern wood boilers. Visually, the flue gas of a modern wood boiler would exhibit no opacity.
The EPA publishes emissions factors for a wide range of fuel burning devices in its publication AP-42. Table 14 presents these emissions factors along with the expected emissions factors for wood boilers based on stack test data obtained by WES.

Preliminary Feasibility Report Version: Final Ely Bloomenson Community Hospital Date Modified: March 31, 2017 Ely, MN
WES ● Wilson Engineering Services, PC Page 24 of 29
Table 14 – Emissions Factors for PM
Fuel and Source PM Emissions Unit
Residential Fireplace1 2.01 lb/mmBtu Residential Wood Stove2 1.12 lb/mmBtu Wood Chip Boiler3 0.08 – 0.15 lb/mmBtu Wood Pellet Boiler3 0.05 – 0.15 lb/mmBtu #2 Fuel Oil Boiler4 0.014 lb/mmBtu Propane Boiler5 0.008 lb/mmBtu
Note 1: EPA AP-42, PM10 value is 34.6 lb/dry ton, conversion based on 17.2 mmBtu/dry ton Note 2: EPA AP-42, EPA Phase II noncatalytic, PM10 value is 14.6 lb/ton, conversion based on 13.0 mmBtu/ton Note 3: Values are representative of independent lab testing of boilers comparable to the ones in the proposed options Note 4: EPA AP-42, boiler < 100 mmBtu/hr Note 5: EPA AP-42
None of the options include an Electrostatic Precipitator (ESP) for particulate emission control, because it is not required for boilers in this size range. However, an ESP could be added if there are concerns or perceived concerns about particulate emissions, especially near the hospital. Adding an ESP to any of the options would add about $150,000 to the capital cost and would result in particulate emissions at or below 0.03 lb/mmBtu (guaranteed by ESP supplier).
9.2 GASEOUS EMISSIONS Besides PM, other pollutants from fuel combustion include VOC, NOX (NO and NO2), SOX, and CO. Ozone (O3) is a byproduct of NOX and VOC emissions. Table 15 presents emissions factors for the gaseous pollutants mentioned.
Table 15 – Emissions Factors for Gaseous Pollutants
Fuel and Source Emission Factors (lbs/mmBtu) VOC NOx SOx CO
Wood Pellet Boiler1 0.004 0.140 0.001 0.150 Wood Chip Boiler1 0.004 0.180 0.002 0.150 #2 Fuel Oil Boiler2 0.004 0.144 0.207 0.036 Propane Boiler3 0.005 0.142 0.0002 0.082 Natural Gas Boiler4 0.005 0.098 0.0001 0.082
Note 1: Wood chip and wood pellet values are obtained from stack test results. Note 2: Oil factors are taken from AP-42 for boilers <100 mmBtu/hr, using values of 0.2% sulfur and HHV of 0.139 mmBtu/gal Note 3: Propane factors are taken from AP-42, S content of 0.2 g/100ft3 Note 4: Natural gas values taken from AP-42 for boilers <100 mmBtu/hr, and EIA listed values from IPCC for Industry
Based on this table, a wood boiler would be comparable to a propane boiler in terms of VOC and NOX. The elevated level of SOX is due to naturally occurring sulfur in the wood, and can vary regionally. While SOX emissions for a wood boiler are an order of magnitude larger than for propane, they are two orders of magnitude smaller than for #2 fuel oil.
Preliminary Feasibility Report Version: Final Ely Bloomenson Community Hospital Date Modified: March 31, 2017 Ely, MN
WES ● Wilson Engineering Services, PC Page 25 of 29
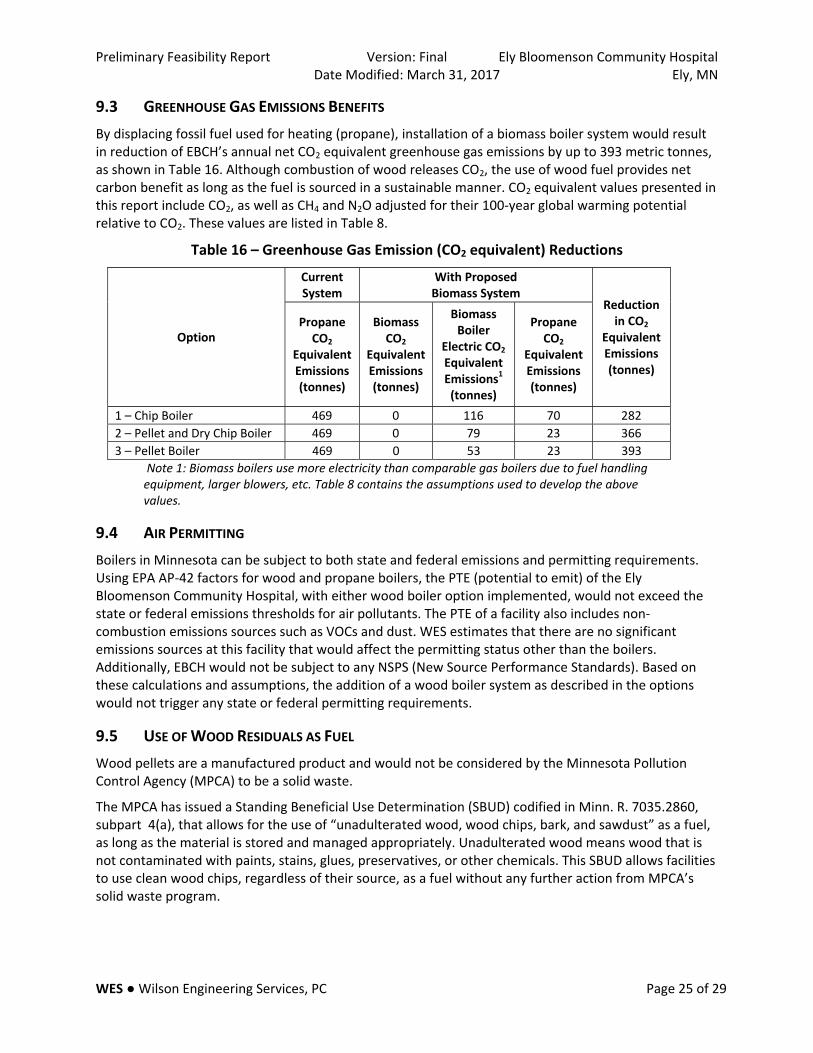
9.3 GREENHOUSE GAS EMISSIONS BENEFITS By displacing fossil fuel used for heating (propane), installation of a biomass boiler system would result in reduction of EBCH’s annual net CO2 equivalent greenhouse gas emissions by up to 393 metric tonnes, as shown in Table 16. Although combustion of wood releases CO2, the use of wood fuel provides net carbon benefit as long as the fuel is sourced in a sustainable manner. CO2 equivalent values presented in this report include CO2, as well as CH4 and N2O adjusted for their 100-year global warming potential relative to CO2. These values are listed in Table 8.
Table 16 – Greenhouse Gas Emission (CO2 equivalent) Reductions
Option
Current System
With Proposed Biomass System
Reduction in CO2
Equivalent Emissions (tonnes)
Propane CO2
Equivalent Emissions (tonnes)
Biomass CO2
Equivalent Emissions (tonnes)
Biomass Boiler
Electric CO2 Equivalent Emissions1
(tonnes)
Propane CO2
Equivalent Emissions (tonnes)
1 – Chip Boiler 469 0 116 70 282 2 – Pellet and Dry Chip Boiler 469 0 79 23 366 3 – Pellet Boiler 469 0 53 23 393
Note 1: Biomass boilers use more electricity than comparable gas boilers due to fuel handling equipment, larger blowers, etc. Table 8 contains the assumptions used to develop the above values.
9.4 AIR PERMITTING Boilers in Minnesota can be subject to both state and federal emissions and permitting requirements. Using EPA AP-42 factors for wood and propane boilers, the PTE (potential to emit) of the Ely Bloomenson Community Hospital, with either wood boiler option implemented, would not exceed the state or federal emissions thresholds for air pollutants. The PTE of a facility also includes non-combustion emissions sources such as VOCs and dust. WES estimates that there are no significant emissions sources at this facility that would affect the permitting status other than the boilers. Additionally, EBCH would not be subject to any NSPS (New Source Performance Standards). Based on these calculations and assumptions, the addition of a wood boiler system as described in the options would not trigger any state or federal permitting requirements.
9.5 USE OF WOOD RESIDUALS AS FUEL Wood pellets are a manufactured product and would not be considered by the Minnesota Pollution Control Agency (MPCA) to be a solid waste.
The MPCA has issued a Standing Beneficial Use Determination (SBUD) codified in Minn. R. 7035.2860, subpart 4(a), that allows for the use of “unadulterated wood, wood chips, bark, and sawdust” as a fuel, as long as the material is stored and managed appropriately. Unadulterated wood means wood that is not contaminated with paints, stains, glues, preservatives, or other chemicals. This SBUD allows facilities to use clean wood chips, regardless of their source, as a fuel without any further action from MPCA’s solid waste program.

Prelimina
WES ● W
9.6 AWhole treash by wewhich depshown in
Options dof ash (wo
Wood ashland appliwaste in Muse deterbeneficialthe MPCAspread onimplemenpermissio
Beneficialof this stuuse of ashExtensioninformatio
9.7 BMinnesotattended 326B.988 750,000 B
1 https://w
ry Feasibility
ilson Enginee
ASH ee wood chipeight. Modernposit ashes inFigure 9.
F
described in thood chip fuel)
h is a valuableication of woMinnesota. Hmination (CSl use. BecauseA has made den land, and thntation of a bon for this use
l use of the asudy, it is assumh will primariln Office can ason on ash use
BOILER OPERA
ta Administratby a licensedexempts hot
Btu per hour.
www.forestry.u
Report
ering Services
s generally con chip and pen a portable m
Figure 9 – Aut
his report hav) per year.
e soil amendmod ash can imowever, the BUD) to decide wood ash iseterminationerefore it is liomass proje
e of the wood
sh is anticipatmed that the y be on timbssist with finde from UMN E
ATOR REQUIR
tive Rules secd operating ent water heatin
umn.edu/sites/
VeDate Modif
, PC
ontain about llet boilers ha
metal containe
tomated Ash
ve the potent
ment which hmprove forestMPCA has a pde whether as known to has for several ikely that perct, a proposa
d ash.
ted to be signash can be uer harvest sitding beneficiaExtension is p
REMENTS ction 5225.11ngineer, unlesng boilers tha
/forestry.umn.
ersion: Finalfied: March 3
3% ash by weave automateer such as a 5
h Collection fr
tial to genera
as propertiest health1. Wooprocess wher specific man
ave valuable pother facilitiermission will bl should be su
nificantly cheased beneficia
tes, rather thaal use sites, anprovided in A
110 requires ass specifically
at do not exce
edu/files/Staff
Ely Blo1, 2017
eight, while wed or semi-au55-gallon dru
rom Pellet/Ch
te 2-5 tons o
s similar to limod ash is claseby it will ma
nagement optproperties whes with biomabe granted inubmitted to t
aper than lanally at no costan on agricultnd applying fppendix D.
all boilers be y exempted. Meed a combin
fpaper153.PDF
oomenson Co
wood pellets cutomated ashm, an examp
hip Boiler
f ash (pellet f
me. Studies hssified and regake a case-spetion for the sohen used as aass boilers than future casesthe MPCA in o
ndfilling, and ft to the facilittural land. Thfor a CSBUD. A
operated, maMinnesota Sted heat input
F
ommunity HoEly
Page 2
contain 0.5-1h handling sysle of which is
fuel) or 20-23
ave shown thgulated as a secific beneficolid waste is aa soil amendmat ashes can bs. Prior to order to gain
for the purpoty. In the Ely ahe Carlton CouAdditional
aintained, anatutes sectiot capacity of
ospital y, MN
26 of 29
.0% stems s
3 tons
hat solid cial a
ment, be
oses area, unty
d n

Preliminary Feasibility Report Version: Final Ely Bloomenson Community Hospital Date Modified: March 31, 2017 Ely, MN
WES ● Wilson Engineering Services, PC Page 27 of 29
Minnesota Statutes section 326B.978 sets the classifications and qualifications for operating engineers. Engineers are divided into four classes based on individual boiler size allowed to be operated: chief, first class, second class, and special engineers. The maximum boiler size allowed to be operated by license class is presented in Table 17. Licenses classes are also divided into Grade A, B, C licenses. Grade C licenses allow for the operation of low pressure boilers (steam less than 15 psig, or hot water less than 160 psig or 250°F). Grade B licenses allow for the operation of low or high pressure boilers. Grade A licenses allow for the operation of low or high pressure boilers with engines, turbines or other appurtenances.
Table 17 – Maximum Boiler Size by License Class Class Maximum Boiler Size
Chief Engineer Unlimited First Class Engineer 500 HP (16.7 mmBtu/hr) Second Class Engineer 100 HP (3.35 mmBtu/hr) Special Engineer 50 HP (1.67 mmBtu/hr)
Attendance requirements for low pressure boilers are set by the chief boiler inspector. A boiler attendance policy issued on July 29, 2014 requires a licensed operating engineer check the boiler(s) at least once each day during normal workdays. For weekends and holidays, boiler attendance policy requires a licensed operating engineer check the boiler(s) if: outside air temperature is forecasted to reach 10°F or below, a situation occurs that impacts the safety of the boiler or equipment, or the building will be occupied by employees or the public. No boiler should be left unattended for more than two consecutive days. A check of the boiler includes visual examination of all associated equipment and a logbook entry of the conditions observed.
The existing aggregate input rate for the hospital boiler plant is approximately 12.5 mmBtu/hr. Addition of a wood boiler would increase the input capacity by about 2.4 mmBtu/hr, to a total of 14.9 mmBtu/hr. Therefore, no change in license class would be required, according to the class designations in Table 17.
10.0 CONCLUSIONS AND RECOMMENDATIONS
A modern biomass boiler system would allow Ely Bloomenson Community Hospital to reduce fossil fuel usage while utilizing a local and renewable source of energy. The options evaluated in this report would provide benefits to EBCH as summarized:
• Option 1 is a boiler system capable of utilizing green wood chips. This project would provide a first year net operating savings of $37,629, not including payments from the thermal production incentive, and would have a capital cost of $1,189,240.
• Option 2 is a boiler system capable of utilizing wood pellets or dry wood chips. If pellet fuel was utilized, this project would increase annual operating costs by $11,698, before taking into account payments from the thermal production incentive, and if dry wood chips were utilized, first year net operating savings would be $29,809, not including payments from the thermal production incentive. This project would have a capital cost of $959,365.
• Option 3 is a boiler system capable of utilizing wood pellets. This project would increase annual operating costs by $9,039, before taking into account payments from the thermal production incentive, and would have a capital cost of $519,500.

Preliminary Feasibility Report Version: Final Ely Bloomenson Community Hospital Date Modified: March 31, 2017 Ely, MN
WES ● Wilson Engineering Services, PC Page 28 of 29
Financial performance of the evaluated options is heavily dependent on the cost of fossil fuels and wood fuels, as shown by the sensitivity analyses in Appendix C. If the cost of fossil fuels rises, then the savings will increase fairly dramatically.
Payments from the Minnesota Biomass Thermal Production Incentive are a major driver of savings. For Option 1 the annual payment would be approximately $27,176, for Option 2 the annual payment would be approximately $30,380, and for Option 3 the annual payment would be approximately $30,007. It is important to note that these payments only occur for 10 years following startup of the project.
Without the incentive payments, use of pellet fuel is not economical based on current fossil fuel prices. For a pellet project to even be worthy of consideration, the cost of fossil fuels (propane and fuel oil) would have to rise to the equivalent of a propane cost of approximately $1.50/gallon ($19.32/mmBtu output).
Additional benefits provided through the use of local biomass at the facility include:
• Net reduction of greenhouse gas emissions by 282-393 metric tonnes annually, • Keeping $31,000-$95,000 per year spent on energy within the region, • Diversification of fuels used by the Ely Bloomenson Community Hospital, • Reduction in operating budget volatility due to wide fluctuations in fossil energy pricing, • Creating markets for low-value woody biomass to enhance opportunities for forest
management activities to reduce pests and disease, prevent fires, and manage for ecological diversity, soil health, and water quality.
A new ambulance garage is planned north of the new propane tank. There is undeveloped land west of the hospital which is owned by the city, which may be developed eventually. Interconnection of these future loads to the biomass plant would improve the economics of the biomass plant, but the boiler size should not be increased at this time in anticipation of these or future loads. Even if the boiler size is not increased, and significant additional load is connected, the biomass boiler will be able to supply more renewable energy overall, just not at the peak times, which occur for a few weeks per year. These peaks would be seamlessly covered by propane. If significant additional load is expected to be connected in the future, it could be prudent to leave space in the plant to install a second boiler at a later date, taking into account that this second boiler would share the fuel storage bin and the stack.
Should EBCH be interested in pursuing a biomass option, WES recommends that staff visit modern biomass boiler installations to develop a detailed understanding of the equipment and its capabilities. The MN SWET is available to assist in arranging tours of existing facilities. As EBCH continues to pursue renewable biomass energy options, WES recommends that the next level of evaluation includes detailed consideration of the following items:
• Work with the MN SWET to identify alternative funding sources (low interest loans, grants, and incentives).
o Thermal Production Incentive o IRRRB Business Energy Retrofit o Rural Energy for America Program (REAP) o Community Facilities Direct Loan & Grant Program o PACE o IRRRB Development Infrastructure o DEED

Preliminary Feasibility Report Version: Final Ely Bloomenson Community Hospital Date Modified: March 31, 2017 Ely, MN
WES ● Wilson Engineering Services, PC Page 29 of 29
• Perform site investigations (utility, geotechnical) for the new boiler room and fuel storage building and further develop the biomass plant layout and capital cost based on investigation results.
• Continue to explore viable options for the wood chip supply, taking into consideration chip size, moisture content, and fuel quality, relative to boiler capabilities.
• Network with regional planning agencies to encourage widespread community support for this renewable energy project.

Preliminary Feasibility Report Version: Final Ely Bloomenson Community Hospital Date Modified: March 31, 2017 Ely, MN
WES ● Wilson Engineering Services, PC
Appendix A – Drawings • A.1 Existing Boiler Plant Schematic • A.2 Biomass Interconnection Schematic • A.3 Site Plan • A.4 Option 1 Layout • A.5 Option 1 Elevation • A.6 Option 2 Layout • A.7 Option 2 Elevation • A.8 Option 3 Layout

Notes:
1. This drawing is a general layout of the existing
system and is not intended to show all equipment
connected.VFD
T
Variable Frequency Drive
Temperature Transmitter
Pump
Three Way Mixing Valve
Legend
Boiler Plant Existing Conditions
Boiler #2
2.8 mmBtu/hr
Propane Boiler
Boiler #1
2.8 mmBtu/hr
Propane Boiler
Boiler #3
4.2 mmBtu/hr
Fuel Oil Boiler
(Steam)
Heat
Exchanger
P3
P4
Air
Separator
Summer
Bypass
Boiler #4
0.36 mmBtu/hr
Propane Boiler
Boiler #5
0.36 mmBtu/hr
Propane Boiler
Boiler #6
0.36 mmBtu/hr
Propane Boiler
P7 P8 P9
P5
P6
Supply to
Summer
and Winter
Heating
Zones
Return
from
Summer
and Winter
Heating
Zones
Control Valve
Butterfly Valve
Supply to
Winter Heating
Zones
Return from
Winter Heating
Zones
WE
S
Ely B
lo
om
en
so
n C
om
mu
nity H
osp
ita
l
Ely, M
N
Existing B
oiler P
lant S
chem
atic

Sequence of Operations:
1. The 1.7 mmBtu/hr biomass boiler will be controlled to
maintain a 200°F supply water temperature to the thermal
storage tank. T1 controls V1 which allows supply water from
the biomass boiler to bypass the thermal storage, in order to
maintain a return water temperature of at least 140°F to
prevent flue gas condensation. This is mainly a concern
during boiler startup and at times of heavy load.
2. P2 injects hot water into the district loop in the existing
boiler plant, ahead of the other boilers. The loop
temperature following injection is monitored by T3 and
adjusted using V2 and the VFD of P2. Normally, P2 runs at
minimum speed, and V2 modulates to meet the setpoint at
T3.
3. If T3 ever falls more than 5°F below the set point for more
than 5 minutes, then the fossil fuel boilers will be enabled,
and they will fire along with the wood boiler to supply heat to
the system.
4. When T3 reaches set point, the fossil fuel boilers will be
deactivated.
Closely Spaced Tees
for Biomass Connection
Mixing valve and VFD allow
distribution water
temperature to be lower than
thermal storage temperature
Notes:
1. This drawing is a conceptual layout for the purposes
of showing biomass system options.
2. Final design and layout will change based on
equipment selected, designer, and site conditions.
VFD
T
Variable Frequency Drive
Temperature Transmitter
Pump
Three Way Mixing Valve
Legend
Boiler Protection Valve to ensure
return water temperature > 140°F
Interconnection Schematic for
Wood Chip or Wood Pellet Boiler
Thermal
Storage Tank
1,700 Gal (Opt 1)
1,300 Gal (Opt 2)
1,300 Gal (Opt 3)
1.7 mmBtu/hr
Biomass Boiler
Boiler #2
2.8 mmBtu/hr
Propane Boiler
Boiler #1
2.8 mmBtu/hr
Propane Boiler
P1
P2
T1
T2
Underground Supply
and Return to
Hospital Boiler Room
Biomass Boiler Plant
Boiler #3
4.2 mmBtu/hr
Fuel Oil Boiler
(Steam)
Heat
Exchanger
P3
P4
Air
Separator
Supply to
Winter Heating
Zones
Return from
Winter Heating
Zones
Summer
Bypass
(Modified)
Boiler #4
0.36 mmBtu/hr
Propane Boiler
Boiler #5
0.36 mmBtu/hr
Propane Boiler
Boiler #6
0.36 mmBtu/hr
Propane Boiler
P7 P8 P9
P5
P6
Supply to
Summer
and Winter
Heating
Zones
Return
from
Summer
and Winter
Heating
Zones
Control Valve
Butterfly Valve
VFD
T3
Controls
V2
V1
WE
S
Ely B
lo
om
en
so
n C
om
mu
nity H
osp
ita
l
Ely, M
N
Biom
ass Interconnection S
chem
atic

SCALE
Feet
100 0 50 100
Proposed
Biomass Plant
Options 1 and 2
Helicopter Flight Path
Maintenance
Access to
Lower Level
Proposed Biomass
Plant and Silo
Option 3
Notes:
1. This drawing is a conceptual layout for the
purposes of showing biomass system options.
2. Final design and layout will change based on
equipment selected, designer, and site conditions.
Underground
Pipeline
WE
S
Ely B
lo
om
en
so
n C
om
mu
nity H
osp
ita
l
Ely, M
N
Site P
lan

Stack
SCALE
Feet
2 0 1 2
Option 1 - Wood Chip Boiler Plan View
1.7
mmBtu/hr
Biomass
Boiler
1,700 Gallon
Thermal
Storage Tank
Pumps
Overs
Bin
Chip Bin
Conveyors
Metering
Bin
Electrical
Panel
Control
Panel
31'-4"
41'-5"
T/Pavement
0'-0"
T/Floor
-12'-0"
T/Floor
-14'-0"
T/Floor
-8'-0"
Traveling
Auger
10' W
x 14' H
O
.H
. D
oor
10' W
x 14' H
O
.H
. D
oor
10' W x 10' H O.H. Door
Overhang
allows trucks
to dump into
center of bin
15'
Notes:
1. This drawing is a conceptual layout for the
purposes of showing biomass system options.
2. Final design and layout will change based on
equipment selected, designer, and site conditions.
Cyclone
ID Fan
Expansion
Tanks
WE
S
Ely B
lo
om
en
so
n C
om
mu
nity H
osp
ita
l
Ely, M
N
Option 1 B
iom
ass P
lant Layout

SCALE
Feet
2 0 1 2
Option 1 - Wood Chip Boiler Elevation View
(Looking South)
Chip Bin
12'
Boiler
15'
10' W x 10' H O.H. Door
10' W x 14' H O.H. Door
Parking Lot Elevation
Notes:
1. This drawing is a conceptual layout for the
purposes of showing biomass system options.
2. Final design and layout will change based on
equipment selected, designer, and site conditions.
WE
S
Ely B
lo
om
en
so
n C
om
mu
nity H
osp
ita
l
Ely, M
N
Option 1 B
iom
ass P
lant E
levation

SCALE
Feet
2 0 1 2
Option 2 - Pellet and Dry Chip Boiler Plan View
Pellet and
Chip Bin
29'-7"
28'
10' W x 10' H O.H. Door
T/Pavement
0'-0"
T/Floor
-10'-0"
T/Floor
-8'-0"
10' W
x 14' H
O
.H
. D
oor
10' W
x 14' H
O
.H
. D
oor
1,300 Gal.
Thermal
Storage
Tank
Pumps
Metering
Bin
Stack
1.7
mmBtu/hr
Pellet
Boiler
Electrical
Panel
Control
Panel
Protective
Roof
Overhang
allows trucks
to dump into
center of bin
15'
Notes:
1. This drawing is a conceptual layout for the
purposes of showing biomass system options.
2. Final design and layout will change based on
equipment selected, designer, and site conditions.
ID Fan
Cyclone
Expansion
Tanks
WE
S
Ely B
lo
om
en
so
n C
om
mu
nity H
osp
ita
l
Ely, M
N
Option 2 B
iom
ass P
lant Layout

SCALE
Feet
2 0 1 2
Option 2 - Pellet Boiler Elevation View
(Looking South)
Pellet and
Chip Bin
8'
15'
10' W x 10' H O.H. Door
10' W x 14' H O.H. Door
Boiler
Protective
Roof for
Side Door
Parking Lot Elevation
Notes:
1. This drawing is a conceptual layout for the
purposes of showing biomass system options.
2. Final design and layout will change based on
equipment selected, designer, and site conditions.
WE
S
Ely B
lo
om
en
so
n C
om
mu
nity H
osp
ita
l
Ely, M
N
Option 1 B
iom
ass P
lant E
levation

SCALE
Feet
2 0 1 2
Option 3 - Pellet Boiler Plan View
18'
22'
10' W x 10' H O.H. Door
1,300 Gal.
Thermal
Storage
Tank
Pumps
Stack
1.7 mmBtu/hr
Pellet Boiler
Electrical
Panel
Control
Panel
40 Ton
Pellet Silo
ID Fan
Cyclone
Flexible
Auger
Notes:
1. This drawing is a conceptual layout for the
purposes of showing biomass system options.
2. Final design and layout will change based on
equipment selected, designer, and site conditions.
WE
S
Ely B
lo
om
en
so
n C
om
mu
nity H
osp
ita
l
Ely, M
N
Option 3 B
iom
ass P
lant Layout

Preliminary Feasibility Report Version: Final Ely Bloomenson Community Hospital Date Modified: March 31, 2017 Ely, MN
WES ● Wilson Engineering Services, PC
Appendix B – Capital Cost Estimates • B.1 Option 1 – Wood Chip Boiler System • B.2 Option 2 – Pellet and Dry Chip Boiler System • B.3 Option 3 – Pellet Boiler System

Appendix B Ely Bloomenson Community HospitalEly, MN
Line Item Cost
210,000$
Fuel reclaim system, fuel handling, screening 75,000$ 1,700 gallon thermal storage tank(s) 20,000$ Installation and startup 65,000$ Total Boiler Manufacturer Contract 370,000$
Line Item CostSitework and grading 100,000$ 1,300 ft2 boiler building and fuel storage bunker ($200/sf) 260,000$ Electrical service 10,000$ Boiler Room Mechanical (pumps, piping, insulation, hydronic specialties) 30,000$ Insulated underground PEX piping (203' @ $200/ft) 81,200$ Interconnection in main boiler room 20,000$ Sub-Total 501,200$
Contractor profit, overhead, and insurance 16% 80,192$ Total General Contract Building and Site2 581,392$
Line Item CostProject Sub-Total (Boiler, General Contract, Additional Items) 951,392$
Professional Services 3 10% 95,139$ Contingency 15% 142,709$
Total Project Cost 1,189,240$
Notes:1 - Assumes that biomass boiler and general contract are bid separately.2 - Costs are approximate. Estimate is based on competitive bidding.3 - Professional Services includes engineering, permitting, legal, and project management.
Option 1 - 1.7 mmBtu/hr Chip Boiler Capital Cost Estimate
Biomass Boiler Manufacturer Contract1
General Contract
Total Project Cost
1.7 mmBtu/hr biomass combustion unit, 60 psig hot water boiler, cyclone, stack, boiler system controls, ash collection
WES ● Wilson Engineering Services, PC B.1

Appendix B Ely Bloomenson Community HospitalEly, MN
Line Item Cost1.7 mmBtu/hr pellet and dry chip hot water boiler, cyclone, blowers, stack 150,000$ Spring agitators and fuel handling system 20,000$ Boiler system controls, automatic ignition system, ash collection 15,000$ 1,300 gallon thermal storage tank(s) 12,000$ Installation and startup 50,000$ Total Boiler Manufacturer Contract 247,000$
Line Item CostSitework and grading 100,000$ 830 ft2 boiler building and fuel storage bunker ($250/sf) 207,500$ Electrical service 10,000$ Boiler Room Mechanical (pumps, piping, insulation, hydronic specialties) 30,000$ Insulated underground PEX piping, including trenching (203' @ $200/ft) 81,200$ Interconnection in main boiler room 20,000$ Sub-Total 448,700$
Contractor profit, overhead, and insurance 16% 71,792$ Total General Contract Building and Site2 520,492$
Line Item CostProject Sub-Total (Boiler and General Contract) 767,492$
Professional Services 3 10% 76,749$ Contingency 15% 115,124$
Total Project Cost 959,365$
Notes:1 - Assumes that biomass boiler and general contract are bid separately.2 - Costs are approximate. Estimate is based on competitive bidding.3 - Professional Services includes engineering, permitting, legal, and project management.
Option 2 - 1.7 mmBtu/hr Pellet and Dry Chip Boiler Capital Cost Estimate
Biomass Boiler Manufacturer Contract1
General Contract
Total Project Cost
WES ● Wilson Engineering Services, PC B.2

Appendix B Ely Bloomenson Community HospitalEly, MN
Line Item Cost1.7 mmBtu/hr pellet boiler, cyclone, blowers, stack 150,000$ Boiler system controls, automatic ignition system, ash collection 15,000$ 1,300 gallon thermal storage tank(s) 15,000$ Installation and startup 50,000$ Total Boiler Manufacturer Contract 230,000$
Line Item CostSitework for pellet silo 5,000$ 40 ton pellet silo and flex auger system 20,000$ 400 ft2 boiler building and fuel storage bunker ($200/sf) 80,000$ Electrical feeder to boiler room 5,000$ Boiler Room Mechanical (pumps, piping, insulation, hydronic specialties) 30,000$ Interconnection in main boiler room 20,000$ Sub-Total 160,000$
Contractor profit, overhead, and insurance 16% 25,600$ Total General Contract Building and Site2 185,600$
Line Item CostProject Sub-Total (Boiler and General Contract) 415,600$
Professional Services 3 10% 41,560$ Contingency 15% 62,340$
Total Project Cost 519,500$
Notes:1 - Assumes that biomass boiler and general contract are bid separately.2 - Costs are approximate. Estimate is based on competitive bidding.3 - Professional Services includes engineering, permitting, legal, and project management.
Option 3 - 1.7 mmBtu/hr Pellet Boiler Capital Cost Estimate
Biomass Boiler Manufacturer Contract1
General Contract
Total Project Cost
WES ● Wilson Engineering Services, PC B.3

Preliminary Feasibility Report Version: Final Ely Bloomenson Community Hospital Date Modified: March 31, 2017 Ely, MN
WES ● Wilson Engineering Services, PC
Appendix C – Financial and Fuel Cost Analyses • C.1 Option 1 (Wood Chip) Financial Analysis • C.2 Option 1 (Wood Chip) Financial Analysis with 25% Grant • C.3 Option 1 (Wood Chip) Fuel Cost Sensitivity Analysis • C.4 Option 2 (Pellet) Financial Analysis • C.5 Option 2 (Pellet) Financial Analysis with 25% Grant • C.6 Option 2 (Pellet) Fuel Cost Sensitivity Analysis • C.7 Option 2 (Dry Chip) Financial Analysis • C.8 Option 2 (Dry Chip) Financial Analysis with 25% Grant • C.9 Option 2 (Dry Chip) Fuel Cost Sensitivity Analysis • C.10 Option 3 (Pellet) Financial Analysis • C.11 Option 3 (Pellet) Financial Analysis with 25% Grant • C.12 Option 3 (Pellet) Fuel Cost Sensitivity Analysis

Appendix C Option 1 - Wood Chip Boiler25-year Cash Flow Analysis
Ely Bloomenson Community HospitalEly, MN
Input Variables Value Units Year Total Fossil Fuel
Cost, Current System
Wood Fuel Cost
Fossil Fuel Cost w/ Wood
System
Added O&M Cost
Net Operating
Savings
Thermal Production Incentive
Net Cash Flow
Present Value of Net
Cash Flow
Project Costs Financed $1,189,240 $ 0 -$ -$ -$ -$ -$ -$ (1,189,240)$ (1,189,240)$ Grant Amount $0 $ 1 93,756$ (31,058)$ (14,063)$ (11,005)$ 37,629$ 27,176$ 64,805$ 64,164$ Project Costs Financed $1,189,240 $ 2 95,162$ (31,214)$ (14,274)$ (11,005)$ 38,670$ 26,462$ 65,131$ 63,848$ Annual Propane Usage 81,373 gal 3 96,590$ (31,370)$ (14,488)$ (11,005)$ 39,727$ 25,766$ 65,493$ 63,566$ Average Propane Price $1.15 $/gal 4 98,039$ (31,526)$ (14,706)$ (11,005)$ 40,801$ 25,088$ 65,890$ 63,319$ Wood Chip Usage (green chips) 776 tons/yr 5 99,509$ (31,684)$ (14,926)$ (11,005)$ 41,894$ 24,429$ 66,323$ 63,104$ Year 1 Wood Chip Price $40 $/ton 6 101,002$ (31,843)$ (15,150)$ (11,005)$ 43,004$ 23,787$ 66,791$ 62,920$ Annual Propane Usage w/ Wood System 12,206 gal 7 102,517$ (32,002)$ (15,378)$ (11,005)$ 44,133$ 23,161$ 67,294$ 62,766$ Fossil Fuel Escalation Rate (apr) 1.5% Percent 8 104,055$ (32,162)$ (15,608)$ (11,005)$ 45,280$ 22,552$ 67,832$ 62,642$ Wood Fuel Escalation Rate (apr) 0.5% Percent 9 105,616$ (32,323)$ (15,842)$ (11,005)$ 46,446$ 21,959$ 68,405$ 62,546$ Real Discount Rate (apr) 1.0% Percent 10 107,200$ (32,484)$ (16,080)$ (11,005)$ 47,631$ 21,382$ 69,013$ 62,476$ Inflation Rate (apr) 2.7% Percent 11 108,808$ (32,647)$ (16,321)$ (11,005)$ 48,835$ 48,835$ 43,772$ Added Annual O&M Costs for Biomass Plant $11,005 $/year 12 110,440$ (32,810)$ (16,566)$ (11,005)$ 50,059$ 50,059$ 44,425$ Thermal Production Incentive $27,176 $/year 13 112,096$ (32,974)$ (16,814)$ (11,005)$ 51,303$ 51,303$ 45,078$
14 113,778$ (33,139)$ (17,067)$ (11,005)$ 52,568$ 52,568$ 45,732$ 15 115,485$ (33,304)$ (17,323)$ (11,005)$ 53,852$ 53,852$ 46,386$ 16 117,217$ (33,471)$ (17,583)$ (11,005)$ 55,158$ 55,158$ 47,040$ 17 118,975$ (33,638)$ (17,846)$ (11,005)$ 56,486$ 56,486$ 47,695$ 18 120,760$ (33,807)$ (18,114)$ (11,005)$ 57,834$ 57,834$ 48,350$ 19 122,571$ (33,976)$ (18,386)$ (11,005)$ 59,205$ 59,205$ 49,006$ 20 124,410$ (34,145)$ (18,661)$ (11,005)$ 60,598$ 60,598$ 49,663$ 21 126,276$ (34,316)$ (18,941)$ (11,005)$ 62,013$ 62,013$ 50,320$ 22 128,170$ (34,488)$ (19,226)$ (11,005)$ 63,452$ 63,452$ 50,977$ 23 130,093$ (34,660)$ (19,514)$ (11,005)$ 64,914$ 64,914$ 51,635$ 24 132,044$ (34,833)$ (19,807)$ (11,005)$ 66,399$ 66,399$ 52,294$ 25 134,025$ (35,008)$ (20,104)$ (11,005)$ 67,908$ 67,908$ 52,953$
25-year Net Present Value 167,436$
Note: All values are in real dollars.
WES ● Wilson Engineering Services, PC C.1

Appendix C Option 1 - Wood Chip Boiler25-year Cash Flow Analysis with 25% Grant
Ely Bloomenson Community HospitalEly, MN
Input Variables Value Units Year Total Fossil Fuel
Cost, Current System
Wood Fuel Cost
Fossil Fuel Cost w/ Wood
System
Added O&M Cost
Net Operating
Savings
Thermal Production Incentive
Net Cash Flow
Present Value of Net
Cash Flow
Project Costs Financed $1,189,240 $ 0 -$ -$ -$ -$ -$ -$ (891,930)$ (891,930)$ Grant Amount $297,310 $ 1 93,756$ (31,058)$ (14,063)$ (11,005)$ 37,629$ 27,176$ 64,805$ 64,164$ Project Costs Financed $891,930 $ 2 95,162$ (31,214)$ (14,274)$ (11,005)$ 38,670$ 26,462$ 65,131$ 63,848$ Annual Propane Usage 81,373 gal 3 96,590$ (31,370)$ (14,488)$ (11,005)$ 39,727$ 25,766$ 65,493$ 63,566$ Average Propane Price $1.15 $/gal 4 98,039$ (31,526)$ (14,706)$ (11,005)$ 40,801$ 25,088$ 65,890$ 63,319$ Wood Chip Usage (green chips) 776 tons/yr 5 99,509$ (31,684)$ (14,926)$ (11,005)$ 41,894$ 24,429$ 66,323$ 63,104$ Year 1 Wood Chip Price $40 $/ton 6 101,002$ (31,843)$ (15,150)$ (11,005)$ 43,004$ 23,787$ 66,791$ 62,920$ Annual Propane Usage w/ Wood System 12,206 gal 7 102,517$ (32,002)$ (15,378)$ (11,005)$ 44,133$ 23,161$ 67,294$ 62,766$ Fossil Fuel Escalation Rate (apr) 1.5% Percent 8 104,055$ (32,162)$ (15,608)$ (11,005)$ 45,280$ 22,552$ 67,832$ 62,642$ Wood Fuel Escalation Rate (apr) 0.5% Percent 9 105,616$ (32,323)$ (15,842)$ (11,005)$ 46,446$ 21,959$ 68,405$ 62,546$ Real Discount Rate (apr) 1.0% Percent 10 107,200$ (32,484)$ (16,080)$ (11,005)$ 47,631$ 21,382$ 69,013$ 62,476$ Inflation Rate (apr) 2.7% Percent 11 108,808$ (32,647)$ (16,321)$ (11,005)$ 48,835$ 48,835$ 43,772$ Added Annual O&M Costs for Biomass Plant $11,005 $/year 12 110,440$ (32,810)$ (16,566)$ (11,005)$ 50,059$ 50,059$ 44,425$ Thermal Production Incentive $27,176 $/year 13 112,096$ (32,974)$ (16,814)$ (11,005)$ 51,303$ 51,303$ 45,078$
14 113,778$ (33,139)$ (17,067)$ (11,005)$ 52,568$ 52,568$ 45,732$ 15 115,485$ (33,304)$ (17,323)$ (11,005)$ 53,852$ 53,852$ 46,386$ 16 117,217$ (33,471)$ (17,583)$ (11,005)$ 55,158$ 55,158$ 47,040$ 17 118,975$ (33,638)$ (17,846)$ (11,005)$ 56,486$ 56,486$ 47,695$ 18 120,760$ (33,807)$ (18,114)$ (11,005)$ 57,834$ 57,834$ 48,350$ 19 122,571$ (33,976)$ (18,386)$ (11,005)$ 59,205$ 59,205$ 49,006$ 20 124,410$ (34,145)$ (18,661)$ (11,005)$ 60,598$ 60,598$ 49,663$ 21 126,276$ (34,316)$ (18,941)$ (11,005)$ 62,013$ 62,013$ 50,320$ 22 128,170$ (34,488)$ (19,226)$ (11,005)$ 63,452$ 63,452$ 50,977$ 23 130,093$ (34,660)$ (19,514)$ (11,005)$ 64,914$ 64,914$ 51,635$ 24 132,044$ (34,833)$ (19,807)$ (11,005)$ 66,399$ 66,399$ 52,294$ 25 134,025$ (35,008)$ (20,104)$ (11,005)$ 67,908$ 67,908$ 52,953$
25-year Net Present Value 464,746$
Note: All values are in real dollars.
WES ● Wilson Engineering Services, PC C.2

Appendix C Option 1 - Wood Chip BoilerFuel Cost Sensitivity Analysis
Ely Bloomenson Community HospitalEly, MN
37,629$ $0.75 $1.00 $1.15 $1.25 $1.50 $1.75 $2.00$10 $33,106 $50,397 $60,923 $67,689 $84,981 $102,273 $119,564$15 $29,223 $46,515 $57,041 $63,807 $81,099 $98,390 $115,682$20 $25,341 $42,633 $53,159 $59,925 $77,216 $94,508 $111,800$25 $21,459 $38,751 $49,276 $56,042 $73,334 $90,626 $107,917$30 $17,576 $34,868 $45,394 $52,160 $69,452 $86,743 $104,035$35 $13,694 $30,986 $41,512 $48,278 $65,569 $82,861 $100,153$40 $9,812 $27,104 $37,629 $44,395 $61,687 $78,979 $96,271$45 $5,930 $23,221 $33,747 $40,513 $57,805 $75,097 $92,388$50 $2,047 $19,339 $29,865 $36,631 $53,923 $71,214 $88,506$55 ($1,835) $15,457 $25,983 $32,749 $50,040 $67,332 $84,624$60 ($5,717) $11,575 $22,100 $28,866 $46,158 $63,450 $80,741$65 ($9,599) $7,692 $18,218 $24,984 $42,276 $59,567 $76,859$70 ($13,482) $3,810 $14,336 $21,102 $38,393 $55,685 $72,977$75 ($17,364) ($72) $10,453 $17,219 $34,511 $51,803 $69,095
*Notes: All other costs fixed. Excludes financing costs. Excludes thermal production incentive.
Table Shows Sensitivity of Annual Operating Savingsto Changes in Fossil Fuel and Wood Fuel Prices*
Fossil Fuel Price, $/gal
Price
of W
ood
Chip
s - $
/ton
WES ● Wilson Engineering Services, PC C.3

Appendix C Option 2 - Pellet Boiler25-year Cash Flow Analysis
Ely Bloomenson Community HospitalEly, MN
Input Variables Value Units Year Total Fossil Fuel
Cost, Current System
Wood Fuel Cost
Fossil Fuel Cost w/ Wood
System
Added O&M Cost
Net Operating
Savings
Thermal Production Incentive
Net Cash Flow
Present Value of Net
Cash Flow
Project Costs Financed $959,365 $ 0 -$ -$ -$ -$ -$ -$ (959,365)$ (959,365)$ Grant Amount $0 $ 1 93,756$ (95,516)$ (4,688)$ (5,251)$ (11,698)$ 30,380$ 18,681$ 18,496$ Project Costs Financed $959,365 $ 2 95,162$ (95,993)$ (4,758)$ (5,251)$ (10,840)$ 29,581$ 18,741$ 18,372$ Annual Propane Usage 81,373 gal 3 96,590$ (96,473)$ (4,829)$ (5,251)$ (9,964)$ 28,803$ 18,839$ 18,285$ Average Propane Price $1.15 $/gal 4 98,039$ (96,956)$ (4,902)$ (5,251)$ (9,070)$ 28,046$ 18,976$ 18,236$ Pellet Usage 463 tons/yr 5 99,509$ (97,440)$ (4,975)$ (5,251)$ (8,158)$ 27,309$ 19,151$ 18,222$ Year 1 Pellet Price $206 $/ton 6 101,002$ (97,928)$ (5,050)$ (5,251)$ (7,227)$ 26,591$ 19,364$ 18,242$ Annual Propane Usage w/ Wood System 4,069 gal 7 102,517$ (98,417)$ (5,126)$ (5,251)$ (6,277)$ 25,892$ 19,615$ 18,295$ Fossil Fuel Escalation Rate (apr) 1.5% Percent 8 104,055$ (98,909)$ (5,203)$ (5,251)$ (5,308)$ 25,211$ 19,903$ 18,380$ Wood Fuel Escalation Rate (apr) 0.5% Percent 9 105,616$ (99,404)$ (5,281)$ (5,251)$ (4,320)$ 24,548$ 20,228$ 18,495$ Real Discount Rate (apr) 1.0% Percent 10 107,200$ (99,901)$ (5,360)$ (5,251)$ (3,312)$ 23,903$ 20,591$ 18,641$ Inflation Rate (apr) 2.7% Percent 11 108,808$ (100,400)$ (5,440)$ (5,251)$ (2,284)$ (2,284)$ (2,047)$ Added Annual O&M Costs for Biomass Plant $5,251 $/year 12 110,440$ (100,902)$ (5,522)$ (5,251)$ (1,236)$ (1,236)$ (1,097)$ Thermal Production Incentive $30,380 $/year 13 112,096$ (101,407)$ (5,605)$ (5,251)$ (166)$ (166)$ (146)$
14 113,778$ (101,914)$ (5,689)$ (5,251)$ 924$ 924$ 804$ 15 115,485$ (102,424)$ (5,774)$ (5,251)$ 2,036$ 2,036$ 1,754$ 16 117,217$ (102,936)$ (5,861)$ (5,251)$ 3,169$ 3,169$ 2,703$ 17 118,975$ (103,450)$ (5,949)$ (5,251)$ 4,325$ 4,325$ 3,652$ 18 120,760$ (103,968)$ (6,038)$ (5,251)$ 5,503$ 5,503$ 4,601$ 19 122,571$ (104,487)$ (6,129)$ (5,251)$ 6,704$ 6,704$ 5,549$ 20 124,410$ (105,010)$ (6,220)$ (5,251)$ 7,928$ 7,928$ 6,498$ 21 126,276$ (105,535)$ (6,314)$ (5,251)$ 9,176$ 9,176$ 7,446$ 22 128,170$ (106,063)$ (6,409)$ (5,251)$ 10,448$ 10,448$ 8,394$ 23 130,093$ (106,593)$ (6,505)$ (5,251)$ 11,744$ 11,744$ 9,342$ 24 132,044$ (107,126)$ (6,602)$ (5,251)$ 13,065$ 13,065$ 10,289$ 25 134,025$ (107,662)$ (6,701)$ (5,251)$ 14,411$ 14,411$ 11,237$
25-year Net Present Value (706,724)$
Note: All values are in real dollars.
WES ● Wilson Engineering Services, PC C.4

Appendix C Option 2 - Pellet Boiler25-year Cash Flow Analysis with 25% Grant
Ely Bloomenson Community HospitalEly, MN
Input Variables Value Units Year Total Fossil Fuel
Cost, Current System
Wood Fuel Cost
Fossil Fuel Cost w/ Wood
System
Added O&M Cost
Net Operating
Savings
Thermal Production Incentive
Net Cash Flow
Present Value of Net
Cash Flow
Project Costs Financed $959,365 $ 0 -$ -$ -$ -$ -$ -$ (719,524)$ (719,524)$ Grant Amount $239,841 $ 1 93,756$ (95,516)$ (4,688)$ (5,251)$ (11,698)$ 30,380$ 18,681$ 18,496$ Project Costs Financed $719,524 $ 2 95,162$ (95,993)$ (4,758)$ (5,251)$ (10,840)$ 29,581$ 18,741$ 18,372$ Annual Propane Usage 81,373 gal 3 96,590$ (96,473)$ (4,829)$ (5,251)$ (9,964)$ 28,803$ 18,839$ 18,285$ Average Propane Price $1.15 $/gal 4 98,039$ (96,956)$ (4,902)$ (5,251)$ (9,070)$ 28,046$ 18,976$ 18,236$ Pellet Usage 463 tons/yr 5 99,509$ (97,440)$ (4,975)$ (5,251)$ (8,158)$ 27,309$ 19,151$ 18,222$ Year 1 Pellet Price $206 $/ton 6 101,002$ (97,928)$ (5,050)$ (5,251)$ (7,227)$ 26,591$ 19,364$ 18,242$ Annual Propane Usage w/ Wood System 4,069 gal 7 102,517$ (98,417)$ (5,126)$ (5,251)$ (6,277)$ 25,892$ 19,615$ 18,295$ Fossil Fuel Escalation Rate (apr) 1.5% Percent 8 104,055$ (98,909)$ (5,203)$ (5,251)$ (5,308)$ 25,211$ 19,903$ 18,380$ Wood Fuel Escalation Rate (apr) 0.5% Percent 9 105,616$ (99,404)$ (5,281)$ (5,251)$ (4,320)$ 24,548$ 20,228$ 18,495$ Real Discount Rate (apr) 1.0% Percent 10 107,200$ (99,901)$ (5,360)$ (5,251)$ (3,312)$ 23,903$ 20,591$ 18,641$ Inflation Rate (apr) 2.7% Percent 11 108,808$ (100,400)$ (5,440)$ (5,251)$ (2,284)$ (2,284)$ (2,047)$ Added Annual O&M Costs for Biomass Plant $5,251 $/year 12 110,440$ (100,902)$ (5,522)$ (5,251)$ (1,236)$ (1,236)$ (1,097)$ Thermal Production Incentive $30,380 $/year 13 112,096$ (101,407)$ (5,605)$ (5,251)$ (166)$ (166)$ (146)$
14 113,778$ (101,914)$ (5,689)$ (5,251)$ 924$ 924$ 804$ 15 115,485$ (102,424)$ (5,774)$ (5,251)$ 2,036$ 2,036$ 1,754$ 16 117,217$ (102,936)$ (5,861)$ (5,251)$ 3,169$ 3,169$ 2,703$ 17 118,975$ (103,450)$ (5,949)$ (5,251)$ 4,325$ 4,325$ 3,652$ 18 120,760$ (103,968)$ (6,038)$ (5,251)$ 5,503$ 5,503$ 4,601$ 19 122,571$ (104,487)$ (6,129)$ (5,251)$ 6,704$ 6,704$ 5,549$ 20 124,410$ (105,010)$ (6,220)$ (5,251)$ 7,928$ 7,928$ 6,498$ 21 126,276$ (105,535)$ (6,314)$ (5,251)$ 9,176$ 9,176$ 7,446$ 22 128,170$ (106,063)$ (6,409)$ (5,251)$ 10,448$ 10,448$ 8,394$ 23 130,093$ (106,593)$ (6,505)$ (5,251)$ 11,744$ 11,744$ 9,342$ 24 132,044$ (107,126)$ (6,602)$ (5,251)$ 13,065$ 13,065$ 10,289$ 25 134,025$ (107,662)$ (6,701)$ (5,251)$ 14,411$ 14,411$ 11,237$
25-year Net Present Value (466,883)$
Note: All values are in real dollars.
WES ● Wilson Engineering Services, PC C.5

Appendix C Option 2 - Pellet BoilerFuel Cost Sensitivity Analysis
Ely Bloomenson Community HospitalEly, MN
(11,698)$ $0.75 $1.00 $1.15 $1.25 $1.50 $1.75 $2.00$170 ($26,001) ($6,675) $5,089 $12,651 $31,977 $51,303 $70,629$175 ($28,317) ($8,990) $2,774 $10,336 $29,662 $48,988 $68,314$180 ($30,632) ($11,306) $458 $8,020 $27,346 $46,672 $65,998$185 ($32,948) ($13,622) ($1,857) $5,704 $25,031 $44,357 $63,683$190 ($35,263) ($15,937) ($4,173) $3,389 $22,715 $42,041 $61,367$195 ($37,579) ($18,253) ($6,489) $1,073 $20,399 $39,726 $59,052$200 ($39,894) ($20,568) ($8,804) ($1,242) $18,084 $37,410 $56,736$206 ($42,789) ($23,463) ($11,698) ($4,137) $15,190 $34,516 $53,842$210 ($44,525) ($25,199) ($13,435) ($5,873) $13,453 $32,779 $52,105$215 ($46,841) ($27,515) ($15,751) ($8,189) $11,137 $30,463 $49,789$220 ($49,156) ($29,830) ($18,066) ($10,504) $8,822 $28,148 $47,474$225 ($51,472) ($32,146) ($20,382) ($12,820) $6,506 $25,832 $45,158$230 ($53,787) ($34,461) ($22,697) ($15,135) $4,191 $23,517 $42,843$235 ($56,103) ($36,777) ($25,013) ($17,451) $1,875 $21,201 $40,527
*Notes: All other costs fixed. Excludes financing costs. Excludes thermal production incentive.
Table Shows Sensitivity of Annual Operating Savingsto Changes in Fossil Fuel and Wood Fuel Prices*
Fossil Fuel Price, $/gal
Price
of P
elle
ts -
$/to
n
WES ● Wilson Engineering Services, PC C.6

Appendix C Option 2 - Pellet Boiler using Dry Chips25-year Cash Flow Analysis
Ely Bloomenson Community HospitalEly, MN
Input Variables Value Units Year Total Fossil Fuel
Cost, Current System
Wood Fuel Cost
Fossil Fuel Cost w/ Wood
System
Added O&M Cost
Net Operating
Savings
Thermal Production Incentive
Net Cash Flow
Present Value of Net
Cash Flow
Project Costs Financed $959,365 $ 0 -$ -$ -$ -$ -$ -$ (959,365)$ (959,365)$ Grant Amount $0 $ 1 93,756$ (54,009)$ (4,688)$ (5,251)$ 29,809$ 30,380$ 60,189$ 59,593$ Project Costs Financed $959,365 $ 2 95,162$ (54,279)$ (4,758)$ (5,251)$ 30,875$ 29,581$ 60,456$ 59,265$ Annual Propane Usage 81,373 gal 3 96,590$ (54,550)$ (4,829)$ (5,251)$ 31,959$ 28,803$ 60,763$ 58,976$ Average Propane Price $1.15 $/gal 4 98,039$ (54,823)$ (4,902)$ (5,251)$ 33,063$ 28,046$ 61,109$ 58,725$ Dry Wood Chip Usage 675 tons/yr 5 99,509$ (55,097)$ (4,975)$ (5,251)$ 34,186$ 27,309$ 61,495$ 58,510$ Year 1 Dry Wood Chip Price $80 $/ton 6 101,002$ (55,372)$ (5,050)$ (5,251)$ 35,329$ 26,591$ 61,919$ 58,331$ Annual Propane Usage w/ Wood System 4,069 gal 7 102,517$ (55,649)$ (5,126)$ (5,251)$ 36,491$ 25,892$ 62,383$ 58,186$ Fossil Fuel Escalation Rate (apr) 1.5% Percent 8 104,055$ (55,927)$ (5,203)$ (5,251)$ 37,674$ 25,211$ 62,885$ 58,073$ Wood Fuel Escalation Rate (apr) 0.5% Percent 9 105,616$ (56,207)$ (5,281)$ (5,251)$ 38,877$ 24,548$ 63,425$ 57,992$ Real Discount Rate (apr) 1.0% Percent 10 107,200$ (56,488)$ (5,360)$ (5,251)$ 40,101$ 23,903$ 64,004$ 57,942$ Inflation Rate (apr) 2.7% Percent 11 108,808$ (56,771)$ (5,440)$ (5,251)$ 41,346$ 41,346$ 37,059$ Added Annual O&M Costs for Biomass Plant $5,251 $/year 12 110,440$ (57,054)$ (5,522)$ (5,251)$ 42,612$ 42,612$ 37,816$ Thermal Production Incentive $30,380 $/year 13 112,096$ (57,340)$ (5,605)$ (5,251)$ 43,901$ 43,901$ 38,574$
14 113,778$ (57,626)$ (5,689)$ (5,251)$ 45,212$ 45,212$ 39,332$ 15 115,485$ (57,915)$ (5,774)$ (5,251)$ 46,545$ 46,545$ 40,091$ 16 117,217$ (58,204)$ (5,861)$ (5,251)$ 47,901$ 47,901$ 40,851$ 17 118,975$ (58,495)$ (5,949)$ (5,251)$ 49,280$ 49,280$ 41,611$ 18 120,760$ (58,788)$ (6,038)$ (5,251)$ 50,683$ 50,683$ 42,372$ 19 122,571$ (59,082)$ (6,129)$ (5,251)$ 52,110$ 52,110$ 43,134$ 20 124,410$ (59,377)$ (6,220)$ (5,251)$ 53,561$ 53,561$ 43,896$ 21 126,276$ (59,674)$ (6,314)$ (5,251)$ 55,037$ 55,037$ 44,659$ 22 128,170$ (59,972)$ (6,409)$ (5,251)$ 56,538$ 56,538$ 45,423$ 23 130,093$ (60,272)$ (6,505)$ (5,251)$ 58,065$ 58,065$ 46,187$ 24 132,044$ (60,573)$ (6,602)$ (5,251)$ 59,617$ 59,617$ 46,953$ 25 134,025$ (60,876)$ (6,701)$ (5,251)$ 61,196$ 61,196$ 47,719$
25-year Net Present Value 261,904$
Note: All values are in real dollars.
WES ● Wilson Engineering Services, PC C.7

Appendix C Option 2 - Pellet Boiler using Dry Chips25-year Cash Flow Analysis with 25% Grant
Ely Bloomenson Community HospitalEly, MN
Input Variables Value Units Year Total Fossil Fuel
Cost, Current System
Wood Fuel Cost
Fossil Fuel Cost w/ Wood
System
Added O&M Cost
Net Operating
Savings
Thermal Production Incentive
Net Cash Flow
Present Value of Net
Cash Flow
Project Costs Financed $959,365 $ 0 -$ -$ -$ -$ -$ -$ (719,524)$ (719,524)$ Grant Amount $239,841 $ 1 93,756$ (54,009)$ (4,688)$ (5,251)$ 29,809$ 30,380$ 60,189$ 59,593$ Project Costs Financed $719,524 $ 2 95,162$ (54,279)$ (4,758)$ (5,251)$ 30,875$ 29,581$ 60,456$ 59,265$ Annual Propane Usage 81,373 gal 3 96,590$ (54,550)$ (4,829)$ (5,251)$ 31,959$ 28,803$ 60,763$ 58,976$ Average Propane Price $1.15 $/gal 4 98,039$ (54,823)$ (4,902)$ (5,251)$ 33,063$ 28,046$ 61,109$ 58,725$ Dry Wood Chip Usage 675 tons/yr 5 99,509$ (55,097)$ (4,975)$ (5,251)$ 34,186$ 27,309$ 61,495$ 58,510$ Year 1 Dry Wood Chip Price $80 $/ton 6 101,002$ (55,372)$ (5,050)$ (5,251)$ 35,329$ 26,591$ 61,919$ 58,331$ Annual Propane Usage w/ Wood System 4,069 gal 7 102,517$ (55,649)$ (5,126)$ (5,251)$ 36,491$ 25,892$ 62,383$ 58,186$ Fossil Fuel Escalation Rate (apr) 1.5% Percent 8 104,055$ (55,927)$ (5,203)$ (5,251)$ 37,674$ 25,211$ 62,885$ 58,073$ Wood Fuel Escalation Rate (apr) 0.5% Percent 9 105,616$ (56,207)$ (5,281)$ (5,251)$ 38,877$ 24,548$ 63,425$ 57,992$ Real Discount Rate (apr) 1.0% Percent 10 107,200$ (56,488)$ (5,360)$ (5,251)$ 40,101$ 23,903$ 64,004$ 57,942$ Inflation Rate (apr) 2.7% Percent 11 108,808$ (56,771)$ (5,440)$ (5,251)$ 41,346$ 41,346$ 37,059$ Added Annual O&M Costs for Biomass Plant $5,251 $/year 12 110,440$ (57,054)$ (5,522)$ (5,251)$ 42,612$ 42,612$ 37,816$ Thermal Production Incentive $30,380 $/year 13 112,096$ (57,340)$ (5,605)$ (5,251)$ 43,901$ 43,901$ 38,574$
14 113,778$ (57,626)$ (5,689)$ (5,251)$ 45,212$ 45,212$ 39,332$ 15 115,485$ (57,915)$ (5,774)$ (5,251)$ 46,545$ 46,545$ 40,091$ 16 117,217$ (58,204)$ (5,861)$ (5,251)$ 47,901$ 47,901$ 40,851$ 17 118,975$ (58,495)$ (5,949)$ (5,251)$ 49,280$ 49,280$ 41,611$ 18 120,760$ (58,788)$ (6,038)$ (5,251)$ 50,683$ 50,683$ 42,372$ 19 122,571$ (59,082)$ (6,129)$ (5,251)$ 52,110$ 52,110$ 43,134$ 20 124,410$ (59,377)$ (6,220)$ (5,251)$ 53,561$ 53,561$ 43,896$ 21 126,276$ (59,674)$ (6,314)$ (5,251)$ 55,037$ 55,037$ 44,659$ 22 128,170$ (59,972)$ (6,409)$ (5,251)$ 56,538$ 56,538$ 45,423$ 23 130,093$ (60,272)$ (6,505)$ (5,251)$ 58,065$ 58,065$ 46,187$ 24 132,044$ (60,573)$ (6,602)$ (5,251)$ 59,617$ 59,617$ 46,953$ 25 134,025$ (60,876)$ (6,701)$ (5,251)$ 61,196$ 61,196$ 47,719$
25-year Net Present Value 501,745$
Note: All values are in real dollars.
WES ● Wilson Engineering Services, PC C.8

Appendix C Option 2 - Pellet Boiler using Dry ChipsFuel Cost Sensitivity Analysis
Ely Bloomenson Community HospitalEly, MN
29,809$ $0.75 $1.00 $1.15 $1.25 $1.50 $1.75 $2.00$20 $39,225 $58,551 $70,315 $77,877 $97,203 $116,529 $135,855$30 $32,474 $51,800 $63,564 $71,126 $90,452 $109,778 $129,104$40 $25,723 $45,049 $56,813 $64,375 $83,701 $103,027 $122,353$50 $18,972 $38,298 $50,062 $57,624 $76,950 $96,276 $115,602$60 $12,221 $31,547 $43,311 $50,873 $70,199 $89,525 $108,851$70 $5,470 $24,796 $36,560 $44,122 $63,448 $82,774 $102,100$80 ($1,281) $18,045 $29,809 $37,371 $56,697 $76,023 $95,349$90 ($8,032) $11,294 $23,058 $30,620 $49,946 $69,272 $88,598
$100 ($14,784) $4,543 $16,307 $23,869 $43,195 $62,521 $81,847$110 ($21,535) ($2,209) $9,556 $17,118 $36,444 $55,770 $75,096$120 ($28,286) ($8,960) $2,804 $10,366 $29,692 $49,019 $68,345$130 ($35,037) ($15,711) ($3,947) $3,615 $22,941 $42,267 $61,594$140 ($41,788) ($22,462) ($10,698) ($3,136) $16,190 $35,516 $54,842$150 ($48,539) ($29,213) ($17,449) ($9,887) $9,439 $28,765 $48,091
*Notes: All other costs fixed. Excludes financing costs. Excludes thermal production incentive.
Table Shows Sensitivity of Annual Operating Savingsto Changes in Fossil Fuel and Wood Fuel Prices*
Fossil Fuel Price, $/gal
Price
of D
ry W
ood
Chip
s - $
/ton
WES ● Wilson Engineering Services, PC C.9

Appendix C Option 3 - Pellet Boiler25-year Cash Flow Analysis
Ely Bloomenson Community HospitalEly, MN
Input Variables Value Units Year Total Fossil Fuel
Cost, Current System
Wood Fuel Cost
Fossil Fuel Cost w/ Wood
System
Added O&M Cost
Net Operating
Savings
Thermal Production Incentive
Net Cash Flow
Present Value of Net
Cash Flow
Project Costs Financed $519,500 $ 0 -$ -$ -$ -$ -$ -$ (519,500)$ (519,500)$ Grant Amount $0 $ 1 93,756$ (94,343)$ (4,688)$ (3,764)$ (9,039)$ 30,007$ 20,968$ 20,760$ Project Costs Financed $519,500 $ 2 95,162$ (94,815)$ (4,758)$ (3,764)$ (8,174)$ 29,218$ 21,043$ 20,629$ Annual Propane Usage 81,373 gal 3 96,590$ (95,289)$ (4,829)$ (3,764)$ (7,292)$ 28,450$ 21,157$ 20,535$ Average Propane Price $1.15 $/gal 4 98,039$ (95,765)$ (4,902)$ (3,764)$ (6,392)$ 27,702$ 21,309$ 20,478$ Pellet Usage 457 tons/yr 5 99,509$ (96,244)$ (4,975)$ (3,764)$ (5,474)$ 26,974$ 21,499$ 20,456$ Year 1 Pellet Price $206 $/ton 6 101,002$ (96,725)$ (5,050)$ (3,764)$ (4,537)$ 26,264$ 21,727$ 20,468$ Annual Propane Usage w/ Wood System 4,069 gal 7 102,517$ (97,209)$ (5,126)$ (3,764)$ (3,582)$ 25,574$ 21,992$ 20,512$ Fossil Fuel Escalation Rate (apr) 1.5% Percent 8 104,055$ (97,695)$ (5,203)$ (3,764)$ (2,607)$ 24,902$ 22,295$ 20,589$ Wood Fuel Escalation Rate (apr) 0.5% Percent 9 105,616$ (98,183)$ (5,281)$ (3,764)$ (1,613)$ 24,247$ 22,634$ 20,695$ Real Discount Rate (apr) 1.0% Percent 10 107,200$ (98,674)$ (5,360)$ (3,764)$ (599)$ 23,609$ 23,011$ 20,831$ Inflation Rate (apr) 2.7% Percent 11 108,808$ (99,168)$ (5,440)$ (3,764)$ 436$ 436$ 390$ Added Annual O&M Costs for Biomass Plant $3,764 $/year 12 110,440$ (99,664)$ (5,522)$ (3,764)$ 1,490$ 1,490$ 1,323$ Thermal Production Incentive $30,007 $/year 13 112,096$ (100,162)$ (5,605)$ (3,764)$ 2,566$ 2,566$ 2,254$
14 113,778$ (100,663)$ (5,689)$ (3,764)$ 3,662$ 3,662$ 3,186$ 15 115,485$ (101,166)$ (5,774)$ (3,764)$ 4,780$ 4,780$ 4,118$ 16 117,217$ (101,672)$ (5,861)$ (3,764)$ 5,920$ 5,920$ 5,049$ 17 118,975$ (102,180)$ (5,949)$ (3,764)$ 7,082$ 7,082$ 5,980$ 18 120,760$ (102,691)$ (6,038)$ (3,764)$ 8,267$ 8,267$ 6,911$ 19 122,571$ (103,205)$ (6,129)$ (3,764)$ 9,474$ 9,474$ 7,842$ 20 124,410$ (103,721)$ (6,220)$ (3,764)$ 10,705$ 10,705$ 8,773$ 21 126,276$ (104,239)$ (6,314)$ (3,764)$ 11,959$ 11,959$ 9,704$ 22 128,170$ (104,760)$ (6,409)$ (3,764)$ 13,237$ 13,237$ 10,635$ 23 130,093$ (105,284)$ (6,505)$ (3,764)$ 14,540$ 14,540$ 11,565$ 24 132,044$ (105,811)$ (6,602)$ (3,764)$ 15,867$ 15,867$ 12,496$ 25 134,025$ (106,340)$ (6,701)$ (3,764)$ 17,220$ 17,220$ 13,427$
25-year Net Present Value (209,893)$
Note: All values are in real dollars.
WES ● Wilson Engineering Services, PC C.10

Appendix C Option 3 - Pellet Boiler25-year Cash Flow Analysis with 25% Grant
Ely Bloomenson Community HospitalEly, MN
Input Variables Value Units Year Total Fossil Fuel
Cost, Current System
Wood Fuel Cost
Fossil Fuel Cost w/ Wood
System
Added O&M Cost
Net Operating
Savings
Thermal Production Incentive
Net Cash Flow
Present Value of Net
Cash Flow
Project Costs Financed $519,500 $ 0 -$ -$ -$ -$ -$ -$ (389,625)$ (389,625)$ Grant Amount $129,875 $ 1 93,756$ (94,343)$ (4,688)$ (3,764)$ (9,039)$ 30,007$ 20,968$ 20,760$ Project Costs Financed $389,625 $ 2 95,162$ (94,815)$ (4,758)$ (3,764)$ (8,174)$ 29,218$ 21,043$ 20,629$ Annual Propane Usage 81,373 gal 3 96,590$ (95,289)$ (4,829)$ (3,764)$ (7,292)$ 28,450$ 21,157$ 20,535$ Average Propane Price $1.15 $/gal 4 98,039$ (95,765)$ (4,902)$ (3,764)$ (6,392)$ 27,702$ 21,309$ 20,478$ Pellet Usage 457 tons/yr 5 99,509$ (96,244)$ (4,975)$ (3,764)$ (5,474)$ 26,974$ 21,499$ 20,456$ Year 1 Pellet Price $206 $/ton 6 101,002$ (96,725)$ (5,050)$ (3,764)$ (4,537)$ 26,264$ 21,727$ 20,468$ Annual Propane Usage w/ Wood System 4,069 gal 7 102,517$ (97,209)$ (5,126)$ (3,764)$ (3,582)$ 25,574$ 21,992$ 20,512$ Fossil Fuel Escalation Rate (apr) 1.5% Percent 8 104,055$ (97,695)$ (5,203)$ (3,764)$ (2,607)$ 24,902$ 22,295$ 20,589$ Wood Fuel Escalation Rate (apr) 0.5% Percent 9 105,616$ (98,183)$ (5,281)$ (3,764)$ (1,613)$ 24,247$ 22,634$ 20,695$ Real Discount Rate (apr) 1.0% Percent 10 107,200$ (98,674)$ (5,360)$ (3,764)$ (599)$ 23,609$ 23,011$ 20,831$ Inflation Rate (apr) 2.7% Percent 11 108,808$ (99,168)$ (5,440)$ (3,764)$ 436$ 436$ 390$ Added Annual O&M Costs for Biomass Plant $3,764 $/year 12 110,440$ (99,664)$ (5,522)$ (3,764)$ 1,490$ 1,490$ 1,323$ Thermal Production Incentive $30,007 $/year 13 112,096$ (100,162)$ (5,605)$ (3,764)$ 2,566$ 2,566$ 2,254$
14 113,778$ (100,663)$ (5,689)$ (3,764)$ 3,662$ 3,662$ 3,186$ 15 115,485$ (101,166)$ (5,774)$ (3,764)$ 4,780$ 4,780$ 4,118$ 16 117,217$ (101,672)$ (5,861)$ (3,764)$ 5,920$ 5,920$ 5,049$ 17 118,975$ (102,180)$ (5,949)$ (3,764)$ 7,082$ 7,082$ 5,980$ 18 120,760$ (102,691)$ (6,038)$ (3,764)$ 8,267$ 8,267$ 6,911$ 19 122,571$ (103,205)$ (6,129)$ (3,764)$ 9,474$ 9,474$ 7,842$ 20 124,410$ (103,721)$ (6,220)$ (3,764)$ 10,705$ 10,705$ 8,773$ 21 126,276$ (104,239)$ (6,314)$ (3,764)$ 11,959$ 11,959$ 9,704$ 22 128,170$ (104,760)$ (6,409)$ (3,764)$ 13,237$ 13,237$ 10,635$ 23 130,093$ (105,284)$ (6,505)$ (3,764)$ 14,540$ 14,540$ 11,565$ 24 132,044$ (105,811)$ (6,602)$ (3,764)$ 15,867$ 15,867$ 12,496$ 25 134,025$ (106,340)$ (6,701)$ (3,764)$ 17,220$ 17,220$ 13,427$
25-year Net Present Value (80,018)$
Note: All values are in real dollars.
WES ● Wilson Engineering Services, PC C.11

Appendix C Option 3 - Pellet BoilerFuel Cost Sensitivity Analysis
Ely Bloomenson Community HospitalEly, MN
(9,039)$ $0.75 $1.00 $1.15 $1.25 $1.50 $1.75 $2.00$170 ($23,547) ($4,221) $7,543 $15,105 $34,431 $53,757 $73,083$175 ($25,834) ($6,508) $5,256 $12,818 $32,144 $51,470 $70,796$180 ($28,122) ($8,796) $2,969 $10,531 $29,857 $49,183 $68,509$185 ($30,409) ($11,083) $681 $8,243 $27,569 $46,896 $66,222$190 ($32,696) ($13,370) ($1,606) $5,956 $25,282 $44,608 $63,934$195 ($34,983) ($15,657) ($3,893) $3,669 $22,995 $42,321 $61,647$200 ($37,270) ($17,944) ($6,180) $1,382 $20,708 $40,034 $59,360$206 ($40,129) ($20,803) ($9,039) ($1,477) $17,849 $37,175 $56,501$210 ($41,844) ($22,518) ($10,754) ($3,192) $16,134 $35,460 $54,786$215 ($44,131) ($24,805) ($13,041) ($5,479) $13,847 $33,173 $52,499$220 ($46,418) ($27,092) ($15,328) ($7,766) $11,560 $30,886 $50,212$225 ($48,706) ($29,379) ($17,615) ($10,053) $9,273 $28,599 $47,925$230 ($50,993) ($31,667) ($19,903) ($12,341) $6,986 $26,312 $45,638$235 ($53,280) ($33,954) ($22,190) ($14,628) $4,698 $24,024 $43,351
*Notes: All other costs fixed. Excludes financing costs. Excludes thermal production incentive.
Table Shows Sensitivity of Annual Operating Savingsto Changes in Fossil Fuel and Wood Fuel Prices*
Fossil Fuel Price, $/gal
Price
of P
elle
ts -
$/to
n
WES ● Wilson Engineering Services, PC C.12

Preliminary Feasibility Report Version: Final Ely Bloomenson Community Hospital Date Modified: March 31, 2017 Ely, MN
WES ● Wilson Engineering Services, PC
Appendix D – UMN Extension By-Products Program Brochure

Why Recycle?
Provide a beneficial use for products that were previously discarded in landfills
Reduce landfill costs to government and industry and improve environ-mental quality by remov-ing large volumes of by-products from concen-trated landfill disposal
Improve farm profitability by reducing fertilizer and lime costs
Contribute to environ-mental quality and soil conservation by improv-ing the economics of per-ennial forage crops as an alternative to row crops on more sensitive sites
Before any by-products are de-livered to a field, the following requirements must be met:
1. Farmer must sign and fol-low Best Management Practices (BMP's)
2. Develop a farm plan, which includes crop rota-tion
3. Mapping and soil sam-pling of fields
4. Lease agreement signed if field is rented
5. Notification to township officers prior to hauling to site
If interested in receiving any of these by-products, contact the University of Minnesota Extension Ser-vice: Carlton County, P.O. Box 307, Carlton, MN (218) 384-3511 or 1-800-862-3760, ext. 223.
If interested in receiving any of these by-products, contact the University of Minnesota Extension Ser-vice: Carlton County, P.O. Box 307, Carlton, MN (218) 384-3511 or 1-800-862-3760, ext. 223.
Carlton County
By-product Program
Resources
Troy Salzer Extension Educator, Agriculture
Dr. Carl Rosen Soil Scientist – Fertility
Dr. Tom Halbach
Water quality & Waste Mgmt
Russ Mathison Forage Specialist
Bob Olen Extension Educator, Horticulture
Dr. George Rehm U of M Soil Scientist
Paul Peterson Forage Specialist
MPCA
University Testing Labs Forestry Specialists
Animal Science Specialists University Dept on GIS/
Global Positioning
By-products Program
Wood Ash Bio-Solids
Lime

Bio-Solids
Bio-solids are rich in organic matter and will provide nitrogen, along with small amounts of phosphorus, potas-sium, and lime. Additional commer-cial fertilizer may be needed to meet soil test recommendations. Each site for bio-solids must be approved by the Minnesota Pollution Control Agency. However, not all fields qualify for bio-solids application due to soil pH, wa-ter table level, or slope. Records are kept to ensure that Best Management Practices are followed. Crops that would respond to the nitrogen in bio-solids are corn, grasses, legumes, and small grains. Bio-solids are provided by the West-ern Lake Superior Sanitary District in Duluth, and are hauled, spread, and incorporated at no charge to the farmer.
Lime We currently have three sources for by-product ag lime. The largest source is from Sappi Fine Paper of North America who delivers and spreads their lime at no cost to the farmers. This lime is made available as they produce it. The product is only pro-duced during scheduled and unsched-uled maintenance of the reclaiming kiln. The Effective Neutralizing Power (ENP) of this lime is 1300. Cutler-Magner in Superior, WI has been the first source of by-product ag lime. The ENP of this lime is 1840. Loads are delivered with a semi-end dump with loads averaging 23 tons per load. The lime is free and the price farmers pay is based on distance from the plant. Another source of by-product lime in Northeast Minnesota is from Specialty Minerals, Inc. in Cloquet. The ENP of this lime is 1600. This lime is a wet product that’s good for certain applica-tions. The lime and trucking are free to the farmer.
Benefits to participating in the
By-products Program:
Proven track record with over a
decade of beneficial reuse of by-products University research used for appli-
cation recommendations Education programs and field
days for both industries and pro-ducers to share current research data and cropping improvement technologies Unbiased 3rd party involvement Provide educational programming
to local decision makers/residents describing the research on the re-use benefits of these products. Assisting producers in developing
environmentally sound crop man-agement systems including the use of industrial by-products as soil amendments. Develop packets for individual
fields including information about land ownership, soil types, soil analysis, and determine applica-tion rates based on crop type and soil analysis. Develop, research and secure
funding for new potential uses for by-products.
Wood Ash
Recycling wood ash saves valuable landfill space and provides farmers with an excellent liming source, as well as many of the nutrients needed to increase soil fertility. Wood ash increases soil pH and adds elements to the soil, which includes potassium, phosphorus, boron, and sulfur. Wood ash is delivered at no cost, but the farmer is responsible for spreading and incorporation. There are eight local companies sup-plying wood ash. Listed below are the companies and the approximate amount of wood ash delivered annu-ally.
Tons Acres
Minnesota Power 10,000 800 Georgia-Pacific, Duluth 400 50 Ainsworth, Bemidji 10,400 1,340 Trus Joist 1,300 220 Jardon Home Brands 125 15 Sappi Cloquet LLC 20,000 2,800 Potlatch, Bemidji 400 40 DNR Fisheries 30 10 TOTALS 42,280 5,285