em-71-2 - defense technical information center · technical report em-71-2 ... at the exit of the...
TRANSCRIPT

013660
The Calibration and Description of aC. Wind-Tunnel for Studying Stratified
FlowsTechnical Report EM-71-2
WALTER R. DEBLER
RICHARD D. MONTGOMERY
December 1971 _
Office of Naval ResearchContract N00014-67-A-0181-0008
3 1v 00e4t4 To,, Department of Engineering Mechanics
Fluid Mechanics SectionRoD,.d.yod by q9
NATIONAL TECHNICALINFORMATION SERVICE
1611 "-ghold, va 221.1
a;

THE UNIVERSITY OF MICHIGAN
COLLEGE OF ENGINEERING
Department of Engineering Mechanics
Fluid Mechanics Section
Technical Report EM-71-2
ThL CALIBRATION ANID DESCRIPTION OF A WIND-TUNHEL
FOR STUDYING STRATIFIEu FLOWS
Walter R. Debler
Richard D. Montgomery
ORA Project 013660 with the
Office of Naval Research
Contract N00014-67-A-0181-0008
Under the Direction ofDetails of illus~rations InJames W. Daily this document may be bette
studied on microfiche
Walter Debler
administrated through:
OFFICE OF RESEARCH ADMINISTRATION ANN ARBOR, MICHIGAN
December 1971

TABLE OF CONTENTS
Page
List of Illustrations v
Abstract 1
Wind Tunnel Description 2
Velocity and Temperature Calibration 13
Conclusions 33
Acknowledgements 33

LIST OF ILLUSTRATIONS
Page
Fig. 1. Pictorial view of wind tunnel 3
Fig. 2. Entrance, stilling and contraction .3
sections. Six of the eleven welding
transformers are also shown.
Fig. 3. Honeycomb used in heater section. Upper, 5
is sta.inless steel for the heating elements.
Lower, is phenolic material used to guide
the air between two successive heater
stages (c.f. insert to fig. 1.).
Fig. 4. Heater section showing method of support 5
of elements by tension strips that are
insulated from heating elements by glass
tubing. One half inch brass rods to
promote interfacial mixing can be seen.
Fig. 5. Siae view of third, 10 foot test section, 8
uiffusor and exit.
Fig. 6. Wind tunnel exit and drive. 8
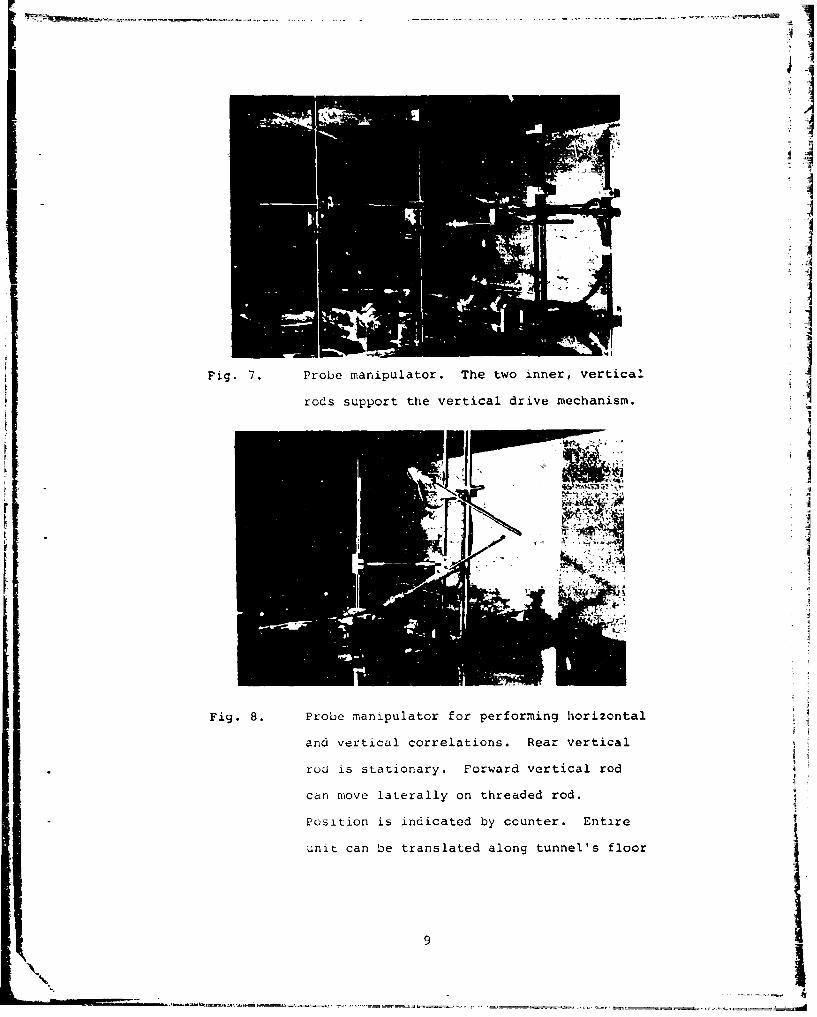
Fig. 7. Probe manipulator. The two inner, vertical 9
rods support the vertical drive mechanism.
Outer help support the horizontal bars which
carry the probes. Vertical elevation is
read from counters at the top. Platform
can be moved along the tunnel.
v

Page
Fig. 8. Probe manipulator for performing horizontal 9
and vertical correlations. Rear vertical
rod is stationary. Forward vertical rod
can move laterally on threaded rod.
Position is indicated by counter. Entire
unit can be translated along tunnel's floor.
Fig. 9. Temperature rake for sensing the undisturbed 11
temperature distribution. Rake retracts into
wall. Shadowgraph window also is visible.
Fig. 10. View of support for temperature rate (at i1
center of picture) showing guide channel
and reference ice-bath. Cement block column
supports channel in which a guide block
slides. The guide block contains the thermo-
couple terminal strip and a guide pin to
assure the position of the thermocouple
rake when ietracting it into the recesses in
the sidewall of the wind tunnel. Covered
mirror for shadowgraph visible on second,
block column.
Fig. 11. Vertical mean velocity distribution. 14
Fig. 12. Impact tube rake for measuring the free- 16
stream velocity distribution in the wind
tunnel.
Fig. 13. Lateral (or horizontal) mean velocity 17
distribution.
vi
Page
Fig. 14 a. Vertical mean temperature distribution 18
Fig. 14 b. Lateral mean temperature distribution 18
(Z increases away from viewing windows -
cf, Figure 5)
Fig. 15. Typical calibration curve for copper - 20
constantan thermocouple
Fig. 16. Typical vertical mean temperature 21
distributions
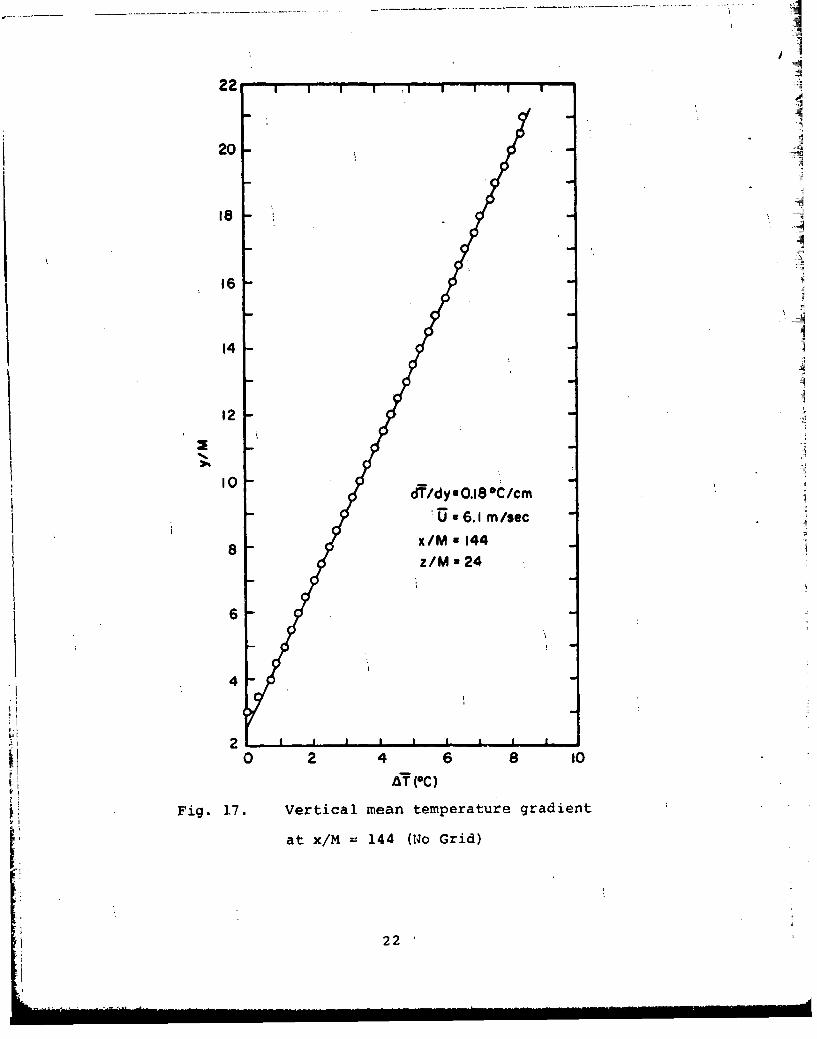
Fig. 17. Vertical mean temperature gradient 22
at x/M = 144 (No Grid)
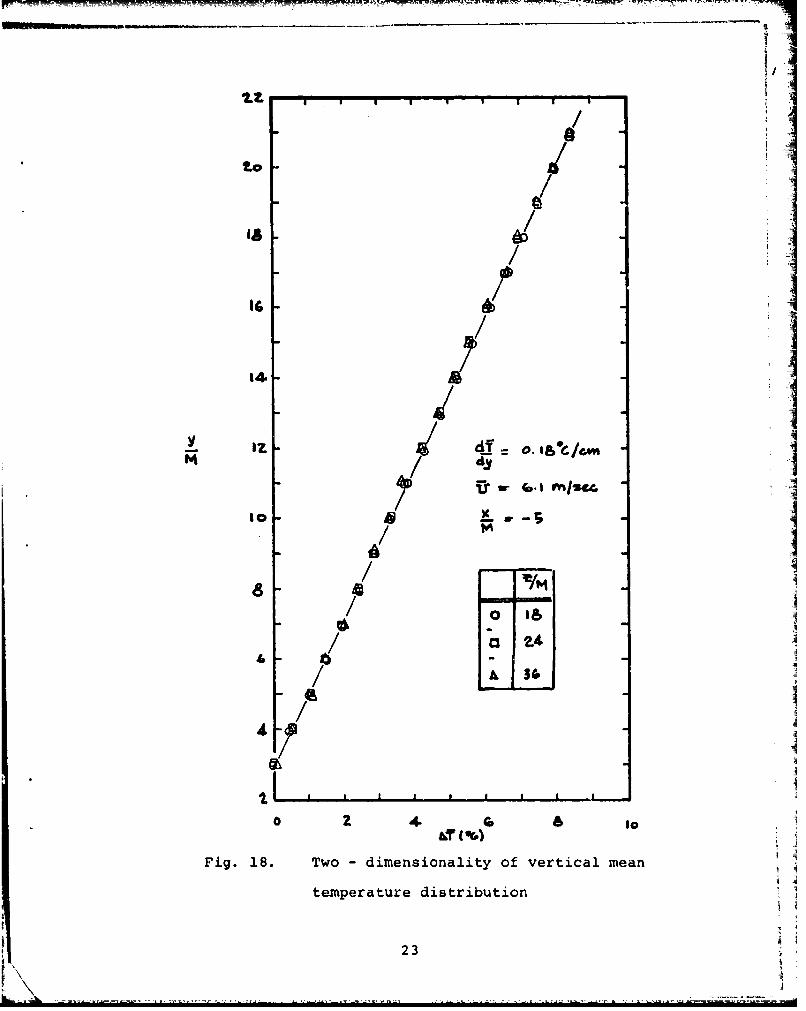
Fig. 18. Two - dimensionality of vertical mean 4I
temperature distribution
Fig. 19. Steadiness of vertical mean temperature 25r o aistribution dT/dy = 0.18 *C/cm)
Fig. 20. Steadiness of vertical mean temperature 26
distribution (dT/dy = 0.36 0C/cm)
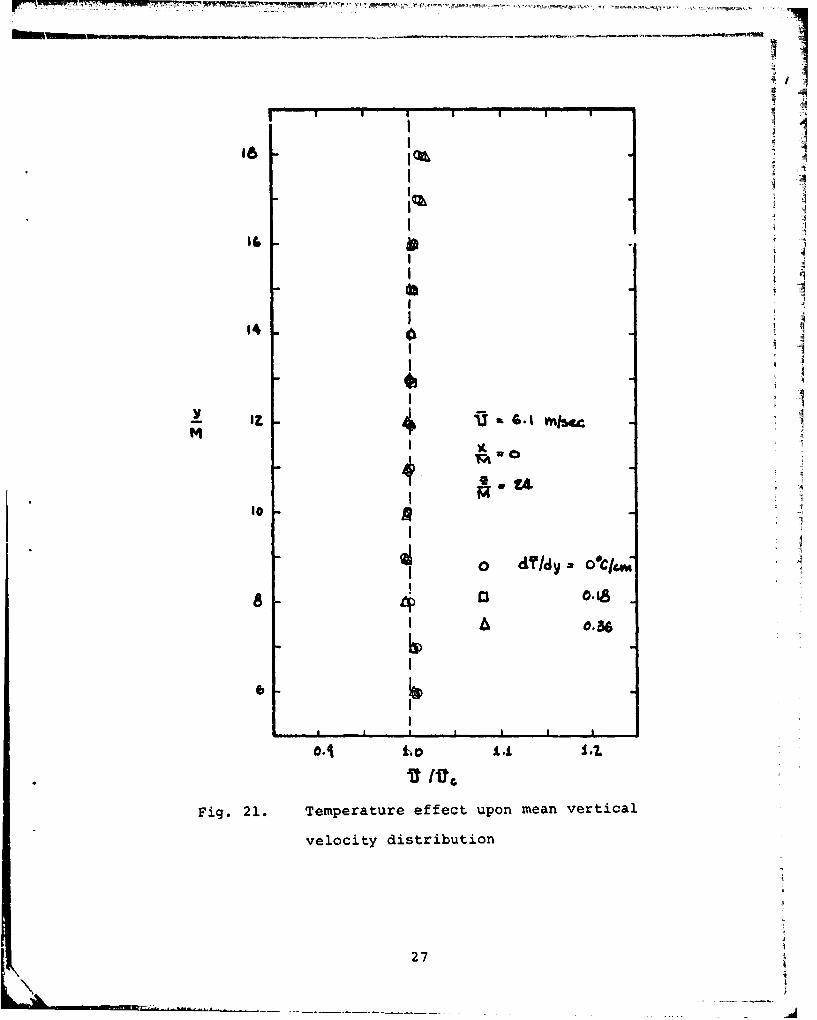
Fig. 21. Temperature effect upon mean vertical 27
velocity distribution
Fig. 22. Temperature effect upon lateral mean 28
velocity distribution
Fig. 23. Typical cold wire calibration 30
Fig. 24. R.M.S. temperature fluctuation as a functiou 31
of mean vertical mean temperature gradient
Fig. 25. Growth of temperature fluctuaLlons along 32
wind tunnel centerline (no grid)
vii
W_
ABSTRACT
A wind-tunnel is described in which the air temper-
ature can be varied in the vertical direction. The
facility is used to study stratified flows. The velocity
and temperature characteristics of the wind-tunnel were
determined through a series of calibration tests. The
results are presented herein. The performance of the
wind tunnel is considered to satisfactory for its intend
purpose.
.I
l.Wind Tunnel Description
The wind tunnel, which is described in this report, is shown
schematically in figure 1. Here one sees an open-loop wind tunnel
with a contraction ratio of 13/1. After the air has passed through the
contraction, it is heated as it continues through by some stainless-
steel, honey-comb strips. Each strip has its own source of electrical
,energy. This is supplied by a set of A. C. welding transformers. The
test section, two feet high and four feet wide, is thirty feet long. The
aluminum roof of the first segment can be heated by thermostat con-
trolled, infra-red heating elements. This was done to preserve the
temperature profile at the upper boundary. Similarly, cooling water
can be circulated through the rectangular aluminum conduits which
support the floor. The heated air leaves the wind tunnel through a
diffuser section with an inner body to guide the flow past an axial flow
fan. This unit has an attachment with which one can adjust the angle
of attack of the blades. At the exit of the fan a trumpet-shaped diffuser
directs the flow radially. It passes through a series of cooling coils
which are intended to bring the air back to room temperature. The
laboratory in which the wind tunnel stands is sufficient!y large (104
by 176 feet) and until now it has not been necessary to use these
coolers. The motor which drives the fan has a rated horsepower of
7. 5; the speed is controlled by an eddy-current coupling. This motor-
control assembly will provide for air speeds in the test section of
approximately 40 feet per second.
The details of the wind tunnel can be seen in figure 2 through
10. Figure 2 shows wind tunnel entrance (thirteen feet wide by eight
feet high). Some nylon mosquito netting is visible in the picture over
the entrance to the inlet section. There is actually two sections of
netting between which there is a sheet of polyurethane foam that was
donated by the Scott Paper Company. This serves to filter the air
and the netting supports it from behind and prevents accidental damage
2

LL
Fig. 1. Pictorial view of wind tunnel
FcniI
I _ II
Fig. 2. Entrance, stilling and contraction
sections. Six of the eleven welding
transformers are also shown.
3

I
to the foam in the front. Behind this inlet filter there is a section of
four inch deep aluminum honey-comb. The core of the honey-comb is
three-fourths of an inch, The settling chamber is built in three parts.
The first and last parts provide a thirteen by eight foot frame over which
is stretched stainless steel screen, four in total, in order to improve
the settling chamber's effectiveness. Figure 2 also shows the six, 300
ampere (100 per cent duty cycle) welding transformer which provide
the current to the second, third, fourth, fifth, sixth and seventh lowest
heating strips in the tunnel. The lowest strip is not heated. The
remaining strips are heated with 500 ampere welders. These cannot
be seen in any of the figures. One can barely observe some wheels
in the upper left hand corner of the figure. These are part of two
floor model fans that were mounted on top of the tunnel and which were
directed in front of the tunnel's inlet to improve the temperature homo-
genity of the incoming air. At the far right of the figure the vertic.tl
section of polyethylene sheeting cin be been. This serves to incapsulate
the first ten feet of the test section and thereby minimize the air leakage.
The many parts associated with heating the roof of the first section
resulted in a number of joints that permitted air to be sucked into the
tunnel.
The contraction section needs no further comment. However,
the tunnel's heat section will be described in some detail. The stainless-
steel honey-comb that was used was forty-eight inches long, two inches
high and two inches deep (i. e. in the direction of the core). A segment
of the length of one of these heating sectlons is shown in the top of
figure 3. The core size is a nominal one-quarter inch. These stainless-
steel sections were mounted in two vertical planes. Each of these two
sections had a space of two inches between each of the honey-comb strips.
They were installed in each of the sections so that a honey-comb strip
in one section was at the same horizontal level as a space in the second
heater section and vice versa. The nature of this construction can beI4

Fig. 3. Honeycomb used in heater section. Upper,
is stainless steel for the heating elements.
Lower, is phenolic material used to guide
the air between two successive heater
stages (c.f. insert to fig. 1.). i
L
00
Fig. 4. Heater section showing method of support
of elements by tension strips that are
insulated from heating elements by glass
tubing. One half inch brass rods to
promote interfacial mixing can be seen.
r " \,LI

seen in the insert figure 1. The two inch vertical space between each
heating element provides for electrical insolation but yet made the
heater appear without gaps when viewed in the direction of the tunnel
axis, Originally a one-half inch air gap (in the direction of theA
tunnel's axis) separated the two segments of the heater. The first
detailed results of the vertical temperature profile in the test sectio
indicated that some of the air might be going over and under some of
the heating strips and thereby caused some unwanted charges in the
temperature gradient. A piece of one-half inch thick fiberglass honey-
comb was inserted as a divider in the vertical air gap between the two
heating sections. This eliminated any possibility of the air moving
along a path of low resistance, and consequently low heat transfer,
illustrated in the lower half of figure 3 prior to installation. Its ther-
mal charact-ristics were tested by trying, in vain, to ignite or melt
the plastic with the flame from a match.
Figure 4 shows the he,ter assembly. At the right is a series
of welding lug connectors which are attached to svrne cne-half inch
diameter threaded brass rods which are not visible in the photograph.
These rods in turn are threaded into two inch cube3 of copper that
are brazed to the ends of the stainless steel segments. On the threaded
rods are nuts which can be tightened and thereby pre-tension the stain-
less-steel sections. However, this action did not eliminate all of the
undesirable sag in the four foot span. The solution to this problem
is shown in figure 4. It consists of a strip of stainless steel that is
inserted in the air gap between the successive honey-comb heaters.
This strip has a series of "Y-shaped" fingers spot welded to it. In
the trough of each Y iection a piece of heat resistance glass tubing
was placed. The tubing was wired to the Y section to secure it and a
separate wire through the glass tubing that restrained the heating
element. The glass tubing was necessary to provide electrical instal-
lation. The photograph shows eleven one-half inch place rods that
6
L-W
pp:i
are situated downstream of the heater so that their centers correspond
to the elevations of the tops and bottoms of the various honey-comb
strii . Since each of the honey-comb would be heated separately it
I was expected that the temperature profile of the air leaving the heater
would have a "staircase" distribution. It was intended that these rods
would provide some interfacial rnixing and to improve the linearity of
the temperature profile. Results that were obtained with this heater
.configuration will be presented shortly.
Figure 5 shows the last ten foot segment of the test section with
its oak frame construction and plexiglass windows. Beyond that there
is a diffuser, motor, and exit section with the attached coolers. These
coolers and the drive motor can also be seen in figure 6. The exit
diffuser was made from thin fiberglass sheeting that was pre-cut accord-
ing to sonr. 'eloped pattern, fastened to a light weight medal frame
and then the ims were bounded with fiberglass cloth strips and a
readily available boat-patching kit.
Some of the mechanical devices that were developed to aid in he
recording of the temperature and velocity of the air stream are shown
in the following four figures. Figure 7 shows a platform which rests
upqn the wind tunnel flow and which can be propelled over a distance
of ten feet byrmeans of the two rectangular rods which connect it to the
drive mechanism at the terminus test section. One of these rectangular
rods can be seen at the bottom left of the photograph. Attached to its
side is a ten foot length of rack that is engaged by a drive pinion at the
rear of the test section. The two pinions (one for each rectangular
rod) are driven by a .eversible drill motor, the speed of which is
admusted by a transformer. Naturally, a speed reducer has been
incorporated into the gear train. Suitable interrrediate connecting
links can be used so as to position the instrument platfornm in various
places in the tunnel. With these links in place, ten feet of adjustment
is again possible.
7
'I

MAI
Fig. 5. Side view of third, 10 foot test section,1
diffusor and exit.
INI
Fig. 6. Wind tunnel exit and drive.
I
Fig. 7. Probe manipulator. The two inner, vertical
rods support the vertical drive mechanism.
r' '
Fig. 8. Probe manipulator for performing horizontal
and vertical correlations. Rear vertical
ruj is stationary. Forward vertical rod
can move laterally on threaded rod.
Position is indicated by counter. Entire
unit can be translated along tunnel's floor
9iN- __i

The platform contains two vertical drive screws that move two
horizontal bars up and down. One can mount his iaistrumentation on
these bars. A hot wire anemometer and pitot-static are shown in the
illustration. The elevation of the horizontal bars is determined by the
counter at the top of the drive screws. These are rotated through a
gear train driven by selsen motors which are elctrically connected
to matching units outside the wind tunnel. The ability to adjust the
probes from outside the tunnel was on the one hand a great convenience
but on the other hand almost a necessity because it was not deamed wise
to open the tunnel while operating and thereby destroy the temperature
gradient that had been established. Some overheating and possible
damage to the heater may also have ensued. Figure 8 shows another
probe adjusting mechanism. This was built in order to be able to move
one probe laterally and vertically with respect to another which is at
a fixed location. Again, counters were used to determine the position.
This carriage assembly could also be moved along the tunnel access
by the rack and pinion arrangement that was described previously.
In order to specify the temperature gradient within the tunnel
prior to the air passing through a biplanar grid or past an object the
sensor shown in figure 9 was constructed. It consists of a series of
copper-constanant thermocouples which are supported by hypodermic
needles. Thermocouples are on one inch centers and after a desired
temperature gradient has been established the entire thermocouple
rake can be retracted into the tunnel's side will. The recesses for
the vertical member and hypodermic needles are visible in the photo-
graph. Also to be seen is a piece of shadowgraph quality glass that
was installed as part of an optical system for the tunnel. In figure
10 one sees a view along the side of the tunnel which was not open to
10

/
Fig. 9. Temperature rake for sensing the undisturbed
temperature distribution. Rake retracts into
wall. Shadowgraph window also is visible.l
11
Fig. 10. View of support for temperature rate (at
center of picture) showing guide channel
and reference ice-bath. Cement block column
supports channel in which a guide block
slides. The guide block contains the thermo-
couple terminal strip and a guide pin to
assure the position of the thermocouple
rake when retracting it into the recesses in
the sidewal! of the wind tunnel. Covered
mirror for shadowgraph visible on second,
block column.
iii
viewing. It is presented to show the three brick columns. The one on
the right supports a parabolic irirror with its dusk cover. The light
source for this optical system is located on the brick column in the
very left and is occluded by the stack of welders. The center column
serves as a support for a piece of aluminum channel which guides the
temperature rake when inserting it into the air stream and withdrawing
it into the wall. A hole and tapered pin assembly are part of the light
color object over the center column and align the rake properly so that
none of the thermocouples is damaged when retracting the assembly
into the side wall of the tunnel. The cold junction for the thermocouples
is also to be seen next to this aluminum channel. Only copper conduc-
tors must go from this temperature rake to the recording instrument.
12

2. The Velocity and Temperature Calibration
A series of studies were planned at a wind speed of twenty feet
per second (6.lm/sec.). In order to assure the two-dimensionality of
the flow and preservation of its characteristics at various down-stream
stations, a lengthy series of tests were conducted. The probe manipu-
lator shown in figure 7 was used to transport a one-oight inch diameter
pitot-static tube which itself had been individually calibrated, for deter-
mining the velocity field. The pressure difference was recorded on a
micromanometer. An oil at specific gravity of 1.0 was used in this
device. The gauge which measured the displacement of the incline leg
of the manometer had divisions of 0.0001 inches. The position of the
needle was interpolated between these divisions. A thermocouple
recorded the temperature of the fluid in the manometer well. A deter-
mination of the specific gravity-temperature characteristics of the fluid
was performed so that these temperature data could be included in a
computational program for specifying the field velocity. Figure 11
shows the vertical profile of the wind speed taken at two positions along
the wind tunnel axis. All of the dimensions (i.e. ]ongitudinal, x; ver-
tical, y; and lateral, z) have been non-dimensionalized with the distance
I4 which corresponded to the mesh width of a bi-planar grid that was
subsequently employed. Ni was two inches for this grid which had,
incidently, one-quarter inch stainless steel, polished rods as its ele-
ments. Figure Ii shows that the velocities have been non-dimensionalized;
Uc is the center-line velocity. No vertical temperature gradient
had been applied to the air stream for the data shown. The position x = 0
designates the plane in which it was intended to mount the grid, circular
cylinder or other test objects. The conclusion can be drawn from the
figure that fe. between 8 and 16 the velocity is constant and for
13

II
Ij
CA
Io 0
'4Z4
14-. sJ
6 I
pI p
Fig 11 etclma elct itiuin
14

between 6 and 18 it is within 99 per cent of the center-line value, even
at X of 144. It should be noted that these data were taken = 24, the
center-plane of the tunnel. One should remark here that the wind tunnel's
speed was set by referring to a retractable pitot-tube that was about
one meter ahead of the test station, x 0 0. It was determined before
hand what the pressure difference of this pitot-tube must have in order
that the speed by 6.lm/sec. at the test station.
The lateral or span-wise velocity distribution was checked by
measuring with a series of 12 hypodermic needles arranged in a rake-
line array and read, one by one, with the micromanometer. See figure 12.
A number of tests conducted previously had shown that there was no
systematic error in this rake. The only measurements shown in figure
13 are taken at the mid-height of the tunnel and at two stations along
its axis. Again no temperature gradient was applied to the air.
The speed control would sometimes not keep the fan turning at the
desired setting. Rather, the speed would wander, slightly, above
and below the prescribed setting. This may have been due to the character-
istics of the unit or to the fluctuations in the electric power that was
supplied. The speed of the drive motor was monitored by placing a 120-
tooth gear on the drive shaft and recording the fluctuations, produced
by a magnetic sensor, with a digital electronic counter. With a nominal
count of 1500/second, a variation of +25 counts/second was some'imes
observed. If the speed proved to be very erratic, tests in which a great
deal of confidence was placed were not continued. In most of the data
which follows the points represent information that was taken at or very
near a prescribed motor speed setting. If the speed wandered slightly
from the prescribed value, the observer waited until it returned to the
proper value and then recorded his observations. Often this resulted in
15
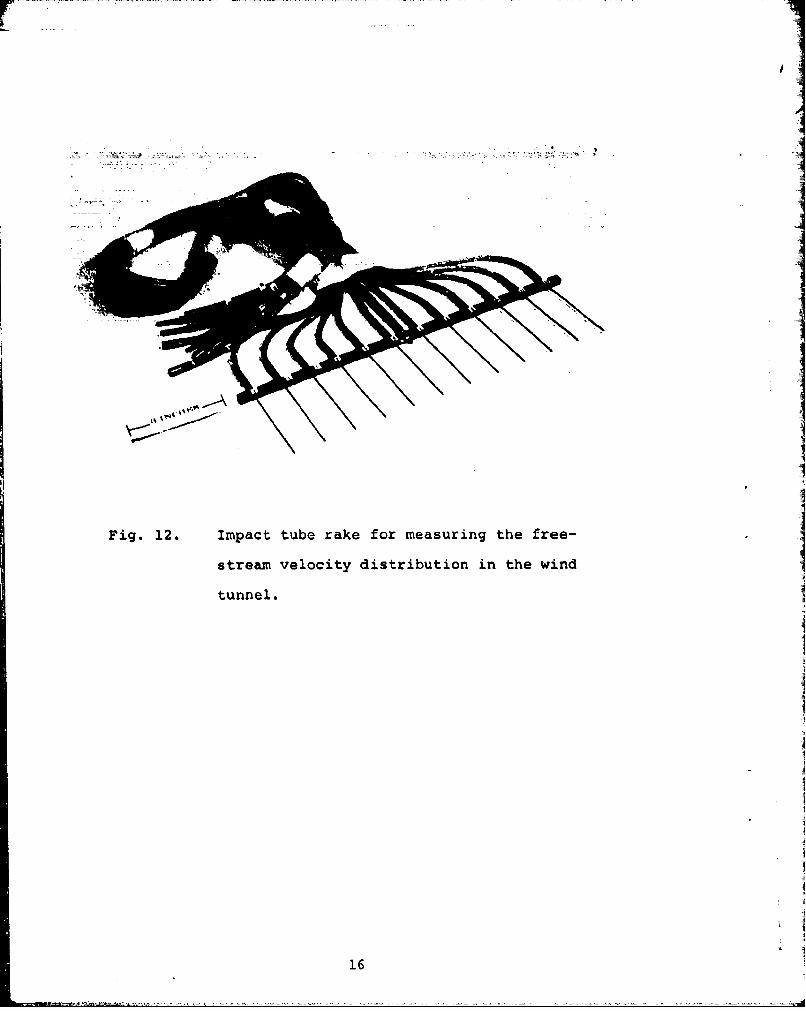
Fig 12.. Imattb aefrIesrn h re
I
oI
stream velocity distribution in the wind
tunnel.
16

4I I -
41)I -i
4 13 6.1 VAl ,aII
. I a X/,0 Ao
to 4~- 1C/MI4
Fig. 13. Lateral (or horizontal) mean velocity
distribution.
17

oo 00 "41
o ~a 0
0 d
43
44£
".4
0 0)
0 0 0
C~OQ oe~QoQF~e..e. OA
Ck w
0 0 41-

tests being twice as long as what might be expected.
In figure 14 one sees the variation of temperatures both vertically
and laterally in the tunnel without any heat being applied to the air.
The A I represents the temporature difference from that at midheiSht and
center plane for the two stations shown. The temperatures were sensed
with copper-contanant thermocouples (36 gauge wire diameter) and recorded
with a digital voltmeter. The wind tunnel tended to suck in warm air
from the ceiling of the laboratory and, in the winter, cold air from
the floor. In order to prevent the latter from being too prevalent,
one of the entrances of the laboratory near the wind tunnel was sealed
off with plywood and masking tape. The fans, shown in figure 2, were
used to promote a uniform temperature in the wind tunnel's entrance. A
typical calibration for the thermocouples is shown in figure 15. All
the thermocouples used were made from the same reel of duplex wire and
the individual performance was not calibrated, but was referred to
calibrations similar to that shown in figure 15.
The current settings on the welders which supplied the energy
to the heating strips were found by previous tests and could be set to
give an approximation to the desired temperature gradient. Subsequent
measurements by a thermocouple rake, (cf. figure 9) were used to readjust
the current settings to get the desired linearity of the temperature
distribution. Figure 16 presents such distributions. In making tempera-
ture measurements, smaller intervals than shown in figure 16 were taken
at first to assure that there were no local discontinuities in the
gradient. Experiments with the heater used in these tests showed that
the measurements on one inch intervals could be relied upon to establish
a linear temperature profile. Figure 17 shows that a desired temperature
gradient once established is convected along the tunnel in a very satisfactory
19

00
0
4.
doa
(Awl r~o IV I

e1/ /
a f
,JwI o/
I "
lcry
.0 .
1 /
24
21
LII
12
10
10 dT/dYnO.i8OC/cm
U 6.1 m /sec8 X/M v144
z/M a 24
6
4
2
0 2 4 6 8 10AT (00
Fig. 17. Vertical mean temperature gradientI;at x/M 144 (No Grid)
22
2..Z
=e . v n /-
I6 /
,B- /
%) C
14-,
Fig 18. Tw/iesoaiyo etclma
temperatur ditibto
23
/ a-
/ "-A 3
b ' I I I . . . .
o 2 4, & I
temperature distribution !
• 23 i

way.
The span-wise uniformity of temperature gradient is suggested in
figure 18. Here the temperature gradient is measured at three lateral
stations in the tunnel. Tests were made of the temperature profilez<
nearer the side walls, e.g. gof 6, 12, and 42, and they showed no
significant deviation from the data shown in the last figure.
The experiments that are anticipated in this stratified wind
tunnel often would require a great deal of time to complete. Consequently
there was a desire to learn whether or not the temperature gradient, once
set, would drift from the prescribed value. To test this possibility two
"standard", gradients were established and readings were taken over
four hour periods. The results are shown in figures 19 and 20. The'
show that the gradients can be set and readings can be taken subsequently
with confidence. It should be noted that the data in figure 19 were com-
piled after normal working hours. This was the case for most of the
tests with the wind tunnel in order to minimize the temperature distur-
bances in the laboratory due to the many people opening and closing
doors.
Because the heater is in the flow path and the heating process
could produce an effective resistance to the flow, a test was made to
find the effect of the temperature gradient on the velocity profile.
Figure 21 shows that at x = 0, and on the tunnel's center plane, there
was virtually no effect upon the vertical velocity profile by introducing
a temperature gradient. Equally well, the span-wise velocity distribution
does not appear to be influenced by the action of the heater. This
can be seen in figure 22.
Turbulence intensity in the tunnel when no structures are in
the flow was tested at an air speed of 6.lm/sec. A DISA constant-
24

r
9.0 0 'I,6 pm 4
[A i: gS4W
t/
/~/
'4-Z4
./M /
.1 4-'U
Fig. 19. Steadiness of vertical mean temperature
distribution dT/dy 0.18 C/cm)
25

too
0 4' 20 m
14 a/
to a
/T .! o. 36 C/lcwI
8 / G.Mi jsec
II ~u0
0 1 4 11 10 1z 14 I U I I I b I I
Fig. 20. Steadiness of vertical mean temperature
distribution (dTr/dy =0.36 *C/cn)
26
16i I
14
I , i
II
10
i0
6
I K.
OA 0
veloo 'Id otibto
I I I I
Fig. 21. Temperature effect upon mean vertical
velocity distribution
27 I'
I

/
b.I I I I I I I
t6 II C
£~ M- 4. " "., &.I mjse.I K w
Fi. 2. Tepraueefetupnltea mea
veoct distribution
'28
I I I - 12
velcit dsrbtondrdV /r
28
* ~ I
temperature anemometer (SS DOS) was used with a DISA 55A25 probe
having a 5 micron, platinum plated tungsten wire. A Ball, ,tein R.M.S.
meter was used in this connection. A value of 0.07 per cent was found.
The best wind tunnels have lower values but in view of the method of
heating this background turbulence level was considered satisfactory.
The temperature fluctuations within the wind tunnel were determined by
means of a resistant thermometer. This consisted of a silver-platinum
(Wollestan process) wire, soldered to the tips of a hot-wire probe that
was operated in the constant current mode. The wire was first etched
in a jet of nitric acid through which a small current flowed. The
6ilver was deplated from a wire over a length of about two millimeters
and left a platinum filament of this length. This platinum wire had a
diameter of one micron and, depending upon its exact length, a resistance
of about 400 Ohms. The uire was operated with a current of less than
a milliampere and its resistance measured with the potentiometer. The
voltage impressed across this temperature sensor was amplified. The
D.C. component was read with a high impedance voltmeter. The oscil-
lating component was further amplified with a A.C. amplifier having a
frequency response down to two Hertz. This latter amplifier provided
a signal from which the temperature fluctuations, R.M.S. values and other
Ainformation could be gathered. A calibration of a typical resistance ther-
mometer is shown in figure 23. The effect of the temperature gradient
on the amount of temperature fluctuations, R.M.S. value is shown in
figure 2,4 The fluctuations at a given point increase with the temperature
gradient and there appears to be some growth if the air particles move
along the wind tunnel. Data similar to that shown in the last figure is
presented in figure 25. One can infer from these results that at any given
temperature gradient the temperature fluctuation approach some asymptotic value.
29

39 MA'
'S1
.54
to
e-4*La
300

0.6
Ox/M 0
0.5 V 360 72A 144
0.4
A
0.3 U ' 6.1 m/secCD y/M a 12
0 z/M a 24
02
0.1
00 0.1 0,2 0.3 0.4
dT/dy (0C/cm)
Fig. 24. R.M.S. temperature fluctuation as a function
of mean vertical mean temperature gradient
31 I

0
0
o -
.4o) .e..
4.1uo
4J
0
0d
324.
3. Conclusions
The wind tunnel that was constructed appears to perform
exceedingly well over the range of design parameters. The most
obvious deficiency is the speed control which under some circum-
stances caused the tests to be greatly protracted. The velocity and
temperature profiles that could be achieved are considered to be good.
The background turbulence level is at the upper level of what might
be considered a good normal wind tunnel (i. e. without the air heating
setter). Temperatute fluctuations also appear to be exceedingly
minor.
4. Acknowlegements
The wind tunnel described in this report was financed largely
by funds from the National Science Foundation that were part of Grant
No. G-18987 with the University of Michigan. Professor C. S. Yih of
this University was the director of that project and had the foresight
to propose its construction. Some general design features were specified
by Professor L. Garby of the University of Colorado. Mr. James P.
Ritz, a graduate student at the time of the building of the facility, was
outstanding in all phases of his work. At one stage he overtook com-
plete supervision of the construction while one of the authors was
enjoying a postdoctoral fellowship. Many subsequent modifications,
including the construction of the third segment of the test section,
rebuilding of the heater section as well as the design and construction
of the probe manipulators were financed by the Office of Naval Research
on Contract N00014-67-A-0181-0008. They also supported the exten-
sive calibration that are described in this report.
33