em 8526 • revised january 2005 blueberry economicsarec.oregonstate.edu/oaeb/files/pdf/em8526.pdfem...
TRANSCRIPT
EM 8526 • Revised January 2005
Blueberry EconomicsThe Costs of Establishing and Producing Blueberries
in the Willamette Valley

Page 2
Blueberry Economics:The Costs of Establishing and Producing Blueberries
in the Willamette ValleyBart Eleveld, Bernadine Strik, Karen DeVries, and Wei Yang
*
INTRODUCTION
*Bart Eleveld, Extension agricultural economist; Bernadine Strik, Extension horticulture specialist; Karen DeVries,
student assistant, Oregon State University; and Wei Yang, Extension horticulturist, NWREC.
Willamette Valley1 blueberry production hasincreased dramatically between 1991 and2004. Figure 1, on the next page, shows thatin 1990 there were 1,450 acres of blueberriesharvested in the Willamette Valley. By 2003,the acreage of harvested blueberries hadincreased to 3,000. This represents a 107percent increase in acreage over a 14-yearperiod. The relationship of blueberry pricesper pound to total production in theWillamette Valley is illustrated on the nextpage in Figure 2. The price for each yearrepresents the average price received in theWillamette Valley. The “average” reflectshand-picked and machine-picked blueberriesfor fresh and processed markets. This studyestimates costs for a well-managed, newlyestablished, 20-acre blueberry planting in theWillamette Valley.1
This study was carried out primarily for thebenefit of new and potential blueberryproducers. However, established growers,especially those who are expanding theiracreage, also may find this a useful tool forbudgeting and comparison purposes. Theobjectives of the study are to estimate theeconomic costs and returns associated withblueberry production and the cash flowsrequired to establish a new blueberry plantingin the Willamette Valley. While these twoobjectives sound similar, they require twovery different approaches.
In the next section of this study, enterprisebudgets for blueberry establishment andproduction are developed to estimateeconomic costs and returns. The MississippiState Budget Generator, Version 6.0, wasused to design these budgets. (1) Enterprisebudgets include variable costs for items suchas fertilizer, labor, and fuel, as well as suchfixed costs as depreciation, interest, and landcharges. These budgets are useful incomparing the economic profitability ofblueberries with alternative farm and non-farm investments.
The cash-flow section of the study examinesonly the cash requirements of establishing anew blueberry planting. In this section, cashexpenses include operating expenditures foritems such as fertilizer, labor, and fuel. Inaddition, purchases of capital assets areincluded to illustrate the total cash flowsrequired for a new blueberry planting. Cash-flow analysis is used strictly to examine theflow of funds in the blueberry planting andprovides no information as to profitability.The basic idea of a cash-flow budget is toallow a manager to plan for financing andgain control over the cash position of theblueberry enterprise.

Page 3
Oregon Blueberry Harvested Acreage1990 - 2003
0
500
1000
1500
2000
2500
3000
3500
1990 1991 1992 1993 1994 1995 1996 1997 1998 1999 2000 2001 2002 2003
Year
Har
vest
ed A
cres
Figure 1. Harvested acres of blueberries in the Willamette Valley, 1990–2003.Source: Extension Economics Office, Dept. of Ag. & Res. Econ., 2004.
Oregon Blueberry Production and Price1990 - 2003
0
5000
10000
15000
20000
25000
30000
35000
1990 1991 1992 1993 1994 1995 1996 1997 1998 1999 2000 2001 2002 2003
Year
Pro
du
ctio
n (
tho
us.
lb)
0
10
20
30
40
50
60
70
80
90
100
Wei
gh
ted
Ave
. P
rice
(C
ents
/lb)
Production (000 lbs) Weighted Ave. Price Fresh & Processed (cents/lb)
Figure 2. Production and prices of blueberries in the Willamette Valley, 1990–2003.Source: Extension Economics Office, Dept. of Ag. & Res. Econ., 2004.

Page 4
ASSUMPTIONS
Many individuals were involved in this study,including growers, university researchers, andExtension staff. Throughout the study, anumber of broad assumptions were made toprovide a common basis for analysis. Thefollowing costs, practices, and materials willnot be applicable to all situations in everyproduction year. Cultural practices, materials,and production costs vary by grower, anddifferences can be significant. The practicesand inputs in this publication serve as a guide.
First, the ground was idle (summer fallow)and is prepared in the fall (year 0) and plantedthe following spring. Land is assumed to beshifted from other agricultural production toblueberries. We assume that a water deliverysystem that includes water rights alreadyexists on the land. To revise and maintain theirrigation system will cost $1,100 per acre.Also, all prices for capital assets andresources are in 2004 dollar values. This landis leased on a long-term basis for $400 peracre, on a cash-rent basis.
The field is 20 acres in size with a plantspacing of 3 feet by 10 feet, allowing formachine harvest. The blueberry planting isexpected to be in full production for 25 yearsfollowing 6 years of establishment. For themature planting, there are two separatebudgets. One budget is for fields that areharvested by machine only. The other budgetis for fields that are hand picked. For themachine harvest budget, 100 percent of theproduction is sold to the processor. For thehand-picked budget, 90 percent of productiongoes to the fresh market and 10 percent ofproduction is machine harvested for clean-upand goes to the processed market. The matureyield for hand harvest culminates at 18,000 lb.per acre, with the yields in establishmentstarting from 20 percent of the mature level inyear 3, increasing to the mature yield in 20percent annual increments. In machineharvesting it is assumed there is more
dropped or unharvested fruit, so we set themature yield at 16,000 lb. per acre. The yieldsand markets assumed for the early productionyears in this study are as follows:
Table 1. Progression of blueberry yieldsthrough the establishment period.Year Total Fresh Processed
(lb.) (lb.) (lb.) 3 3,600 3,600 0 4 7,200 7,200 0 5 10,800 10,800 0 6 14,400 14,400 0Full (hand) 18,000 16,200 1,800Full (mach) 16,000 0 16,000
Hand harvest is used predominantly forestablishment years to capture higher valuesof fresh market berries. The yields assumedare considered a good average for blueberryplantings with similar operations performedand resources used in the Willamette Valley.
All labor used in establishment andproduction is valued at $10 per hour. Thiswage rate may be thought of as the net cost togrowers for hired labor paid a cash wage of$7.50 per hour, with an additional $2.50 perhour for payroll expenses (withholding taxes,recordkeeping, preparing W-2 forms, etc.).
Alternatively, this wage rate can represent theopportunity cost of labor provided by theblueberry grower. The individuals engaged invarious blueberry operations could have beenemployed elsewhere for $10 per hour. Ineither case, labor is a resource used and mustbe paid. The cash-flow analysis assumes alllabor is hired as a cash expense.
Machinery and equipment operation costs arebased on agricultural engineering estimates(2). Purchase prices, salvage values, usefullives, annual hours of use, and field capacitieswere obtained from growers and machinerydealers. This budget assumes that theproducer owns a 35-horsepower tractor, a flail

Page 5
chopper, a harrow, a manure spreader, arototiller, a side dresser, an airblast sprayer,and a wagon. Ripping, plowing, bed shaping,loading sawdust mulch, grass planting, andmachine harvesting are all custom-hired jobs.
A pickup truck is driven 2,500 miles per yearfor various tasks related to the blueberryplanting. The pickup costs the operation $135per acre per year, not including the driver’slabor. A general overhead charge of $20 peracre is included each year to cover officesupplies, seminars, and bookkeepingexpenses related to the blueberry planting.
Interest rates used are 8 percent for operatingcapital and 7 percent for intermediate andlong-term capital. These represent real interestrates, which are determined by subtractinginflation rates from nominal interest rates.
Real interest rates are appropriately used inevaluating the costs and returns ofestablishing blueberries over a 7-year timeperiod when price levels are held constant.Operating capital interest is treated as a cashexpense. Intermediate and long-term capital isassumed to be provided by the owner, sointerest on this capital is treated as a non-cashexpense.
Using these general assumptions, enterprisebudgets are developed in the next section foreach of the blueberry establishment and earlyproduction years, plus a typical full-production year (for both the hand-pickedand the machine-picked) that will berepresentative of the 25 years of fullproduction.
ENTERPRISE BUDGETS
An enterprise budget includes all the costsand returns associated with producing oneenterprise in some particular manner (2). Inthis study, blueberries are the enterprise, andseparate budgets are developed forestablishment, early production, and a typicalfull production year for both a machine- andhand-picked field. The budgets are presentedin an operations format in Appendix Tables1.A through 9.A, in which each operation islisted in the order it is performed. Costs are
broken down by machinery, labor, andoperating input expenses for each operation.The budgets also are given in an income andexpense format in Appendix Tables 1.Dthrough 9.D,1 in which product and inputs aregrouped by category instead of by operation.Each enterprise budget is for a calendar year,and all budgets are prepared as of the end oftheir respective years. Each budget isdiscussed in detail below.
1This unconventional numbering system is used
because it conforms with the Mississippi StateEnterprise Budgeting program used to produce thetables.

Page 6
FIELD PREPARATION YEAR 0
Summer fallow ground is diverted toblueberry production from other agriculturaluses the year preceding the planting ofblueberry bushes. We refer to thisestablishment year as Year 0 because thebushes are not planted at this time. Thebudget for Year 1 includes the first growingyear for the bushes; Year 2 is the secondgrowing year; and so on. Some productionbegins in Year 3, with full production in Year7. Costs for Year 0 are shown in AppendixTables 1.A and D.
The land selected for blueberries must be welldrained. If tiling is needed, it will costapproximately $500 per acre; none isconsidered in this study. With good soilconditions and plant maintenance, plantingsmay produce for 25 years or more. Plantingson poorly drained soils generally do poorlyand are prone to root problems. This studyalso assumes that the land has deeded waterrights and is equipped with a water deliverysystem.
In this study, a 20-acre site is chosen and landpreparation starts in August of the yearpreceding planting, beginning with anherbicide spray for weed and grass control.A custom operator rips, plows, and works thesite three times with a culti-packer (drag androll). Three drag-and-roll trips are required.Next, soil analyses are obtained for basenutrients and nematodes. These tests cost $90for the 20-acre site. If the pH is outside theideal range for blueberries (4.2 -5.5) then thesoil pH will require adjustment with eithersulfur or lime. This budget assumes that thepH is acceptable. We also are assuming nofumigation is necessary.
The permanent irrigation system is notinstalled until establishment Year 1, after theblueberries are planted. However, the sitemust be irrigated during the field preparation
year; this is accomplished using rented pipewith risers.
Sawdust generally is used as a pre-plant soilamendment and as a mulch in blueberryplantings. Growing blueberries without mulchis an option. However, we will use sawdust inthis budget, at a cost of $40 per unit (7.5cubic yards of sawdust), as it is morecommon. Three and one-half inches ofsawdust are applied in 3-foot wide strips on10-foot centers over the entire field andincorporated 10 inches deep. Preplantfertilizer (16-16-16) is banded onto the rowsand also is incorporated with a rototiller.
Operating capital interest is charged onvariable costs, based on dates the expenseswere incurred and assuming that all operatingcredit is repaid by the end of the year. Thischarge is included to reflect the cost ofborrowing operating capital, or an opportunitycost if the owner uses equity capital.
Total variable cash expense in Year 0 is$1,9262 per acre. The remaining costs arefixed, and include cash and non-cashexpenditures. Cash-fixed expense includesinsurance on machinery and equipment.Machinery and equipment needed in Year 0include a 35 horsepower tractor with a loader,a spreader, a rototiller, a drag-harrow, a two-wheel trailer, a half-ton pickup, and a spinspreader for fertilizer. Total fixed cost is$510 per acre, and total cost in Year 0 is$2,435 per acre.
2Costs and returns are rounded to the nearest dollar in
this narrative.

Page 7
ESTABLISHMENT YEAR 1
Year 1 is the planting year. Before planting,the plant spacing must be determined. At thistime, the field is flagged to mark the plantingrows, and raised beds are formed. Asindicated in the assumptions, we will plant at a3-foot by 10-foot spacing (which will give us1,452 plants per acre). This is a 33 percentincrease in the number of plants over thepreviously published budget. This is due tothe decrease in plant spacing. For informationon other spacings, refer to PNW 215,Highbush Blueberry Production Guide (3).Costs for Year 1 are shown in AppendixTables 2.A and D.
The grower must choose between bare rootand container plants, each of which typicallyare 2 years old. We assume an average costper plant of $2.60; patented or hard-to-obtaincultivars may cost more. Containerized plantstake longer to plant. For this study, weassume that bare-root stock is planted.Approximately 55 bushes may be hand-planted per hour. This means plantingrequires 26.4 hours of labor per acre. Afterplanting, a trip between the rows with a dragis necessary to level it out.
The area between the rows is planted with acompanion grass seed. Before the grassemerges, an herbicide is strip-sprayed alongthe blueberry rows to kill any unwantedgrass. Additional weed control in the rows,when needed, is performed using a backpacksprayer with a hooded wand, applying 3 oz.of herbicide per acre. The grass strips aremowed 3 times in Year 1 and 10 times a yearthereafter.
During this year, a decision is made on howthe field is going to be irrigated. The twocommon choices are an above-ground, solid-set sprinkler system, or a drip system. Thecost is about the same, and personalpreference or experience generally guides thisdecision. We used an above-ground system
with 3-foot risers at a cost of $1,100 per acre.An overhead system cools the plants as wellas irrigating them and can supply greateramounts of water during hot summers. It alsocan help in providing frost protection to theplants in late winter or early spring.
The permanent irrigation system is capitalized(or amortized) over 30 years, with no salvagevalue, resulting in a capital recovery(depreciation plus interest) charge of $88.65per acre per year.
Irrigation is started as needed in summer, with1 to 1.5 inches of water applied every week. Atypical season will consist of two applicationsper week for a total of 17 waterings (sets).Beginning in Year 1, general irrigationmaintenance and miscellaneous repairs andsupplies cost $88 per acre per year. This costapplies to all future years of blueberryproduction in this study.
Ammonium sulfate is hand-applied to eachplant at a rate of 1 oz. per plant, orapproximately 91 lb. per acre (0.2 oz. N perplant, or 18 lb. actual N per acre). Thefertilizer is applied three times—in April ,May, and June—for a total of 54 lb. N/ac.Labor is 1 hour per application per acre.
A 2-inch deep sawdust mulch, 3 feet wide on10-foot centers, is then applied to the field.Each 1 inch of sawdust applied to the fieldrepresents 40 cubic yards (5.3 units) ofsawdust per acre. Year 1 operations end witha dormant spray of a copper fungicide at therate of 2 lb. per acre.
General labor, miscellaneous, management,and operating expenses are included asdiscussed for the Year 0 budget. Totalvariable cost for Year 1 is $6,436 per acre.Fixed costs at $626 are nearly the same asYear 0 for all costs except machinery andequipment depreciation, interest, and

Page 8
insurance and interest on investment.Machinery and equipment expenses increasedue to increased machinery use during theyear. Total cost in Year 1 is $7,062.
The budgets for the individual establishmentyears do not show or reflect an interest costfor the expenses invested in previousestablishment years. This legitimate
opportunity cost will be calculated in asummary table that simultaneously calculatesthe interest opportunity costs on previousyears’ expenses and at the same timecalculates the amortized capitalization cost forthe entire establishment process, which mustbe recovered during all the years the maturestand is in production (see Tables 2 and 3).
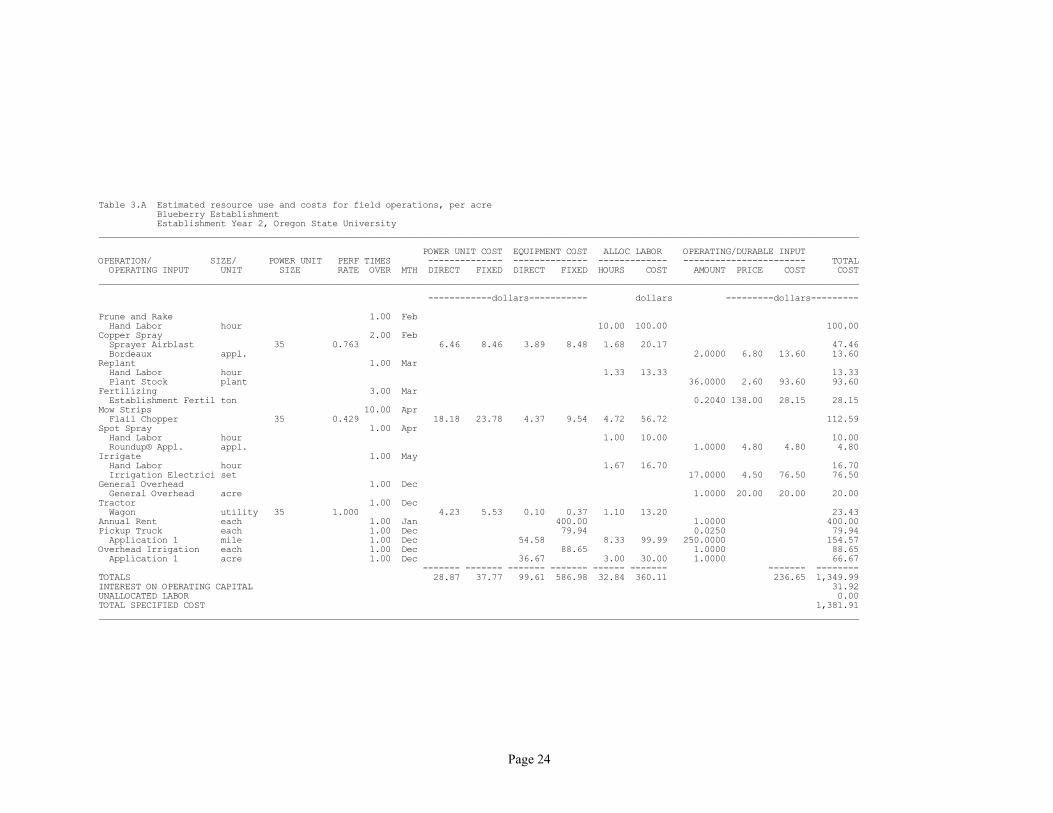
ESTABLISHMENT YEAR 2
The enterprise budget for Year 2 is shown inAppendix Tables 3.A and D. The bushes arepruned to remove unwanted canes and flowerbuds. The clippings are then flail-mowed.Pruning in Year 2 uses hand labor at the rateof 10 hours per acre. Fall and late-wintercopper sprays are used to control disease. Weassume a plant loss of 2.5percent or 36 plantsper acre. These are replanted using 1.33hours of labor per acre.
Ammonium sulfate is hand-applied at the rateof 1.5 oz. per plant (this is 0.3 oz. of N perplant or 27 lb. N/ac. per application) or 136lb. of fertilizer product per acre perapplication. The fertilizer is applied threetimes—in April, May, and June (for a total of0.9 N/plant). Adjust N based on plantgrowth/needs, as fresh sawdust can “tie up”nitrogen.
Weeds are controlled in the planting bymowing and by using a backpack sprayer tospot-kill weeds in the blueberry rows.
The sequence and amount of water appliedthrough irrigation is the same as in Year 1.The remaining operations and variable costsare the same as Year 1, including generallabor, miscellaneous expenses, management,and operating-capital interest. Total variablecost in establishment Year 2 is $757 per acre.
Fixed costs are calculated the same as in Year1. No new equipment is purchased in Year 2.Total fixed cost in Year 2 is $625 per acre.The total budgeted cost for establishmentYear 2 is $1,382 per acre.
ESTABLISHMENT YEAR 3
During the third establishment year, a trellissystem is constructed consisting of woodenend-posts with metal in-row posts and twowires, at a cost of $700 per acre for materials,plus 30 hours of labor per acre to install. Thematerials cost is amortized over a 30-year life,for an annual depreciation and interest cost of$56.41. This trellis will improve machineharvest efficiency and also has been shown tobe of advantage in hand-picked fields of somecultivars.
The same basic cultural operations areperformed as in Year 2, with the followingexceptions: The dormant copper sprays areapplied in October and February at anincreased rate of 6 lb. per acre. Because ofincreased plant size, pruning now takes 40hours per acre.
There may be three to five spring fungicidalsprays to control mildew, mummy berry, andbotrytis. The rate is 2 lb. of material per sprayapplication, with the weather determining the

Page 9
number of sprays. This study will assumefour spring applications.
Fertilizer is still applied three times per yearas before, but now it is banded with a side-dress applicator. Ammonium sulfate (or urea,depending on pH) is applied at a total rate of100 lb. of nitrogen per acre (assumingsawdust mulch is used), or 475 lb. of productper acre. This is split into threeapplications—each in April, May, and June.Again, adjust fertilizer N based on plant needsor growth, as fresh sawdust can “tie up” N.Every 4 to 5 years, a soil nutrient analysisshould be taken to monitor soil pH andnutrients. Also, tissue analysis is done everyother year to determine whether the plants aredeficient in any nutrients. Currently, tissueanalysis is $32.50 per sample. Two or threetissue analyses should be taken from the site.If a problem is suspected, then more samplesshould be analyzed. We will assume twotissue analyses for this study.
Production begins in Year 3, so beehives haveto be rented to ensure adequate pollination.Three hives per acre are required, at a cost of$30 per hive. Bird control also begins in Year3. Various control methods may be used; in
this study, scare-eye balloons and a propanecannon are used. When production begins,200 12-quart picking buckets need to bepurchased. These can be purchased for $2.50each and are treated as an operating expensein Year 3. We also will replace 25 percent ofthe picking buckets during each productionyear. Cost of hand harvest is 40 cents perpound, which includes labor, fieldmanagement, and so on.
One assumption made was that 100 percentof the blueberries would be sold to the freshmarket. The selling price of the blueberries is85 cents per pound for this mid-seasoncultivar, net of any brokerage ortransportation costs. This study assumes thatthe growers find their own markets.
A description of the variable costs for Year 3is shown in Appendix Table 5.A and D. Totalvariable cost for Year 3 is $3,029 per acre,with harvest costs accounting for about 50percent of that amount, at $1,440 per acre.Total fixed cost is $719 per acre. Totaloperating and establishment cost in Year 3 is$3,747 per acre. Income from blueberry salesof $3,060 reduces that figure to $687 (netprojected return = $-687).
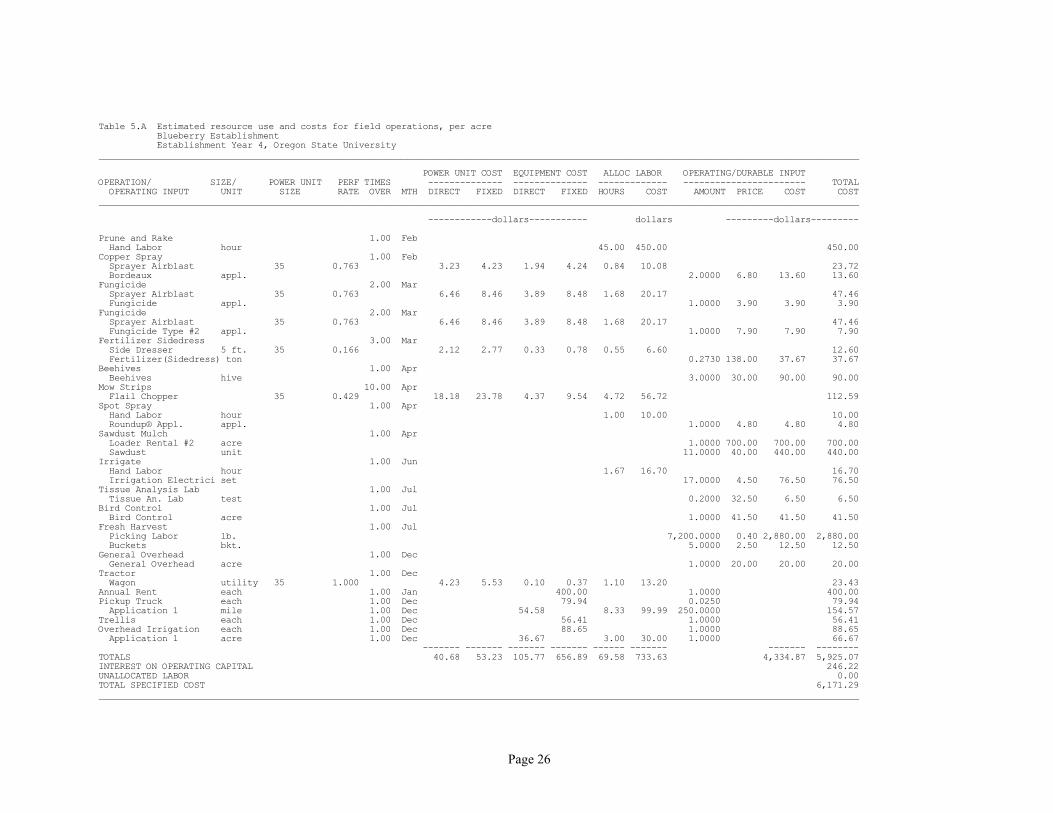
ESTABLISHMENT YEARS 4–6
The operation and maintenance of theblueberry planting in Years 4 to 6 are verysimilar to the changes implemented in Year 3.Appendix Tables 5, 6, and 7A and 5, 6, and7D show the costs and returns ofestablishment for years 4, 5, and 6,respectively. A change that takes place as theblueberry planting matures is the increase inthe nitrogen fertilizer requirement to 115 lb.N in Year 4; 120 lb. N in Year 5; and 140 lb.N in Year 6. As in previous years, adjustfertilizer N based on plant needs or growth.Pruning costs gradually increase from year3 through year 6, taking 45 hours, 50, and 55hours from years 4 through 6, respectively.Three beehives per acre are needed to ensure
adequate pollination. Field managementshould be maintained, and any plant disorderor insect problem should be taken care ofimmediately.
There are several changes from year to yearas the planting matures. The main change isthe increase in yield, as indicated previously.Income and harvest costs reflect the increasein production. Also, sawdust mulch is appliedon the planting at a rate of 2 inches, or 11units, every third year. Since sawdust was lastapplied in establishment year 1, it should beapplied again in establishment year 4. Thisrate continues throughout full production.

Page 10
Total cost for Years 4, 5, and 6 is $6,171,$6,510, and $8,051, respectively, per acre.This cost is offset by returns of $6,120,$9,180, and $12,240 per acre, respectively, fora net annual gain of -$51, $2,670, and $4,189per acre respectively. Now it is time to add inthe opportunity cost for having the capital tiedup for 7 years of establishment before fullproduction begins.
Tables 2 and 3 show the accumulation ofgross revenues, expenses (including theinterest or opportunity cost of investing in theblueberry planting), and net returns throughthe 7 years of establishment. Table 2 adds arepresentative full production year for a hand-picked field, and Table 3 does the same for amachine-picked field. The budgets andpractices for these full production years willbe described in the next section of thenarrative.
Total establishment cost is $9,225 per acre atthe end of the 7-year establishment period.This amount is the same whether the matureplanting is machine-picked or hand-picked infull production, and it represents the total
economic cost of establishing a blueberryplanting. Notice the line labeled “Interestcarryover from previous years.” The sum ofthe six amounts is equal to $4,467, but itreally amounts to more than that because theinterest compounds from one year to the nextin the “Cumulative gain (loss)” row. Whenthe cumulative loss from the last year ofestablishment ($9,225) is amortized over thelife of the stand in full production (25 years),the result is an annual payment ($792) thatwill “pay off” or recover—with interest—thenet loss or investment of the establishmentperiod. This annual payment is factored intothe profit calculation in both Tables 2 and 3 toarrive at the net annual profit during the fullproduction or mature years, to be discussedbelow.
Table 2 is extracted from an Excelspreadsheet that is available from the authorsof this bulletin. This spreadsheet is a tool thatallows its user to search for either the price oryield that will allow producers to break even,or just exactly cover all costs, over theproductive life of the planting.

Page 11
Table 2. Summary of establishment cost and full production, hand-picked blueberries, Willamette Valley.

Page 12
Table 3. Summary of establishment cost and full production, machine-picked blueberries, Willamette Valley.

Page 13
MATURE YEARS
The final enterprise budgets for mature yearsare shown in Appendix Tables 8 and 9, A andD. These budgets present the typical costsand returns expected from a well-managed,mature, 20-acre blueberry planting.
There are two different mature-year budgets.The machine-picked budget assumes that allfruit is machine-harvested and sold in theprocessed market. The hand-picked budgetassumes that 90percent of the production ishand-picked and sold in the fresh market, andthe remaining 10 percent is “cleaned up” bymachine harvest and sold to a processor.
In both budgets, annual irrigationrequirements are assumed to be 30 inches ofwater per year (two sets per week for2 inches of water per week). Also, the2 inches (11 units) of sawdust mentioned inestablishment year 4 needs to be appliedevery 3 years, but since we calculate only onebudget to represent every full production year,this cost is annualized in these budgets.
Pruning is now assumed to take 48 hours formachine-picked fields and 60 hours per acrefor hand-picked fields. Nitrogen fertilizationhas been increased to 160 lb. N/acre dividedinto three applications, as described forprevious years. The long-term yield expectedfrom hand-harvested fields is 18,000 poundsper acre; for machine harvested fields, 16,000pounds per acre. The expected price receivedis 85 cents per pound for fresh berries and 50cents per pound for processed berries. Totalreturn expected is $8,000 per acre for themachine-picked field and $14,670 per acrefor the (90%) hand-picked budget. Totalvariable cost for the hand-picked budget is$8,910 per acre. The return over variable costis $5,761 per acre. For machine-pickedberries, although the returns are significantlylower, this is largely offset by a greatlyreduced harvest cost. Instead of an average
harvest cost of 37 cents per pound in hand-picked, machine harvest (and transportation)costs only 13 cents per pound. Returns overvariable costs for machine harvest are $4,052per acre. Assuming all variable costs are paidin cash, the “return over variable cost”amounts represent funds available to payfixed costs of insurance, depreciation, interest,taxes, and the cost recovery or amortization ofthe blueberry establishment.
The total fixed cost of $1,519 per acre is thesame for both harvesting methods, since theharvesting machinery is custom-hired, notowned. The amortized establishment cost of$762 per acre is based on the netestablishment cost of $9,225 per acre,amortized at 7 percent for 25 years—theestimated “life” of the blueberry planting.This charge represents the annual paymentrequired to repay a loan taken out to establishan acre of blueberries. If the establishmentcosts are paid using the owner's capital, thecharge represents an annual recovery of theprincipal invested in establishing the plantingand the foregone interest the owner couldhave earned in alternative investments madeinstead of establishing blueberries.
The net projected return over all costs is$4,242 per acre for hand-picked and $2,533for machine-picked. This indicates that ablueberry yield of 9 tons per acre for hand-harvested or 8 tons for machine-harvestedblueberries is sufficient to pay the full costsof production for either harvestingtechnology. The ultimate market for theblueberries, either fresh or processed, willdetermine the amount of money to be made orlost in producing a blueberry planting.
Our fixed costs include interest on operatingcapital at 8 percent and on all durable capital,including cumulative establishment costs, at7 percent. In addition, we have included

Page 14
expenses for all labor and capital. If you arewilling to accept a lower rate of return onyour capital, or you value your labor andmanagement at lower rates, you may achieve along-term economic profit earlier from yourblueberry planting. Also, the prices or yieldsyou achieve may increase or reduce yourreturns. Throughout this study, we attemptedto use conservative estimates of costs andinclude all typical operations. We did notinclude an opportunity cost for managementin our budget. Thus the net expected returnjust quoted represents a residual return tomanagement and the willingness to bear risk.
Your costs may be lower than those budgetedin this study, again allowing you to achieve alarger long-term profit. Finally, this analysisignores any tax advantages associated withowning a blueberry planting.
A 10-foot row spacing was selected so thatmachine picking could be utilized. Machinepicking is a more cost-efficient method toharvest blueberries, but the berries can be soldonly to a fruit processor, which results in alower price received. Use of this row spacingallows flexibility between harvesting methods.
A positive aspect of this analysis is thatblueberry returns are greater than variablecosts beginning in Year 3 of establishment.Figure 3 below shows graphically theaccumulation of net returns at assumed pricesand yields. The lower line includes allopportunity costs, including interest, forfunds invested or “tied up” in the process ofestablishing the planting. The upper lineincludes only the recovery of principalexpended in establishment and not anyopportunity cost or interest. The principalcosts are recovered in the first full productionyear, and when the interest opportunity costsare included, full recovery of costs occurs inthe second year of full production.
As mentioned earlier, the Excel templatesshown in Tables 2 and 3 are designed to solve
for break-even price, holding assumed yieldsconstant, or visa versa. The numerical searchprocedure shows that a fresh market price of64.4 cents per pound would allow theproducers to just exactly cover all their costs.This analysis assumes the price for processedberries will decline proportionately in thesame percentage from starting assumptions asthe fresh market berries.
Since production of the baby crop starts wellbefore full production years, the yield break-even calculation must assume that baby cropyields change proportionately with maturecrop yields. Keeping this in mind, the long-run yield required to break even, assuming theprice remains at the originally assumed level,is 9,917 lb. per acre—only a little over one-half of the assumed yield. The reader maywonder why the break-even yield isproportionately so much lower relative to theassumed level than the break-even pricerelative to its initially assumed level. Thereason is that varying the blueberry price hasno affect on costs of production. When yieldsare allowed to vary, however, remember thatharvest costs are proportional to yield. Thus,when yield is reduced, variable costs ofproduction will go down as well. Figure 4below shows the cumulative gain curve wheneither price or yield is set at its break-evenlevel. By definition, the full cost-recovery linecomes back to exactly zero at the end of theproductive life of the planting.For machine-picked berries, break-evenprocessed berry price is 38.3 cents per pound,and the break-even yield is 10,531 lb. peracre.
The template used for Tables 2 and 3 alsocalculates some standard investment analysismeasures for the planting, which take intoaccount the “time value of money.” In otherwords, funds invested or committed today areunavailable for investment in alternativeinvestments and must earn an opportunitycost.

Page 15
The “internal rate of return” measurecalculates the interest rate that makes thepresent value (or time-discounted value) of allcosts or negative returns exactly equal to thepresent value of all positive returns over theentire life of the investment. For the hand-picked berries, this rate of return is 21.4percent if one can assume that all net-positivereturns can be re-invested at the same 21.4percent as is realized in the project. This maybe unrealistic for many producers. Analternative measure, sometimes called the“real rate of return,” calculates the interestrate earned if net positive returns can be re-invested only at the specified discount rate (7percent in this case). That real rate of return is11.9 percent for the hand-picked blueberries.
The equivalent rates are somewhat lower formachine-picked berries.
An alternative investment evaluation is tocalculate how many dollars the investor wouldbe equally willing to accept today rather thanrealizing the budgeted costs and returns fromthe proposed investment. This is called a“Net Present Value” (NPV). At the assumedopportunity cost of 7 percent, the NPV forhand-picked berries is $30,784; for machine-picked. it is $18,383. These figures also maybe converted into an annual payment (orannuity) that would be an acceptablealternative to the proposed investment. Forhand-picked, the annual equivalent is $2,434;for machine-picked it is $1,454.

Page 16
Figure 3. Cumulative net returns, hand-picked blueberries at assumed prices and yields.
Figure 4. Cumulative net returns, hand-picked blueberries at break-even price or yield.

Page 17
CASH-FLOW ANALYSIS
The enterprise budgets presented indicate theeconomic costs and returns of establishingand producing 20 acres of blueberries. Thesecosts include cash costs as well as non-cashcosts. The costs of fixed assets were spreadover their useful lives in the form ofdepreciation and interest.
In analyzing the feasibility of establishing anew blueberry planting, estimated cash-flowrequirements also are important for planningcash needs and borrowing. Most lendersrequire a projected cash-flow statement toaccompany loan applications.
A summary of the total cash flows required toestablish 20 acres of blueberries is shown inAppendix Table 10 and represented heregraphically in Figure 3. This cash-flowprojection summarizes the cash income andexpenditures throughout the establishmentperiod and a few years into full production.Returns are received beginning in Year 3 andincrease each year following. Returns per acreare multiplied by 20 acres to estimate totalreturns.
Operating costs are taken from the enterprisebudgets for Years 0 through 6 ofestablishment as well as the full productionyears. We have assumed that all variablecosts, including labor and management, arecash expenses. Your variable cash expensesmay be less than the values shown if youprovide all or part of the labor andmanagement required. Variable costs for theblueberry planting are calculated bymultiplying the variable costs per acre foreach year by 20 acres.
Cash fixed costs also are taken from theenterprise budgets. These are the costsincurred for land-lease payments. If youalready own your own land, this cash
requirement could range from the propertytax payment, if it is debt free, to the loanservice payment (principal and interest) plusproperty tax, if it is being financed. Cashfixed costs per acre are multiplied by 20 acresto calculate total cash fixed costs for theblueberry planting.
The remaining cash expenditures are used topurchase machinery and equipment. Themachinery and equipment purchases areconcentrated in the first 3 years ofestablishment. Annual cash flows arecalculated by subtracting operating costs, sitepreparation expenditures, and machinery andequipment purchases from total returns ineach year. The lighter-colored bars in Figure3 indicate that a cash deficit occurs in the first4 years. Outside cash will have to be providedby the owner or through financing not onlyduring these 4 years, but well beyond, untilthe operation can “catch up” to accumulatedcash deficits.
The cumulative cash flow shows the total cashflow in each year, including all previous cashflows. For this 20-acre planting, AppendixTable 10 and the associated darker color barsin Figure 4 show that the cash drain is at itshighest, almost $322,000, in establishmentyear 3 (16,100/acre). It is not until the secondfull year of production that a positivecumulative balance is achieved. Bear in mindthat if funds need to be borrowed to cover thiscash-flow deficit, the interest payments on thedebt will add to the cash requirement andextend the length of time required to get backto zero.
Obviously, anyone considering establishmentof a blueberry planting will need access to aconsiderable amount of cash.

Page 18
Figure 5. Annual and cumulative cash requirements for a 20-acre blueberry planting.
SUMMARY
Establishing a blueberry planting requires alarge investment of time and money. Basedon a number of assumptions, we estimate thateconomic establishment costs amount toapproximately $9,225 per acre for a 20-acreblueberry planting. Before full production isachieved in Year 7, well over $300,000 in cashwill be needed to finance the blueberryplanting establishment costs.
After the blueberry planting reaches fullproduction, selling 90 percent fresh at 85cents and 10 percent to the processor at 50cents per pound will result in positive netprojected returns over all economic costs.Selling 100 percent of berries to theprocessor at 50 cents per pound also willresult in a positive net projected return over alleconomic costs. Using our assumptions, fullproduction costs will be covered at a 9,917 lb.
production level with prices at assumed levels.If production is fixed at the 18,000 lb.assumed level, a fresh market price of 64.4cents per lb. will totally cover all costs. Theseresults point out that management of theplanting and marketing the blueberries will bethe keys to paying off the establishmentcosts.
In this study, income taxes are ignored. Allcosts and returns are estimated on a before-tax basis. If you are considering blueberries,check with an agricultural tax accountant todetermine potential tax implications for yoursituation, and incorporate these factors intoyour own cost-and-return analysis.
The analysis shows that blueberries arepotentially a very profitable crop. Perhaps thatexplains the nearly continuous increase in

Page 19
Oregon and Northwest blueberry acreageover the past several decades. However, itshould be noted that this study assumes thatthe land selected for establishment is ideal. Ifinstallation of drain tiles, fumigation, pHadjustment, or a water delivery system arerequired, costs will increase considerably.Also, growers will need very good
management, as presented in this publication,to obtain the yields presented here. Theblueberry industry ultimately must recognizethat productive American agriculture has thecapability of producing the profit out of anycommodity. In order to keep this ride going,new and expanded markets for the crop willhave to be developed.

Page 20
REFERENCES
1. Agricutural and Resource Economics Department. Oregon Agricultural InformationNetwork, Web site. Oregon State University Extension Service, 2004. http://ludwig.arec.orst.edu/econinfo/ .
2. Cross, Tim, and Bart Eleveld. Understanding and Using Enterprise Budgets, Oregon StateUniversity Extension Service publication EM 8354 (Corvallis, 1988). No charge for singlecopy; order from Dept. of Agricultural and Resource Economics, Oregon State University,Ballard Extension Hall 213, Corvallis, OR 97331-3601.
3. Doughty, Chas. C., E. Blain Adams, and Lloyd W. Martin, Highbush Blueberry ProductionIn Washington and Oregon. Washington, Oregon, and Idaho Extension Service publicationPNW 215. Single copy $1 plus 25 cents shipping and handling; order from PublicationOrders, Extension and Experiment Station Communications, Oregon State University, 422Kerr Administration, Corvallis, OR 97331-2119.
4. Laughlin, David, and Stan Spurlock. Mississippi State Budget Generator (ComputerProgram). Department of Agricultural Economics, Mississippi State University. Programand documentation available from Web site at:http://www.agecon.msstate.edu/laughlin/msbginfo.php

Page 21
APPENDIX

Page 22
Table 1.A Estimated resource use and costs for field operations, per acre Blueberry Establishment Year 0, Oregon State University _______________________________________________________________________________________________________________________________________________
POWER UNIT COST EQUIPMENT COST ALLOC LABOR OPERATING/DURABLE INPUT OPERATION/ SIZE/ POWER UNIT PERF TIMES -------------- -------------- ------------- ----------------------- TOTAL OPERATING INPUT UNIT SIZE RATE OVER MTH DIRECT FIXED DIRECT FIXED HOURS COST AMOUNT PRICE COST COST_______________________________________________________________________________________________________________________________________________
------------dollars----------- dollars ---------dollars--------- Herbicide Spray 1.00 Aug Sprayer Airblast 35 0.763 3.23 4.23 1.94 4.24 0.84 10.08 23.72 OPERATOR LABOR hour Herb. Roundup® gal. 0.2500 80.00 20.00 20.00Ripping 1.00 Sep Ripping acre 1.0000 10.00 10.00 10.00Plowing 1.00 Sep Plowing acre 1.0000 10.00 10.00 10.00Drag and Roll 3.00 Sep Drag and Roll acre 3.0000 6.00 18.00 18.00Soil Test 0.10 Sep Hand Labor hour 0.01 0.10 0.10 Soil Test Analysis test 0.1000 4.50 0.45 0.45Irrigate 1.00 Oct Hand Labor hour 0.10 1.00 1.00 Irrigation Electrici set 4.0000 4.50 18.00 18.00 Pipe Rental unit 0.5000 10.00 5.00 5.00Spread Sawdust 1.00 Oct Sawdust unit 19.0000 40.00 760.00 760.00 Loader Rental acre 1.0000 800.00 800.00 800.00Pre-Plant Fertilizer 1.00 Oct Manure Spreader 25 65 0.330 9.29 0.25 1.10 0.36 4.36 15.00 Pre-Plant Fertil ton 0.1250 187.00 23.38 23.38Inc. Fertilizer 1.00 Oct Rototiller 4 ft. 35 1.000 12.48 5.53 2.29 14.75 1.10 13.20 48.25General Overhead 1.00 Nov General Overhead acre 1.0000 20.00 20.00 20.00Annual Rent each 1.00 Jan 400.00 1.0000 400.00Pickup Truck each 1.00 Dec 79.94 0.0250 79.94 Application 1 mile 1.00 Dec 54.58 8.33 99.99 250.0000 154.57 ------- ------- ------- ------- ------ ------- ------- --------TOTALS 25.00 9.76 59.06 500.03 10.74 128.73 1,684.83 2,407.41INTEREST ON OPERATING CAPITAL 36.33UNALLOCATED LABOR 0.00TOTAL SPECIFIED COST 2,435.49_______________________________________________________________________________________________________________________________________________

Page 23
Table 2.A Estimated resource use and costs for field operations, per acre Blueberry Establishment Year 1, Oregon State University _______________________________________________________________________________________________________________________________________________
POWER UNIT COST EQUIPMENT COST ALLOC LABOR OPERATING/DURABLE INPUT OPERATION/ SIZE/ POWER UNIT PERF TIMES -------------- -------------- ------------- ----------------------- TOTAL OPERATING INPUT UNIT SIZE RATE OVER MTH DIRECT FIXED DIRECT FIXED HOURS COST AMOUNT PRICE COST COST_______________________________________________________________________________________________________________________________________________
------------dollars----------- dollars ---------dollars--------- Pre-Plant Fertilizer 1.00 Mar Manure Spreader 25 65 0.330 9.29 0.25 1.10 0.36 4.36 15.00 Pre-Plant Fertil ton 0.1250 187.00 23.38 23.38Rototill Rows 1.00 Mar Rototiller 4 ft. 35 1.000 12.48 5.53 2.29 14.75 1.10 13.20 48.25Mark Fields 1.00 Mar Field Flags bundle 10.0000 1.00 10.00 10.00Plant Stock 1.00 Mar Hand Labor hour 26.40 264.00 264.00 Plant Stock plant 1,452.0000 2.60 3,775.20 3,775.20 Bed Shaping acre 1.0000 250.00 250.00 250.00Drag Field 1.00 Mar Harrow 6 ft. 35 0.500 10.37 2.77 0.07 0.34 0.55 6.60 20.15Plant Grass 1.00 Apr Grass Seed acre 1.0000 13.00 13.00 13.00 Planter Rental acre 1.0000 5.00 5.00 5.00Strip Spray 1.00 Apr Sprayer Airblast 35 0.763 11.48 4.23 1.94 4.24 0.84 10.08 31.97 Pre-Emerge Herbicide acre 1.0000 30.00 30.00 30.00Irrigate 1.00 Apr Hand Labor hour 1.67 16.70 16.70 Irrigation Electrici set 17.0000 4.50 76.50 76.50Fertilizing 3.00 Apr Hand Labor hour 6.00 60.00 60.00 Establishment Fertil ton 0.1282 138.00 17.70 17.70Sawdust Mulch 1.00 Apr Sawdust unit 11.0000 40.00 440.00 440.00 Loader Rental #2 acre 1.0000 700.00 700.00 700.00Spot Spray 1.00 May Hand Labor hour 1.00 10.00 10.00 Roundup® Appl. appl. 1.0000 4.80 4.80 4.80Mow Strips 3.00 Jul Flail Chopper 35 0.429 13.70 7.13 1.31 2.86 1.41 17.02 42.02Copper Spray 1.00 Nov Sprayer Airblast 35 0.763 11.48 4.23 1.94 4.24 0.84 10.08 31.97 Bordeaux appl. 1.0000 6.80 6.80 6.80General Overhead 1.00 Dec General Overhead acre 1.0000 20.00 20.00 20.00Tractor 1.00 Dec Wagon utility 35 1.000 12.48 5.53 0.10 0.37 1.10 13.20 31.68Annual Rent each 1.00 Jan 400.00 1.0000 400.00Pickup Truck each 1.00 Dec 79.94 0.0250 79.94 Application 1 mile 1.00 Dec 54.58 8.33 99.99 250.0000 154.57Overhead Irrigation each 1.00 Dec 88.65 1.0000 88.65 Application 1 acre 1.00 Dec 36.67 3.00 30.00 1.0000 66.67 ------- ------- ------- ------- ------ ------- ------- --------TOTALS 81.28 29.42 99.15 596.49 52.61 555.23 5,372.38 6,733.95INTEREST ON OPERATING CAPITAL 377.21UNALLOCATED LABOR 0.00TOTAL SPECIFIED COST 7,061.66_______________________________________________________________________________________________________________________________________________
Page 24
Table 3.A Estimated resource use and costs for field operations, per acre Blueberry Establishment Establishment Year 2, Oregon State University _______________________________________________________________________________________________________________________________________________
POWER UNIT COST EQUIPMENT COST ALLOC LABOR OPERATING/DURABLE INPUT OPERATION/ SIZE/ POWER UNIT PERF TIMES -------------- -------------- ------------- ----------------------- TOTAL OPERATING INPUT UNIT SIZE RATE OVER MTH DIRECT FIXED DIRECT FIXED HOURS COST AMOUNT PRICE COST COST_______________________________________________________________________________________________________________________________________________
------------dollars----------- dollars ---------dollars--------- Prune and Rake 1.00 Feb Hand Labor hour 10.00 100.00 100.00Copper Spray 2.00 Feb Sprayer Airblast 35 0.763 6.46 8.46 3.89 8.48 1.68 20.17 47.46 Bordeaux appl. 2.0000 6.80 13.60 13.60Replant 1.00 Mar Hand Labor hour 1.33 13.33 13.33 Plant Stock plant 36.0000 2.60 93.60 93.60Fertilizing 3.00 Mar Establishment Fertil ton 0.2040 138.00 28.15 28.15Mow Strips 10.00 Apr Flail Chopper 35 0.429 18.18 23.78 4.37 9.54 4.72 56.72 112.59Spot Spray 1.00 Apr Hand Labor hour 1.00 10.00 10.00 Roundup® Appl. appl. 1.0000 4.80 4.80 4.80Irrigate 1.00 May Hand Labor hour 1.67 16.70 16.70 Irrigation Electrici set 17.0000 4.50 76.50 76.50General Overhead 1.00 Dec General Overhead acre 1.0000 20.00 20.00 20.00Tractor 1.00 Dec Wagon utility 35 1.000 4.23 5.53 0.10 0.37 1.10 13.20 23.43Annual Rent each 1.00 Jan 400.00 1.0000 400.00Pickup Truck each 1.00 Dec 79.94 0.0250 79.94 Application 1 mile 1.00 Dec 54.58 8.33 99.99 250.0000 154.57Overhead Irrigation each 1.00 Dec 88.65 1.0000 88.65 Application 1 acre 1.00 Dec 36.67 3.00 30.00 1.0000 66.67 ------- ------- ------- ------- ------ ------- ------- --------TOTALS 28.87 37.77 99.61 586.98 32.84 360.11 236.65 1,349.99INTEREST ON OPERATING CAPITAL 31.92UNALLOCATED LABOR 0.00TOTAL SPECIFIED COST 1,381.91_______________________________________________________________________________________________________________________________________________

Page 25
Table 4.A Estimated resource use and costs for field operations, per acre Blueberry Establishment Establishment Year 3, Oregon State University _______________________________________________________________________________________________________________________________________________
POWER UNIT COST EQUIPMENT COST ALLOC LABOR OPERATING/DURABLE INPUT OPERATION/ SIZE/ POWER UNIT PERF TIMES -------------- -------------- ------------- ----------------------- TOTAL OPERATING INPUT UNIT SIZE RATE OVER MTH DIRECT FIXED DIRECT FIXED HOURS COST AMOUNT PRICE COST COST_______________________________________________________________________________________________________________________________________________
------------dollars----------- dollars ---------dollars--------- Prune and Rake 1.00 Feb Hand Labor hour 40.00 400.00 400.00Copper Spray 2.00 Feb Sprayer Airblast 35 0.763 6.46 8.46 3.89 8.48 1.68 20.17 47.46 Bordeaux appl. 2.0000 6.80 13.60 13.60Fungicide 2.00 Mar Sprayer Airblast 35 0.763 6.46 8.46 3.89 8.48 1.68 20.17 47.46 Fungicide appl. 1.0000 3.90 3.90 3.90Fungicide 2.00 Mar Sprayer Airblast 35 0.763 6.46 8.46 3.89 8.48 1.68 20.17 47.46 Fungicide Type #2 appl. 1.0000 7.90 7.90 7.90Fertilizer Sidedress 3.00 Mar Side Dresser 5 ft. 35 0.166 2.12 2.77 0.33 0.78 0.55 6.60 12.60 Fertilizer(Sidedress) ton 0.2376 138.00 32.79 32.79Beehives 1.00 Apr Beehives hive 3.0000 30.00 90.00 90.00Mow Strips 10.00 Apr Flail Chopper 35 0.429 18.18 23.78 4.37 9.54 4.72 56.72 112.59Spot Spray 1.00 Apr Hand Labor hour 1.00 10.00 10.00 Roundup® Appl. appl. 1.0000 4.80 4.80 4.80Irrigate 1.00 Jun Hand Labor hour 1.67 16.70 16.70 Irrigation Electrici set 17.0000 4.50 76.50 76.50Tissue Analysis Lab 1.00 Jul Tissue An. Lab test 0.2000 32.50 6.50 6.50Bird Control 1.00 Jul Bird Control acre 1.0000 41.50 41.50 41.50Fresh Harvest 1.00 Jul Picking Labor lb. 3,600.0000 0.40 1,440.00 1,440.00 Buckets bkt. 5.0000 2.50 12.50 12.50General Overhead 1.00 Dec General Overhead acre 1.0000 20.00 20.00 20.00Tractor 1.00 Dec Wagon utility 35 1.000 4.23 5.53 0.10 0.37 1.10 13.20 23.43Annual Rent each 1.00 Jan 400.00 1.0000 400.00Pickup Truck each 1.00 Dec 79.94 0.0250 79.94 Application 1 mile 1.00 Dec 54.58 8.33 99.99 250.0000 154.57Trellis each 1.00 Dec 56.41 1.0000 56.41 Application 1 acre 1.00 May 30.00 300.00 1.0000 300.00Overhead Irrigation each 1.00 Dec 88.65 1.0000 88.65 Application 1 acre 1.00 Dec 36.67 3.00 30.00 1.0000 66.67 ------- ------- ------- ------- ------ ------- ------- --------TOTALS 43.91 57.46 107.72 661.13 95.42 993.72 1,749.99 3,613.93INTEREST ON OPERATING CAPITAL 133.35UNALLOCATED LABOR 0.00TOTAL SPECIFIED COST 3,747.28_______________________________________________________________________________________________________________________________________________
Page 26
Table 5.A Estimated resource use and costs for field operations, per acre Blueberry Establishment Establishment Year 4, Oregon State University _______________________________________________________________________________________________________________________________________________
POWER UNIT COST EQUIPMENT COST ALLOC LABOR OPERATING/DURABLE INPUT OPERATION/ SIZE/ POWER UNIT PERF TIMES -------------- -------------- ------------- ----------------------- TOTAL OPERATING INPUT UNIT SIZE RATE OVER MTH DIRECT FIXED DIRECT FIXED HOURS COST AMOUNT PRICE COST COST_______________________________________________________________________________________________________________________________________________
------------dollars----------- dollars ---------dollars--------- Prune and Rake 1.00 Feb Hand Labor hour 45.00 450.00 450.00Copper Spray 1.00 Feb Sprayer Airblast 35 0.763 3.23 4.23 1.94 4.24 0.84 10.08 23.72 Bordeaux appl. 2.0000 6.80 13.60 13.60Fungicide 2.00 Mar Sprayer Airblast 35 0.763 6.46 8.46 3.89 8.48 1.68 20.17 47.46 Fungicide appl. 1.0000 3.90 3.90 3.90Fungicide 2.00 Mar Sprayer Airblast 35 0.763 6.46 8.46 3.89 8.48 1.68 20.17 47.46 Fungicide Type #2 appl. 1.0000 7.90 7.90 7.90Fertilizer Sidedress 3.00 Mar Side Dresser 5 ft. 35 0.166 2.12 2.77 0.33 0.78 0.55 6.60 12.60 Fertilizer(Sidedress) ton 0.2730 138.00 37.67 37.67Beehives 1.00 Apr Beehives hive 3.0000 30.00 90.00 90.00Mow Strips 10.00 Apr Flail Chopper 35 0.429 18.18 23.78 4.37 9.54 4.72 56.72 112.59Spot Spray 1.00 Apr Hand Labor hour 1.00 10.00 10.00 Roundup® Appl. appl. 1.0000 4.80 4.80 4.80Sawdust Mulch 1.00 Apr Loader Rental #2 acre 1.0000 700.00 700.00 700.00 Sawdust unit 11.0000 40.00 440.00 440.00Irrigate 1.00 Jun Hand Labor hour 1.67 16.70 16.70 Irrigation Electrici set 17.0000 4.50 76.50 76.50Tissue Analysis Lab 1.00 Jul Tissue An. Lab test 0.2000 32.50 6.50 6.50Bird Control 1.00 Jul Bird Control acre 1.0000 41.50 41.50 41.50Fresh Harvest 1.00 Jul Picking Labor lb. 7,200.0000 0.40 2,880.00 2,880.00 Buckets bkt. 5.0000 2.50 12.50 12.50General Overhead 1.00 Dec General Overhead acre 1.0000 20.00 20.00 20.00Tractor 1.00 Dec Wagon utility 35 1.000 4.23 5.53 0.10 0.37 1.10 13.20 23.43Annual Rent each 1.00 Jan 400.00 1.0000 400.00Pickup Truck each 1.00 Dec 79.94 0.0250 79.94 Application 1 mile 1.00 Dec 54.58 8.33 99.99 250.0000 154.57Trellis each 1.00 Dec 56.41 1.0000 56.41Overhead Irrigation each 1.00 Dec 88.65 1.0000 88.65 Application 1 acre 1.00 Dec 36.67 3.00 30.00 1.0000 66.67 ------- ------- ------- ------- ------ ------- ------- --------TOTALS 40.68 53.23 105.77 656.89 69.58 733.63 4,334.87 5,925.07INTEREST ON OPERATING CAPITAL 246.22UNALLOCATED LABOR 0.00TOTAL SPECIFIED COST 6,171.29_______________________________________________________________________________________________________________________________________________

Page 27
Table 6.A Estimated resource use and costs for field operations, per acre Blueberry Establishment Establishment Year 5, Oregon State University _______________________________________________________________________________________________________________________________________________
POWER UNIT COST EQUIPMENT COST ALLOC LABOR OPERATING/DURABLE INPUT OPERATION/ SIZE/ POWER UNIT PERF TIMES -------------- -------------- ------------- ----------------------- TOTAL OPERATING INPUT UNIT SIZE RATE OVER MTH DIRECT FIXED DIRECT FIXED HOURS COST AMOUNT PRICE COST COST_______________________________________________________________________________________________________________________________________________
------------dollars----------- dollars ---------dollars--------- Prune and Rake 1.00 Feb Hand Labor hour 50.00 500.00 500.00Copper Spray 1.00 Feb Sprayer Airblast 35 0.763 3.23 4.23 1.94 4.24 0.84 10.08 23.72 Bordeaux appl. 2.0000 6.80 13.60 13.60Fungicide 2.00 Mar Sprayer Airblast 35 0.763 6.46 8.46 3.89 8.48 1.68 20.17 47.46 Fungicide appl. 1.0000 3.90 3.90 3.90Fungicide 2.00 Mar Sprayer Airblast 35 0.763 6.46 8.46 3.89 8.48 1.68 20.17 47.46 Fungicide Type#2 appl. 1.0000 7.90 7.90 7.90Fertilizer Sidedress 3.00 Mar Side Dresser 5 ft. 35 0.166 2.12 2.77 0.33 0.78 0.55 6.60 12.60 Fertilizer(Sidedress) ton 0.2850 138.00 39.33 39.33Beehives 1.00 Apr Beehives hive 3.0000 30.00 90.00 90.00Mow Strips 10.00 Apr Flail Chopper 35 0.429 18.18 23.78 4.37 9.54 4.72 56.72 112.59Spot Spray 1.00 Apr Hand Labor hour 1.00 10.00 10.00 Roundup® Appl. appl. 1.0000 4.80 4.80 4.80Irrigate 1.00 Jun Hand Labor hour 1.70 17.00 17.00 Irrigation Electrici set 17.0000 4.50 76.50 76.50Tissue Analysis Lab 1.00 Jul Tissue An. Lab test 0.0200 32.50 0.65 0.65Bird Control 1.00 Jul Bird Control acre 1.0000 41.50 41.50 41.50Fresh Harvest 1.00 Jul Picking Labor lb. 10,800.0000 0.40 4,320.00 4,320.00 Buckets bkt. 5.0000 2.50 12.50 12.50General Overhead 1.00 Dec General Overhead acre 1.0000 20.00 20.00 20.00Tractor 1.00 Dec Wagon utility 35 1.000 4.23 5.53 0.10 0.37 1.10 13.20 23.43Annual Rent each 1.00 Jan 400.00 1.0000 400.00Pickup Truck each 1.00 Dec 79.94 0.0250 79.94 Application 1 mile 1.00 Dec 54.58 8.33 99.99 250.0000 154.57Trellis each 1.00 Dec 56.41 1.0000 56.41Overhead Irrigation each 1.00 Dec 88.65 1.0000 88.65 Application 1 acre 1.00 Dec 36.67 3.00 30.00 1.0000 66.67 ------- ------- ------- ------- ------ ------- ------- --------TOTALS 40.68 53.23 105.77 656.89 74.61 783.93 4,630.68 6,271.18INTEREST ON OPERATING CAPITAL 238.98UNALLOCATED LABOR 0.00TOTAL SPECIFIED COST 6,510.16_______________________________________________________________________________________________________________________________________________

Page 28
Table 7.A Estimated resource use and costs for field operations, per acre Blueberry Establishment Establishment Year 6, Oregon State University _______________________________________________________________________________________________________________________________________________
POWER UNIT COST EQUIPMENT COST ALLOC LABOR OPERATING/DURABLE INPUT OPERATION/ SIZE/ POWER UNIT PERF TIMES -------------- -------------- ------------- ----------------------- TOTAL OPERATING INPUT UNIT SIZE RATE OVER MTH DIRECT FIXED DIRECT FIXED HOURS COST AMOUNT PRICE COST COST_______________________________________________________________________________________________________________________________________________
------------dollars----------- dollars ---------dollars--------- Prune and Rake 1.00 Feb Hand Labor hour 55.00 550.00 550.00Copper Spray 1.00 Feb Sprayer Airblast 35 0.763 3.23 4.23 1.94 4.24 0.84 10.08 23.72 Bordeaux appl. 2.0000 6.80 13.60 13.60Fungicide 2.00 Mar Sprayer Airblast 35 0.763 6.46 8.46 3.89 8.48 1.68 20.17 47.46 Fungicide appl. 1.0000 3.90 3.90 3.90Fungicide 2.00 Mar Sprayer Airblast 35 0.763 6.46 8.46 3.89 8.48 1.68 20.17 47.46 Fungicide Type #2 appl. 1.0000 7.90 7.90 7.90Fertilizer Sidedress 3.00 Mar Side Dresser 5 ft. 35 0.166 2.12 2.77 0.33 0.78 0.55 6.60 12.60 Fertilizer(Sidedress) ton 0.3324 138.00 45.87 45.87Beehives 1.00 Apr Beehives hive 3.0000 30.00 90.00 90.00Mow Strips 10.00 Apr Flail Chopper 35 0.429 18.18 23.78 4.37 9.54 4.72 56.72 112.59Spot Spray 1.00 Apr Hand Labor hour 1.00 10.00 10.00 Roundup® Appl. appl. 1.0000 4.80 4.80 4.80Irrigate 1.00 Jun Irrigation Electrici set 17.0000 4.50 76.50 76.50Tissue Analysis Lab 1.00 Jul Tissue An. Lab test 0.0200 32.50 0.65 0.65Bird Control 1.00 Jul Bird Control acre 1.0000 41.50 41.50 41.50Fresh Harvest 1.00 Jul Picking Labor lb. 14,400.0000 0.40 5,760.00 5,760.00 Buckets bkt. 5.0000 2.50 12.50 12.50General Overhead 1.00 Dec General Overhead acre 1.0000 20.00 20.00 20.00Tractor 1.00 Dec Wagon utility 35 1.000 4.23 5.53 0.10 0.37 1.10 13.20 23.43Annual Rent each 1.00 Jan 400.00 1.0000 400.00Pickup Truck each 1.00 Dec 79.94 0.0250 79.94 Application 1 mile 1.00 Dec 54.58 8.33 99.99 250.0000 154.57Trellis each 1.00 Dec 56.41 1.0000 56.41Overhead Irrigation each 1.00 Dec 88.65 1.0000 88.65 Application 1 acre 1.00 Dec 36.67 3.00 30.00 1.0000 66.67 ------- ------- ------- ------- ------ ------- ------- --------TOTALS 40.68 53.23 105.77 656.89 77.91 816.93 6,077.22 7,750.72INTEREST ON OPERATING CAPITAL 299.89UNALLOCATED LABOR 0.00TOTAL SPECIFIED COST 8,050.61_______________________________________________________________________________________________________________________________________________

Page 29
Table 8.A Estimated resource use and costs for field operations, per acre Blueberry Full Production Machine Full production years (machine), Oregon State University _______________________________________________________________________________________________________________________________________________
POWER UNIT COST EQUIPMENT COST ALLOC LABOR OPERATING/DURABLE INPUT OPERATION/ SIZE/ POWER UNIT PERF TIMES -------------- -------------- ------------- ----------------------- TOTAL OPERATING INPUT UNIT SIZE RATE OVER MTH DIRECT FIXED DIRECT FIXED HOURS COST AMOUNT PRICE COST COST_______________________________________________________________________________________________________________________________________________
------------dollars----------- dollars ---------dollars--------- Prune and Rake 1.00 Feb Hand Labor hour 48.00 480.00 480.00Copper Spray 2.00 Feb Sprayer Airblast 35 0.763 6.46 8.46 3.89 8.48 1.68 20.17 47.46 Bordeaux appl. 4.0000 6.80 27.20 27.20Fungicide 4.00 Mar Sprayer Airblast 35 0.763 12.93 16.91 7.77 16.96 3.36 40.33 94.90 Fungicide appl. 4.0000 3.90 15.60 15.60Fungicide 1.00 Mar Sprayer Airblast 35 0.763 3.23 4.23 1.94 4.24 0.84 10.08 23.72 Fungicide Type#2 appl. 1.0000 7.90 7.90 7.90Fertilizer Sidedress 3.00 Mar Side Dresser 5 ft. 35 0.166 2.12 2.77 0.33 0.78 0.55 6.60 12.60 Fertilizer(Sidedress) ton 0.3750 138.00 51.75 51.75Beehives 1.00 Apr Beehives hive 3.0000 30.00 90.00 90.00Mow Strips 10.00 Apr Flail Chopper 35 0.429 18.18 23.78 4.37 9.54 4.72 56.72 112.59Spot Spray 1.00 Apr Hand Labor hour 1.00 10.00 10.00 Roundup® Appl. appl. 1.0000 4.80 4.80 4.80Sawdust Mulch 0.33 Apr Sawdust unit 3.6300 40.00 145.20 145.20 Loader Rental #2 acre 0.3300 700.00 231.00 231.00Irrigate 1.00 Jun Hand Labor hour 2.30 23.00 23.00 Irrigation Electrici set 23.0000 4.50 103.50 103.50Tissue Analysis Lab 1.00 Jul Tissue An. Lab test 0.2000 32.50 6.50 6.50Bird Control 1.00 Jul Bird Control acre 1.0000 41.50 41.50 41.50Processed Harvest 1.00 Jul Machine Harvest lb. 16,000.0000 0.10 1,600.00 1,600.00 Load and Ship lb. 16,000.0000 0.03 480.00 480.00General Overhead 1.00 Dec General Overhead acre 1.0000 20.00 20.00 20.00Tractor 1.00 Dec Wagon utility 35 1.000 4.23 5.53 0.10 0.37 1.10 13.20 23.43Annual Rent each 1.00 Jan 400.00 1.0000 400.00Pickup Truck each 1.00 Dec 79.94 0.0250 79.94 Application 1 mile 1.00 Dec 54.58 8.33 99.99 250.0000 154.57Trellis each 1.00 Dec 56.41 1.0000 56.41Overhead Irrigation each 1.00 Dec 88.65 1.0000 88.65 Application 1 acre 1.00 Dec 36.67 3.00 30.00 1.0000 66.67Am. Establishment each 1.00 Dec 791.64 1.0000 791.64 ------- ------- ------- ------- ------ ------- ------- --------TOTALS 47.15 61.68 109.65 1,457.01 74.89 790.09 2,824.95 5,290.53INTEREST ON OPERATING CAPITAL 176.50UNALLOCATED LABOR 0.00TOTAL SPECIFIED COST 5,467.03_______________________________________________________________________________________________________________________________________________

Page 30
Table 9.A Estimated resource use and costs for field operations, per acre Blueberry Full Production (hand-harvested) Full production years (hand-harvested), Oregon State University ______________________________________________________________________________________________________________________________________________
POWER UNIT COST EQUIPMENT COST ALLOC LABOR OPERATING/DURABLE INPUT OPERATION/ SIZE/ POWER UNIT PERF TIMES -------------- -------------- ------------- ----------------------- TOTAL OPERATING INPUT UNIT SIZE RATE OVER MTH DIRECT FIXED DIRECT FIXED HOURS COST AMOUNT PRICE COST COST_______________________________________________________________________________________________________________________________________________
------------dollars----------- dollars ---------dollars---------
Prune and Rake 1.00 Feb Hand Labor hour 60.00 600.00 600.00Copper Spray 2.00 Feb Sprayer Airblast 35 0.763 6.46 8.46 3.89 8.48 1.68 20.17 47.46 Bordeaux appl. 4.0000 6.80 27.20 27.20Fungicide 4.00 Mar Sprayer Airblast 35 0.763 12.93 16.91 7.77 16.96 3.36 40.33 94.90 Fungicide appl. 4.0000 3.90 15.60 15.60Fungicide 1.00 Mar Sprayer Airblast 35 0.763 3.23 4.23 1.94 4.24 0.84 10.08 23.72 Fungicide Type#2 appl. 1.0000 7.90 7.90 7.90Fertilizer Sidedress 3.00 Mar Side Dresser 5 ft. 35 0.166 2.12 2.77 0.33 0.78 0.55 6.60 12.60 Fertilizer(Sidedress) ton 0.3750 138.00 51.75 51.75Beehives 1.00 Apr Beehives hive 3.0000 30.00 90.00 90.00Mow Strips 10.00 Apr Flail Chopper 35 0.429 18.18 23.78 4.37 9.54 4.72 56.72 112.59Spot Spray 1.00 Apr Hand Labor hour 1.00 10.00 10.00 Roundup® Appl. appl. 1.0000 4.80 4.80 4.80Sawdust Mulch 0.33 Apr Sawdust unit 3.6300 40.00 145.20 145.20 Loader Rental #2 acre 0.3300 700.00 231.00 231.00Irrigate 1.00 Jun Hand Labor hour 2.30 23.00 23.00 Irrigation Electrici set 23.0000 4.50 103.50 103.50Tissue Analysis Lab 1.00 Jul Tissue An. Lab test 0.2000 32.50 6.50 6.50Bird Control 1.00 Jul Bird Control acre 1.0000 41.50 41.50 41.50Fresh Harvest 1.00 Jul Picking Labor lb. 16,200.0000 0.40 6,480.00 6,480.00 Buckets bkt. 5.0000 2.50 12.50 12.50Processed Harvest 1.00 Jul Machine Harvest lb. 1,800.0000 0.10 180.00 180.00 Load and Ship lb. 1,800.0000 0.03 54.00 54.00General Overhead 1.00 Dec General Overhead acre 1.0000 20.00 20.00 20.00Tractor 1.00 Dec Wagon utility 35 1.000 4.23 5.53 0.10 0.37 1.10 13.20 23.43Annual Rent each 1.00 Jan 400.00 1.0000 400.00Pickup Truck each 1.00 Dec 79.94 0.0250 79.94 Application 1 mile 1.00 Dec 54.58 8.33 99.99 250.0000 154.57Trellis each 1.00 Dec 56.41 1.0000 56.41Overhead Irrigation each 1.00 Dec 88.65 1.0000 88.65 Application 1 acre 1.00 Dec 36.67 3.00 30.00 1.0000 66.67Am. Establishment each 1.00 Dec 791.64 1.0000 791.64 ------- ------- ------- ------- ------ ------- ------- --------TOTALS 47.15 61.68 109.65 1,457.01 86.89 910.09 7,471.45 10,057.03INTEREST ON OPERATING CAPITAL 371.16UNALLOCATED LABOR 0.00TOTAL SPECIFIED COST 10,428.19_______________________________________________________________________________________________________________________________________________

Page 31
Table 1.D Estimated costs and returns per acre Blueberry Establishment Year 0, Oregon State University _______________________________________________________________________
ITEM UNIT PRICE QUANTITY AMOUNT YOUR FARM_______________________________________________________________________
dollars dollars INCOME --------- TOTAL INCOME 0.00 _________ DIRECT EXPENSES Chemical Spray Herb. Roundup® gal. 80.00 0.2500 20.00 _________ Custom Charges Ripping acre 10.00 1.0000 10.00 _________ Plowing acre 10.00 1.0000 10.00 _________ Drag and Roll acre 6.00 3.0000 18.00 _________ Soil Test Analysis test 4.50 0.1000 0.45 _________ Pipe Rental unit 10.00 0.5000 5.00 _________ Loader Rental acre 800.00 1.0000 800.00 _________ Supplies Irrigation Electrici set 4.50 4.0000 18.00 _________ General Overhead acre 20.00 1.0000 20.00 _________ Sawdust Sawdust unit 40.00 19.0000 760.00 _________ Fertilizer Pre-Plant Fertilizer ton 187.00 0.1250 23.38 _________ OPERATOR LABOR Tractors hour 12.00 2.3032 27.64 _________ Pickup Truck hour 12.00 8.3325 99.99 _________ Hand Labor Special Labor hour 10.00 0.1100 1.10 _________ DIESEL FUEL Tractors gal. 1.10 3.6601 4.02 _________ GASOLINE Pickup Truck gal. 1.40 16.6650 23.33 _________ LEASE Tractors acre 1.00 8.2500 8.25 _________ REPAIR & MAINTENANCE Implements acre 4.48 1.0000 4.48 _________ Tractors acre 4.48 1.0000 4.48 _________ Pickup Truck mile 0.12 250.0000 31.25 _________ INTEREST ON OP. CAP. acre 36.33 1.0000 36.33 _________ --------- TOTAL DIRECT EXPENSES 1,925.70 _________RETURNS ABOVE DIRECT EXPENSES -1,925.70 _________ FIXED EXPENSES Implements acre 20.09 1.0000 20.09 _________ Tractors acre 9.76 1.0000 9.76 _________ Pickup Truck each 3,197.55 0.0250 79.94 _________ Annual Rent each 399.99 1.0000 400.00 _________ --------- TOTAL FIXED EXPENSES 509.79 _________ --------- TOTAL SPECIFIED EXPENSES 2,435.49 _________RETURNS ABOVE TOTAL SPECIFIED EXPENSES -2,435.49 ________________________________________________________________________________

Page 32
Table 2.D Estimated costs and returns per acre Blueberry Establishment Year 1, Oregon State University _________________________________________________________________________
ITEM UNIT PRICE QUANTITY AMOUNT YOUR FARM_________________________________________________________________________
dollars dollars INCOME --------- TOTAL INCOME 0.00 _________ DIRECT EXPENSES Chemical Spray Pre-Emerge Herbicide acre 30.00 1.0000 30.00 _________ Roundup® Appl. appl. 4.80 1.0000 4.80 _________ Bordeaux appl. 6.80 1.0000 6.80 _________ Custom Charges Bed Shaping acre 250.00 1.0000 250.00 _________ Planter Rental acre 5.00 1.0000 5.00 _________ Loader Rental #2 acre 700.00 1.0000 700.00 _________ Supplies Field Flags bundle 1.00 10.0000 10.00 _________ Irrigation Electrici set 4.50 17.0000 76.50 _________ General Overhead acre 20.00 1.0000 20.00 _________ Sawdust Sawdust unit 40.00 11.0000 440.00 _________ Fertilizer Pre-Plant Fertilizer ton 187.00 0.1250 23.38 _________ Establishment Fertil ton 138.00 0.1282 17.70 _________ Plants Plant Stock plant 2.60 1,452.0000 3,775.20 _________ Grass Seed acre 13.00 1.0000 13.00 _________ OPERATOR LABOR Tractors hour 12.00 6.2115 74.54 _________ Pickup Truck hour 12.00 8.3325 99.99 _________ Hand Labor Special Labor hour 10.00 35.0700 350.70 _________ Overhead Irrigation hour 10.00 3.0000 30.00 _________ DIESEL FUEL Tractors gal. 1.10 9.1317 10.03 _________ GASOLINE Pickup Truck gal. 1.40 16.6650 23.33 _________ LEASE Tractors acre 1.00 8.2500 8.25 _________ REPAIR & MAINTENANCE Implements acre 7.90 1.0000 7.90 _________ Tractors acre 13.50 1.0000 13.50 _________ Pickup Truck mile 0.12 250.0000 31.25 _________ Overhead Irrigation acre 36.66 1.0000 36.67 _________ INTEREST ON OP. CAP. acre 377.21 1.0000 377.21 _________ --------- TOTAL DIRECT EXPENSES 6,435.75 _________RETURNS ABOVE DIRECT EXPENSES -6,435.75 _________ FIXED EXPENSES Implements acre 27.90 1.0000 27.90 _________ Tractors acre 29.42 1.0000 29.42 _________ Pickup Truck each 3,197.55 0.0250 79.94 _________ Overhead Irrigation each 88.64 1.0000 88.65 _________ Annual Rent each 399.99 1.0000 400.00 _________ --------- TOTAL FIXED EXPENSES 625.91 _________ --------- TOTAL SPECIFIED EXPENSES 7,061.66 _________RETURNS ABOVE TOTAL SPECIFIED EXPENSES -7,061.66 ________________________________________________________________________________

Page 33
Table 3.D Estimated costs and returns per acre Blueberry Establishment Establishment Year 2, Oregon State University _______________________________________________________________________
ITEM UNIT PRICE QUANTITY AMOUNT YOUR FARM_______________________________________________________________________
dollars dollars INCOME --------- TOTAL INCOME 0.00 _________ DIRECT EXPENSES Chemical Spray Bordeaux appl. 6.80 2.0000 13.60 _________ Roundup® Appl. appl. 4.80 1.0000 4.80 _________ Supplies Irrigation Electrici set 4.50 17.0000 76.50 _________ General Overhead acre 20.00 1.0000 20.00 _________ Fertilizer Establishment Fertil ton 138.00 0.2040 28.15 _________ Plants Plant Stock plant 2.60 36.0000 93.60 _________ OPERATOR LABOR Tractors hour 12.00 7.5071 90.09 _________ Pickup Truck hour 12.00 8.3325 99.99 _________ Hand Labor Special Labor hour 10.00 14.0030 140.03 _________ Overhead Irrigation hour 10.00 3.0000 30.00 _________ DIESEL FUEL Tractors gal. 1.10 10.5100 11.56 _________ GASOLINE Pickup Truck gal. 1.40 16.6650 23.33 _________ REPAIR & MAINTENANCE Implements acre 8.36 1.0000 8.36 _________ Tractors acre 17.31 1.0000 17.31 _________ Pickup Truck mile 0.12 250.0000 31.25 _________ Overhead Irrigation acre 36.66 1.0000 36.67 _________ INTEREST ON OP. CAP. acre 31.92 1.0000 31.92 _________ --------- TOTAL DIRECT EXPENSES 757.16 _________RETURNS ABOVE DIRECT EXPENSES -757.16 _________ FIXED EXPENSES Implements acre 18.39 1.0000 18.39 _________ Tractors acre 37.77 1.0000 37.77 _________ Pickup Truck each 3,197.55 0.0250 79.94 _________ Overhead Irrigation each 88.64 1.0000 88.65 _________ Annual Rent each 399.99 1.0000 400.00 _________ --------- TOTAL FIXED EXPENSES 624.75 _________ --------- TOTAL SPECIFIED EXPENSES 1,381.91 _________RETURNS ABOVE TOTAL SPECIFIED EXPENSES -1,381.91 ________________________________________________________________________________

Page 34
Table 4.D Estimated costs and returns per acre Blueberry Establishment Establishment Year 3, Oregon State University _________________________________________________________________________
ITEM UNIT PRICE QUANTITY AMOUNT YOUR FARM_________________________________________________________________________
dollars dollars INCOME Blueberries Fresh lb. 0.85 3,600.0000 3,060.00 _________ --------- TOTAL INCOME 3,060.00 _________ DIRECT EXPENSES Chemical Spray Bordeaux appl. 6.80 2.0000 13.60 _________ Fungicide appl. 3.90 1.0000 3.90 _________ Fungicide Type #2 appl. 7.90 1.0000 7.90 _________ Roundup® Appl. appl. 4.80 1.0000 4.80 _________ Custom Charges Bird Control acre 41.50 1.0000 41.50 _________ Picking Labor lb. 0.40 3,600.0000 1,440.00 _________ Supplies Beehives hive 30.00 3.0000 90.00 _________ Irrigation Electrici set 4.50 17.0000 76.50 _________ Tissue An. Lab test 32.50 0.2000 6.50 _________ Buckets bkt. 2.50 5.0000 12.50 _________ General Overhead acre 20.00 1.0000 20.00 _________ Fertilizer Fertilizer(Sidedress) ton 138.00 0.2376 32.79 _________ OPERATOR LABOR Tractors hour 12.00 11.4182 137.03 _________ Pickup Truck hour 12.00 8.3325 99.99 _________ Hand Labor Special Labor hour 10.00 42.6700 426.70 _________ Overhead Irrigation hour 10.00 3.0000 30.00 _________ Trellis hour 10.00 30.0000 300.00 _________ DIESEL FUEL Tractors gal. 1.10 15.9855 17.59 _________ GASOLINE Pickup Truck gal. 1.40 16.6650 23.33 _________ REPAIR & MAINTENANCE Implements acre 16.47 1.0000 16.47 _________ Tractors acre 26.32 1.0000 26.32 _________ Pickup Truck mile 0.12 250.0000 31.25 _________ Overhead Irrigation acre 36.66 1.0000 36.67 _________ INTEREST ON OP. CAP. acre 133.35 1.0000 133.35 _________ --------- TOTAL DIRECT EXPENSES 3,028.69 _________RETURNS ABOVE DIRECT EXPENSES 31.31 _________ FIXED EXPENSES Implements acre 36.13 1.0000 36.13 _________ Tractors acre 57.46 1.0000 57.46 _________ Pickup Truck each 3,197.55 0.0250 79.94 _________ Overhead Irrigation each 88.64 1.0000 88.65 _________ Trellis each 56.41 1.0000 56.41 _________ Annual Rent each 399.99 1.0000 400.00 _________ --------- TOTAL FIXED EXPENSES 718.59 _________ --------- TOTAL SPECIFIED EXPENSES 3,747.28 _________RETURNS ABOVE TOTAL SPECIFIED EXPENSES -687.28 __________________________________________________________________________________

Page 35
Table 5.D Estimated costs and returns per acre Blueberry Establishment Establishment Year 4, Oregon State University _________________________________________________________________________
ITEM UNIT PRICE QUANTITY AMOUNT YOUR FARM_________________________________________________________________________
dollars dollars INCOME Blueberries Fresh lb. 0.85 7,200.0000 6,120.00 _________ --------- TOTAL INCOME 6,120.00 _________ DIRECT EXPENSES Chemical Spray Bordeaux appl. 6.80 2.0000 13.60 _________ Fungicide appl. 3.90 1.0000 3.90 _________ Fungicide Type #2 appl. 7.90 1.0000 7.90 _________ Roundup® Appl. appl. 4.80 1.0000 4.80 _________ Custom charges Loader Rental #2 acre 700.00 1.0000 700.00 _________ Bird Control acre 41.50 1.0000 41.50 _________ Picking labor lb. 0.40 7,200.0000 2,880.00 _________ Supplies Beehives hive 30.00 3.0000 90.00 _________ Irrigation Electrici set 4.50 17.0000 76.50 _________ Tissue An. Lab test 32.50 0.2000 6.50 _________ Buckets bkt. 2.50 5.0000 12.50 _________ General Overhead acre 20.00 1.0000 20.00 _________ Sawdust Sawdust unit 40.00 11.0000 440.00 _________ Fertilizer Fertilizer(Sidedress) ton 138.00 0.2730 37.67 _________ OPERATOR LABOR Tractors hour 12.00 10.5779 126.94 _________ Pickup Truck hour 12.00 8.3325 99.99 _________ Hand Labor Special Labor hour 10.00 47.6700 476.70 _________ Overhead Irrigation hour 10.00 3.0000 30.00 _________ DIESEL FUEL Tractors gal. 1.10 14.8091 16.29 _________ GASOLINE Pickup Truck gal. 1.40 16.6650 23.33 _________ REPAIR & MAINTENANCE Implements acre 14.52 1.0000 14.52 _________ Tractors acre 24.39 1.0000 24.39 _________ Pickup Truck mile 0.12 250.0000 31.25 _________ Overhead Irrigation acre 36.66 1.0000 36.67 _________ INTEREST ON OP. CAP. acre 246.22 1.0000 246.22 _________ --------- TOTAL DIRECT EXPENSES 5,461.17 _________RETURNS ABOVE DIRECT EXPENSES 658.83 _________ FIXED EXPENSES Implements acre 31.89 1.0000 31.89 _________ Tractors acre 53.23 1.0000 53.23 _________ Pickup Truck each 3,197.55 0.0250 79.94 _________ Overhead Irrigation each 88.64 1.0000 88.65 _________ Trellis each 56.41 1.0000 56.41 _________ Annual Rent each 399.99 1.0000 400.00 _________ --------- TOTAL FIXED EXPENSES 710.12 _________ --------- TOTAL SPECIFIED EXPENSES 6,171.29 _________RETURNS ABOVE TOTAL SPECIFIED EXPENSES -51.29 __________________________________________________________________________________

Page 36
Table 6.D Estimated costs and returns per acre Blueberry Establishment Establishment Year 5, Oregon State University __________________________________________________________________________
ITEM UNIT PRICE QUANTITY AMOUNT YOUR FARM__________________________________________________________________________
dollars dollars INCOME Blueberries Fresh lb. 0.85 10,800.0000 9,180.00 _________ --------- TOTAL INCOME 9,180.00 _________ DIRECT EXPENSES Chemical Spray Bordeaux appl. 6.80 2.0000 13.60 _________ Fungicide appl. 3.90 1.0000 3.90 _________ Fungicide Type #2 appl. 7.90 1.0000 7.90 _________ Roundup® Appl. appl. 4.80 1.0000 4.80 _________ Custom Charges Bird Control acre 41.50 1.0000 41.50 _________ Picking Labor lb. 0.40 10,800.0000 4,320.00 _________ Supplies Beehives hive 30.00 3.0000 90.00 _________ Irrigation Electrici set 4.50 17.0000 76.50 _________ Tissue An. Lab test 32.50 0.0200 0.65 _________ Buckets bkt. 2.50 5.0000 12.50 _________ General Overhead acre 20.00 1.0000 20.00 _________ Fertilizer Fertilizer(Sidedress) ton 138.00 0.2850 39.33 _________ OPERATOR LABOR Tractors hour 12.00 10.5779 126.94 _________ Pickup Truck hour 12.00 8.3325 99.99 _________ Hand Labor Special Labor hour 10.00 52.7000 527.00 _________ Overhead Irrigation hour 10.00 3.0000 30.00 _________ DIESEL FUEL Tractors gal. 1.10 14.8091 16.29 _________ GASOLINE Pickup Truck gal. 1.40 16.6650 23.33 _________ REPAIR & MAINTENANCE Implements acre 14.52 1.0000 14.52 _________ Tractors acre 24.39 1.0000 24.39 _________ Pickup Truck mile 0.12 250.0000 31.25 _________ Overhead Irrigation acre 36.66 1.0000 36.67 _________ INTEREST ON OP. CAP. acre 238.98 1.0000 238.98 _________ --------- TOTAL DIRECT EXPENSES 5,800.04 _________RETURNS ABOVE DIRECT EXPENSES 3,379.96 _________ FIXED EXPENSES Implements acre 31.89 1.0000 31.89 _________ Tractors acre 53.23 1.0000 53.23 _________ Pickup Truck each 3,197.55 0.0250 79.94 _________ Overhead Irrigation each 88.64 1.0000 88.65 _________ Trellis each 56.41 1.0000 56.41 _________ Annual Rent each 399.99 1.0000 400.00 _________ --------- TOTAL FIXED EXPENSES 710.12 _________ --------- TOTAL SPECIFIED EXPENSES 6,510.16 _________RETURNS ABOVE TOTAL SPECIFIED EXPENSES 2,669.84 ___________________________________________________________________________________

Page 37
Table 7.D Estimated costs and returns per acre Blueberry Establishment Establishment Year 6, Oregon State University __________________________________________________________________________
ITEM UNIT PRICE QUANTITY AMOUNT YOUR FARM__________________________________________________________________________
dollars dollars INCOME Blueberries Fresh lb. 0.85 14,400.0000 12,240.00 _________ --------- TOTAL INCOME 12,240.00 _________ DIRECT EXPENSES Chemical Spray Bordeaux appl. 6.80 2.0000 13.60 _________ Fungicide appl. 3.90 1.0000 3.90 _________ Fungicide Type #2 appl. 7.90 1.0000 7.90 _________ Roundup® Appl. appl. 4.80 1.0000 4.80 _________ Custom Charges Bird Control acre 41.50 1.0000 41.50 _________ Picking Labor lb. 0.40 14,400.0000 5,760.00 _________ Supplies Beehives hive 30.00 3.0000 90.00 _________ Irrigation Electrici set 4.50 17.0000 76.50 _________ Tissue An. Lab test 32.50 0.0200 0.65 _________ Buckets bkt. 2.50 5.0000 12.50 _________ General Overhead acre 20.00 1.0000 20.00 _________ Fertilizer Fertilizer(Sidedress) ton 138.00 0.3324 45.87 _________ OPERATOR LABOR Tractors hour 12.00 10.5779 126.94 _________ Pickup Truck hour 12.00 8.3325 99.99 _________ Hand Labor Special Labor hour 10.00 56.0000 560.00 _________ Overhead Irrigation hour 10.00 3.0000 30.00 _________ DIESEL FUEL Tractors gal. 1.10 14.8091 16.29 _________ GASOLINE Pickup Truck gal. 1.40 16.6650 23.33 _________ REPAIR & MAINTENANCE Implements acre 14.52 1.0000 14.52 _________ Tractors acre 24.39 1.0000 24.39 _________ Pickup Truck mile 0.12 250.0000 31.25 _________ Overhead Irrigation acre 36.66 1.0000 36.67 _________ INTEREST ON OP. CAP. acre 299.89 1.0000 299.89 _________ --------- TOTAL DIRECT EXPENSES 7,340.49 _________RETURNS ABOVE DIRECT EXPENSES 4,899.51 _________ FIXED EXPENSES Implements acre 31.89 1.0000 31.89 _________ Tractors acre 53.23 1.0000 53.23 _________ Pickup Truck each 3,197.55 0.0250 79.94 _________ Overhead Irrigation each 88.64 1.0000 88.65 _________ Trellis each 56.41 1.0000 56.41 _________ Annual Rent each 399.99 1.0000 400.00 _________ --------- TOTAL FIXED EXPENSES 710.12 _________ --------- TOTAL SPECIFIED EXPENSES 8,050.61 _________RETURNS ABOVE TOTAL SPECIFIED EXPENSES 4,189.39 ___________________________________________________________________________________

Page 38
Table 8.D Estimated costs and returns per acre Blueberry Full Production Machine Full production years (machine), Oregon State University __________________________________________________________________________
ITEM UNIT PRICE QUANTITY AMOUNT YOUR FARM__________________________________________________________________________
dollars dollars INCOME Blueberries Processed lb. 0.50 16,000.0000 8,000.00 _________ --------- TOTAL INCOME 8,000.00 _________ DIRECT EXPENSES Chemical Spray Bordeaux appl. 6.80 4.0000 27.20 _________ Fungicide appl. 3.90 4.0000 15.60 _________ Fungicide Type #2 appl. 7.90 1.0000 7.90 _________ Roundup® Appl. appl. 4.80 1.0000 4.80 _________ Custom Charges Loader Rental #2 acre 700.00 0.3300 231.00 _________ Bird Control acre 41.50 1.0000 41.50 _________ Machine Harvest lb. 0.10 16,000.0000 1,600.00 _________ Load and Ship lb. 0.03 16,000.0000 480.00 _________ Supplies Beehives hive 30.00 3.0000 90.00 _________ Irrigation Electrici set 4.50 23.0000 103.50 _________ Tissue An. Lab test 32.50 0.2000 6.50 _________ General Overhead acre 20.00 1.0000 20.00 _________ Sawdust Sawdust unit 40.00 3.6300 145.20 _________ Fertilizer Fertilizer(Sidedress) ton 138.00 0.3750 51.75 _________ OPERATOR LABOR Tractors hour 12.00 12.2585 147.10 _________ Pickup Truck hour 12.00 8.3325 99.99 _________ Hand Labor Special Labor hour 10.00 51.3000 513.00 _________ Overhead Irrigation hour 10.00 3.0000 30.00 _________ DIESEL FUEL Tractors gal. 1.10 17.1619 18.88 _________ GASOLINE Pickup Truck gal. 1.40 16.6650 23.33 _________ REPAIR & MAINTENANCE Implements acre 18.40 1.0000 18.40 _________ Tractors acre 28.27 1.0000 28.27 _________ Pickup Truck mile 0.12 250.0000 31.25 _________ Overhead Irrigation acre 36.66 1.0000 36.67 _________ INTEREST ON OP. CAP. acre 176.50 1.0000 176.50 _________ --------- TOTAL DIRECT EXPENSES 3,948.34 _________RETURNS ABOVE DIRECT EXPENSES 4,051.66 _________ FIXED EXPENSES Implements acre 40.37 1.0000 40.37 _________ Tractors acre 61.68 1.0000 61.68 _________ Pickup Truck each 3,197.55 0.0250 79.94 _________ Overhead Irrigation each 88.64 1.0000 88.65 _________ Trellis each 56.41 1.0000 56.41 _________ Annual Rent each 399.99 1.0000 400.00 _________ Am. Establishment each 791.63 1.0000 791.64 _________ --------- TOTAL FIXED EXPENSES 1,518.69 _________ --------- TOTAL SPECIFIED EXPENSES 5,467.03 _________RETURNS ABOVE TOTAL SPECIFIED EXPENSES 2,532.97 ___________________________________________________________________________________

Page 39
Table 9.D Estimated costs and returns per acre Blueberry Full Production (hand-harvested) Full production years (hand-harvested), Oregon State University__________________________________________________________________________
ITEM UNIT PRICE QUANTITY AMOUNT YOUR FARM__________________________________________________________________________
dollars dollars INCOME Blueberries Fresh lb. 0.85 16,200.0000 13,770.00 _________ Blueberries Processed lb. 0.50 1,800.0000 900.00 _________ --------- TOTAL INCOME 14,670.00 _________ DIRECT EXPENSES Chemical Spray Bordeaux appl. 6.80 4.0000 27.20 _________ Fungicide appl. 3.90 4.0000 15.60 _________ Fungicide Type #2 appl. 7.90 1.0000 7.90 _________ Roundup® Appl. appl. 4.80 1.0000 4.80 _________ Custom Charges Loader Rental #2 acre 700.00 0.3300 231.00 _________ Bird Control acre 41.50 1.0000 41.50 _________ Picking Labor lb. 0.40 16,200.0000 6,480.00 _________ Machine Harvest lb. 0.10 1,800.0000 180.00 _________ Load and Ship lb. 0.03 1,800.0000 54.00 _________ Supplies Beehives hive 30.00 3.0000 90.00 _________ Irrigation Electrici set 4.50 23.0000 103.50 _________ Tissue An. Lab test 32.50 0.2000 6.50 _________ Buckets bkt. 2.50 5.0000 12.50 _________ General Overhead acre 20.00 1.0000 20.00 _________ Sawdust Sawdust unit 40.00 3.6300 145.20 _________ Fertilizer Fertilizer(Sidedress) ton 138.00 0.3750 51.75 _________ OPERATOR LABOR Tractors hour 12.00 12.2585 147.10 _________ Pickup Truck hour 12.00 8.3325 99.99 _________ Hand Labor Special Labor hour 10.00 63.3000 633.00 _________ Overhead Irrigation hour 10.00 3.0000 30.00 _________ DIESEL FUEL Tractors gal. 1.10 17.1619 18.88 _________ GASOLINE Pickup Truck gal. 1.40 16.6650 23.33 _________ REPAIR & MAINTENANCE Implements acre 18.40 1.0000 18.40 _________ Tractors acre 28.27 1.0000 28.27 _________ Pickup Truck mile 0.12 250.0000 31.25 _________ Overhead Irrigation acre 36.66 1.0000 36.67 _________ INTEREST ON OP. CAP. acre 371.16 1.0000 371.16 _________ --------- TOTAL DIRECT EXPENSES 8,909.50 _________RETURNS ABOVE DIRECT EXPENSES 5,760.50 _________ FIXED EXPENSES Implements acre 40.37 1.0000 40.37 _________ Tractors acre 61.68 1.0000 61.68 _________ Pickup Truck each 3,197.55 0.0250 79.94 _________ Overhead Irrigation each 88.64 1.0000 88.65 _________ Trellis each 56.41 1.0000 56.41 _________ Annual Rent each 399.99 1.0000 400.00 _________ Am. Establishment each 791.63 1.0000 791.64 _________ --------- TOTAL FIXED EXPENSES 1,518.69 _________ --------- TOTAL SPECIFIED EXPENSES 10,428.19 _________RETURNS ABOVE TOTAL SPECIFIED EXPENSES 4,241.81 __________________________________________________________________________

Page 40
Table 10. Cash-flow requirements for 20-acre blueberry planting, Willamette Valley.
Establishment Years Full Production Years
0 1 2 3 4 5 6 7 8 9Gross revenue/acre 3,060 6,120 9,180 12,240 14,760 14,760 14,760Total revenue 61,200 122,400 183,600 244,800 295,200 295,200 295,200Variable cost/acre 1,926 6,435 757 3,029 5,461 5,800 7,340 8,910 8,910 8,910Cash fixed cost/acre 400 400 400 400 400 400 400 400 400 400Variable cost 38,520 128,700 15,140 60,580 109,220 116,000 146,800 178,190 178,190 178,190Cash fixed cost 8,000 8,000 8,000 8,000 8,000 8,000 8,000 8,000 8,000 8,000Total cash costs 46,520 136,700 23,140 68,580 117,220 124,000 154,800 186,190 186,190 186,190Investments
Tractor 36,250Spreader 3,625Rototiller 7,975Drag harrow 365Side dresser 1,450Wagon 725Pickup truck 25,000Irrigation 22,000Trellis 14,000
Annual cash flow -121,910 -158,700 -23,140 -21,380 5,180 59,600 90,000 109,010 109,010 109,010Cumulative cash flow -121,910 -280,610 -303,750 -325,130 -319,950 -260,350 -170,350 -61,340 47,670 156,680

© 2005 Oregon State University. This publication was produced and distributed in furtherance of the Acts of Congress of May 8 and June 30, 1914. Extension work is a cooperative program of Oregon State University, the U.S. Department of Agriculture, and Oregon counties. Oregon State University Extension Service offers educational programs, activities, and materials—without discrimination based on race, color, religion, sex, sexual orientation, national origin, age, marital status, disability, or disabled veteran or Vietnam-era veteran status. Oregon State University Extension Service is an Equal Opportunity Employer.
Published January 1993. Revised January 2005.