email still doesn’t boost turnout · · 2018-02-17according to the most recent pew research, 70...
TRANSCRIPT

1
Email Still Doesn’t Boost Turnout Email Mobilization in Florida Michael Rivera, University of Texas at Austin D. Alex Hughes, University of California-Berkeley Micah Gell-Redman, University of Georgia
Considerable campaign activity focuses on the ground-game -- converting citizens who support a particular candidate or platform into voters who cast ballots at the polls in support of that platform. Yet, the understanding of what methods of political activation work in the digital era, let alone why these methods work, is still largely unknown. In this paper, we build upon existing studies that manipulate social pressure and group identity to test whether these appeals are effective in the current campaign climate which uses digital media for voter contact. They are not. Despite running a field experiment with nearly five-hundred thousand voters, we find scant evidence that emails from unaffiliated groups affect voter turnout. In secondary analysis where we analyze responses to our mailer, we find strong evidence that this contact was able to elicit a political response, just not at a ballot box.
Presented at the 2017 State Politics and Policy Conference
Research approved by the Institutional Review Board at The University of Texas at Austin.

2
Get Out the Vote Activities 3
Campaigns Use Email 4
Email Expectations 4
Identity Politics in 2016 6
Research Design and Data 8 Treatment Materials and Administration 9
Results 10 Validated Voter Turnout 10 Email Responses 11
Discussion & Next Steps 14
Tables and Figures 16 Table 1: Demographic Characteristics of Florida Voters, Grouped by Email Status 16 Table 2: Demographic Characteristics of Florida Voters with a Registration Event in 2008 or more Recently, Grouped by Email Status 16 Table 3: Successful Randomization 17 Table 4: Missing Validated Data at County Level 18 Table 5: Regression of Likelihood of Voting in 2016 Election, based on Experimental Stimulus 19 Table 6: Minority and Hispanic Response to Treatment 20 Table 7: Differential Content of Responses 21 Table 8: Interaction between email language and responder Minority Status 22 Figure A: General Reminder 23 Figure B: Social Pressure 23 Figure C: Native Threat 24 Figure D: Latino Group Threat 24 Figure 1: Coefficient Plots of Regression Models in Table 5, Models 2 & 4 25 Figure 2: Randomization Inference for Email Responses 26

3
Despite the central role that counting votes plays in determining electoral fortunes, mobilizing voters to cast a ballot remains a central challenge to campaigns. Although structural changes in the way ballots are cast are being rapidly implemented (for example the adoption of vote-by-mail in Washington and Oregon), in-person voting remains the cornerstone of American electoral politics. While voters seem to respond to types of social pressure inducements to vote (see, e.g. Green, Gerber and Larimer, 2008), campaigns have met only limited success using this technology (Issenberg 2012).
Political Science scholarship has previously examined the role that direct-to-voter emails may provide to campaigns for mobilizing voters (Nickerson 2007). Since the initial null findings, however, little research has examined whether the nature of this relationship has changed as voters’ use-patterns with technology have developed. In this paper, we run a direct-to-voter encouragement campaign in Florida. Our email messages either inform voters of the upcoming election; encourage them to do their part; signal a minority-group threat to majority groups, or prime minority-group identity. We find little evidence that any language, delivered in an email, translates into political action at the polling place.
Though our email message did not encourage voters to take to the polls, one feature of our design permitted us to observe a novel form of political expression: the response of voters to our email stimulus. Of those voters who took the time to respond to our stimulus, the majority provided simple statements thanking us for the reminder. However, some voters took a different tack, responding with strongly negative affect toward the mobilization encouragement.
Get Out the Vote Activities Political Science has a storied history in experimenting with current technology to study its impact on the vote. Indeed, in 1953 and 1954 Eldersveld conducted a randomized experiment in Ann Arbor, MI that either assigned voters to receive no-contact, a single-piece cold-letter contact, or in-person contact from a house-to-house canvasser (Eldersveld 1954). Voters in the control group voted at rates consistent with the rest of the Ann Arbor population, just 33 percent cast a ballot. In contrast, 59 percent of those voters who received a letter, and 75 percent of those voters who received an in-person contact turned out to vote.
From these early findings on GOTV efforts through the current day, the finding that social interaction makes appeals to political action more effective has been remarkably consistent. (Green, Gerber and Larimer, 2008; Nickerson 2008). Indeed, Putnam (1995) argues from observational data that generally declining rates of civic participation was at play in the decreased political activity in the 1990s.
Despite the clear evidence of its effectiveness, the cost and logistical challenge of personal contact has led campaigns and scholars to examine if other, less costly methods exist to activate voters. While these methods are attractive to both campaigns

4
and grassroots groups who want to mobilize supporters, the effectiveness of these methods is still up for debate.
Campaigns Use Email Campaigns use email with varying levels of success.1 The Bernie Sanders campaign used phone, text and email technology to mobilize his base. While the extensive grassroots base Bernie Sanders built was not enough to win the primary, his efforts and the micro-targeting efforts by the Hillary Clinton campaign demonstrate that campaigns continue to rely on online methods to contact supporters. We must make one distinction between how campaigns engage prospective supporters and how we engage voters. Campaigns develop an email contact list by gathering emails at campaign events or online.2 Contact lists allow candidates to contact supporters with email alerts and mobilizing messages. We contact voters using the publicly available Florida voter file. This cold-contact is distinct from the opt-in contact that campaigns use to reach their audience. While opt-in contact from a trusted source is likely to have a greater effect than contact from an unknown source, this cold contact not unprecedented. Nickerson cold-contacted voters during the 2002 congressional election (2007 “Does Email Boost Turnout?”).
Email Expectations Nickerson 2007 provides a useful framework for considering why emails may increase turnout in elections. While several of these justifications continue to be pertinent; there is reason to believe that the way that people use email communication has changed sufficiently in the intervening decade that there is value in revisiting them. First, and most durably, campaigns and political organizations use emails as an important method of contacting their supporters. This was true in 2007 and continued to be true in the 2016 general race. Both Democratic and Republican National committees sent out daily reminders to their lists. And, importantly, despite the success of peer-to-peer mobilization in the Obama 2008 and 2012 campaign organizations, as well as the success of the 2016 Sanders primary campaign organization, the 2016 General election between candidates Trump and Clinton relied on the more traditional email, broadcast advertising, and direct mail. 1Bond, Becky and Zack Exley (Nov 11, 2016) "Hillary Clinton’s Vaunted GOTV Operation May Have Turned Out Trump Voters" Accessed May 2017 http://www.huffingtonpost.com/entry/hillary-clintons-vaunted-gotv-operation-may-have-turned-out-trump-voters_us_582533b1e4b060adb56ddc27 2For example, one could have connected with the Bernie Sanders campaign online. “Connect with Bernie” Website accessed May 2017. https://connect.berniesanders.com/

5
Second, citizens and voters trust content that is received through direct-email contact and increasingly use internet resources to inform themselves about political and daily news. According to the most recent Pew research, 70 percent of Americans used email in 2011, up from just 55 percent in 2002. Eighty-four percent of US adults use the Internet.3 Among internet users, 92% use email, and 61 use it on a daily basis4. In the 2004 general election, voters non-politically enjured friends to take political action and vote (Pew 2005); in the 2016 election cycle this form of person-to-person contact via email had been supplemented and substituted with contact through the several social media outlets that exist. The changes in this landscape, may have actually increased the effectiveness of email-based GOTV efforts. As political conversation increasingly moved to public digital fora, the transition may have -- ironically -- created space for direct, personal contact between mobilizers and voters through email. Inboxes that had previously been filled with correspondence between political contacts may now contain less of this content, increasing the likelihood that correspondence from political groups might be read. Third, non-email, direct contact increases turnout. Even when direct mail is unsolicited and contains little in the way of a personal appeal, these messages still increase the likelihood that voters take political action. Indeed, whether the direct mail is sent during a general campaign (Gerber and Green 2000; Green and Gerber 2008), or a primary campaign (Hill and Kousser 2016) direct mail seems to increase turnout by around one-half of one percent.5 Depending on the context of the campaign, and who is targeted, this effect may be even larger. Low-propensity voters in California’s 2014 primary elections who were unlikely to receive other campaign contact were caused to turnout at a 0.87 percent higher rate, an increase in that election of nearly 9 percent over baseline turnout (Hughes et al 2017). Fourth, Nickerson hold that email works to increase trust between individuals. According to the Pew Research Center, "Americans say the internet and cell phones have brought benefits in learning, sharing and diversifying the flow of information into their lives."6 Seventy-five percent feel better informed about national news and 74% feel better informed about international news because of the internet tools. Furthermore, the Internet has allowed individuals to be better informed about civic and community life. Forty-nine percent say they feel better informed about civic and government activities and 39% say they feel better informed about their neighborhood and neighbors.
3 Perrin, Andrew and Maeve Duggan (2015) Pew Research Center "Americans’ Internet Access: 2000-2015" http://www.pewinternet.org/2015/06/26/americans-internet-access-2000-2015/ 4 Purcell, Kristen (2011) Pew Research Center. "Search and email still top the list of most popular online activities"http://www.pewinternet.org/2011/08/09/search-and-email-still-top-the-list-of-most-popular-online-activities/ 5 Gerber, A. S., & Green, D. C. (2000). The effects of canvassing, telephone calls, and direct mail on voter turnout: A field experiment. American Political Science Review, 94(3), 653–663. Green, D. P., & Gerber, A. S. (2008). Get out the vote: How to increase voter turnout (2nd ed.). Washington: Brookings Institution Press. 6Purcell, Kristen and Lee Rainie (2014) "Americans Feel Better Informed Thanks to the Internet" http://www.pewinternet.org/2014/12/08/better-informed/

6
Despite these reasonable expectations that voter contact by email might be expected to cause changes in turnout, the previous work has not identified any such effects. Why then, take the issue up in this study? First, and primarily, in the intervening decade scholarship has identified several areas where online communication is, or can be successful at causing voters to take political action. Voters who consume political contact through social media channels are more likely to engage in campaign activity, although they are not more likely to vote in an election (Aldrich et al, 2016).7 Supporting challenge to the effectiveness of online media, voters who were exposed to a high-volume of targeted at on the Facebook social-network platform were nore more likely to recognize or positively evaluate the politicians who were represented in those advertisements than voters who were not shown such ads (Broockman & Green 2014).8 While Nickerson (2007) questions the effectiveness of email mobilization, it is plausible to expect a different outcome in the 2016 presidential election. First, the Nickerson email experiment was fielded during a midterm congressional election. It is not clear if one should expect the same null effect during a presidential election. Second, in the past decade individuals use technology differently and more frequently. Sixty-seven percent of senior citizens use the internet in 2017 compared to 12% in 2000, and and 42% use smartphones (compared to 18% in 2013).9 The technology landscape has changed. It is unclear if the effectiveness of email has also changed.
Identity Politics in 2016 During the 2016 presidential campaign, presidential candidate Trump filled his speeches with anti-immigrant rhetoric in an attempt to appeal to a core-base of voters. For example, in June 2015 speech, candidate Trump said "When Mexico is sending its people, they're not sending their best...They’re bringing drugs. They’re bringing crime. They’re rapists. And some, I assume, are good people."10 To activate these immigration attitudes was not necessarily a flawed approach for candidate Trump. Research shows that attitudes about immigration influence who American’s vote for (Hajnal and Rivera 2014). Activating these attitudes perhaps is a rational strategy for Republicans.11 Research shows that increased anxiety among voters can lead to differential political behaviors including increased information seeking, increased trust in political actors, 7 Aldrich et al. 2016 8 Broockman, David E. and Donald P. Green. "Do Online Advertisements Increase Political Candidates’ Name Recognition or Favorability? Evidence from Randomized Field Experiments" Polit Behav (2014) 36: 263. https://link.springer.com/article/10.1007/s11109-013-9239-z/fulltext.html 9 Anderson, Monia and Andrew Perrin. (May 17, 2017) "Tech Adoption Climbs Among Older Adults" Pew Research Center. Accessed May 2017. http://www.pewinternet.org/2017/05/17/tech-adoption-climbs-among-older-adults/ 10 Heilpern, Will. January 19, 2017. CNN Politics "Trump campaign: 11 outrageous quotes" http://www.cnn.com/2015/12/31/politics/gallery/donald-trump-campaign-quotes/ 11 “Opposition to immigration reform is a winning strategy for Republicans” Monkey Cage, The Washington Post, Zoltan Hajnal. February 27, 2015.
7
and support for anti-democratic policies (Albertson and Gadarian 2015).12 Anxiety and stress also have differential effects on turnout (Hassell and Settle 2016).13 While some debate the effectiveness of email (Nickerson 2007) if any email message would mobilize voters to the polls, messages that activate one’s identity politics should be particularly impactful. Especially among Latinos, email messages that elicit feelings of Latino linked fate may be more effective in mobilizing voters (Garcia Bedolla 2005; Garcia Bedolla and Michelson 2012). Our theoretical expectations are based on the literature that suggests that anti-immigrant appeals can mobilize minority populations to register and turnout to vote. In the response to the anti-immigrant California Proposition 187 in the 1990s that would prohibit undocumented individuals from accessing various social services, first-time eligible immigrant voters registered and turned out in droves. Similarly, the 2006 anti-immigrant congressional14 bill HR4437, colloquially referred to as the "Sensenbrenner Bill," increased participation among minority voters. Latinos and immigrants engaged in mass protests across the United States and increased their formal and informal political engagement.15 This leads us to our first hypothesis: Among minority voters, mobilization messages that prime ethnic identity and a threat to one’s in-group will increase one’s propensity to turnout more than a reminder to vote without an ethnic prime. While minority ethnic appeals increase one’s level of engagement among minority voters, non-hispanic white support for policies that restrict immigrant rights and support for conservative candidates is based in large part on racial conservatism. In response to California Proposition 209 which would ban the use of affirmative action in state hiring practices and university admissions, white voters’ support was a result of racial conservatism, as opposed to economic concerns (Alvarez and Bedolla 2004).16 Similarly, support for political candidates is causally related to one’s attitudes on immigration. White voters with more negative immigrant views are more apt to
12 Albertson, Bethany and Shana Kushner Gadarian. (2015) Anxious Politics: Democratic Citizenship in a Threatening World. Cambridge University Press. 13 Hassell, Hans J.G. and Jaime E. Settle. (2016) “The Differential Effects of Stress on Voter Turnout” Political Psychology 14 The Border Protection, Anti-terrorism, and Illegal Immigration Control Act of 2005. 15 See for example, Gonzalex, Alfonso (2013). Reform Without Justice: Latino Migrant Politics and the Homeland Security State. Oxford University Press. 16 Alvarez, R. M., & Bedolla, L. G. (2004). “The Revolution against Affirmative Action in California: Racism, Economics, and Proposition 209.: State Politics & Policy Quarterly, 4(1), 1–17. Similarly, white voters who are more concerned about undocumented immigration were more likely to support CA Prop 187 that limited the services available to unauthorized individuals. See Alvarez, Michael R. and Tara Butterfield. (2000) "The Resurgence of Nativism in California? The Case of Proposition 187 and Illegal Immigration." Social Science Quarterly. Volume 81, Number 1, March 2000.

8
identify as Republicans and more likely to favor Republican candidates (Hajnal and Rivera 2014). This leads us to our second hypothesis: Among non-hispanic white voters, mobilization messages that include a racial prime and a threat to one’s in-group will increase one’s propensity to turnout more than a reminder to vote without a racial prime.
Research Design and Data We contacted, via unsolicited, direct email, approximately 5% of registered voters in Florida. From the publicly maintained October 10, 2016 Florida Voter Roll, maintained by the Florida Department of State, Division of Elections, we collected names, email addresses, demographic and political information.17 This data contains information about more than 14 million registered voters in the state, though we limit our assignment frame to include only those Florida voters who provide an email address. Overall, just 4.14 percent of registered Florida voters provided an email address. Of those who cast a vote in the 2016 general election, 5.17 percent provided an email address at the time they registered. Florida is an ideal case to examine the role of email for mobilizing. First, recent contests have been closely contested between the Democratic and Republican parties. In a swing state campaigns should be particularly aware of what what mobilization techniques work. Second, Florida is an ideal case to test ethnic appeals because of its racial & ethnic diversity. Third, registered voters self-report their race in the voter file. We do not have to rely on complicated and often imprecise modeling to predict voter race. Fourth, and finally, the publicly available voter file contains the voter email addresses. Few states collect email addresses and even fewer release this information. This feature allows researchers to test the effectiveness of email GOTV efforts. As we report in Table 1, the 5 percent of Florida voters who provide email information are somewhat distinct from those voters who do not provide their email information. Nearly 90 percent of voters who provided an email address voted, a turnout rate that is 15 percent higher than those without email information. Those with email addresses are marginally more likely to be affiliated with the Democratic, rather than the Republican, party. However, this margin is a slim 0.2 percent. Voters who provide email addresses are approximately five years old and slightly less likely to report a female identity than those who do not provide email addresses. However, this pattern is likely as a consequence of changing technology adoption, as well as changing norms about providing email information. As we report in Table 2, among voters with a registration event in 2008 or more recently, the groups that
17Division of Elections. Florida Department of State. http://dos.myflorida.com/elections/

9
provide and do not provide email are markedly more similar. Among only these recently registered, or re-registered individuals, the age gap drops to just 1.5 years. Furthermore, those who do and don’t provide email information become more similar across all other measured dimensions. We restrict our treatment assignment only to registered voters with an email address. Consequently, the demographics of our treatment groups is balanced between treatment conditions, despite the compositional differences between those who do and do not provide email information. As we report in Table 3, our randomization procedure does, indeed, produce samples that are balanced across treatment conditions.
Treatment Materials and Administration We sent four versions of an email reminding voters of the upcoming election. All emails were sent from an active email address with a .edu top-level domain, and were signed by a member of the research team. We use real names for several reasons. First, using real names and active email addresses removes the possibility that voters were subject to any form of deception. Second, because previous research consistently finds that personal appeals are more effective at mobilizing voters than impersonal appeals; and because the previous research had failed to find any mobilizing effects of sending emails, we aimed to employ versions of treatment that were the most likely to have an effect. Third, as we discuss in the results section, sending from an active email address permitted the measurement of a novel stream of data, namely the email responses from subjects. In Figures A, B, C, and D we present the treatment materials that were sent to registered voters. All emails were unformatted text, contained no images or hyperlinks, and contained the same emailed header and signature information. Treatment materials run alongside core direct-mail and in-person primes that have been previously identified as effective mobilization messages. These messages include an general information message (Figure A ), a civic duty message (Figure B), a native threat message (Figure C), and a group identity prime (Figure D). All treatments were sent the day before the election, the morning of November 07, 2016 at 10am EST. Contact with voters so close to the election has two consequences. First, the close proximity to the election maintains whatever effectiveness there may be for our treatment. Second, voters who have either voted absentee or early have set their voting status before possibly receiving contact. Information about whether a voter had cast an absentee or early ballot was not available at the time of randomization -- this information would not be published by the state until the post-election Voter File -- and so we were not able to restrict our treatment assignment to include only those voters whose behavior our contact had the opportunity to change. However, because these early and absentee voters are evenly distributed in our treatment groups, neither including nor excluding these outcomes should lead to bias in our estimates of causal

10
quantities. However, depending on the rate of early voting, excluding these individuals may increase the precision of causal estimate. All treatment emails were distributed from a Qualtrics email management table, through University of Texas, Austin servers. The nature of our delivery does not permit us to observe whether emails were actually received by voters, nor whether they were opened. However, the randomization of treatment ensures that rates of opening will be similar across conditions. The technical staff at the University were able to confirm that the batch of emails were handled by their servers, and that the University email servers did not have their whitelist status changed as a consequence of this mailing.18 Due to the lack of opening information, all results we present in the following analysis of voter turnout are intent-to-treat (ITT) effects. Although the limitations of the IT infrastructure lead our estimates to be less precise than what may have been possible under a placebo-controlled design (Green and Gerber 2012), they remain unbiased estimates of the change in voting that a campaign or other actor might expect to cause through a single, direct-email campaign. Furthermore, for conceptual clarity, we restrict our analysis to include only individuals who did not cast an early or absentee ballot though this decision does not lead to substantive difference in the causal estimates.
Results Validated Voter Turnout Our overall turnout data matches official reports from Florida Department of State, Division of Elections. We note that during the Quality Assurance of the data for this draft that we identified that the State of Florida, Division of Elections data was incomplete. In particular, we noted that the division of election was missing considerable data about in-person voting, particularly in large counties. A record of the reported, in-person votes is reported in Table 4. While these results should be evenly distributed across our treatment groups, limiting bias, as a result of this finding, we are treating these results as preliminary and will update once the Division of Elections can furnish us with a complete accounting of votes. The analysis reported in this draft includes only the counties that include a full reporting of the voter turnout. Despite the problems that such missing data poses, what is evident represents a considerable proportion of the votes actually cast. Our data covers 8,653,352 votes cast in the 2016 General election; the official tally includes 9,618,735; or, roughly one-million more cast votes. Closely in line with official reports, we find that 74.6 percent of registered Floridians 18 University IT was not able to provide any additional support concerning hard-bounces at the recipient, or other information that might lead either to greater precision in the estimate of a treatment effect, or the identification of a closer causal quantity.

11
voted in the 2016 general election. Among those who provided an email, voter turnout was higher; 89.2 percent of these voters cast a ballot. Statewide, among our sampling frame, we find that receiving an email caused a small decrease in the likelihood that a voter turned out to vote. As we report in Table 5, voters in counties with fully-reported data, who had a valid email address, but whom we assigned to control and did not receive an email turned out to vote 81.6 percent of the time. These same types of voters, if they had been sent any form of contact turned out 81.1 percent of the time, a rate 0.61% lower ( SE�=0.003). This slight reduction in turnout persists in a model that estimates county-level fixed effects (Model 2). In Table 5, Models 3 & 4 and Figure 1, we report that voter behavior is responsive to the content of email contact messages. Voters who were assigned to receive either the general information cue or the native threat cue turned out at about 1% lower rates than voters assigned not to receive any voter contact. In contrast, neither the social pressure nor the Latino identity cues caused any measurable change propensity to vote. We did not hold strong prior beliefs about the overall effects of the group identity primes on turning out the vote. Depending on the demographic composition of voters, and the treatment they received, we could have anticipated either a positive, negative, or null effect of the group primes. We did not hold such weak prior beliefs about the direction of the information prime; we were quite surprised to learn that sending truthful information through a non-invasive channel could cause a reduction in the likelihood that individuals turned out to vote. In Table 6 we further investigate these results. One possibility explaining the negative response to treatment is that individuals were not aware that the Florida Voter File was public information. In the election climate of the 2016 General election, where key campaign themes involved racial and ethnic issues, if racial and ethnic minorities were disproportionately more likely to learn that the Voter File was public information, then these groups should demonstrate lower rates of turnout when sent our contact. Indeed, Table 6, Model 1 reports that while minority voters assigned to the control group were 4.3 percent less likely to turnout than white voters, minority voters who received a social information or Hispanic group cue were an additional 1.8 percent less likely to turnout than minority voters in the control group. Comparing the coefficients in Table 6, Model 1 against Table 6, Model 2 identifies that the effect of the Native Threat cue is driven by non-Hispanic minorities. In Model 2 there is no heterogeneous treatment effect on the Information * Hispanic Voter coefficient; instead, this effect is being borne out on the main-effect on Native Threat.
Email Responses Validated voted is the cornerstone of the electoral process that determines policy, but it is by no means the only venue for voters to take expressive political action. Indeed, previous research has shown that voters who are shown political advertisements online do not change their vote behavior, although they do take other forms of political action,

12
such as engaging in a campaign (Aldrich 2014). In this section we analyze the emails that we received as a result of sending our treatment. Sending us an email is a markedly district form of political action than voting, though both forms of political action do share some qualities. Despite the vanishingly small probability that an individual vote is pivotal, especially in Florida where the 2000 Bush v. Gore “Hanging Chad” election is still a part of collective political memory, there still exists some instrumental benefit to casting a vote. Down-ticket races can be strongly influenced by a small group of voters, tax-rates and millages, and so on. In contrast, sending a reply email to a faculty member whom you have never met cannot possibly hold any instrumental value. However little policy-instrumental value such an email may hold, however, there may be tremendous expressive value in sending a reply email to an unknown faculty member. Indeed, if the emails that we collected are any indication, the menu of choices for expression are much larger in an email than on an official ballot. What is more, in Presidential General races there may be very little room for mobilization activity to move the needle. In these general races those individuals who are going to turnout to vote are either type that vote regardless of the election, or have been contacted by some other political group. While on the margins it may be possible to mobilize in areas that are relatively less competitive, or where voters have a good sense of the electoral politics in the area (Hughes et al. 2017), these effects are slight. When examining email responses to our mobilization cues, we are not against such a case of redlining the dependent variable. Instead, the baseline that we expect from the control group is zero; those who are not sent emails should not be sending any emails to our addresses. Compared to validated vote where our control group voters turned out at rates higher than 81%, in email responses we have much more room. Finally, in validated vote, those individuals who voted early or absentee cannot be affected by our treatment; when we consider email responses, however, these individuals can still conceptually have their outcomes moved. Measuring email responses also represents a somewhat updated take on the postcards voter encouragement that pioneered the political field experiments movement of the 2000s (Green, Gerber and Larimer 2008). Whereas the contact mechanism between post card reminders and email reminders is quite similar, there is little evidence that any voting encouragement studies in the past have received, let alone analyzed the content of their responses. We received more than 700 responses to the reply-address for this email campaign. This corpus was surprising, provided that we did not ask voters to reply or confirm receipt of this email. It is important, though, to keep this response rate in the context of the large number of emails that we sent to voters. We received responses from 671 unique individual, but we sent contact to 413,735; the email response rate was just 0.16%. Initially, we were concerned that these emails were going to be bounces, or requests to be removed from an email list, or outright indignation about contacting a personal

13
email address. And, to be certain, there were some emails that fell into this category; however, majority of the email replies that we received were politically oriented, reasonably tactful, and not requests to be un-spammed. Many emails expressed a candidate endorsement, but many more included information that the voter either had already voted, or intended to vote the following day. Some emails replied in Spanish, presumably because they were signed by a faculty member with a Hispanic surname, while others in English expressed genuine care and thoughtfulness in their responses. In the analysis that follows, we reduce this rich corpus of data to answer two types of questions, one type-causal, and one type-non-causal. First, and of clearest causal import: Did the different treatment messages lead to different rates of email response? Second, and more causally fraught, but descriptively interesting is whether voters who responded to emails were more or less likely to also vote, as well as the content of the email responses we received. There are clear differences in the patterns of email response to the different treatments. Somewhat surprisingly, these patterns do not seem to map onto the response measured through voter turnout. As we report in Figure 2, voters who received either the Native Threat email conditions or the Hispanic Group conditions were much more likely to respond by sending an email (mean number of responses = 198) than those who were assigned to receive either the Information or Social Pressure cues (mean number of responses = 137). Under the sharp-null hypothesis, fewer than 2% of treatment assignments generated more responses to the Native Threat email; none of the sharp-null assignments generated more responses to the Hispanic Group condition. Registered voters who received any of our treatments and emailed a response to our contact were 4.0 percent more likely to vote than similar voters who did not email a response. We are hesitant to assign any causal interpretation to this estimate because it could either be the case those voters who responded to our email were more politically engaged at baseline, leading them both to vote and respond; or, it could be that for some voters our message was so moving that it both led them to respond to our email and also to turnout to vote. Some indirect evidence suggests that it may be that those people who respond to emails are compositionally different -- those individuals who responded were on average 10 years older than those individuals who did not respond. Together with the pattern evident in this data that older voters are more likely to turnout to vote, casts a plausible explanation. Finally, and perhaps most descriptively interestingly, we find that the content of the messages is markedly different depending on the treatment that subjects were assigned. To do so, we employ a “poor-man’s” sentiment classifier; we simply count the number of words in each email response that are either in a researcher defined positive word dictionary, or negative word dictionary. Positive words include “Thanks”, “Regards, “Best”, “Thx” and the like and signal email pleasantness. Negative words include all English curse words, as well as “Jerk”, “Bad”, “Hell”, “Scum” and the like. While employing a more technical sentiment analysis may somewhat improve the classification of this data, the rough classification that we employ seems to hold high
14
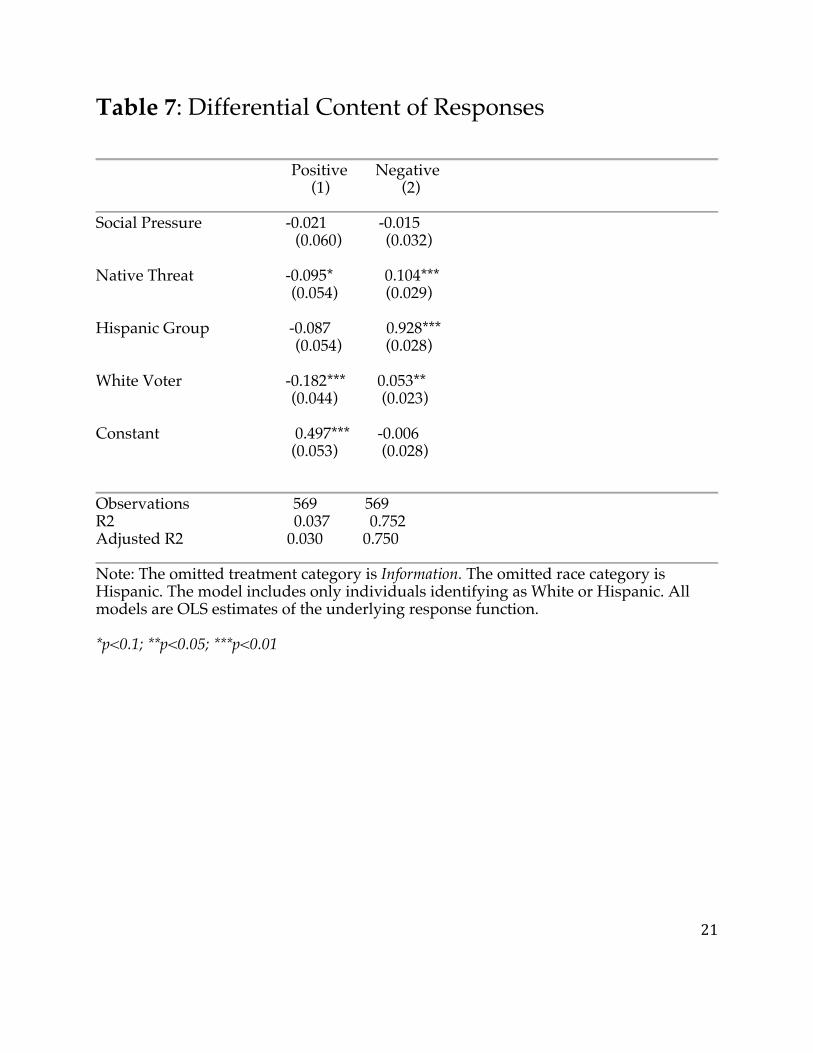
face validity. Nearly 50% of the email responses are classified as either containing positive words or negative words; only 8% email responses contain both a positive and a negative word. As we report in Table 7, when a voter was sent a Native Threat email and selected into responding to that email, she was nearly 10 percent less likely to respond with email content that contained positive words and was correspondingly 10 percent more likely to respond to that email with content that included negative words. When voters received the Hispanic Group prime, they were vastly more likely to respond with a negative email. Descriptively, white voters were much more likely to send an email with negative language, and much less likely to send an email with positive language. In Table 8, Model 2 we estimate an interaction between the treatment language and minority status of voters. We find that most of the negative sentiment in response to the Native Threat treatment is attributable to negative reactions on the part of non-minority voters.
Discussion & Next Steps The results presented here suggest that under certain conditions, emails can effectively increase various forms of political engagement. There are, however, important next steps in this project. First, we will explore if the influence of racial appeals are contingent on the local demographics of voters. For example, among Latinos there may be a conditional effect of ethnic primes depending on the demographic composition of their district. In districts with a large Latino population, perhaps this message elicits a feeling of empowerment and in response to this stimulus, Latinos may turnout in higher number. However, in districts with a small Latino population, this message could demobilize. Latinos who feel “outnumbered” may be less likely to vote.19 Second, we will conduct more sophisticated sentiment analysis on the email replies. Our current approach is reliable, but the use of a more sophisticated sentiment dictionary is more valid compared to our use of several key “negative” and “positive” words. Future research should pursue several lines of research. Scholars should investigate how these email message influence voters in low salience elections. In the 2016 presidential election, voters were bombarded with contact from campaigns and interest groups. Perhaps in local or midterm elections, an individual communication would have a greater impact on voters than in a highly contentions presidential election.20 Researchers should also be mindful of the influence of messages that originate from known versus unknown sources (see for example Nickerson 2007). Our cold emails to voters likely underestimates the influence of emails sent from known campaigns and
19 Specifically, we will look at the proportion of Latino population versus non-Hispanic white in a district. 20 But see Nickerson (2007) that does not find an effect in the 2006 midterm congressional election.
15
organizations. Improved technology provides an opportunity for campaigns to contact and mobilize potential supporters; however, the overall effectiveness of this technology is still up for debate. This new and evolving method of communication is fodder for future academic research; however, one should mindful of how academic interventions mimic campaign efforts.

16
Tables and Figures
Table 1: Demographic Characteristics of Florida Voters, Grouped by Email Status Provides Email Does Not Provide Email
Voted in 2016 89.1 (.0004) 73.9 (.0001)
Proportion Democrat 52.1 (0.0008) 51.9 (0.0002)
Mean Age 45.3 (0.006) 51.1 (0.027)
Proportion Female 52.0 (0.0006) 52.5 (0.0011)
Proportion Minority 32.8 (0.0006) 28.9 (0.0001)
Table 2: Demographic Characteristics of Florida Voters with a Registration Event in 2008 or more Recently, Grouped by Email Status Provides Email Does Not Provide Email
Voted in 2016 92.4 (0.001) 76.6 (0.0002)
Proportion Democrat 57.0 (0.002) 56.2 (0.003)
Mean Age 39.9 (0.031) 41.5 (0.008)
Proportion Female 50.7 (0.001) 49.1 (0.0002)
Proportion Minority 37.7 (0.001) 34.6 (0.0002)

17
Table 3: Successful Randomization No
Email Control Information Social
Pressure Native Threat
Latino Group
Democrat (%)
51.9 52.3 52.6 52.1 52.3 52.2
Voted 2012 72.6 53.9 53.8 54.2 53.6 54.2
Age (Years) 51.1 45.3 45.3 45.3 45.3 45.4
Female (%) 52.5 52.3 52.1 51.9 51.8 52
Minority (%) 28.9 32.7 33 32.7 32.5 32.6

18
Table 4: Missing Validated Data at County Level A large proportion of counties are missing in-person voting data. Here, the bold columns report county abbreviations. Adjacent to each county is listed the number of in-person votes registered in that county, and our determination for whether the county has an incomplete filing. ALA 51,062 False GLA 1 True MRN 72,924 False VOL 91,850 False
BAK 3,586 False GUL 8 True MRT 23,152 False WAK 5,554 False
BAY 25,643 False HAM 2,437 False NAS 13,528 False WAL 13,570 False
BRA 5,108 False HAR 1 True OKA 36,776 False WAS 8 True
BRE 113,470 False HEN 1 True OKE 5,396 False
BRO 63 True HER 35,059 False ORA 142,710 False
CAL 2,456 False HIG 16,203 False OSC 34,160 False
CHA 34 True HIL 174,771 False PAL 293 True
CIT 26,612 False HOL 3,667 False PAS 100,194 False
CLA 97 True IND 25,466 False PIN 337 True
CLL 45,154 False JAC 7,992 False POL 21 True
CLM 9,144 False JEF 3 True PUT 13,053 False
DAD 218,057 False LAF 1,667 False SAN 33,397 False
DES 0 True LAK 65,596 False SAR 76,028 False
DIX 3,021 False LEE 76,858 False SEM 57,036 False
DUV 136,365 False LEO 55,752 False STJ 62 True
ESC 18 True LEV 5 True STL 44,650 False
FLA 15,227 False LIB 1,497 False SUM 12,525 False
FRA 0 True MAD 2,809 False SUW 28 True
GAD 3 True MAN 64,790 False TAY 4,044 False
GIL 4,261 False MON 15,580 False UNI 2,408 False
19
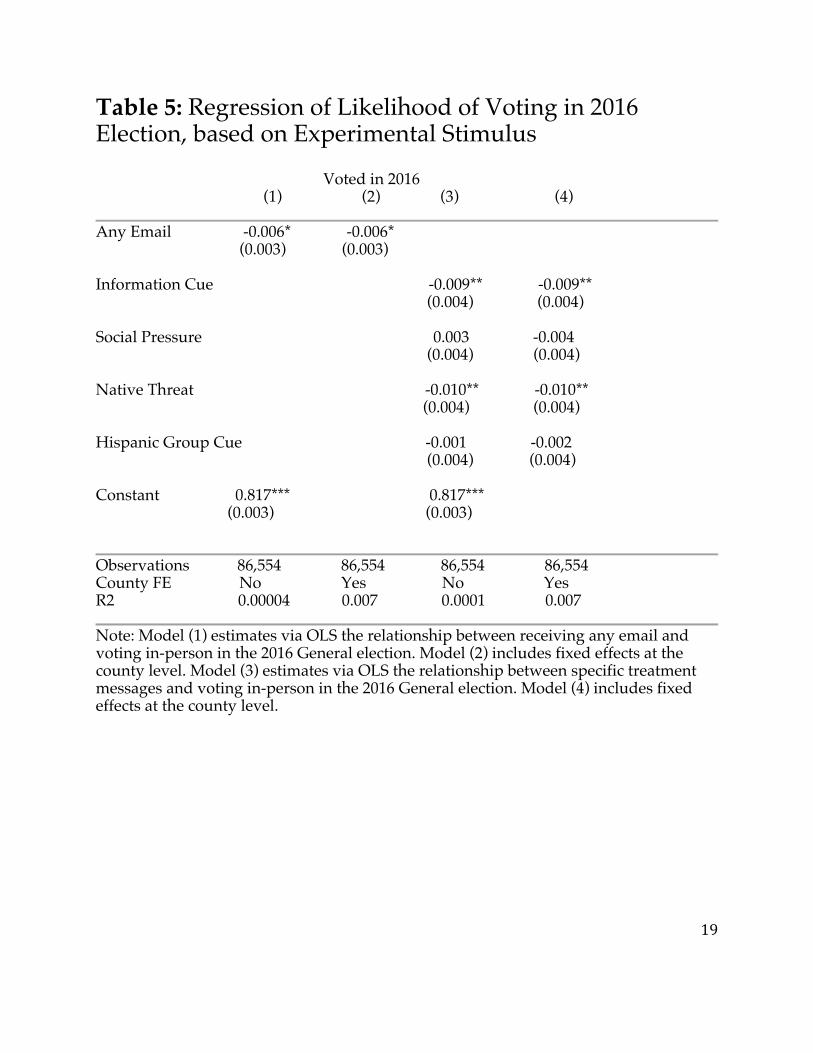
Table 5: Regression of Likelihood of Voting in 2016 Election, based on Experimental Stimulus Voted in 2016 (1) (2) (3) (4)
Any Email -0.006* -0.006* (0.003) (0.003) Information Cue -0.009** -0.009** (0.004) (0.004) Social Pressure 0.003 -0.004 (0.004) (0.004) Native Threat -0.010** -0.010** (0.004) (0.004) Hispanic Group Cue -0.001 -0.002 (0.004) (0.004) Constant 0.817*** 0.817*** (0.003) (0.003)
Observations 86,554 86,554 86,554 86,554 County FE No Yes No Yes R2 0.00004 0.007 0.0001 0.007
Note: Model (1) estimates via OLS the relationship between receiving any email and voting in-person in the 2016 General election. Model (2) includes fixed effects at the county level. Model (3) estimates via OLS the relationship between specific treatment messages and voting in-person in the 2016 General election. Model (4) includes fixed effects at the county level.

20
Table 6: Minority and Hispanic Response to Treatment Voted in 2016 (1) (2)
Information -0.004 -0.007 (0.005) (0.005) Social Pressure -0.001 -0.003 (0.005) (0.005) Native Threat -0.008 -0.011** (0.005) (0.005) Hispanic Group Cue 0.004 0.003 (0.005) (0.005) Minority Voter -0.043*** 0.010 (0.006) (0.008) Information * Minority Voter -0.018** -0.014 (0.009) (0.011) Social Pressure * Minority Voter -0.007 -0.001 (0.009) (0.011) Native Threat * Minority Voter -0.008 0.003 (0.009) (0.011) Hispanic Group * Minority Voter -0.017* -0.022** (0.009) (0.011) Constant 0.830*** 0.815*** (0.004) (0.003)
Observations 86,554 86,554 R2 0.004 0.0002 Residual Std. Error (df = 86544) 0.390 0.391 F Statistic (df = 9; 86544) 39.852*** 2.087**
Note: Model (1) includes an indicator for whether the voter identified as belonging to any non-white race or ethnic group. Model (2) includes an indicator for whether the voter identified as belonging to the Hispanic ethnic group. *p<0.1; **p<0.05; ***p<0.01
21
Table 7: Differential Content of Responses
Positive Negative (1) (2)
Social Pressure -0.021 -0.015 (0.060) (0.032) Native Threat -0.095* 0.104*** (0.054) (0.029) Hispanic Group -0.087 0.928*** (0.054) (0.028) White Voter -0.182*** 0.053** (0.044) (0.023) Constant 0.497*** -0.006 (0.053) (0.028)
Observations 569 569 R2 0.037 0.752 Adjusted R2 0.030 0.750
Note: The omitted treatment category is Information. The omitted race category is Hispanic. The model includes only individuals identifying as White or Hispanic. All models are OLS estimates of the underlying response function. *p<0.1; **p<0.05; ***p<0.01

22
Table 8: Interaction between email language and responder Minority Status
Positive Negative (1) (2)
Social Pressure -0.052 -0.000 (0.120) (0.063) Native Threat -0.117 -0.000 (0.112) (0.058) Hispanic Group -0.158 0.979*** (0.106) (0.055) White Voter -0.230** 0.045 (0.096) (0.050) Social Pressure * White Voter 0.041 -0.021 (0.139) (0.072) Native Threat * White Voter 0.030 0.133** (0.128) (0.067) Hispanic Group * White Voter 0.097 -0.071 (0.123) (0.064) Constant 0.533*** 0.000 (0.083) (0.043)
Observations 569 569 R2 0.038 0.757 Adjusted R2 0.026 0.754
Note: *p<0.1; **p<0.05; ***p<0.01

23
Figure A: General Reminder
Figure B: Social Pressure

24
Figure C: Native Threat
Figure D: Latino Group Threat

25
Figure 1: Coefficient Plots of Regression Models in Table 5, Models 2 & 4

26
Figure 2: Randomization Inference for Email Responses Vertical lines indicate the number of responses received in that treatment condition. Distributions plot the number of responses received when permuting the labels among the treatment conditions, and represent the sharp-null hypothesis that there is no difference in the response rate to different treatment-email conditions.