emarketer webinar: the multitasking consumer—so many screens, so little time
TRANSCRIPT
© 2015 eMarketer Inc.
The Multitasking Consumer:
So Many Screens, So Little Time
Ezra Palmer
Made possible by

© 2015 eMarketer Inc.
12
© 2015 eMarketer Inc.
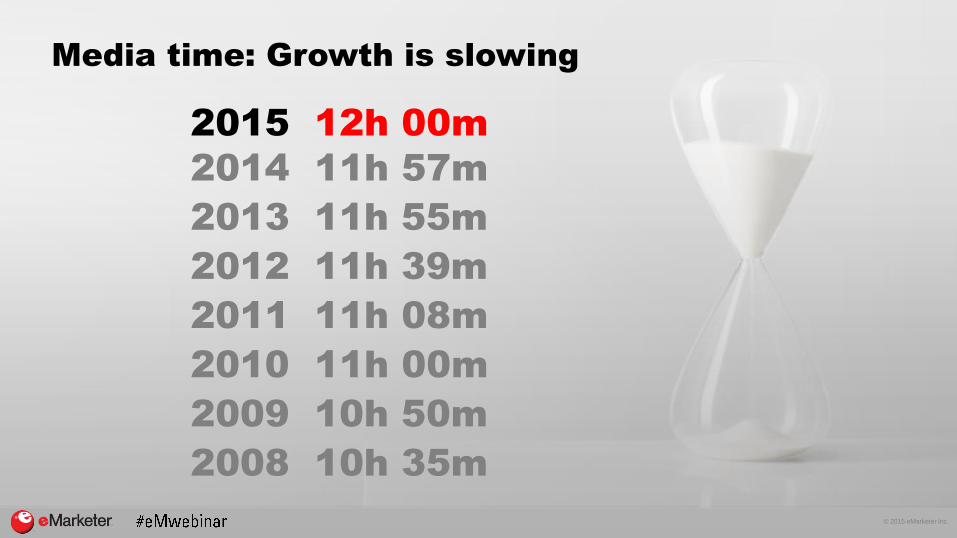
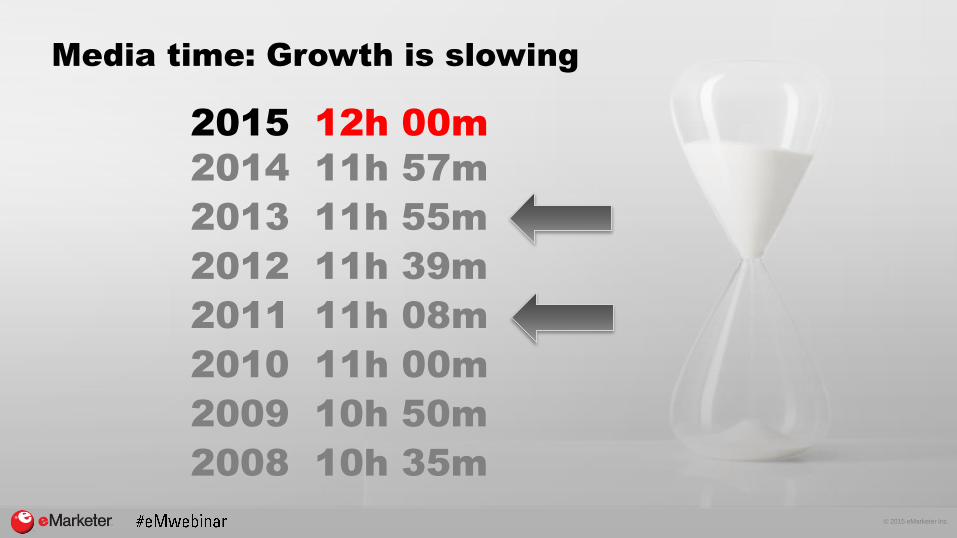
Media time: Growth is slowing
2015 12h 00m
2014 11h 57m
2013 11h 55m
2012 11h 39m
2011 11h 08m
2010 11h 00m
2009 10h 50m
2008 10h 35m
© 2015 eMarketer Inc.
Media time: Growth is slowing
2015 12h 00m
2014 11h 57m
2013 11h 55m
2012 11h 39m
2011 11h 08m
2010 11h 00m
2009 10h 50m
2008 10h 35m
© 2015 eMarketer Inc.
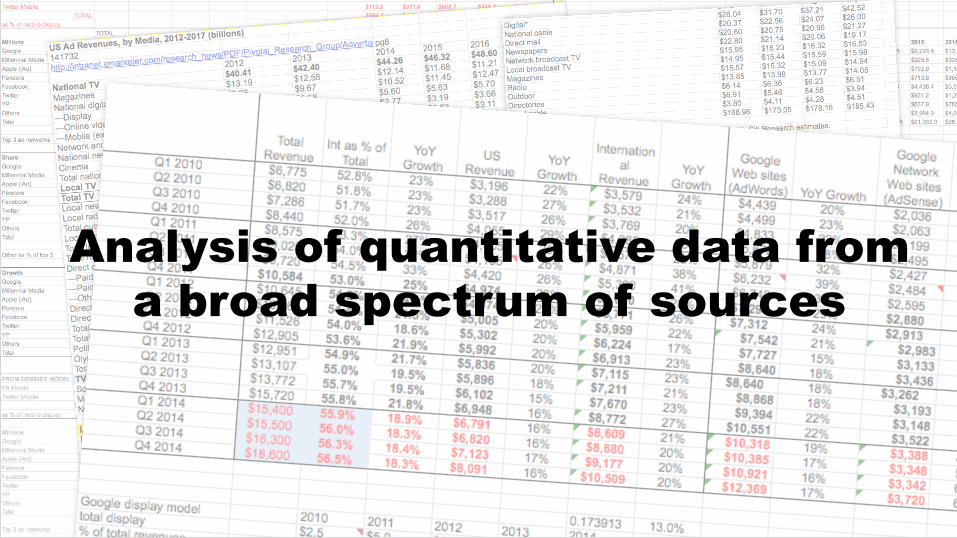
Analysis of quantitative data from
a broad spectrum of sources

© 2015 eMarketer Inc.
Supplemented by in-depth
interviews with a variety of
industry experts
© 2015 eMarketer Inc.
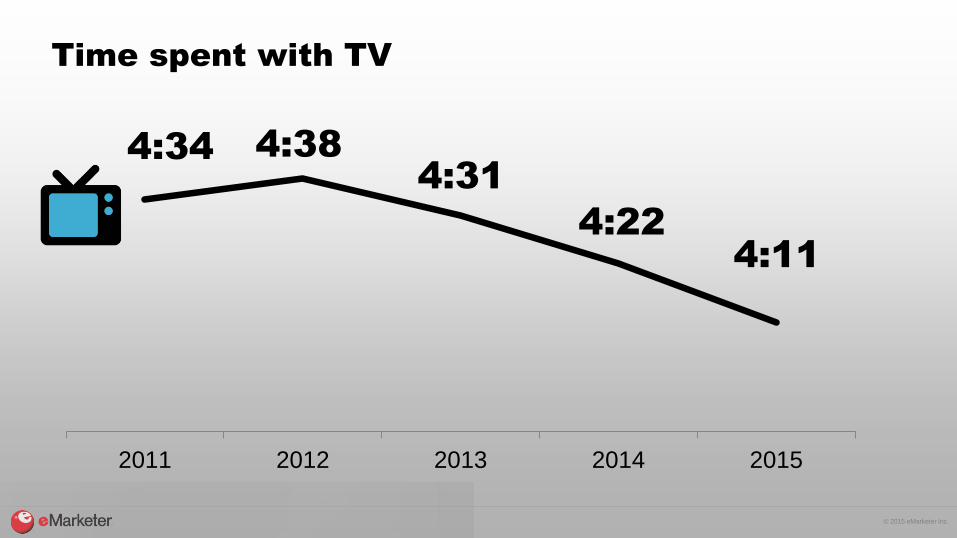
Time spent with TV
2011 2012 2013 2014 2015
4:11
4:22
4:31
4:384:34
© 2015 eMarketer Inc.
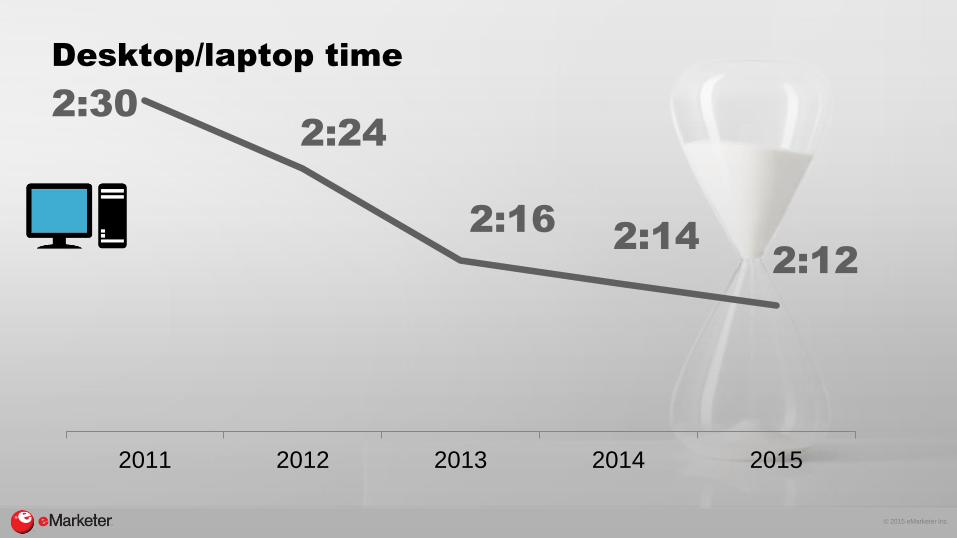
Desktop/laptop time
2011 2012 2013 2014 2015
2:12
2:142:16
2:24
2:30
© 2015 eMarketer Inc.
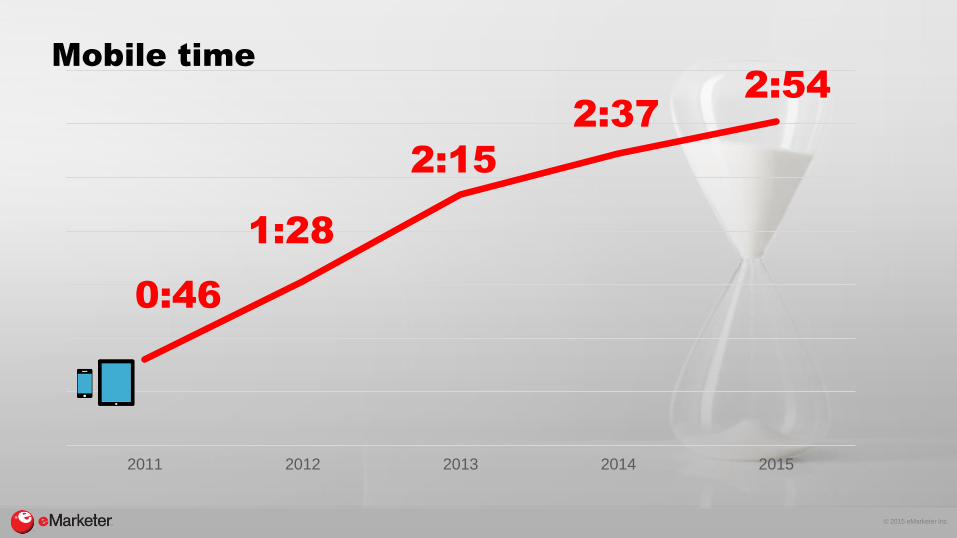
Mobile time
2011 2012 2013 2014 2015
2:54
2:37
2:15
1:28
0:46
© 2015 eMarketer Inc.
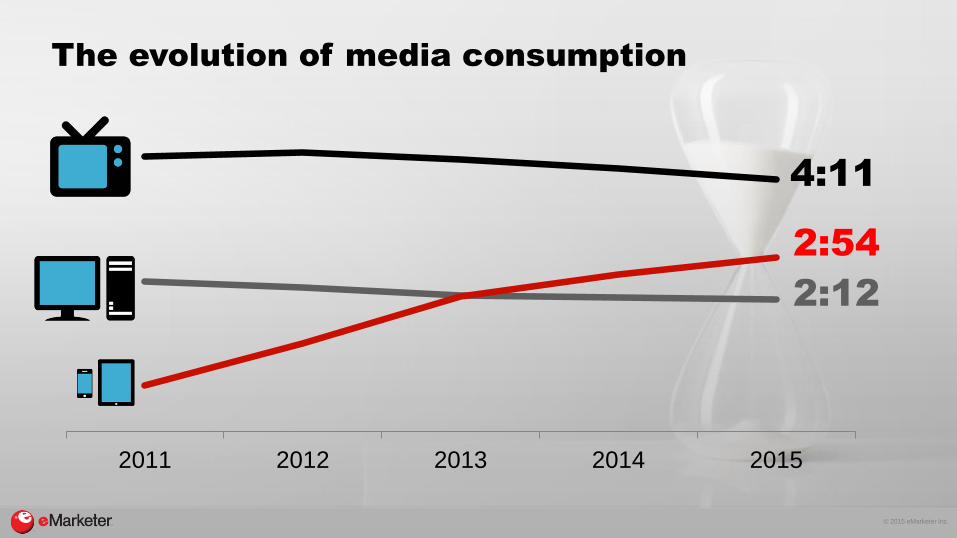
The evolution of media consumption
2011 2012 2013 2014 2015
4:11
2:54
2:12
© 2015 eMarketer Inc.
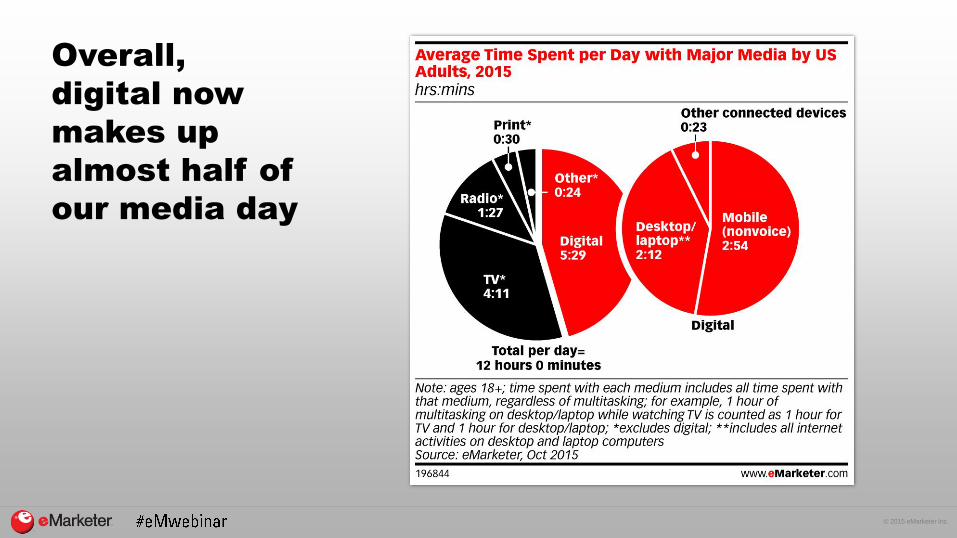
Overall,
digital now
makes up
almost half of
our media day

© 2015 eMarketer Inc.
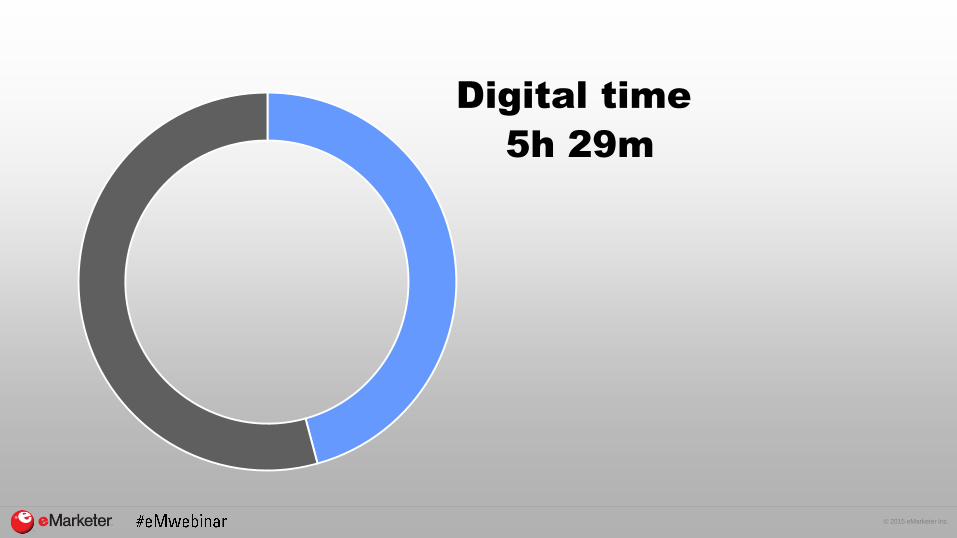
How Are Consumers
Spending Their Digital Time?
© 2015 eMarketer Inc.
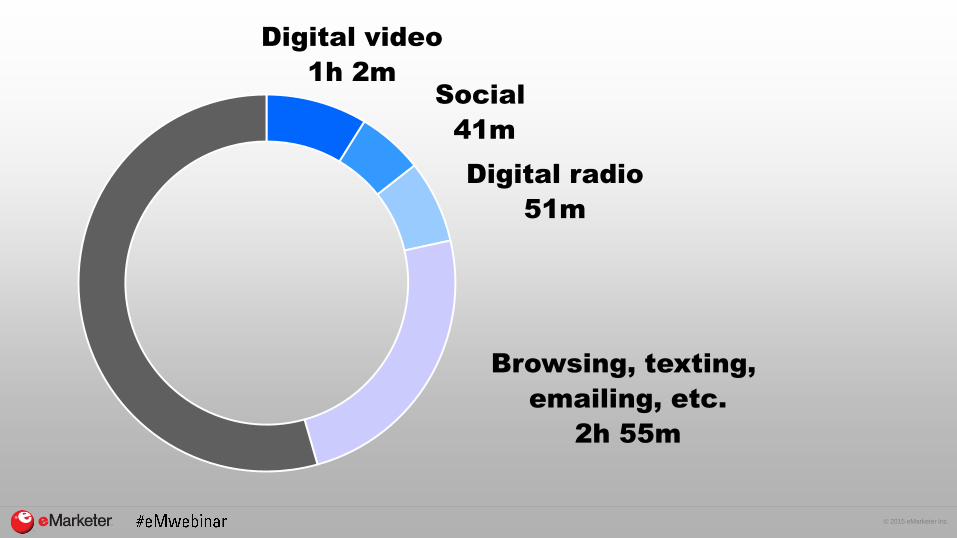
Digital time
5h 29m
© 2015 eMarketer Inc.
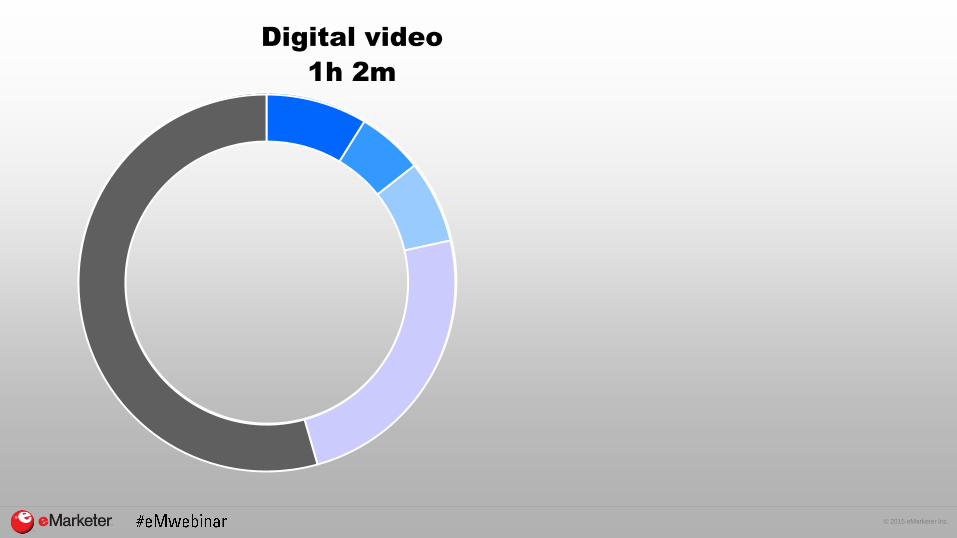
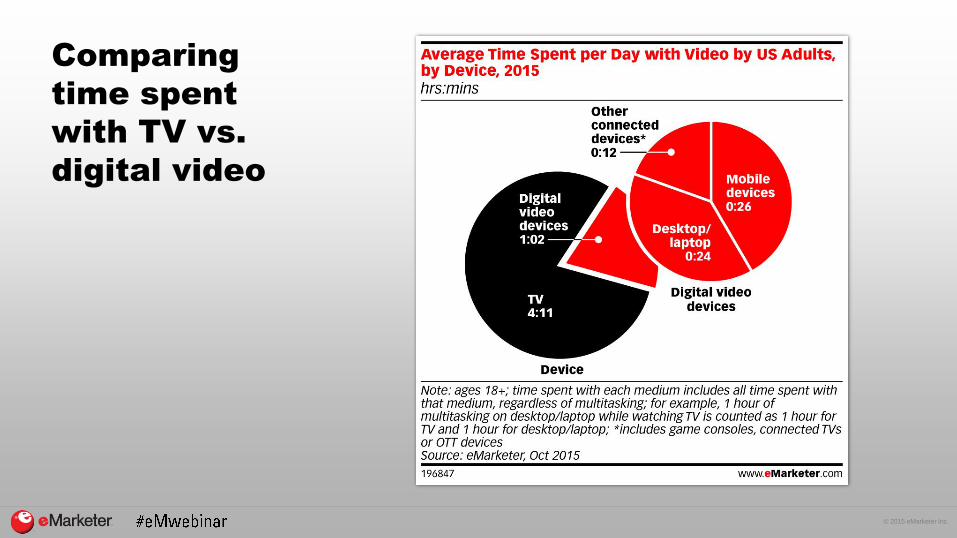
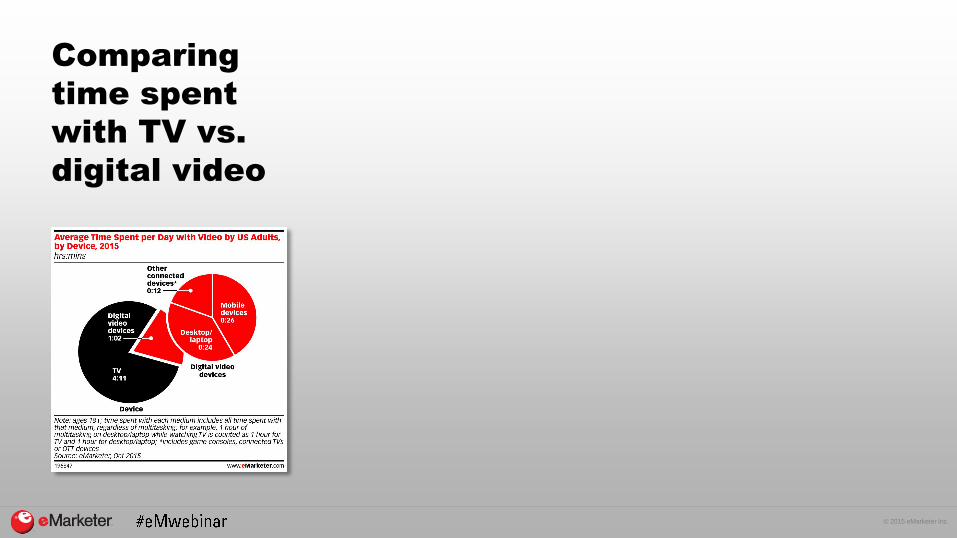
Digital video
1h 2m

© 2015 eMarketer Inc.
Digital video
1h 2m
TV time + video time
5h 13m

© 2015 eMarketer Inc.
Digital video
1h 2m
Social
41m
© 2015 eMarketer Inc.
Digital video
1h 2m
Social
41m
Digital radio
51m
© 2015 eMarketer Inc.
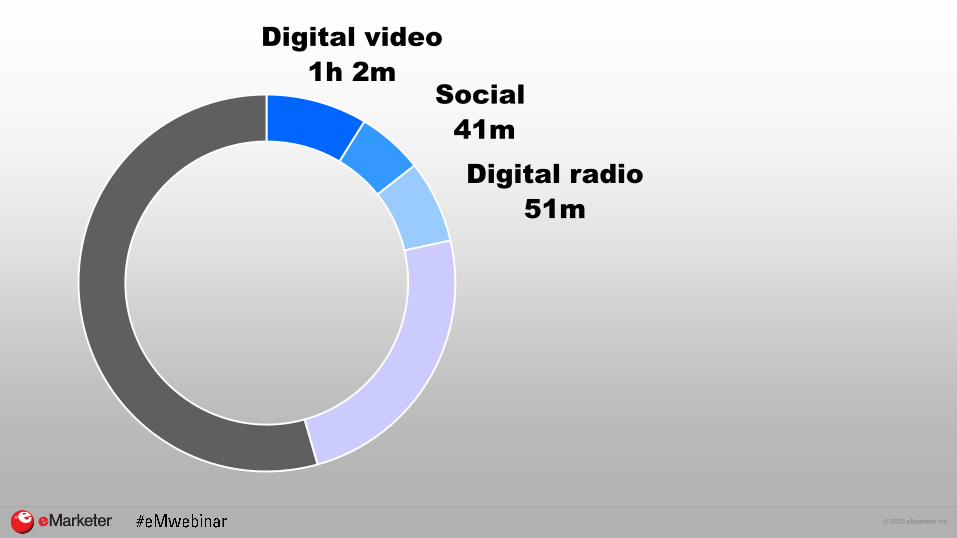
Digital video
1h 2m
Social
41m
Digital radio
51m
Browsing, texting,
emailing, etc.
2h 55m
© 2015 eMarketer Inc.
How Are Consumers
Spending Their Mobile Time?
© 2015 eMarketer Inc.
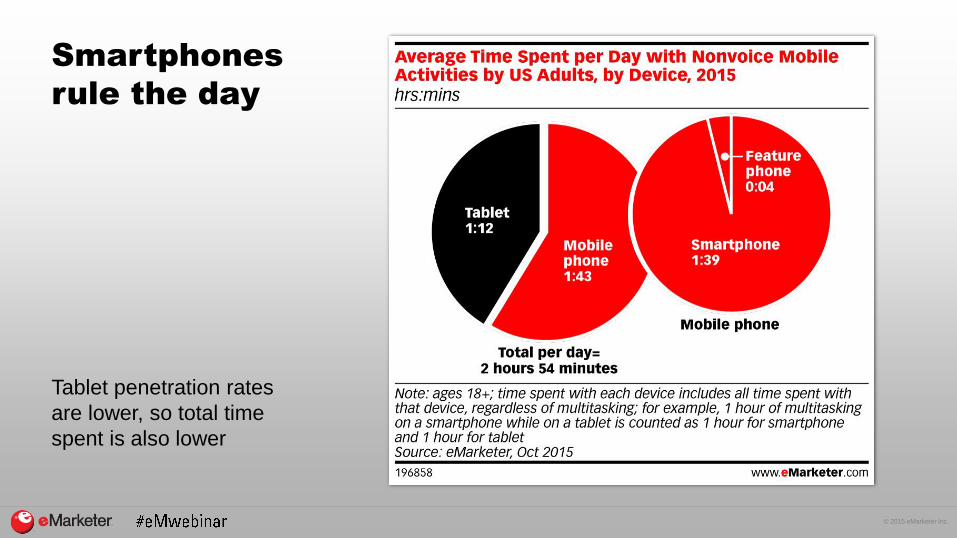
Smartphones
rule the day
Tablet penetration rates
are lower, so total time
spent is also lower
© 2015 eMarketer Inc.
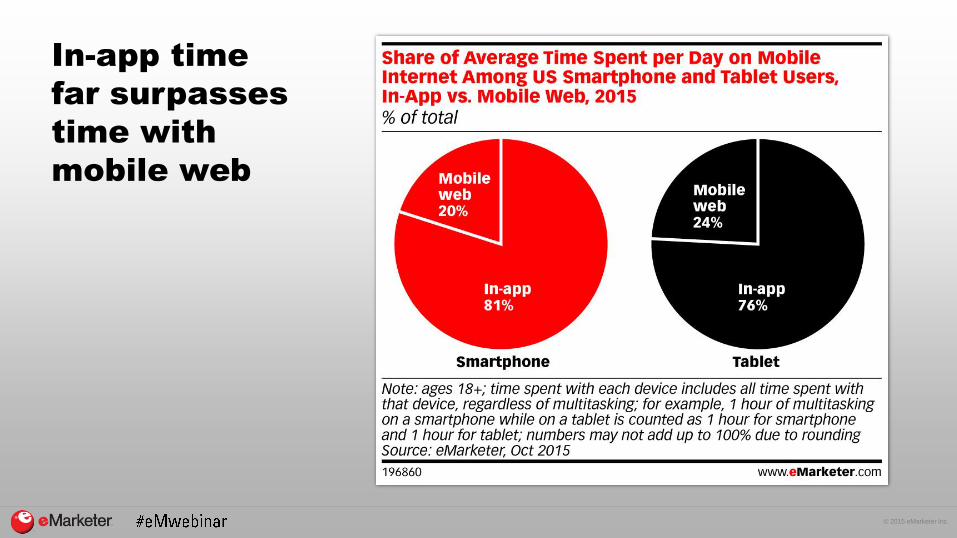
In-app time
far surpasses
time with
mobile web
© 2015 eMarketer Inc.
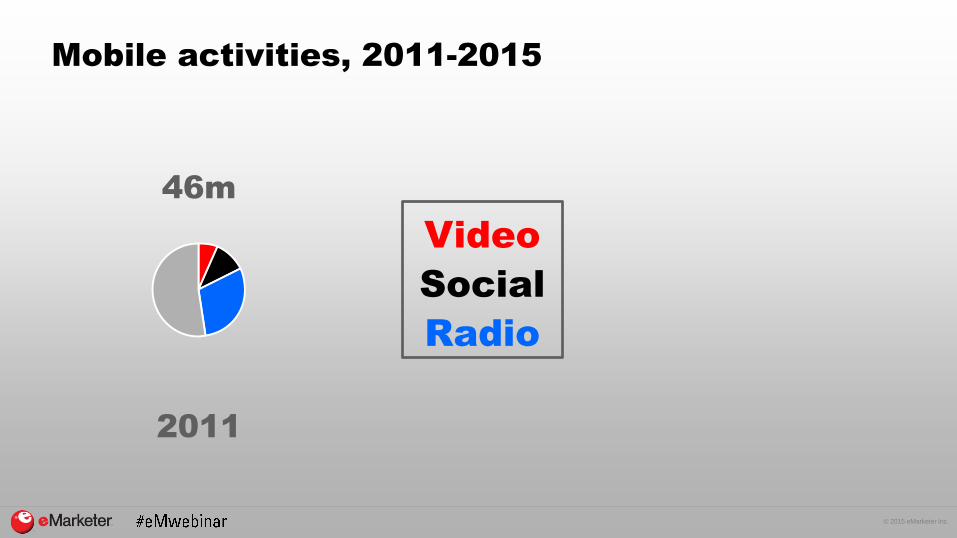
Mobile activities, 2011-2015
2011
46m
Video
Social
Radio

© 2015 eMarketer Inc.
Mobile activities, 2011-2015
2011
46m
Video
Social
Radio
2015
2h 54m
© 2015 eMarketer Inc.
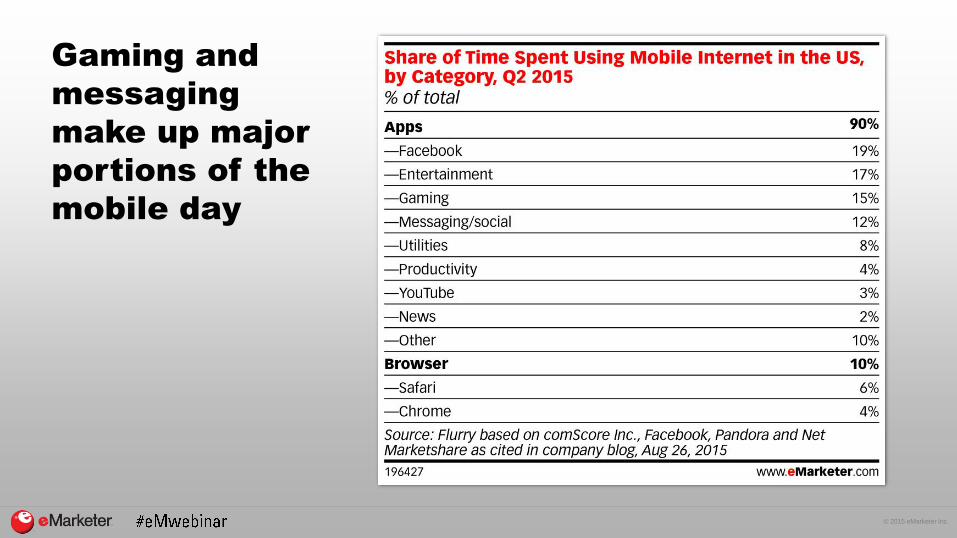
Gaming and
messaging
make up major
portions of the
mobile day
© 2015 eMarketer Inc.
Will Mobile Time
Keep Growing?
© 2015 eMarketer Inc.
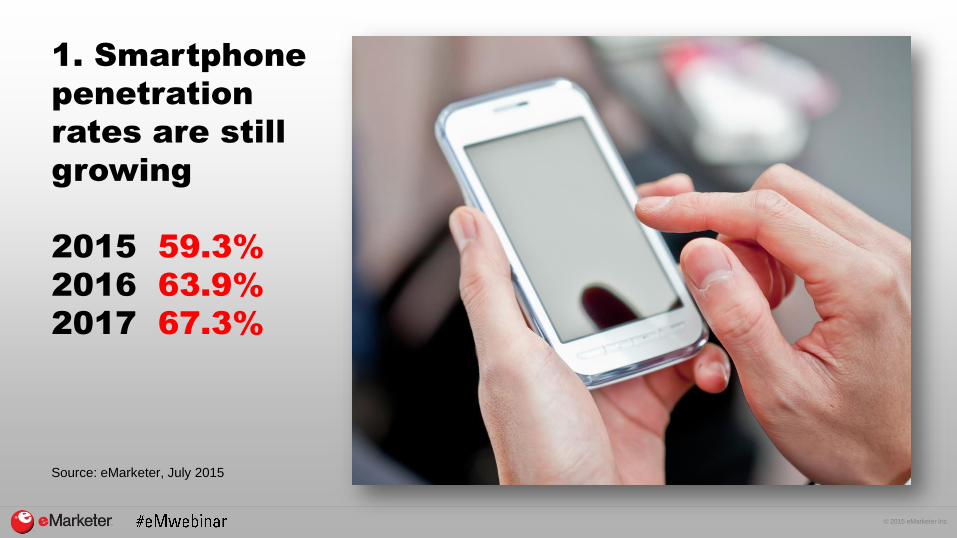
1. Smartphone
penetration
rates are still
growing
2015 59.3%
2016 63.9%
2017 67.3%
Source: eMarketer, July 2015
© 2015 eMarketer Inc.
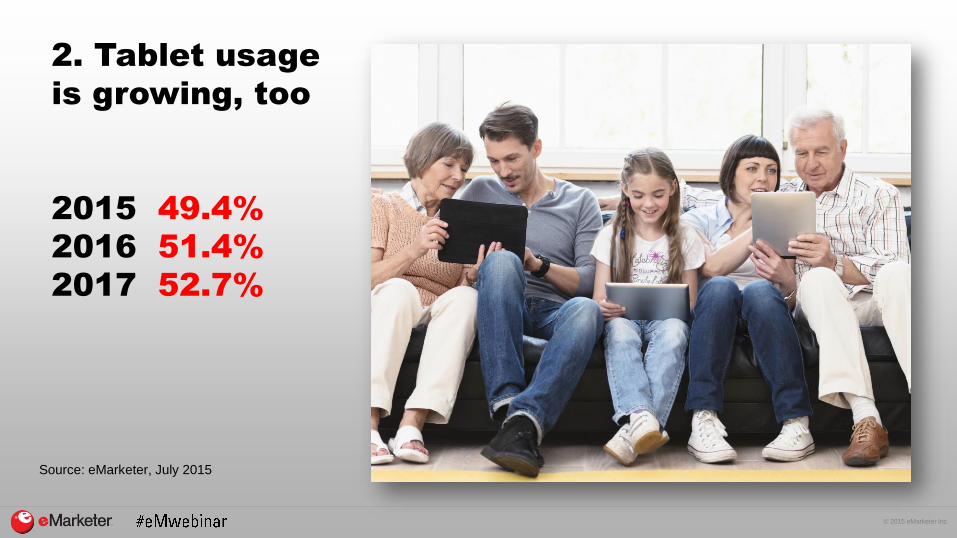
2. Tablet usage
is growing, too
2015 49.4%
2016 51.4%
2017 52.7%
Source: eMarketer, July 2015

© 2015 eMarketer Inc.
3. More than a
third of US
consumers use
both devices
2015 34.8%
2016 38.9%
2017 41.8%
Source: eMarketer, July 2015
© 2015 eMarketer Inc.
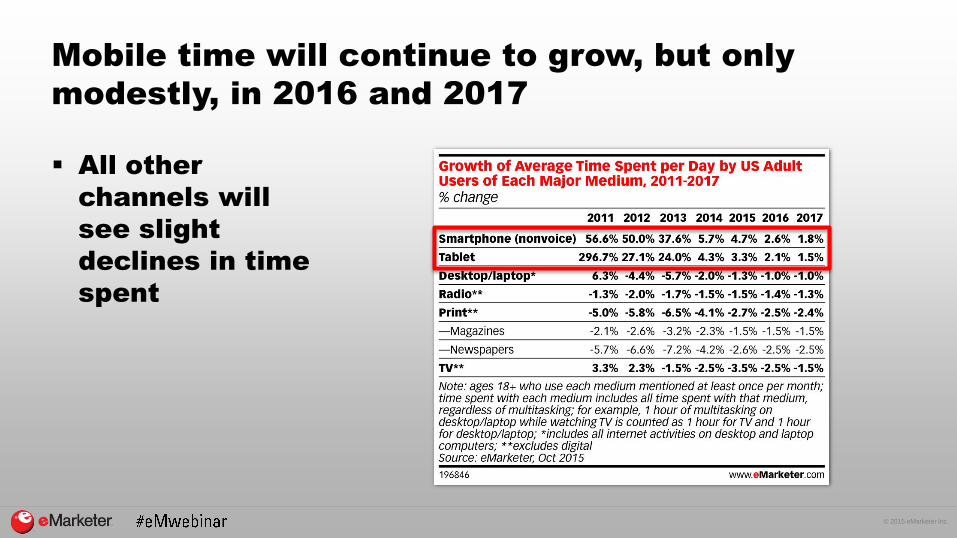
Mobile time will continue to grow, but only
modestly, in 2016 and 2017
All other
channels will
see slight
declines in time
spent

© 2015 eMarketer Inc.
Are Marketers Adapting
to the New Reality?

© 2015 eMarketer Inc.
© 2015 eMarketer Inc.
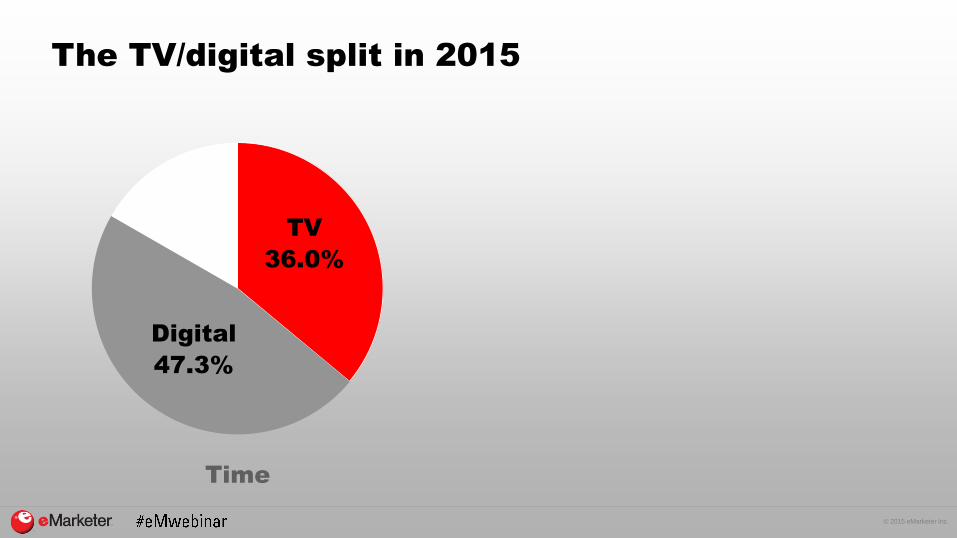
The TV/digital split in 2015
Time
TV
36.0%
Digital
47.3%
© 2015 eMarketer Inc.
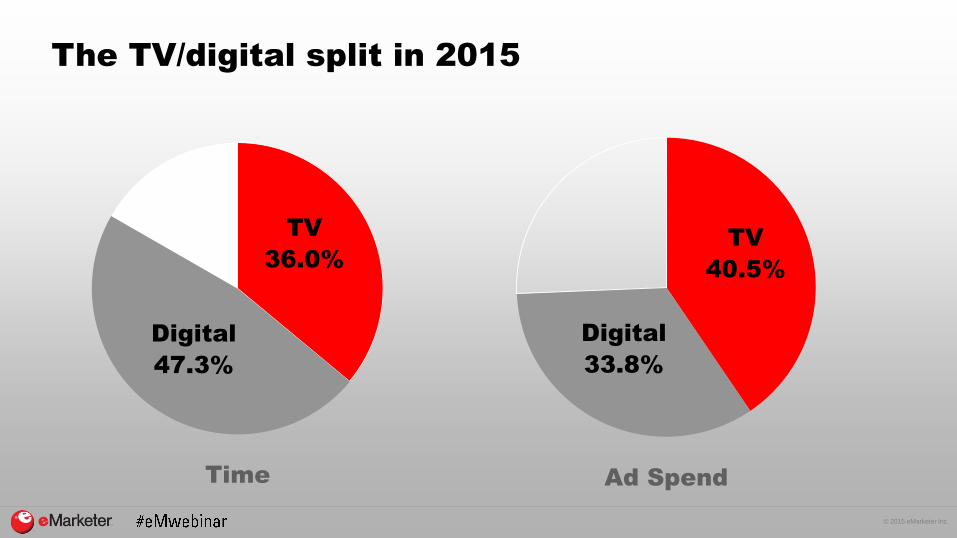
The TV/digital split in 2015
Time Ad Spend
TV
36.0%
Digital
47.3%
TV
40.5%
Digital
33.8%
© 2015 eMarketer Inc.
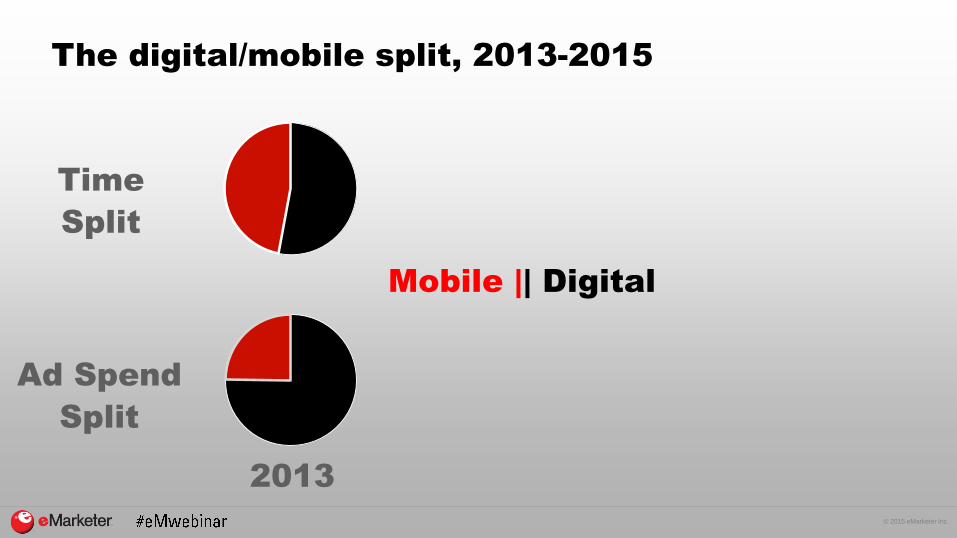
The digital/mobile split, 2013-2015
2013
Time
Split
Ad Spend
Split
Mobile || Digital
© 2015 eMarketer Inc.
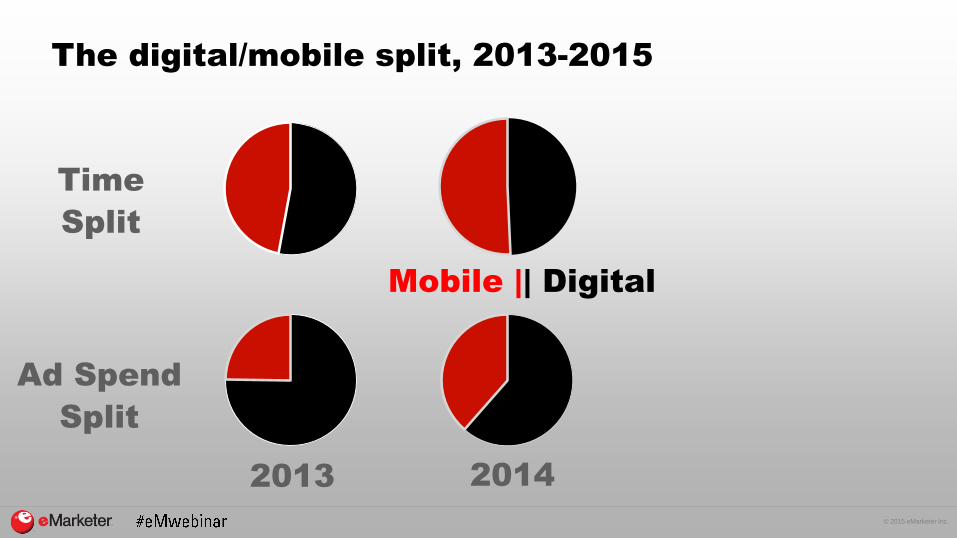
The digital/mobile split, 2013-2015
2013
Time
Split
Ad Spend
Split
2014
Mobile || Digital

© 2015 eMarketer Inc.
The digital/mobile split, 2013-2015
2013 2015
Time
Split
Ad Spend
Split
2014
Mobile || Digital
© 2015 eMarketer Inc.
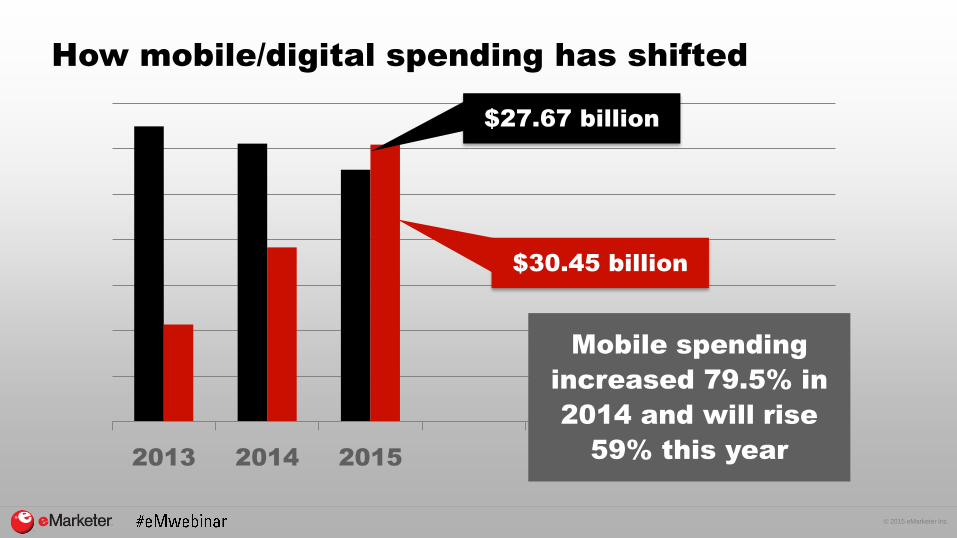
How mobile/digital spending has shifted
2013 2014 2015
$27.67 billion
$30.45 billion
Mobile spending
increased 79.5% in
2014 and will rise
59% this year

© 2015 eMarketer Inc.
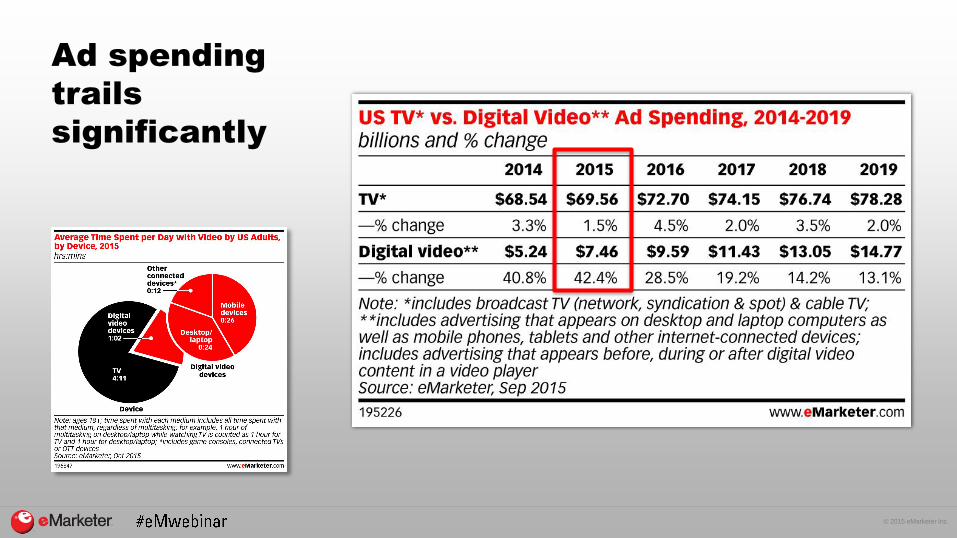
The turning tide
2013 2014 2015 2016 2017 2018 2019
$28.21 billion
$65.49 billion
© 2015 eMarketer Inc.
Comparing
time spent
with TV vs.
digital video
© 2015 eMarketer Inc.
Comparing
time spent
with TV vs.
digital video
© 2015 eMarketer Inc.
Ad spending
trails
significantly

© 2015 eMarketer Inc.
The Elephant in the Room
© 2015 eMarketer Inc.
12
© 2015 eMarketer Inc.
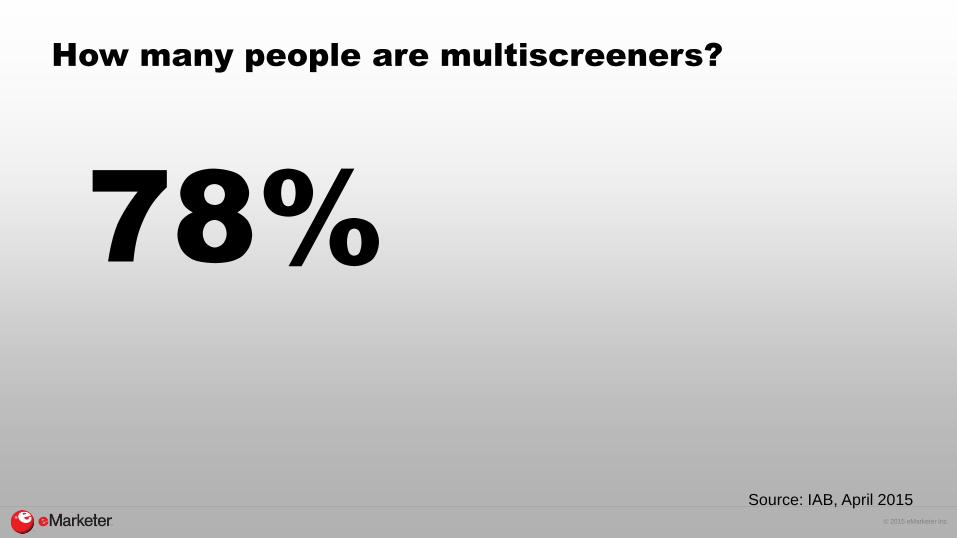
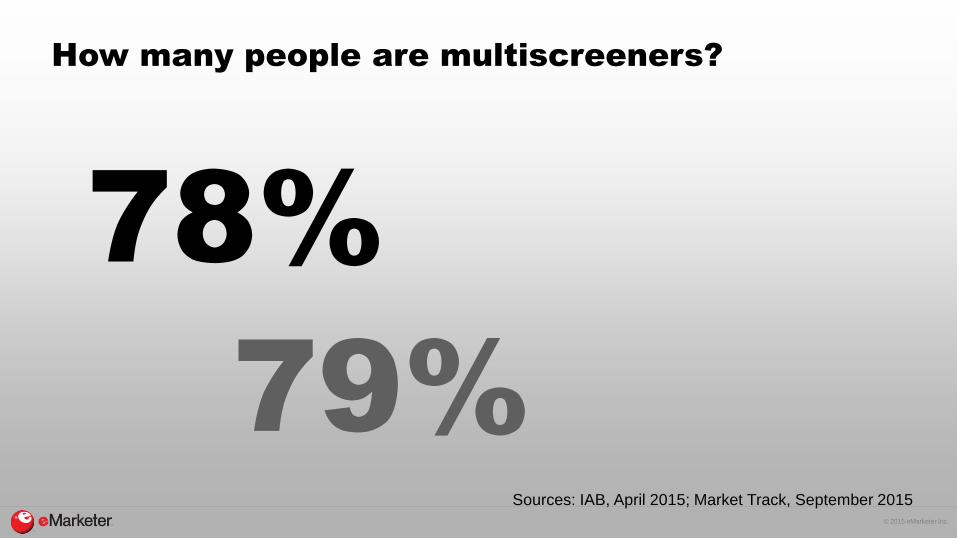
How many people are multiscreeners?
78%
Source: IAB, April 2015
© 2015 eMarketer Inc.
How many people are multiscreeners?
78%
79%Sources: IAB, April 2015; Market Track, September 2015
© 2015 eMarketer Inc.
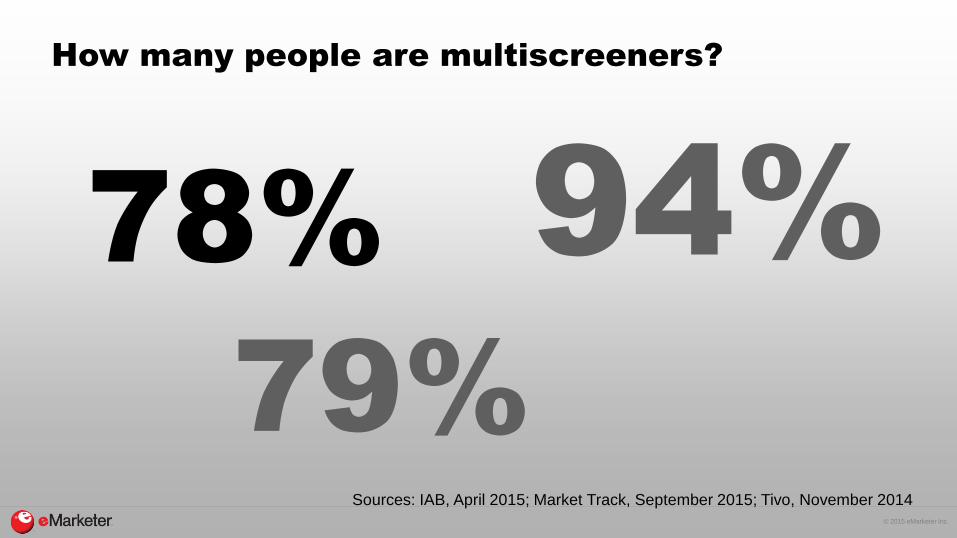
How many people are multiscreeners?
78%
79%
94%
Sources: IAB, April 2015; Market Track, September 2015; Tivo, November 2014
© 2015 eMarketer Inc.
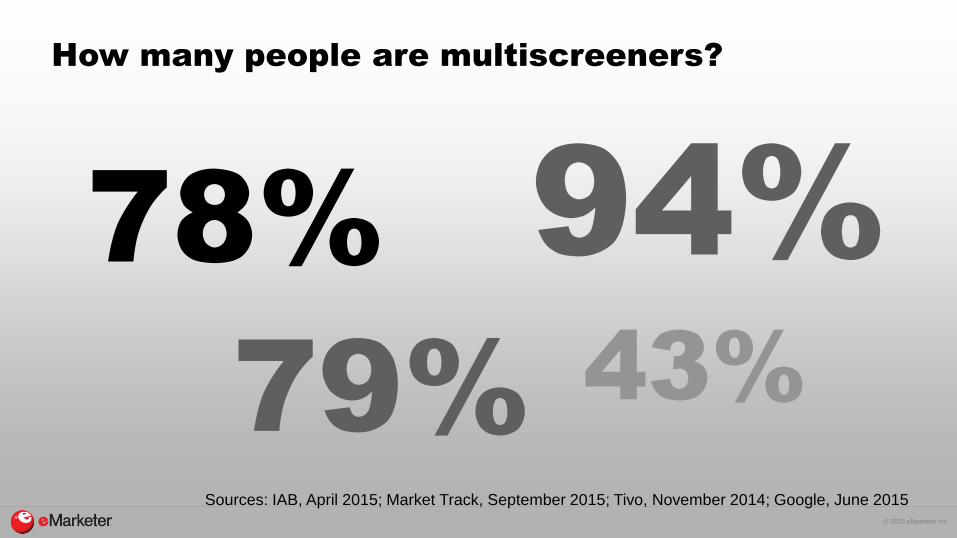
How many people are multiscreeners?
78%
79%
94%
43%
Sources: IAB, April 2015; Market Track, September 2015; Tivo, November 2014; Google, June 2015
© 2015 eMarketer Inc.
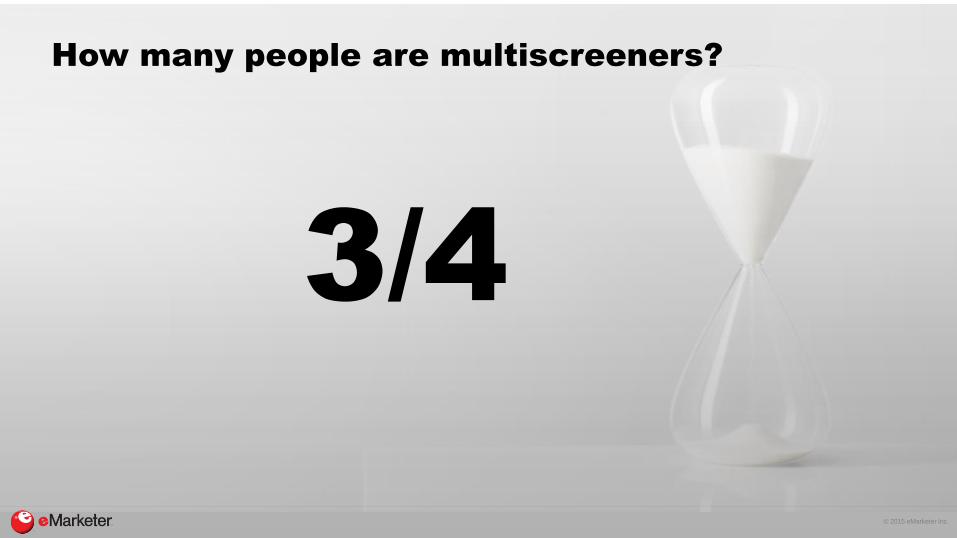
3/4
How many people are multiscreeners?
© 2015 eMarketer Inc.
2 hours 10 minutes?
How much time are they multiscreening?
Source: Millward Brown, March 2014

© 2015 eMarketer Inc.
2 hours 30 minutes?
How much time are they multiscreening?
© 2015 eMarketer Inc.
2 hours 45 minutes?
How much time are they multiscreening?
© 2015 eMarketer Inc.
3+ hours?
How much time are they multiscreening?
© 2015 eMarketer Inc.
6+ hours?
How much time are they multiscreening?

© 2015 eMarketer Inc.
Five simple takeaways:
The average US adult consumes 12 hours of media daily
Digital time makes up nearly half of that time
Advertisers have adjusted their spending to match the
shift to mobile
Roughly three-quarters of the population multiscreen
The amount of time they multiscreen is probably very
large
©2015 AKAMAI | FASTER FORWARDTM
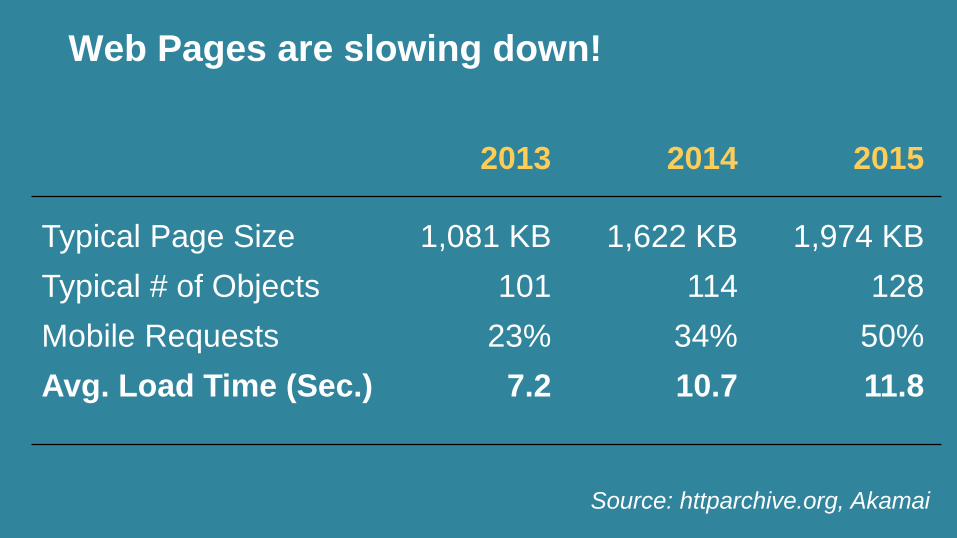
Web Pages are slowing down!
Typical Page Size
Typical # of Objects
Mobile Requests
Avg. Load Time (Sec.)
1,622 KB
114
34%
10.7
2014
1,081 KB
101
23%
7.2
2013
Source: httparchive.org, Akamai
1,974 KB
128
50%
11.8
2015
©2015 AKAMAI | FASTER FORWARDTM
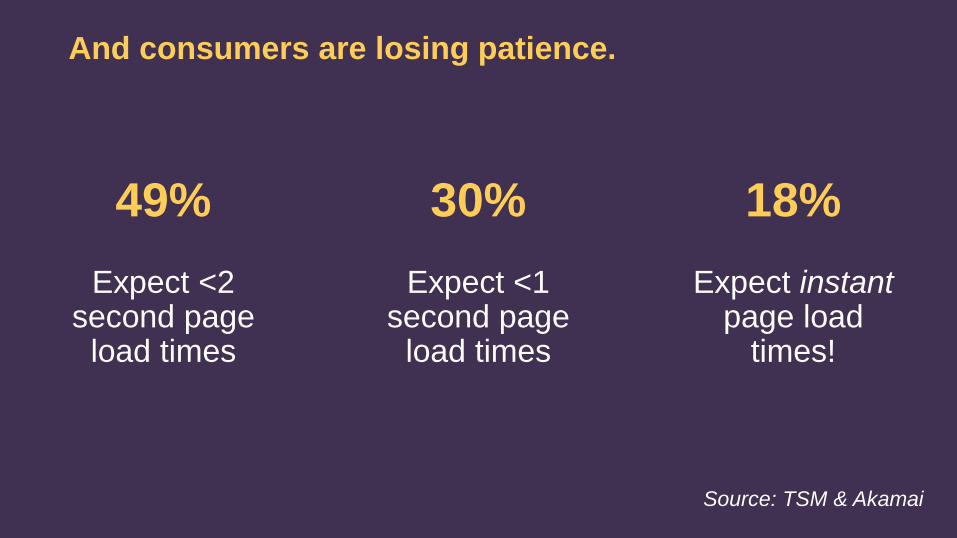
And consumers are losing patience.
49%
Expect <2 second page
load times
30%
Expect <1 second page
load times
18%
Expect instantpage load
times!
Source: TSM & Akamai
©2015 AKAMAI | FASTER FORWARDTM
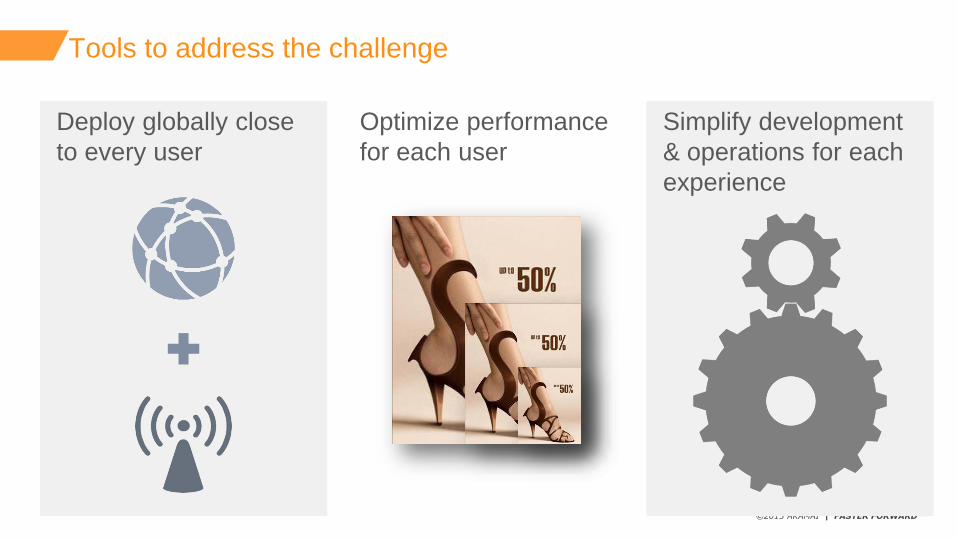
Tools to address the challenge
Deploy globally close
to every user
Optimize performance
for each user
Simplify development
& operations for each
experience
©2015 AKAMAI | FASTER FORWARDTM
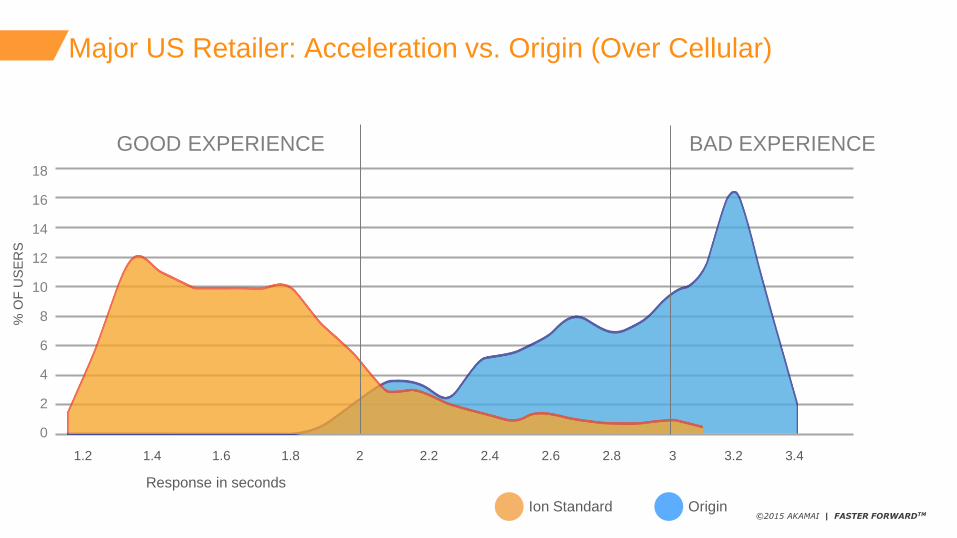
Major US Retailer: Acceleration vs. Origin (Over Cellular)
GOOD EXPERIENCE BAD EXPERIENCE
% O
F U
SE
RS
18
16
14
12
10
8
6
4
2
0
Response in seconds
1.2 1.4 1.6 1.8 2 2.2 2.4 2.6 2.8 3 3.2 3.4
Ion Standard Origin
©2015 AKAMAI | FASTER FORWARDTM
Two free reports
Questions? [email protected]
Customized Mobile
Images Report9 Key Consumer
Insights Report
© 2015 eMarketer Inc.
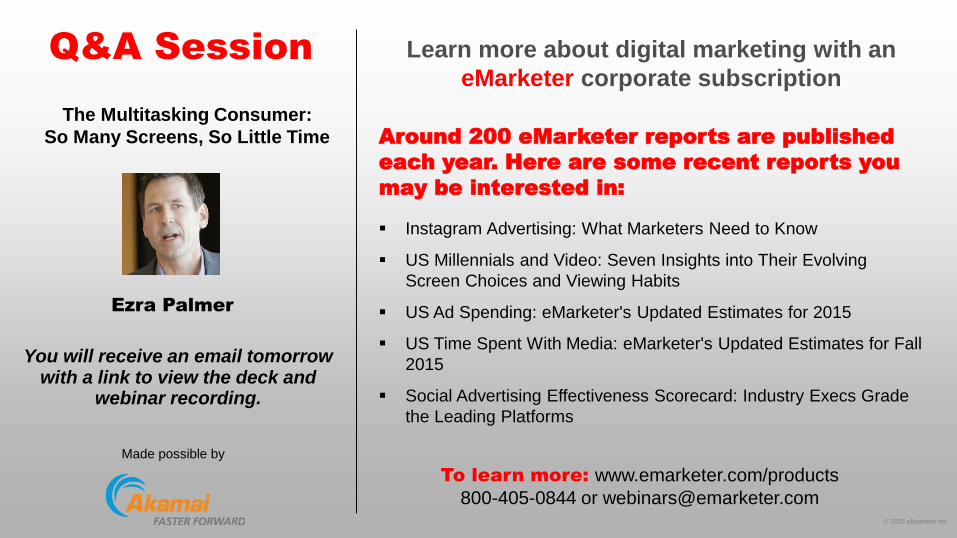
Learn more about digital marketing with an
eMarketer corporate subscription
Around 200 eMarketer reports are published
each year. Here are some recent reports you
may be interested in:
Q&A Session
Made possible by
You will receive an email tomorrow with a link to view the deck and
webinar recording.
To learn more: www.emarketer.com/products
800-405-0844 or [email protected]
Ezra Palmer
The Multitasking Consumer:
So Many Screens, So Little Time
Instagram Advertising: What Marketers Need to Know
US Millennials and Video: Seven Insights into Their Evolving
Screen Choices and Viewing Habits
US Ad Spending: eMarketer's Updated Estimates for 2015
US Time Spent With Media: eMarketer's Updated Estimates for Fall
2015
Social Advertising Effectiveness Scorecard: Industry Execs Grade
the Leading Platforms