embankment quality phase ii - iowapublications.iowa.gov/17190/1/iadot_tr401phase2...embankment...
TRANSCRIPT

EMBANKMENT QUALITY
PHASE II FINAL REPORT
Sponsored by the Project Development Division of the Iowa Department of Transportation
and the Iowa Highway Research Board Iowa DOT Project TR-40 I
CTRE Management Project 97-8
DECEMBER 1999
Center for Transportation Research and Education
IOWA STATE UNIVERSITY

The opinions, findings, and conclusions expressed in this publication are those of the authors and not necessarily those of the Iowa Department of Transportation.
CTRE's mission is to develop and implement innovative methods, materials, and technologies for improving transportation efficiency, safety, and reliability, while improving the learning environment of students, faculty, and staff in transportation-related fields.

Embankment Quality Phase 11 Final Report
Principal Contributor David J. White
Graduate Research Assistant Geotechnical/Materials Division
Civil and Construction Engineering Department Iowa State University
Principal Investigator Kenneth L. Bergeson
Professor of Civil Engineering Iowa State University
Co-Principal Investigator Charles T. Jahren
Associate Professor of Construction Engineering Iowa State University
Graduate Research Assistant Matt Wermager
Iowa State University
Sponsored by the Project Development Division of the Iowa Department of Transportation
and the Iowa Highway Research Board Iowa DOT Project TR-40 I
Preparation of this report was financed in part through funds provided by the Iowa Department of Transportation
through its research management agreement with the Center for Transportation Research and Education,
CTRE Management Project 97-8.
Center for Transportation Research and Education Iowa State University
Iowa State University Research Park 290 I South Loop Drive, Suite 3100
Ames, IA 500 I 0-861 5 Telephone: 515-294-8103
Fax: 515-294-0467 http://www.ctre.iastate.edu
December 1999
TABLE OF CONTENTS
Abstract ......................................................................................................................................... 1
Phase I Summary ............................................................................................................................. 2
Phase II Introduction ........................................................................................................................ 3
Embankment Construction with Cohesionless Soils .................................................................... 4
Clay and Silt fines in Cohesionless Soils ................................................................................... .4
Cohesionless Silt Laboratory Test Results .................................................................................. 5 Laboratory Analysis .............................................................................................................. 6
Grain-Size Distribution .................................................................................................. 8 Relative Density Testing ................................................................................................ 9 Standard Proctor/Relative Density Comparison ............................................................ 11 Permeability .................................................................................................................... 13
Iowa Modified Relative Density Test. ......................................................................................... 14
Cohesionless Material Construction Observations ..................................................................... 18
Cohesionless Field Testing Results ............................................................................................. 18 DCP Index Testing ................................................................................................................ 18 Density by Depth Testing ..................................................................................................... 23 Compaction Effort/Rolling Patterns ..................................................................................... 28
Post Construction Testing ............................................................................................................ 30
Embankment Construction with Cohesive Soils ........................................................................... 32
Cohesive Soil Field Testing Results ............................................................................................ 34 Field and Laboratory Test Procedures .................................................................................. 34 Drilling and Sampling Operations ........................................................................................ 35 Project Locations ................................................................................................................... 36 Site and Subsurface Conditions - U.S. Highway 61, Lee County ...................................... 36 Filed Density Tests - U.S. Highway 61, Lee County .......................................................... 37
Plasticity vs. Saturation .................................................................................................. 41
DCP Index Testing- U.S. Highway 61, Lee County ................................................................. 42 Rubber-Tired Compaction .................................................................................................... 45
Unconfined Compressive Strength/DCP Index Comparison ........................................ 49 Aeration/Cutting by Disking ................................................................................................. 51 Site and Subsurface Conditions - U.S. Highway 34, Henry County .................................. 55 Field Density Tests - U.S. Highway 34, Henry County ...................................................... 55
Plasticity vs. Saturation .................................................................................................. 60 DCP Index Testing- U.S. Highway 34, Henry County ...................................................... 61 Subsurface Explorations ........................................................................................................ 63
Shelby Tube Sampling and SPT Testing ....................................................................... 63 Cone Penetration Testing ............................................................................................... 66
iii
Summary of Phase II Results .......................................................................................................... 68
Granular Soils ............................................................................................................................... 68
Fine and Coarse-Grained Soils with Plasticity ............................................................................ 68
Proposed Design and Construction Specifications .....•••..•....•••••..••••••••••..•...•..•••.....•••...•....•••.......• 70
Soil Performance Classification for Design and Construction ................................................... 70
Iowa Soil Design and Construction (SDC) Charts ...................................................................... 71 Iowa SDC Chart A (Granular Soils) ..................................................................................... 71 Iowa SDC Chart B (Fine and Coarse-Grained Plastic Soils) ............................................... 72 Soil Classification Comparison: Proposed vs. Current Method .......................................... 75
Embankment Construction Specifications .................................................................................. 76 Moisture Control Charts ........................................................................................................ 76
Granular Soils ................................................................................................................. 77 Fine and Coarse-Grained Plastic Soils ........................................................................... 77
Embankment Construction Guidelines ................................................................................. 79 Construction Methods .................................................................................................... 79 End Result Testing ......................................................................................................... 80
Pilot Project Results •.......•••••.•....•••••....••..••....•••••••••....•••••....•........•••.•.•.•.•••••.••.....••...••••...••..•••.......•..• 82
Granular Soils ............................................................................................................................... 82
Conclusions of Granular Soils with Pl<lO and LL<50 Pilot Project.. ....................................... 83
Fine and Coarse-Grained Plastic Soils ........................................................................................ 85 U.S. Highway 520 ................................................................................................................. 85 U.S. Highway 6 ..................................................................................................................... 87 U.S. Highway 5 ..................................................................................................................... 88
Iowa DOT Training ...................................................................................................................... 91
Recommendations .........•..........•......•••...•••.•••................••......•...•..••••.•••••••••...••....••..••••....••.••....•••...•.•• 91
Short Term .................................................................................................................................... 91
Long Term .................................................................................................................................... 91
Acknowledgments .••..•••...••••••••••.••..••...•••.••..•••••••••••••..••..••••.•••••••....••..•..••••••••••....••..•••.•••••.•••...•.••••...• 93
References ...••••••..•••.....•••..........••...••.•••..••.••••........••.....•••............••...••••..•........••....••...••••..••..••••.•...••••• 93
iv
FIGURE 1
FIGURE2
FIGURE 3
FIGURE4
FIGURE 5
FIGURE 6
FIGURE 7
FIGURE 8
FIGURE 9
FIGURE 10
FIGURE 11
FIGURE 12
FIGURE 13
FIGURE 14
FIGURE 15
FIGURE 16
FIGURE 17
FIGURE 18
FIGURE 19
FIGURE20
FIGURE21
FIGURE22
FIGURE23
FIGURE24
FIGlJRE25
FIGURE 26
FIGURE27
FIGURE28
FIGURE29
FIGURE 30
FIGURE 31
LIST OF FIGURES
Effect of fines on the difference between maximum vibrated density and of oven dry sand and maximum standard compaction density ....... 6
Grain-size distributions ......................................................................................... 8
Relative density test results ................................................................................. 10
Standard Proctor moisture-density relationships ................................................ 12
Iowa Modified Relative Density test results ....................................................... 15
Sample C-1 fine sand at 13% moisture ............................................................... 16
Sample B-5 silty fine sand at 13% moisture ....................................................... 16
Sequential photographs of test pit excavation over 10 minute span indicating heavily saturated embankment.. ......................................................... 17
Relative density versus DCP index for A-3 sands .............................................. 19
Relative density versus DCP index for A-2-4 sands .......................................... 19
DCP index versus moisture content for A-3 sands ............................................. 21
Relative density versus moisture for A-3 sands ................................................. 21
DCP index versus moisture content for A-2-4 sands ......................................... 22
Relative density versus moisture content for A-2-4 sands ................................ 22
Nuclear density and moisture testing in a 2.5 foot ditch excavation ................. 24
Density by depth for A-3 material ...................................................................... 24
Moisture by depth for A-3 material .................................................................... 25
Density by depth for A-2-4 material.. ................................................................. 26
Moisture by depth for A-2-4 material.. ............................................................... 26
Photograph of unstable embankment of A-2-4 material .................................... 28
Embankment of A-2-4 material with moisture control ...................................... 28
Density versus roller passes ................................................................................ 29
Dry density versus moisture content for roller pass study ................................. 30
Relative density by depth for A-2-4 material ..................................................... 31
Relative work require to compact various soil types .......................................... 33
Field density test results- U.S. Highway 61 Fort Madison, IA ........................ 38
Field density test results - U.S. Highway 61 Fort Madison, IA ....................... 39
Field density test results - U.S. Highway 61 Fort Madison, IA ........................ 39
Highly plastic soil (LL=61, PI=47) exhibits low sheepsfoot penetration and roller walkout within a few passes ............................................ 40
Relationship between plasticity index and in-place percent saturation ............ .41
DCP index test numbers 1 - 4 ............................................................................. 43
v
FIGURE 32 DCP index versus compaction and moisture content ....................................... .44
FIGURE 33 Large clod size and compaction from loaded CAT 627 scraper ......... .46
FIGURE 34 Field density results for tire rolling experimental section ................... .47
FIGURE 35 Change in vertical stress under rubber-tired Cat 627 scraper and 48 typical sheepsfoot roller ...................................................................................... 48
FIGURE 36 DCP index versus unconfined compressive strength ........................................ 50
FIGURE 37 DCP index results for experimental tire rolling test section ............................. 50
FIGURE 38 Field density tests for aeration by disking experimental section ....................... 53
FIGURE 39 DCP index versus compaction and moisture content for wet soil ..................... 54
FIGURE 40 Organic material and large clods from scraper excavation ................................ 57
FIGURE 41 Field density test results - U.S. highway 61 Fort Madison, IA ......................... 58
FIGURE 42 Field density test results - U.S. highway 61 Fort Madison, IA ......................... 59
FIGURE 43 Field density test results - U.S. highway 61 Fort Madison, IA ......................... 59
FIGURE 44 Relationship between plasticity index and in-place saturation ......................... 60
FIGURE 45 DCP index test numbers 20 - 23 ......................................................................... 61
FIGURE 46 DCP index versus compaction and moisture content ......................................... 62
FIGURE 47 Group index, liquid limit, and plasticity index and in-situ moisture content showing suitable soils from 15 - 40 and 60- 80 inches below grade .............. 64
FIGURE 48 Comparison of CPT and SPT data at boring B-1 ............................................... 65
FIGURE 49 CPT shear strength measurements versus depth ................................................. 67
FIGURE 50 Iowa SDC chart A ................................................................................................ 72
FIGURE 51 Iowa SDC chart B ............................................................................................... 73
FIGURE 52 Iowa MCC chart A (granular soils) ..................................................................... 78
FIGURE 53 Iowa MCC chart B (fine and coarse-grained plastic soils) ................................ 78
FIGURE 54 DCP design and cone tip detail ........................................................................... 81
FIGURE 55 Relative density vs. DCP index for A-2-4 material under proposed Spec ........ 82
FIGURE 56 No compaction and sheepsfoot compaction test strip ....................................... 84
FIGURE 57 Vibratory compaction test strip ........................................................................... 84
FIGURE 58 Field density and moisture results U.S. Highway 6 ........................................... 85
FIGURE 59 DCP index test results U.S. Highway 520 .......................................................... 86
FIGURE 60 Fill material without disking ............................................................................... 87
FIGURE 61 Fill material with disking ..................................................................................... 87
FIGURE 62 Change in DCP index before and after disking .................................................. 88
FIGURE 63 Soil mixing during excavation ............................................................................ 89
FIGURE 64 DCP test results for U.S. Highway 5 test strip ................................................... 89
FIGURE 65 Possible Iowa DOT flow chart for future QC/QA program .............................. 92
vi

TABLE 1
TABLE2
TABLE3
TABLE4
TABLE 5
TABLE6
TABLE 7
TABLE 8
TABLE9
TABLElO
TABLE 11
TABLE12
TABLE 13
TABLE14
TABLE15
TABLE16
LIST OF TABLES
Appropriate compaction equipment for various soil types .................................... 5
Summary of frost susceptibility classification methods ......................................... 7
AASHTO classification of soils ........................................................................................... 9
Unified classification of soils .................................................................................. 9
Relative density characteristics ............................................................................... 11
Compaction soil characteristics ............................................................................... 12
Testing procedures conducted during summer 1998 .............................................. 18
Comparison of soil properties with moisture content... .......................................... 32
Soil properties of field density and DCP index test numbers 1 - 18 ..................... 3 7
Soil properties of experimental tire rolling section ................................................ 45
Soil properties of experimental aeration by disking section .................................. 52
Soil properties of field density and DCP index test number 19 - 32 ..................... 56
Standard penetration test values and soils description for boring B-1 ................... 65
Iowa Soil Design and Construction (SDC) chart B guidelines .............................. 74
Soil classification comparison between the proposed Iowa SDC chart B and current Iowa DOT specification ....................................................................... 75
General DCP index guidelines ................................................................................ 80
vii
ABSTRACT
Originally, the Iowa Department of Transportation (DOT) initiated this research project from an internal investigation relative to an increasing frequency of rough pavements developing early in the service life of grade and pave projects. Pavement roughness would typically be caused by differential settlement of the pavement supporting structure. This settlement could occur: (1) within the foundation soils supporting the embankment; (2) within the constructed embankment itself; (3) through softening of subgrade soils immediately under the pavement due to water infiltration; or (4) differential frost heave and shrink/swell. Although all of these are potential causes of differential settlement, this research focused on the one factor that we have the most control over which is the embankment itself. Phase I of the research program outlined problems associated with rough pavement as a result of poor embankment quality. Phase II research included the following: (1) develop and evaluate alternative soil design and embankment construction specifications based on soil type, moisture, density, stability, and compaction process; (2) assess various quality control and acceptance procedures with a variety of in-situ test methods including the Dual-Mass Dynamic Cone Penetrometer (DCP); and (3) develop and design rapid field soil identification methods. At the start of the research, soils were divided into cohesive and cohesionless soil types, with each category being addressed separately. Cohesionless soils were designated as having less than 36% fines content (material passing the No. 200 sieve) and cohesive soils as having greater than 36% fines content. Subsequently, soil categories were refined based not only on fines content but soil plasticity as well.
Research activities included observations of fill placement, in-place moisture and density testing, and dual-mass DCP index testing on several highway embankment projects throughout Iowa. Experiments involving rubber-tired and vibratory compaction, lift thickness changes, and disk aeration were carried out for the full range of Iowa soils. By testing for soil stability the DCP was found to be a valuable field tool for quality control whereby shortcomings from density testing (density gradients) were avoided. Furthermore, critical DCP index values were established based on soil type and compaction moisture content.
During fill placement, much of the fill material (cohesive and cohesionless) was typically very wet and compacted at high levels of saturation, which caused soil instability. It was observed that earthwork construction processes including lift thickness and roller passes were not consistent on several embankment projects. Compacted lift thickness was measured to vary from 7 to 22 inches and compaction effort averaged 4 to 5 roller passes. For cohesionless materials the research shows that sheepsfoot compaction is inadequate and that vibratory compaction increases uniformity and relative density. Also, it was observed that reduction of clod size for cohesive soils and aeration of wet soils by disking, which is currently a part of the Iowa DOT specifications, increases embankment quality but is rarely enforced in the field.
Subsurface explorations involving Cone Penetration Tests (CPT), Standard Penetration Tests (SPT), and Shelby tube sampling operations were performed at selected locations to
1

obtain information on actual finished embankment conditions. From these investigations engineering evaluations for the project were developed.
As a result, moisture control and soil design charts were developed to improve soil design specifications and field construction methods. Swell potential, susceptibility to frost heave, and performance under load are soil engineering properties related to pavement subgrade performance and were included in newly developed and proposed Iowa Soil Design and Construction (SDC) charts and Iowa Moisture Content Construction (MCC) charts. To better establish proper moisture contents for granular soils, the Iowa Modified Relative Density test was developed.
PHASE I SUMMARY
Phase I was initiated as a result of internal Iowa DOT studies that raised concerns about the quality of embankments currently being constructed. Some large embankments had recently developed slope stability problems resulting in slides that encroached on private property and damaged drainage structures. In addition, pavement roughness was observed shortly after roads were opened to traffic, especially for flexible pavements at transitions from cut to fill and on grade and pave projects. This raised the question as to whether the current Iowa DOT embankment construction specifications were adequate. The primary objective of Phase I was to evaluate the quality of embankments being constructed under the current specifications. Overall, an evaluation of the results of Phase I indicated that a quality embankment was not consistently being constructed under the current Iowa DOT specifications. A summary of the field and laboratory construction testing and observations is as follows:
o Field Personnel (Iowa DOT and contractors) The personnel appear to be generally conscientious and trying to do a good job but were: (1) misidentifying soils in the field, (2) lacking the necessary soil identification skills, and (3) relying heavily on the soil design plan sheets for soil classification, which often resulted in soil misplacement.
o Current Iowa DOT Specifications The method of identifying unsuitable, suitable, and select soils may not be adequate. One-point Proctor does not appear adequate for identifying all soils or for field verification of compaction. Also, "sheepsfoot walkout" is not, for all soils, a reliable indicator of degree of compaction, compaction moisture content, or adequate stability.
o Construction Observations and Testing- Cohesive Soils Sheepsfoot walkout specification produced embankments where soils are placed wet of optimum and near 100% saturation, which resulted in embankments with: (1) low shear strength/stability, (2) high pore pressure development, and (3) potential for slope failures and rough pavements. In addition, disking and lift leveling specifications were not always enforced and overly thick lifts were being placed on overcompacted and undercompacted soils.
2

o Construction Observations and Testing- Cohesionless Soils Compaction was attempted with sheepsfoot rollers where vibratory compaction was necessary and degree of compaction was monitored using the standard Proctor testing which is an inappropriate method and can grossly overestimate degree of compaction.
Based on the foregoing, recommendations were made for Phase II to evaluate alternative. specifications and develop efficient, practical, and economical field methods for compaction control and soils identification.
PHASE II INTRODUCTION
Embankment Quality Phase II research involved field testing of alternative embankment acceptance procedures and methods for the full range of Iowa soils that would result in improved embankment quality. During the summer and fall 1998 construction season, field and laboratory testing was conducted on the embankment construction for U.S. Highway 61 in Lee County and on Iowa and U.S. Highway 34 in Henry County, Iowa. In addition, a pilot project for Iowa DOT training and implementation of the recommended procedures was completed on the proposed U.S. Highway 520 in Grundy County, U.S. Highway 6 in Jackson County, and U.S. Highway 5 in Polk County, Iowa.
Field activities included observations of fill placement, in-place moisture and density testing, and DCP index testing. Experiments involving rubber-tired compaction and aeration by disking were carried out. Upon completion of one of the embankments, subsurface explorations were performed at selected locations to obtain information on actual finished conditions. Standard Penetration Tests (SPT), Cone Penetration Tests (CPT), and Shelby tube sampling operations were completed. Field testing also included soil identification of unsuitables, suitable, and select treatment material by the Iowa DOT specification. From the investigation, moisture control and soil design charts were designed and developed. Swell potential, susceptibility to frost heave, and performance under load were some of the soil engineering properties related to pavement subgrade performance and included in the proposed Iowa Soil Design and Construction (SDC) chart for coarse and fine-grained soils with plasticity. Moisture content is an important component of soil engineering properties such as density, strength, volumetric stability, and hydraulic properties. The current Iowa DOT embankment specifications do not require moisture control as an acceptance criterion except in select treatment areas. To increase uniformity and control soil-engineering properties the new Iowa Moisture Content Construction (MCC) chart is proposed for use in the field during construction. For cohesionless soils the Iowa Modified Relative Density test was developed to determine suitable compaction moisture content.
Utilizing the Iowa SDC and MCC charts, Iowa Modified Relative Density tests, DCP, and test strips, an alternative construction method and testing specification has been developed. Because construction with soils is one of the most complicated procedures in engineering, the testing specification was designed to be both efficient and practical to meet the needs of the Iowa DOT and earthwork contractors.
3

EMBANKMENT CONSTRUCTION WITH COHESIONLESS SOILS
Fieldwork during the summer and fall of 1998 was conducted near Fort Madison, Iowa, located in the far southeast corner of the state. The city of Fort Madison lies within the flood plain of the Mississippi River. Because of its riverside location the site presented a wide range of soil types. The project on which testing was conducted was for the reconstruction of U.S. Highway 61, which was expanded to a four-lane highway south of Port Madison. The northern portion of the project was dominated by soils that are alluvial in nature. These soils consist of clean sands (A-3) and sands with hi!!h fine content (A-2-4). In order to evaluate -- ----- -- ----~- ------ - ' - / ------ -------- ---- ---~-- - '\. ,/
embankment construction field practices with cohesionless soils, the research team conducted field monitoring and testing activities including observations of fill placement with sheepsfoot and vibratory compaction, in-place moisture and density testing, and DCP index testing. In addition, subsurface explorations were performed at selected locations. The investigation and laboratory results of cohesionless soil testing and evaluation are described in the following section.
By understanding relationships between density, stability, and compaction moisture content, the quality of cohesionless soil embankments can be measured. Stability in general terms is the capacity of soil to support a load such as applied by tires from construction traffic. Stability is lost when cohesionless soils are (1) at or near saturation, (2) compacted to a low density, (3) subjected to large vibrations, or ( 4) very dry. Density of soil deals with the arrangement of soil particles. water, and air. Because of a moisture-related bulking phenomenon in cohesionless soils, a stable embankment does not always represent a sufficiently dense embankment. Cohesionless materials compacted at the bulking moisture content typically exhibit high "apparent" stability. However, this apparent stability is merely temporary until the capillary fringes of the sand particles are introduced to a source of water. As water enters the soil system, surface water tension between particles is reduced and upon loading the particles can more easily move around each other, thus inducing settlement (1). The density of soil in the bulking condition can be very low (i.e. the soil contains many pores that are filled with air). Soils compacted at the bulking moisture content that are subsequently wetted collapse to a more dense state, which results in settlement.
It is generally known that cohesionless soils can be effectively densified/compacted by vibratory rollers but, there are many cohesionless intergrade soils with high fines content (15 to 36%) in which the proper compaction equipment is not readily obvious. These intergrade soils are typically considered coarse grained or cohesionless soils, but their compaction characteristics vary between a plastic soil and a granular soil. Table 1 shows a review of basic guidelines for the proper compaction equipment based on soil type.
As indicated, vibratory roller compaction is effective for compaction of cohesionless soils and sheepsfoot roller compaction is effective for use in plastic soils. The main compaction process of a sheepsfoot roller is to shear the soil. When sheepsfoot roller compaction is used to compact cohesionless soils, the shearing process and resulting dilation may have the effect of actually reducing density (2). In addition, the sheepsfoot roller is ineffective in the compaction of cohesionless materials because the Iowa DOT specification requires the sheepsfoot roller to "walkout". In other words, the roller should be supported only on its
4
feet, and not the barrel of the roller. However, cohesionless materials need to be confined in order to undergo compaction. In the field it has been observed that cohesionless soils do not densify at the surface and that the sheepsfoot roller never "walks out" of cohesionless fill.
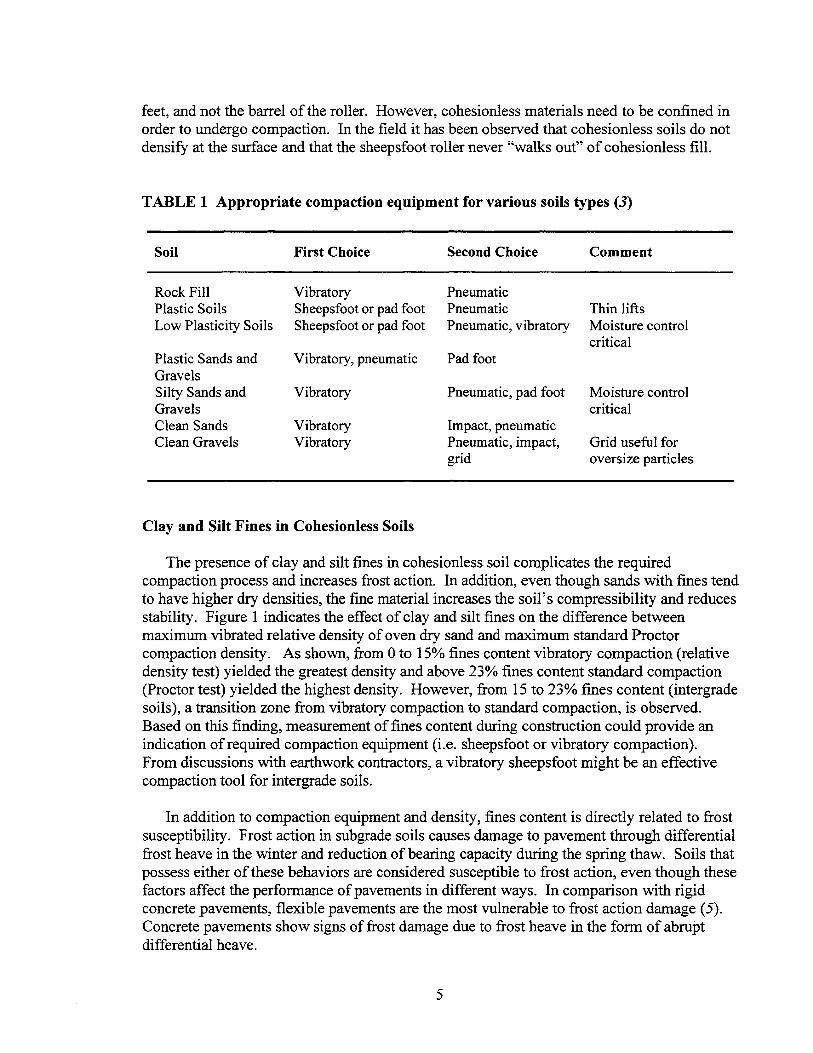
TABLE 1 Appropriate compaction equipment for various soils types (3)
Soil First Choice Second Choice Comment
Rock Fill Vibratory Pneumatic Plastic Soils Sheepsfoot or pad foot Pneumatic Thin lifts Low Plasticity Soils Sheepsfoot or pad foot Pneumatic, vibratory Moisture control
critical Plastic Sands and Vibratory, pneumatic Pad foot Gravels Silty Sands and Vibratory Pneumatic, pad foot Moisture control Gravels critical Clean Sands Vibratory Impact, pneumatic Clean Gravels Vibratory Pneumatic, impact, Grid useful for
grid oversize particles
Clay and Silt Fines in Cohesionless Soils
The presence of clay and silt fines in cohesionless soil complicates the required compaction process and increases frost action. In addition, even though sands with fines tend to have higher dry densities, the fine material increases the soil's compressibility and reduces stability. Figure 1 indicates the effect of clay and silt fines on the difference between maximum vibrated relative density of oven dry sand and maximum standard Proctor compaction density. As shown, from 0 to 15% fines content vibratory compaction (relative density test) yielded the greatest density and above 23% fines content standard compaction (Proctor test) yielded the highest density. However, from 15 to 23% fines content (intergrade soils), a transition zone from vibratory compaction to standard compaction, is observed. Based on this finding, measurement of fines content during construction could provide an indication of required compaction equipment (i.e. sheepsfoot or vibratory compaction). From discussions with earthwork contractors, a vibratory sheepsfoot might be an effective compaction tool for intergrade soils.
In addition to compaction equipment and density, fines content is directly related to frost susceptibility. Frost action in subgrade soils causes damage to pavement through differential frost heave in the winter and reduction of bearing capacity during the spring thaw. Soils that possess either of these behaviors are considered susceptible to frost action, even though these factors affect the performance of pavements in different ways. In comparison with rigid concrete pavements, flexible pavements are the most vulnerable to frost action damage (5). Concrete pavements show signs of frost damage due to frost heave in the form of abrupt differential heave.
5

25
SW-SP + CL Fines
20 SP+ CL Fines
'#. - 15 ~ u::
-8 -4 0 4 8 12
Yd(VD) - Yd( opt), pcf
FIGURE 1 Effect of fines on the difference between maximum vibrated density and of oven-dry sand and maximum standard compaction density (4)
In short, damage associated with frost action reduces pavement service life and quality, and increases maintenance costs. Classification of soils susceptible to frost action is based on both the soils ability to heave as well as soften during thawing. Particle size, water availability, void distribution, cooling rate, and surface loading conditions are some factors that can be evaluated to establish frost susceptibility ( 6). Relationships between grain-size and frost action have been the subject of much study. Table 2 shows a review of several frost susceptibility classification methods used in the United States.
Cobesionless Soil Laboratory Test Results
Laboratory Analysis Soils used in the construction of U.S. Highway 61 in Fort Madison, Iowa were classified
and characterized by grain size, characteristics of fines content, F200, (percent passing No. 200 sieve), maximum density, moisture requirements, and permeability.
The laboratory test procedures used in this investigation include the following: • Grain size distribution (ASTM D 422-63) • Hydrometer analysis (ASTM D 422-63) • Standard Proctor (ASTM D 698-78) • Relative density (ASTM 4253 and D 4254) • Percent finer than the No. 200 sieve (ASTM D 1140 -54)
6

TABLE2 Summary of Frost Susceptibility Classification Methods (7)
Allowable Amount State or Agency (%) Finer than Other Restrictions
0.075 mm 0.02 mm
Alaska 6-100 Overburden depth, frost heave test Arizona 3, 10 Soil classification, PI Connecticut 10 3, 10 Uniformity, PI Illinois 3, 10 Soil classification, PI Indiana 8 3, 10 Soil classification, PI Iowa 15 Soil classification, organic content,
Proctor density, PI Maine 3, 10 Soil Classification, PI Massachusetts 8-12 Michigan 7-10 Pedological classification, drainage
test, frost heave test Minnesota 7-15 Textural classification, moisture
conditions Montana 3, 10 Uniformity New Hampshire 10-12 Frost heave test New York 10 North Dakota 15 Percent silt Ohio 50 PI Oregon 8 Sand equivalent, liquid limit, PI Pennsylvania 3, 10 Soil classification, PI Rhode Island 1 Uniformity Vermont 8-15 Washington 10 Sand equivalent West Virginia 3, 10 Soil classification Wisconsin 2-15 Pedological classification, water table
Asphalt Institute 7 Casagrande 3, 10 Uniformity National Crushed Frost heave test Stone Assoc. U.S. Army Corps 1.5, 3 Soil classification, frost heave test, PI of Engineers U.S. DOT 5-11
7

Grain Size Distribution Figure 2 shows the grain size distribution results for several cohesionless soils encountered during construction. It should be noted that material B3 was determined to be topsoil (i.e. highly organic) and was not used as fill, therefore the soil is not characterized. As shown, most of the soils have similar gradations. Sample A 1 represents the most well-graded soil. That is, sample Al contains a wider range of particle sizes than the other materials. Alternately, sample B4 represents the most poorly graded soil, or least differentiation of particle sizes. The grain-size distributions end at the No. 200 sieve, which corresponds to a particle diameter of 0.075 mm. The values corresponding to the 0.075mm grain size on Figure 2 represent the dry sieve analysis of the material through the No. 200 sieve. However, the true F200 value, was obtained by hydrometer analysis.
100 I i
g) ; '
I ' I ,
8) I '
! I
!
70 i: I i
ff) ii I 1
I\ i I
.... 5) ii Q)
c: It= -c: -«) Q)
i
(.) .... Q) I
CL 3J I I
2)
I j :
10 I : I
, I 11
I
I
0' I
10 1 01
Gan92e, D(rmJ
FIGURE 2 Grain-size distributions
8
•I !
I! i'
I I
I I
I I
001
-1-S:rrpeA1
__.,_ S:rrpeA2
-+-S:r'rpe 81 ,
' -r S:rrpe B2 !
-+-8:rrpe84
I -+-S:r'rpe es
l-SnpeC1 !

Upon completion of the grain size analysis, Atterburg limits were evaluated. Because these soils contained a large portion of fine sand, none of the soils exhibited plasticity. Tables 3 and 4 list soil classifications. The fact that none of the soils exhibited plasticity indicated that the F200 material was primarily silt. In order to verify this, hydrometer tests were conducted on samples B5 and C 1, which showed that the clay and silt fraction for the BS and Cl were 2.9% I IO.I% and 1.3% I 4.7%, respectively.
TABLE 3 AASHTO classification of soils
Percent Passing Sieve # AASHTO Sample Classification
10 40 200
Al 92 57 18 A-2-4 A2 100 66 5 A-3 Bl 100 60 15 A-2-4 B2 100 69 14 A-2-4 B4 100 23 4 A-1-b BS 99 55 13 A-2-4 Cl 97 73 6 A-3
TABLE 4 Unified classification of soils
D10 D30 D6o Unified Sample (mm) (mm) (mm) Cu Cc % Finer Classification
Al .01 .20 .32 32 13 18 SM - Silty sand A2 .21 .29 .40 2 1 5 SP - Poorly graded sand Bl .20 .28 .33 2 1 15 SM - Silty sand B2 .16 .24 .37 2 1 14 SM - Silty Sand B4 .30 .47 .60 2 1 4 SP- Poorly graded sand BS .12 .27 .37 3 2 13 SM - Silty sand Cl .16 .25 .36 2 1 6 SM- Silty Sand
9
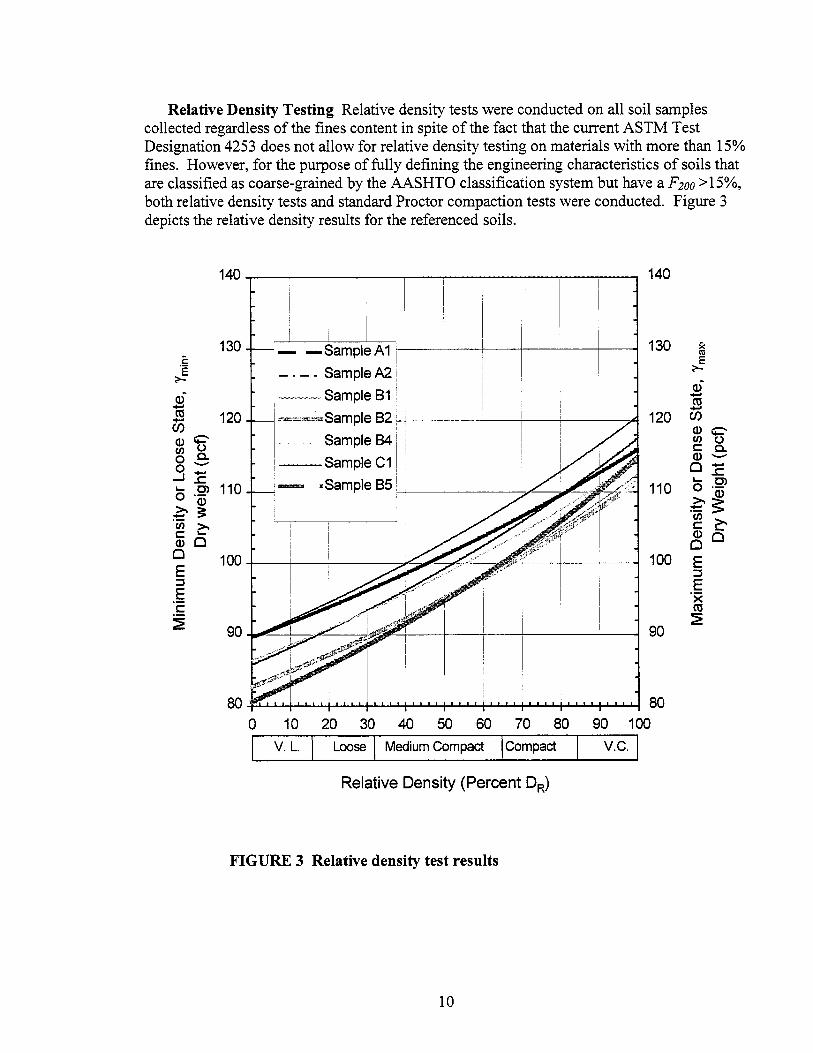
Relative Density Testing Relative density tests were conducted on all soil samples collected regardless of the fines content in spite of the fact that the current ASTM Test Designation 4253 does not allow for relative density testing on materials with more than 15% fines. However, for the purpose of fully defining the engineering characteristics of soils that are classified as coarse-grained by the AASHTO classification system but have a F200 > 15%, both relative density tests and standard Proctor compaction tests were conducted. Figure 3 depicts the relative density results for the referenced soils.
2 m -Cl)
(J) 13' en c.. o_ o_
.....J ..c:: .... C> 0 °(i) ~ 3:: 'Ci) C" 53 Cl Cl E :::I
E c: ~
130
120
110
80
-Sample A 1 '--' 1----+-----'-----+--~---+----1
-. - . SampleA2
--Sample 81 .
'~=w.r:=.o""'Sample 82-'--------'-------4-------'---A
Sample 84
--SampleC1
' - ·Sample 85 '-------"----+----... L..--~~
140
130
120
110
100
90
80
0 10 20 30 40 50 60 70 80 90 100
I v. L. l Loose l Medium Compact !compact I v.c. I Relative Density (Percent DR)
FIGURE 3 Relative density test results
10

Relative density values for the described soils range from 80 to 90 pcf for minimum density and 110 to 121 pcffor maximum density. Void ratio, which is directly proportional to relative density, was found to be a soil specific, density-dependant property essential to determining the proper compaction moisture content. For reference the maximum and minimum void ratios corresponding to the minimum and maximum dry densities are presented in Table 5.
TABLE 5 Relative density characteristics
Maximum Minimum Minimum Maximum Density, y dmax Density, y dmin Void Ratio Void Ratio
Sample (pct) (pct) (emin) (emax)
Al 115.9 89.6 0.45 0.88 A2 117.5 85.8 0.43 0.92 Bl 112.5 82.7 0.50 1.04 B2 111.4 82.3 0.51 1.04 B4 114.4 86.4 0.47 0.95 B5 114.7 82.l 0.47 1.05 Cl 120.6 89.7 0.40 0.88
Standard Proctor/ Relative Density Comparison Standard Proctor tests were conducted on all soils which contained enough fines to be either borderline to qualifying for the ASTM relative density test or had greater than 15% fines content. Standard Proctor moisture-density relationships are shown in Figure 4 for the referenced soils. As shown, many of the moisture-density relationships resemble typical curves for plastic soils. All of the soils reached medium to high densities at low moisture contents. Many of the soils then lost density as the moisture content increased. This is a result of the bulking characteristic in cohesionless soil. On the wet side of the bulking moisture content, the soils increased in density. Finally, some of the soils continued to increase in density with increased moisture content while some samples d~creased in density.
The maximum density the soil reached after the bulking moisture content is a critical indication as to how it will behave in the field. If the soil reaches a greater dry density after the bulking moisture content for the standard Proctor compaction test than the maximum relative density, the soil is best compacted under dynamic loading and shearing of the soil, (i.e. sheepsfoot roller). Alternately, if the density after the bulking moisture content is less than the maximum relative density, the soil is best compacted by vibratory means. Keeping in mind that all of the soils contain less than 20% fines by weight, and the range of fines through all five samples is 6% to 18%, the impact that the fines have on the compaction characteristics of the soils is significant. A summary of the relative density/standard Proctor densities is shown in Table 6.
11

I I
I I I I I ' ' I i . I ' 1
125 - -+ ·1·-L-~'--L+,..L-~.. '"j '"T_L_), , ---+·..: --+· L---:--:- ".' _,,,:,_i I
I ! I I
~ 120 t-=-·~-;4·;;,·~·=--r.·:::.··=--:~·+__L,_;_· ___ 1 ·--~:,-7·--i'·:;:;;-"~"'i"'': ·,.,-, ·~~1··~_,~ .. :-· "' i + '' .; .. , ~ . ·-'--~ __ !,_,;,__;
I I I v /. i \X I I
t 115 f-+l······+·-r~~./: • ~'0'i rl-i--i i ... , .... ~~~----+--rt-+-·---~..,.\-+---,,~1---, -t.~.--;, > '- / \ I ... '2 :::>
"-! \I I I I ;
110 .,,,,_,,,,~.,.,_~--+··-7,-i--/,Y.(·+- ·+-;,_j . ;\ii ..,..-+- ... : .. ,, ...... : I I/
I /
!I 105 ,.'/.
100 '" i·· ,,
0
W_ . ..._ r I;; ! - ,-.......... i I I
"-""- I
""-: ..._ I I :
'·++·--"·-... .'. ... - .:. l 4-:::C.,, '~-·-·:-++: .. I I I
-1 i , .. I - . ! ........ L,, .. , I ... 1- I i I
5 10 15 20
Moisture Content (Percent Dry Weight)
25
-o-SampleA1 ! I-ii-Sample B 1 1 1--Sample B2
, -X- Sample BS I
I -+-Sample C1
FIGURE 4 Standard Proctor moisture-density relationships
TABLE 6 Compaction soil characteristics
Max Max Proctor Relative Proctor Moisture Proper
Sample Percent Density Value Content Controlling Compaction Finer (Ydmax) (Ydmax) (%) Test Equipment
Al 18 115.9 119.5 12.5 Proctor Sheepsfoot Bl 15 112.5 108.5 14.2 R.D. Vibratory B2 14 111.4 108.0 14.0 R.D. Vibratory BS 13 114.7 119.5 13.0 Proctor Sheepsfoot Cl 6 120.6 111.0 15.5 R.D. Vibratory
12

The minimum relative density for sample C 1 was 89. 7 pcf, which is considered 0% relative density. The standard Proctor compaction test, on the other hand, does not recognize a value for minimum density, only the maximum dry density at optimum moisture content. A shown in Table 6, the maximum Proctor density for sample Cl is 111.0 pcf. For comparison, at 0% relative density the standard Proctor compaction would be 80.8% and at 100% relative density (120.6 pcf) the standard Proctor compaction equals 108.6%. Further, at 90% standard Proctor compaction the density would be 99.9 pcf and at 90% relative density (typical relative density specification) the density would be 108.S pcf. Therefore, the effectiveness of vibratory compaction on this material can be seen from increased density.
Permeability Soil permeability is an important factor when considering which type of compaction equipment to use. Unfortunately, the test is very time consuming and not practical to run in the field. Some permeability testing is discussed here, but the F2oo and engineering characteristics of a soil could be used to judge permeability in the field where time does not allow for this type of testing. The permeability of soil sample BS was 8.S x 1 o· 7 emfs and soil sample Cl was 7.7 x 10"6 emfs. The BS soils had a permeability that was approximately 10% of that for the C 1 soil. In other words the BS soil will take ten times as long to drain. The impact fine material has on the behavior of a soil is further strengthened by this finding. Note that the difference in the F200 value for these soils was only 7%.
Iowa Modified Relative Density Test
The current Iowa DOT testing procedure for cohesionless materials neglects the effect of bulking. The two methods for determining maximum dry density by the ASTM relative density specification are (1) compact the soil in the dry state or (2) compact the soil in the presence of excessive moisture so that the material is saturated. The assertion that a soil with F 200 < l S% will attain its maximum density in the dry condition or in a saturated condition is true and not under scrutiny. However, soils in the field will rarely be in the dry condition, and will most often exist with a moisture content between bulking and saturation. If the soils are near the bulking moisture content, they will be very difficult to compact regardless of the amount of compaction energy applied to the soil. Because the proposed Iowa Modified Relative Density test was used extensively throughout the field and laboratory research it is briefly described in the following section.
Until this time, there has been no test to measure the influence of increasing moisture contents on cohesionless materials with F200 <15% and intergrade cohesionless soils with 16% < F200 < 36%. This was the basis for the development and design of the Iowa Modified Relative Density test. Just as every soil test is designed to define a certain characteristic of that soil, the Iowa Modified Relative Density test is designed to define the bulking moisture content of cohesionless soils. The Iowa Modified Relative Density test provides a compaction characteristic curve for each cohesionless material similar to a standard Proctor moisture-density relationship for plastic soils. Thus, relative density is plotted as a function of density and moisture content (for testing purposes moisture content should range from zero to 2S% ).
13

Cohesionless materials typically exhibit a characteristic compaction curve throughout these moisture contents. This range of moisture content is tested in the laboratory using the relative density test equipment and according to test designations ASTM D 4253 and D4254 with the following modifications:
1. The test will be performed at five different moisture contents, starting with oven-dry material and progressing through increasing moisture content steps of approximately 4-5%.
2. The Iowa Modified Relative Density test must provide for drainage of the wetted material. Thus, the standard 0.5'' steel plate used to hold the loading weight in position must allow for one-dimensional drainage (similar to field activities) of water as the material is vibrated. The modified plate will have the same dimensions as the standard plate but will have three 1.5" diameter holes drilled out and replaced with porous disks. In addition, a gasket around the perimeter of the standard plate will be needed.
The Iowa Modified Relative Density test was designed to increase the F200 upper limit of 15% stipulated by standard Relative Density test specification ASTM D 4253 and D 4254 to 36%, thus including all soils considered coarse grained materials as defined by AASHTO. The reasoning behind this as discussed previously is that some soils with F 200 > 15% exhibit properties which make them more effectively compacted by vibratory means.
The referenced Iowa Modified Relative Density test was conducted on seven different materials, all of which were from the U.S. Highway 61 project in Ft. Madison, Iowa. The results of the tests are shown in Figure 5, which clearly depicts each of the soil bulking moisture contents. Nearly all of the soils are at their minimum density between 3% and 6% moisture. At the bulking moisture content, the soils will normally not be compacted to an acceptable relative density under standard field compaction energy. This is a critical characteristic of cohesionless soils to identify during embankment construction. In addition, it was observed that many of the soils, especially those with higher F20o values, lose density quickly at higher moisture contents.
Cohesionless Material Construction Observations
Figures 6 and 7 are photographs of the cohesionless soil embankments for U.S. Highway 61. Figure 6 shows an embankment constructed with A-3 soil and Figure 7 shows an embankment constructed with A-2-4 soil. During compaction both of the soils averaged approximately 13% moisture content. However, the engineering properties of these materials were very different. Figure 8 shows entrapped water in the embankment that was constructed with material sample C 1.
14

115. F200
_.,_ 1°/o
...._a:>!o
;;:-_.,.__9% 0
Q..
-:1a5.0 .,, >-:
~11% ~ "iii c: ~ 100.0 """*-- 12% ~ c
95.0 ---25%
_.,_Flo
910
ro.o-"--~~~~..--~~~~..,--~~~~~~~~~..--~~~----"
0 5 10 15 25
FIGURE 5 Iowa Modified Relative Density test results
15

FIGURE 6 Sample C-1 fine sand at 13% moisture
FIGURE 7 Sample B-5 silty fine sand at 13% moisture
16
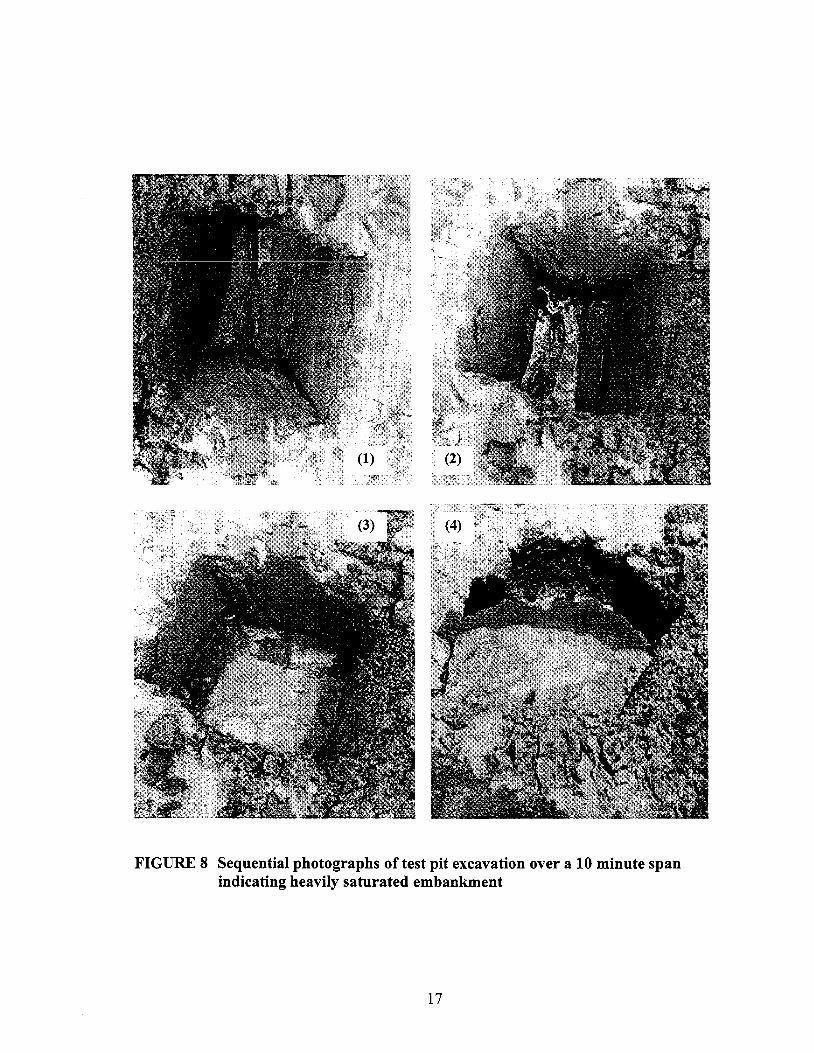
FIGURE 8 Sequential photographs of test pit excavation over a 10 minute span indicating heavily saturated embankment
17
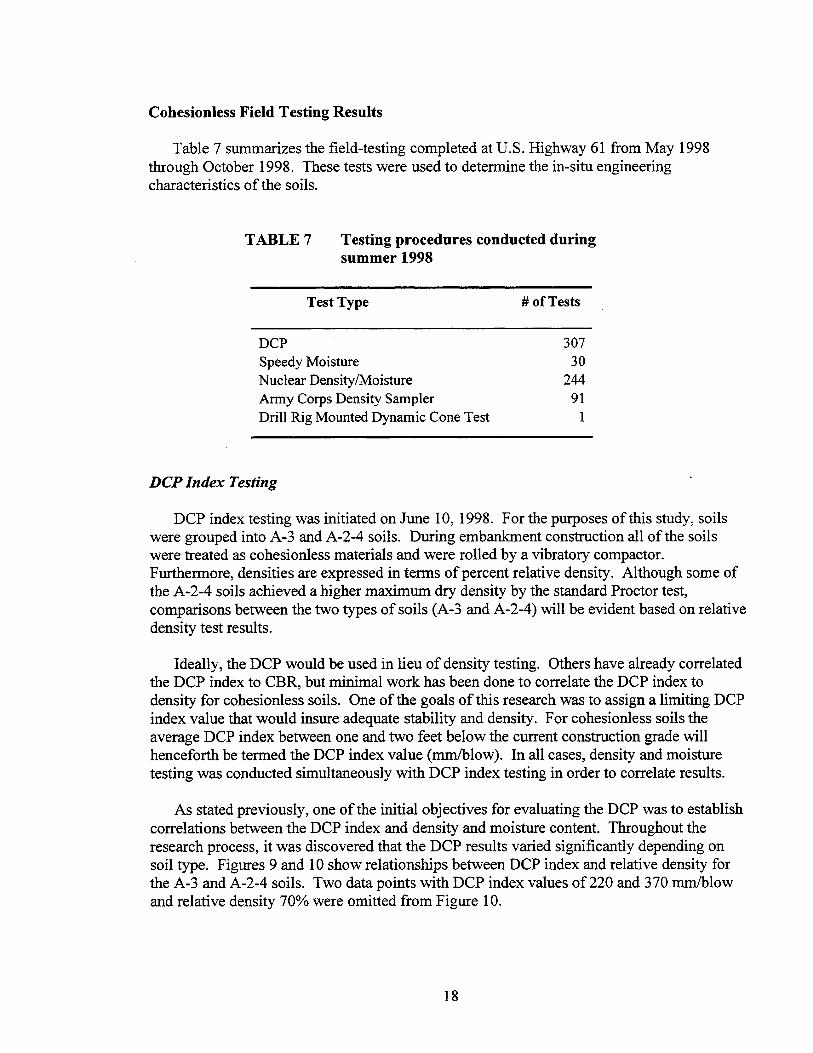
Cohesionless Field Tes ting Results
Table 7 summarizes the field-testing completed at U.S. Highway 61 from May 1998 through October 1998. These tests were used to determine the in-situ engineering characteristics of the soils.
TABLE7 Testing procedures conducted during summer 1998
Test Type
DCP Speedy Moisture Nuclear Density/Moisture Army Corps Density Sampler Drill Rig Mounted Dynamic Cone Test
DCP Index Testing
#of Tests
307 30
244 91
DCP index testing was initiated on June 10, 1998. For the purposes of this study, soils were grouped into A-3 and A-2-4 soils. During embankment construction all of the soils were treated as cohesionless materials and were rolled by a vibratory compactor. Furthermore, densities are expressed in terms of percent relative density. Although some of the A-2-4 soils achieved a higher maximum dry density by the standard Proctor test, comparisons between the two types of soils (A-3 and A-2-4) will be evident based on relative density test results.
Ideally, the DCP would be used in lieu of density testing. Others have already correlated the DCP index to CBR, but minimal work has been done to correlate the DCP index to density for cohesionless soils. One of the goals of this research was to assign a limiting DCP index value that would insure adequate stability and density. For cohesionless soils the average DCP index between one and two feet below the current construction grade will henceforth be termed the DCP index value (mm/blow). In all cases, density and moisture testing was conducted simultaneously with DCP index testing in order to correlate results.
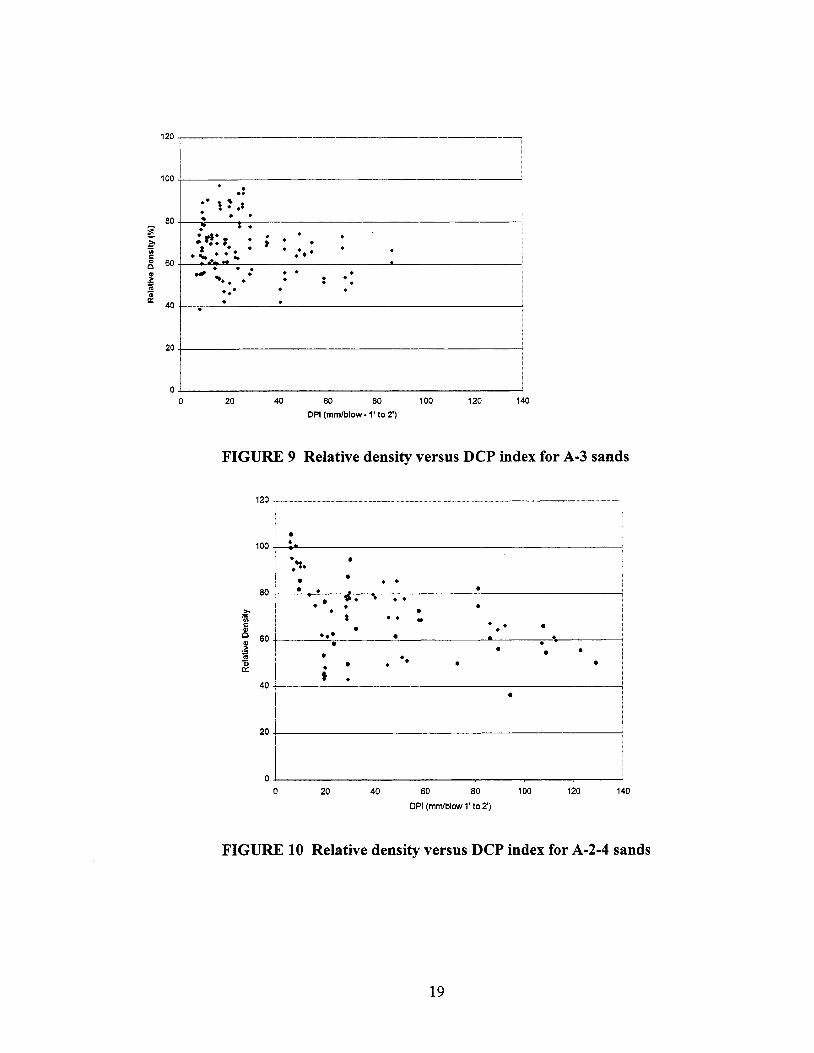
As stated previously, one of the initial objectives for evaluating the DCP was to establish correlations between the DCP index and density and moisture content. Throughout the research process, it was discovered that the DCP results varied significantly depending on soil type. Figures 9 and 10 show relationships between DCP index and relative density for the A-3 and A-2-4 soils. Two data points with DCP index values of220 and 370 mm/blow and relative density 70% were omitted from Figure 10.
18
1201
100+-~~~~~~~~~~~~~~~~~~~~~~~~~~~
.: .. . l ~ ·' 80 •
~ : • • ; '!:: .
~ t a • : • . . .
c: . .... _ ........ . . .. 60 Q . . . . .. "' . . . ~
.... . . . .. . ., a:: 40
20
0 0 20 40 60 80 100 120 140
OPI (mm/blow· 1' to 2')
FIGURE 9 Relative density versus DCP index for A-3 sands
120
100 •. • . ~ . • . •
80 . • • ... . . .
• ~ • • .. • • c: • • CD ••• • 0 60 • ~ • • • "' .. a; • c:: • • 40
•
20
0
0 20 40 60 80 100 120 140
DPI (mm/blow 1' to 2')
FIGURE 10 Relative density versus DCP index for A-2-4 sands
19

The A-3 sands depicted in Figure 9 show a trend, which is one that can be expected. The DCP index decreases as relative density increases. There is some scatter to the data and a logarithmic regression of the data produced an r-squared value of less than 0.1, which would suggest that the correlation between relative density and DCP index is insignificant. However, in order to achieve 80% relative density in 90% of the tests, the DCP index would have to be less than or equal to 35mm/blow. It was in this way that the limiting DCP index values were determined. The corresponding CBR for this value would be about 5.4%. This is just slightly under the CBR value of 6% the Army Corps of Engineers suggests to limit rutting of normal construction equipment to under 0.5 inches (8).
The A-2-4 sands shown in Figure 10 depict the same general trend. The same logarithmic regression produced an r-squared value of 0.3 7. For the A-2-4 sands, a DCP index of 45mm/blow will assure 80% relative density in 90% of the tests. Even though this correlates to a CBR ofless than 3, it is within the normal CBR values expected for this material type.
For the purposes of this study, the DCP index was correlated with density. However, it was reaffirmed that the DCP is a test of stability and not of density. While stability has already been discussed to be a major importance in an embankment, more importance is placed on density in quality control since it is a relatively common soil property to measure. The problem with stability testing is that most soils, cohesionless soils included, will exhibit a loss of stability at increasing moisture contents, irrespective of the corresponding relative density. Additionally, soils at low moisture contents will exhibit greater stability, even though the corresponding relative densities may be low. In the cohesionless materials studied, the effect of bulking can result in an "apparently" stable embankment even though relative densities may fall into the loose and very loose compact range. Figures 11 and 12 clearly demonstrate this phenomena in A-3 sands while Figures 13 and 14 show results for the A-2-4 sands. Figure 11 shows a generally increasing exponential trend in DCP index for increasing moisture contents. However, the relative density of those same soils, as shown in Figure 12, does not depict the same relationship.
As shown in Figure 11, the DCP index increases with increasing moisture content, however, the relative density achieved its maximum value at 11 % moisture. Unfortunately, the lower range of moisture contents was not available for study. The correlation between both the DCP index and relative density and the moisture content is not considered to be significant for the A-3 soils. The relationship between DCP index and relative density is more evident in the A-2-4 material and a greater correlation exists.
In Figure 13, the trend for increasing DCP index with increasing moisture is shown for the A-2-4 material. For contrast, relative density versus moisture is shown in Figure 14, which indicates bulking moisture content at approximately 5%. From these relationships it is clear that if a DCP specification for density control were in place, there would also have to be some form of moisture control.
20

100
90
• • 80
70
• 60
I ~ 50 .§.
.. • • R2 = 0.1945 . . . .
c:: c 40
.. • • . . 30
20
10
. / .. ·:y. .. ~··
. • . •• . • • . . ........ • .
~ . .... .- .... ;; .. . 0
0 5 10 15 20 25
Moisture Content ('lo)
FIGURE 11 DCP index versus moisture content for A-3 sands
100 !
90 ~ . •
80
70 't; Cl.
~ 60
• • . ••• • ' • .R2 =0.145
~ .. • •• ... -t;.• .. • •
~ ~ • • • .,. • • .... . • • i: .. 50 c QI c
• •• • •• • • • • •• i .. .. • • •
QI > 40 ~
• • • Qi D::
30 '
20
10
0 0 5 10 15 20 25
Moisture Content (%)
FIGURE 12 Relative density versus moisture content for A-3 sands
21

250 -----·-··-.. ··-.. ··-·--·--------------------------~
• 200+---------------------------~
- 150+---------------------------~ ~ ~ §.
• • ~ . c 100+----------------------------;
•••• R2=0.2505
• • • •
• • • •
0.J---------------------------~ 0 5 10 15 20 25
Moisture Content (%)
FIGURE 13 DCP index versus moisture content for A-2-4 sands
'!; ... .,! ~ iii c .. c .. > ~ 'ii D::
120-------------------------~
100+---------~----------------<
80
60
40
20
. ... . . . • •• ~· ..
0.J--------------------------' 0 5 10 15 20 25
Moisture Content(%)
FIGURE 14 Relative density versus moisture content for A-2-4 sands
22

Density by Depth Testing
It has been discussed previously that the compaction energy of rolling equipment and other hauling equipment is most efficient at a depth of approximately one-foot under the current construction grade for granular materials. This is due to the necessity for lateral confinement to compact cohesionless soils. Also, it has been shown that density and stability are functions of moisture content. To better characterize moisture-density relationships with depth, several field density tests were performed on the referenced A-2-4 and A-3 materials.
Field testing was conducted on the embankments after approximately 10-15 feet was built to minimize the effect of different foundation materials. For the matter of consistency, however, the foundations of both embankments were very similar as they were approximately at the same elevation and both within the floodplain of the Mississippi River.
To demonstrate the effects of confinement on the soils, density tests were taken at three elevations within the embankment during construction with six tests at each elevation. First, moisture and density tests were taken at the surface. Next, a dozer stripped away one foot of the grade and additional density and moisture tests were performed. Finally, an additional 1.5 feet of material was removed and additional density and moisture tests were taken. A photograph taken during this process is shown in Figure 15. Care was taken to ensure that the tests were not taken in the tracks of the bulldozer or fluffed material. The same procedure was used for the A-2-4 embankment. It was observed that the embankment constructed with the A-3 soil was more stable and the D-6 bulldozer had difficulty cutting to the depth of 2.5 inches. The embankment made of A-2-4 material, however, was not stable and caused no significant problems for the bulldozer.
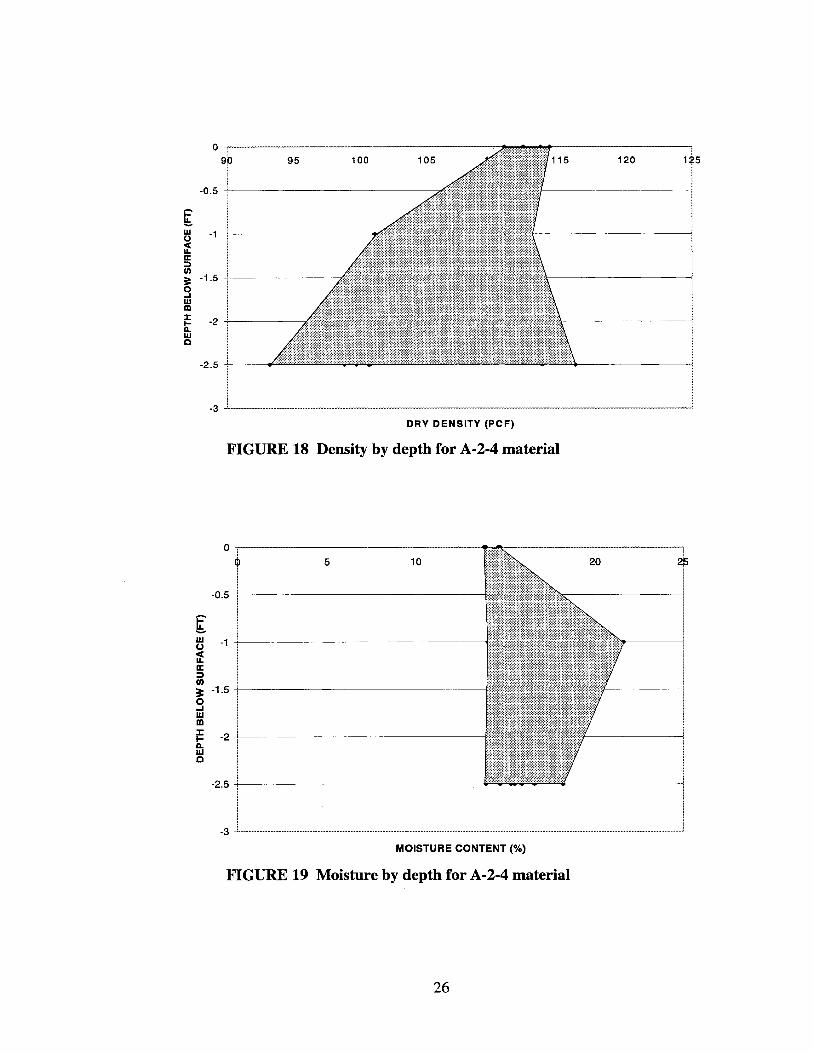
Dry density and moisture content of the A-3 and A-2-4 embankments were correlated with depth and are shown in Figures 16, 17, 18, and 19. The data for Figures 16 and 17 corresponds to the A-3 material and Figures 18 and 19 represents the A-2-4 material.
From these relationships it was verified that compaction of cohesionless soils starts at approximately one foot below the construction grade surface. The average density at the surface for the A-3 material was approximately 102 pcf. This corresponds to a relative density of approximately 50%. The density increases to 116 pcf at one foot in depth and further increases to 117 .5 pcf at a depth of 2.5 feet with relative densities of 95% and 98%, respectively.
Moisture content at the top of the A-3 embankment averaged 7%, which was near the bulking moisture content. This is unfortunate since both the lack of confinement and the bulking phenomena are responsible for the low densities. However, the increase in density as both the confinement and moisture contents increase confirms the necessity of having confinement to achieve compaction. From 1 to 2.5 feet the moisture content averaged approximately 10%, which is above of the bulking moisture content.
23

FIGURE 15 Nuclear moisture and density testing in a 2.5' ditch excavation
0
sb 95 100 1 5
-0.5
~ -1 w (.)
If IC :::i Ill
~ -1.5
w m :c ti: -2 w c
-2.5 +--------------------__.
DRY DENSITY (PCF)
FIGURE 16 Density by depth for A-3 material
24

0 ~ 5 15 20 2r
·0.5
g -1 w
0 ct u. IC
ii1 ~ ..I
-1.5
w a:i :c b:: ·2 w c
·2.5
MOISTURE CONTENT(%)
FIGURE 17 Moisture by depth for A-3 material
The A-2-4 moisture and density plots shown in Figures 18 and 19 show less significant moisture and density changes with depth. The density becomes more scattered as the depth increases. This is believed to be due to the water retaining capacity of the material. Unlike the clean A-3 material that has the ability to drain within a reasonably short amount of time, the A-2-4 material retains the water. Thus, the compaction energy being applied at the onefoot depth could be carried in pore water pressure. Notice in Figure 18 that at the 2.5 foot depth, some of the density tests fell below 80% relative density, and instability was observed.
Construction equipment rutting is pictured in Figure 20. The photograph shows the instability of the embankment on which the depth testing was conducted. The ruts evident from construction equipment measured over a foot in depth and the roller was unable to operate. The only option for the contractor was to move the operation to another portion of the embankment and allow this portion to dry. Unfortunately, this material did not dry and the contractor was forced to implement moisture control procedures. Eventually disking was used to aerate and dry the material. Figure 21 is a photograph of the embankment after it had been disked and dried. Notice the difference in stability after disking.
25
0 ~,-----------------g[o
~ ~ -1 +------------
~ IC ::)
; -1.5 +i -------
0 ..J w m t -2~---w c
DRY DENSITY (PCF)
FIGURE 18 Density by depth for A-2-4 material
0
5 10
-0.5
i='" !!:. w -1 CJ <C II. IC ::) I/)
:= -1.5 0 .J w ID :i: -2 I-D. w 0
-2.5
-3
MOISTURE CONTENT (%)
FIGURE 19 Moisture by depth for A-2-4 material
26
120

FIGURE 20 Unstable embankment of A-2-4 material
FIGURE 21 Embankment of A-2-4 material with moisture control
27

Inspection of Figures 18 and 19 reveals another aspect of the A-2-4 soils that is different from the A-3 soils. The A-2-4 soils achieved density at the surface. The surface density tests were in fact the only tests that did achieve an average density greater than 85% relative density. Even if this soil's compaction characteristics were controlled by relative density there were enough fines in the soil to add adequate "apparent" cohesion properties to the soil, which made it compactable at the surface. Some A-2-4 soils were in this category. These soils, which may have an F200 value greater than 15% but can still be controlled by the relative density test, are unique and problematic. They share properties of both cohesive and cohesionless soils, and their behavior can change drastically from one soil to the next. The A-2-4 soils can contain from as little as 10% fines to as much as 36% fines. This difference in F200 material has been shown to be an influential element related to embankment stability.
To put it briefly, there was no single approach to moisture and density control that applied to construction of the A-2-4 and A-3 embankments. The A-2-4 soils have some properties of fine-grained materials, such as the compaction at the surface, and some properties of cohesionless material, such as the bulking phenomena. Additionally, the A-2-4 materials do not drain as they are compacted. Visual inspection of the embankments constructed of the A-2-4 soils showed that drainage was not evident anywhere on the slopes of the embankment including the base.
Moisture control on the A-3 soil is not as critical. The soil tends to drain and consolidate rather quickly, and achieving density is only a concern if the soil is at the bulking moisture content. For this reason, upper moisture restrictions are not necessary, but bulking moisture content should be avioded. The A-2-4 soils, by contrast, are very problematic soils. They do not drain and consolidate like the A-3 soils, and excessive water causes instability. The properties of this soil must be examined carefully upon excavation from borrow areas, and the moisture content at which the soil is used for construction should be controlled.
Compaction Effort/Rolling Patterns
The number of roller passes required to achieve maximum density was another variable investigated during the summer of 1998. The current Iowa DOT specification requires one roller pass for every inch of compacted thickness. Thus, for an eight-inch loose lift, a minimum of eight roller passes is required. This was found to be very conservative for A-3 soils.
Density and moisture testing was conducted on one of the embankments after each pass of the vibratory roller. This testing was only conducted on the A-3 material. Testing on the A-2-4 material was impossible since the roller could only rarely function on the grade and never completed more than one lift during this portion of the testing. The goal of this testing was to quantify the required number of roller passes for the clean cohesionless A-3 material. Figure 22 presents the results of the testing.
There is no clear trend depicted in Figure 22, but it should be noted that the maximum density attained in any of the tests is 114 pcf. This is approximately 80% relative density of the A-3 material. Even thought the densities were taken at a foot under the construction
28

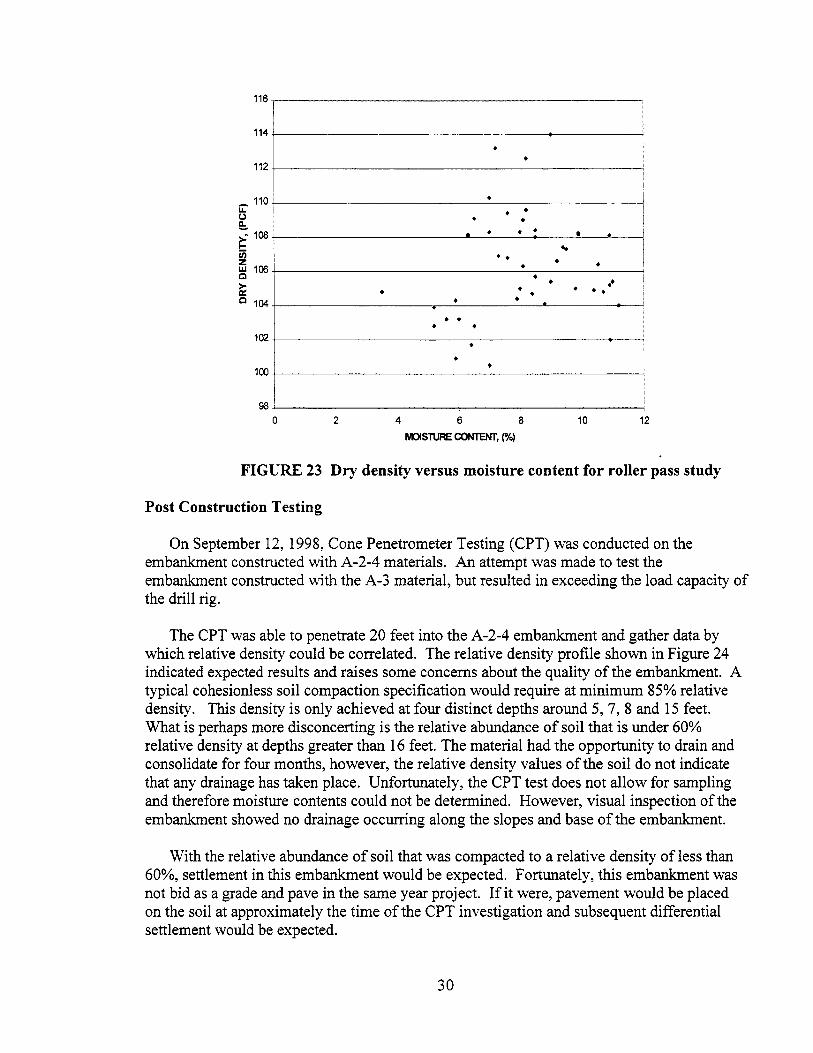
grade, density was not attainable. This can be explained by the moisture content at which the soil was compacted, shown in Figure 23. The moisture contents range from 3% to 11 %, therefore, the majority of the soil is near the bulking moisture content.
In some cases density increased with additional rolling and in some cases density decreased with further rolling. The density is better correlated with moisture content. Unfortunately, a wider range of moisture contents was not available for testing thus further trends are not reported. However, from the data available, a large number of passes by the roller did not necessarily increase density. Furthermore, the greatest density was achieved after only four passes of the roller for all of the tests conducted. The moisture content for this soil was over 7%, which was assumed to be just wet of the bulking moisture content.
J 112+----I _____ 77-/-------<
u:;-110+----------f-----t------------~ (.)
e:..
~1ffi+------rllk--I-~~----..+--------------< z w Q
> ~1IB+-----~--+-~-_,_,~-1-~;?--~-----+---------i
1ffi+---.,...-~~.,...-~~.,...-~~.,...-~-.--~~.--~-~~--i
0 2 3 4 5 6 7 8
#O:A EES(BJIH~
FIGURE 22 Density versus roller passes
29
116
114
112
- 110 u.. (.) a. ~ 108
u; z ~ 106
~ c 104
102
100
98
•
0 2
• •
• • • • •
- • • ••
• •
• • • • • •
• • •
4 6 8 MOISTIJRE CONTEJIIT, (%)
I I l
I I i !
l • • - i ..
I • • • • i
• •• I
• •• I - :
I I I l
i I
I
10 12
FIGURE 23 Dry density versus moisture content for roller pass study
Post Construction Testing
On September 12, 1998, Cone Penetrometer Testing (CPT) was conducted on the embankment constructed with A-2-4 materials. An attempt was made to test the embankment constructed with the A-3 material, but resulted in exceeding the load capacity of the drill rig.
The CPT was able to penetrate 20 feet into the A-2-4 embankment and gather data by which relative density could be correlated. The relative density profile shown in Figure 24 indicated expected results and raises some concerns about the quality of the embankment. A typical cohesionless soil compaction specification would require at minimum 85% relative density. This density is only achieved at four distinct depths around 5, 7, 8 and 15 feet. What is perhaps more disconcerting is the relative abundance of soil that is under 60% relative density at depths greater than 16 feet. The material had the opportunity to drain and consolidate for four months, however, the relative density values of the soil do not indicate that any drainage has taken place. Unfortunately, the CPT test does not allow for sampling and therefore moisture contents could not be determined. However, visual inspection of the embankment showed no drainage occurring along the slopes and base of the embankment.
With the relative abundance of soil that was compacted to a relative density of less than 60%, settlement in this embankment would be expected. Fortunately, this embankment was not bid as a grade and pave in the same year project. If it were, pavement would be placed on the soil at approximately the time of the CPT investigation and subsequent differential settlement would be expected.
30

0 20 40 60 80 100
Relative Density,(%)
FIGURE 24 Relative density by depth for A-2-4 material
31

EMBANKMENT CONSTRUCTION WITH COHESIVE SOILS
Compaction of cohesive soil is defined as "the process by which a mass of soil consisting of solid soil particles, air, and water is reduced in volume by the momentary application of loads" (9). By definition the process of compaction seems straightforward, however, even with today's technology the subject of soil compaction is complex and confusing to many engineers and contractors. Proctor (I 0) believed that the first principle of soil compaction was that water simply lubricated soil particles reducing the energy needed to force the particles together. Subsequent to Proctor's moisture-density relationship, the theory of cohesive soil compaction has been studied in detail by several investigators (11, 12, 13, 14, 15). Research has shown that soil compaction is very complex including not only soil lubrication, but capillary suction pressure, hysteresis, pore air pressure, pore water pressure, permeability, surface phenomena, and osmotic pressures (9). Despite the complexity of soil compaction, general relationships between soil type, moisture content, density, and compaction are predictable.
For cohesive soils, changes in moisture content greatly effect soil properties. Table 8 shows relative soil properties, some of which are competing, of a cohesive soil based on standard Proctor compaction effort at optimum moisture content. On the dry side of optimum moisture content, relatively high shear strength and low pore pressure are attainable, which are desirable properties for embankment construction. However, dry of optimum the potential for soil expansion and frost action increases. On the wet side the soil is less permeable but the modulus and shear strength decrease. Thus, it can be seen that selecting the proper moisture content and compaction effort is very challenging and requires knowledge of the soil characteristics and the intended use of the material. Density and compaction effort also affect soil properties similar to changes in moisture content. For example, the described soil properties will occur at a progressively lower moisture content as compaction effort increases (16).
TABLE 8 Comparison of soil properties with moisture content (17)
Dry of Optimum Soil Property Wet of Optimum
Higher Strength Lower More Random Particle Arrangement Less Random
More Permeable Permeability Less Permeable More compressible Compressibility More Compressible
More Rapidly Consolidation Less Rapidly Lower Pore Pressure Higher Higher Stress-Strain Modulus Lower Higher Expansion Lower Higher Frost Action Lower
More Sensitive Sensitivity Less Sensitive
32
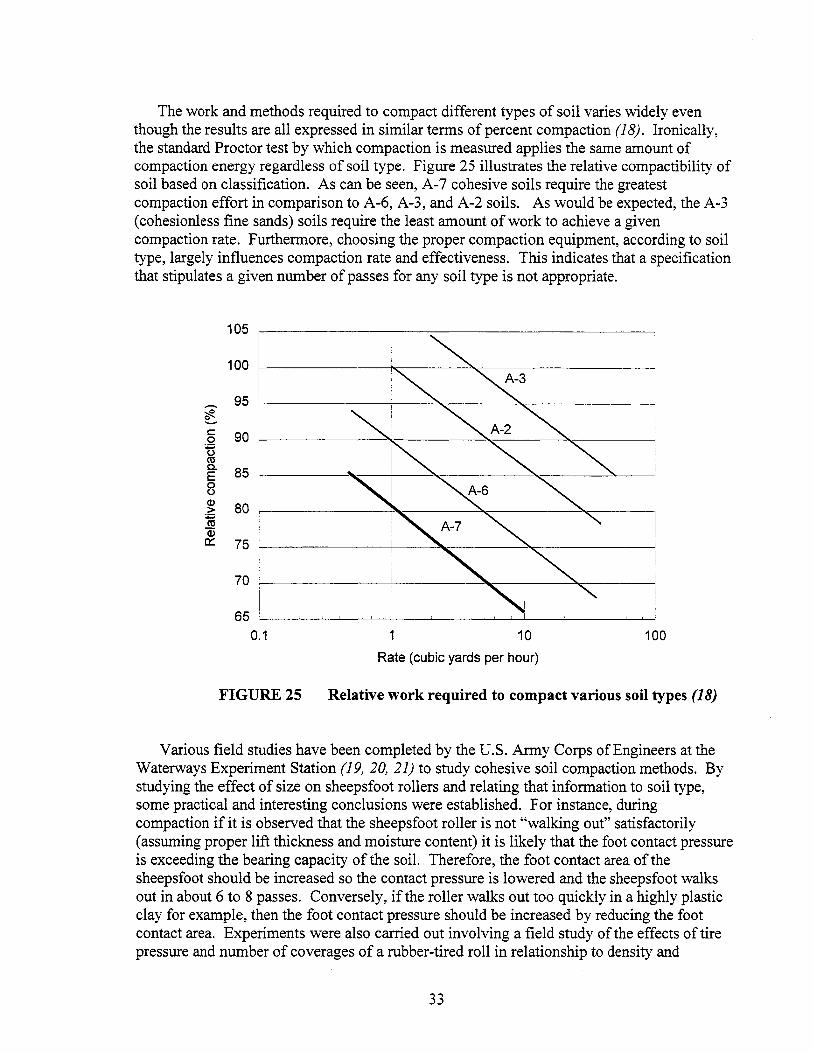
The work and methods required to compact different types of soil varies widely even though the results are all expressed in similar terms of percent compaction (18). Ironically, the standard Proctor test by which compaction is measured applies the same amount of compaction energy regardless of soil type. Figure 25 illustrates the relative compactibility of soil based on classification. As can be seen, A-7 cohesive soils require the greatest compaction effort in comparison to A-6, A-3, and A-2 soils. As would be expected, the A-3 ( cohesionless fine sands) soils require the least amount of work to achieve a given compaction rate. Furthermore, choosing the proper compaction equipment, according to soil type, largely influences compaction rate and effectiveness. This indicates that a specification that stipulates a given number of passes for any soil type is not appropriate.
;R' ~ c: 0
u ro c.. E 0 (.)
Cl> > ~ a; c:::
105
100
95
90
85
80
75
70
65 0.1
FIGURE25
10
Rate (cubic yards per hour)
100
Relative work required to compact various soil types (18)
Various field studies have been completed by the U.S. Army Corps of Engineers at the Waterways Experiment Station (19, 20, 21) to study cohesive soil compaction methods. By studying the effect of size on sheepsfoot rollers and relating that information to soil type, some practical and interesting conclusions were established. For instance, during compaction if it is observed that the sheepsfoot roller is not "walking out" satisfactorily (assuming proper lift thickness and moisture content) it is likely that the foot contact pressure is exceeding the bearing capacity of the soil. Therefore, the foot contact area of the sheepsfoot should be increased so the contact pressure is lowered and the sheepsfoot walks out in about 6 to 8 passes. Conversely, if the roller walks out too quickly in a highly plastic clay for example, then the foot contact pressure should be increased by reducing the foot contact area. Experiments were also carried out involving a field study of the effects of tire pressure and number of coverages of a rubber-tired roll in relationship to density and
33
strength. Results showed that considerable changes in density and optimum moisture content were related to the number of roller passes and tire pressure (20). As the tire pressure increased the optimum moisture content decreased and the density increased. Furthermore, it was determined that rubber-tired rollers can effectively compact larger lifts than the sheepsfoot roller. For a 90 psi roller it was found that the roller can compact loose lifts up to 14 inches, but a 150 psi roller can only compact loose lifts of 9 inches due to rutting (21). In comparison with the sheepsfoot roller, the rubber-tired roller may be more efficient if tracking is not a problem.
Cohesive Soil Field Test Results
To evaluate the current field practice for embankment construction with cohesive soils, field testing and monitoring were conducted on two recent Iowa DOT embankment projects. Field activities included observations of fill placement, in-place moisture and density testing, and dynamic cone penetrometer (DCP) index testing. Also, experiments involving rubbertired compaction and aeration by disking were carried out. Upon completion of one of the embankments, subsurface explorations were performed at selected locations to obtain information on actual finished conditions and to develop an engineering evaluation for the project. Standard Penetration Tests (SPT), Cone Penetration Tests (CPT), and Shelby tube sampling operations were completed. The investigation procedures and results of testing and evaluation are described in the following sections.
Field and Laboratory Test Procedures In-situ lift-by-lift field density, DCP index, and moisture tests were performed on a
variety of cohesive fill materials placed in the embankments. To obtain field density information on compacted soils, a nuclear density gauge and a U.S. Army Corps of Engineers Surface Soil Sampler were utilized. Nuclear density tests were performed with a Humbolt model 5001 nuclear density gauge in the direct transmission mode in accordance with ASTM D-2922 and D-3017 for compaction of soils. The average of two nuclear density and moisture tests at the each test location was recorded as the in-place density and moisture. Field density tests performed with the U.S. Army Corps of Engineers Surface Soil Sampler, which was developed to take tests at or near the ground surface, were performed in accordance with ASTM D-2937. The density sampler consisted of a IO-pound drop hammer and thin-walled steel tubes machined to a calibrated volume. The steel tubes were driven into the compacted soil then removed, trimmed and weighed to obtain wet density. A moisture sample was then obtained from the.center of each tube. Moisture contents were determined in the laboratory utilizing the oven method (ASTM D-2216) and in the field using the microwave oven method (ASTM D-4643). During field testing, a calcium carbide "Speedy" moisture tester (AASHTO T2 l 7) was used to determined field moisture contents.
In addition to field density and moisture tests, a dual-mass DCP was used to provide some measure of the shear resistance and stability of compacted soils. With software provided by the DCP manufacturer, DCP index values in mm/blow were converted to an equivalent California Bearing Ratio (CBR) (ASTM D-1883) as a measure of subgrade stability. The dual-mass DCP consists of a 5/8-inch diameter steel rod with a disposable, 60-degree cone attached to one end. The cone was driven into the ground up to a maximum
34
39 inches by dropping either a 17.6 or 10.l pound hammer 22.6 inches onto an anvil located on the rod. By using disposable cones the difficulty in retrieving test cones from the soil was reduced. The DCP is rated at accurately predicting CBR values over a range of 0.5 to 100%. Currently, an ASTM Test Standard for the dual-mass DCP is under review; therefore, the manufacturer's recommendations for testing procedures were closely followed. The dualmass DCP described was purchased from Kessler Soils Engineering Products, Inc. located in Springfield, Virginia.
Moisture-density relationship tests were performed on several samples of material in accordance with ASTM D-698. These relationships were used to determine percent compaction and reference moisture contents. Engineering soil classification followed ASTM D2487-93 for the Unified Soil Classification System and AASHTO M145-91 for Highway Construction Purposes.
Drilling and Sampling Operations Subsurface explorations were conducted once the embankment was near completion or
close to design subgrade elevation. The primary objectives of the subsurface sampling operations were: (1) to determine the in-situ conditions of the embankment materials after construction and (2) to analyze these conditions, compared to construction test results, as they relate to embankment quality. In order to investigate the subsurface conditions, Standard Penetration Tests (SPT), Cone Penetration Tests (CPT), and Shelby tube borings were performed utilizing a truck-mounted, 1978 International, rotary drill rig. SPT tests, which utilized a donut hammer type and cathead hammer release mechanism, were performed in general accordance with ASTM D-1586. Additionally, SPT tests were performed with a standard 2-inch outside diameter split-barrel sampler that was driven into the soil with a 140-pound hammer falling a distance of 30 inches. The number of blows required to advance the sampler the last 12 inches of the 18-inch penetration was recorded as the SPT, or N4s value. Based on the equipment type and field methods, hammer efficiency was estimated at 0.45 (22).
To further characterize the embankment profile, CPT with pore pressure measurements were performed using a Piezocone supplied by GeoSystems Engineering, Inc. located in Lenexa, Kansas. From this investigation continuous measurements of penetration resistance, local frictional resistance, and pore pressure were obtained. Data was collected at each sensor and transmitted to the surface using an acoustic transmission. Geotechnical parameters such as shear strength and soil classification were generated from correlations and compared to the SPT and Shelby tube boring data. Classification of the soil was based on charts created for predicting soil type based on behavior, not grain-size distribution. The CPT tests were performed in general accordance with ASTM D-5778. However, the target push speed, which was 2 emfs, was highly variable between 0.1 to 16.1 cm/s due to equipment limitations. Push depths ranged from 14 to 17 feet.
Lastly, Shelby or thin-walled tubes, which utilized 3-inch O.D. seamless steel tubes with a sharp cutting edge, were pushed hydraulically into the soil to obtain relatively undisturbed samples of compacted cohesive soil. Soil samples obtained in the field were sealed and returned to the laboratory for further examination, classification, and testing. Unconfined
35

compressive strength (ASTM D-2166), moisture content, and density tests were performed on representative portions of the undisturbed samples obtained by the thin-wall sampler. A calibrated hand penetrometer was used to determine the approximate unconfined compressive strength when samples were deformed or of insufficient size.
Project Locations Two Iowa DOT highway construction projects were chosen for construction monitoring
and engineering evaluation in partial completion of the Embankment Quality Research Phase II project. Primary objectives for determining the site locations were (1) soil type and (2) fill depths. The selected research sites both contained cohesive soils of glacial origin with some alluvial materials and fill depths were 20 feet or greater. U.S. Highway 61 in Lee County from approximately 0.5 miles south of U.S. Highway 218 to 2.5 miles North of U.S. Highway 218 was the primary research site.
To supplement data collected at U.S. Highway 61, the U.S. Highway 34 project in Henry County from East of county road X-13 to West of Quincy A venue ( 5 .2 miles) was selected as the second location. Different soils, contractor, and construction equipment made this a good site for data comparisons.
Site and Subsurface Conditions - U.S. Highway 61, Lee County The U.S. Highway 61 project in Lee County was located parallel to the existing two-lane
highway. Prior to construction, land surrounding the site was used for agriculture. The area within the project site used for field-testing and research contained no structures. A swale existed at the northwest corner of the testing site, which contained ponded water during construction. The swale was later filled with compacted soil. Grades throughout the fieldtesting section sloped from the south to the north with a difference in elevation of 70 feet over a distance of 1500 feet. However, at the south end of the research site a 30 to 40% slope rising approximately 50 feet to an upland region accounted for most of the elevation change. This sloping upland region was excavated and utilized as the primary fill material. Excavated cuts into the slope were as deep as 35 feet. Soils encountered at the site were part of the Lindley-Weller association (2 3).
Subsurface conditions encountered at this site consisted primarily of a thin layer of loess over glacial till. In Lee County the major Pleistocene deposits are Pre-Illinoian (classical Nebraska and Kansas drift) (23). Below the upper till a paleosol with high plasticity index values was observed during construction. Moreover, while the upper till was mostly oxidized, the lower till was not oxidized or leached and had a dark gray color with some mottles.
Prior to construction the Iowa DOT completed soil borings every 200 to 400 feet along the length of the proposed project to draft the soil design and borrow sheets. Borings encountered 3 to 12 inches of silt loam topsoil underlain by several feet of plastic clay. Dark gray/brown A-7-6/clay loam and yellow brown A-6/clay loam were the predominate soils identified in the borings up to 40 feet below grade. The primary geotechnical concerns were the presence of the montmorillonitic high shrink/swell clay soils being placed near design subgrade elevation and the potential for pavement damage from frost action.
36
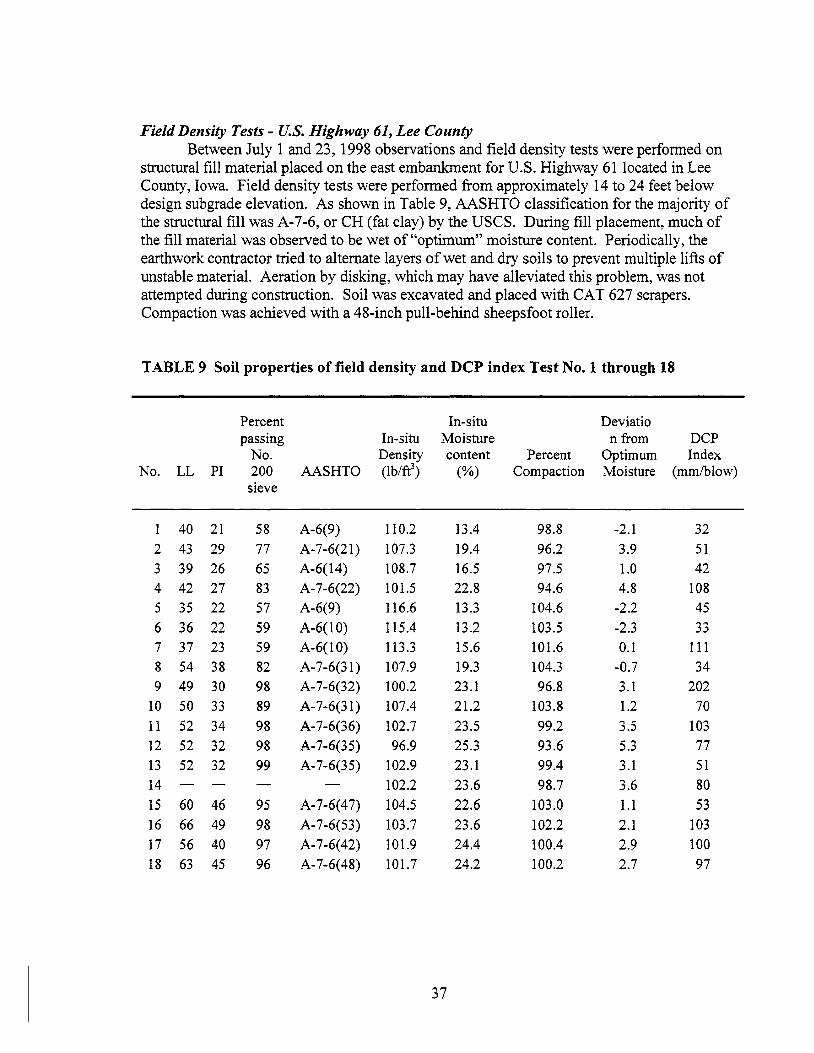
Field Density Tests - U.S. Highway 61, Lee County Between July 1 and 23, 1998 observations and field density tests were performed on
structural fill material placed on the east embankment for U.S. Highway 61 located in Lee County, Iowa. Field density tests were performed from approximately 14 to 24 feet below design subgrade elevation. As shown in Table 9, AASHTO classification for the majority of the structural fill was A-7-6, or CH (fat clay) by the USCS. During fill placement, much of the fill material was observed to be wet of "optimum" moisture content. Periodically, the earthwork contractor tried to alternate layers of wet and dry soils to prevent multiple lifts of unstable material. Aeration by disking, which may have alleviated this problem, was not attempted during construction. Soil was excavated and placed with CAT 627 scrapers. Compaction was achieved with a 48-inch pull-behind sheepsfoot roller.
TABLE 9 Soil properties of field density and DCP index Test No. 1through18
Percent In-situ Deviatio passing In-situ Moisture n from DCP
No. Density content Percent Optimum Index No. LL PI 200 AASHTO (lb/ft3) (%) Compaction Moisture (mm/blow)
sieve
40 21 58 A-6(9) 110.2 13.4 98.8 -2.1 32
2 43 29 77 A-7-6(21) 107.3 19.4 96.2 3.9 51
3 39 26 65 A-6(14) 108.7 16.5 97.5 1.0 42
4 42 27 83 A-7-6(22) 101.5 22.8 94.6 4.8 108
5 35 22 57 A-6(9) 116.6 13.3 104.6 -2.2 45
6 36 22 59 A-6(10) 115.4 13.2 103.5 -2.3 33 7 37 23 59 A-6(10) 113.3 15.6 101.6 0.1 111
8 54 38 82 A-7-6(31) 107.9 19.3 104.3 -0.7 34
9 49 30 98 A-7-6(32) 100.2 23.l 96.8 3.1 202
10 50 33 89 A-7-6(31) 107.4 21.2 103.8 1.2 70
11 52 34 98 A-7-6(36) 102.7 23.5 99.2 3.5 103 12 52 32 98 A-7-6(35) 96.9 25.3 93.6 5.3 77
13 52 32 99 A-7-6(35) 102.9 23.l 99.4 3.1 51
14 102.2 23.6 98.7 3.6 80
15 60 46 95 A-7-6(47) 104.5 22.6 103.0 1.1 53
16 66 49 98 A-7-6(53) 103.7 23.6 102.2 2.1 103
17 56 40 97 A-7-6(42) 101.9 24.4 100.4 2.9 100
18 63 45 96 A-7-6(48) 101.7 24.2 100.2 2.7 97
37
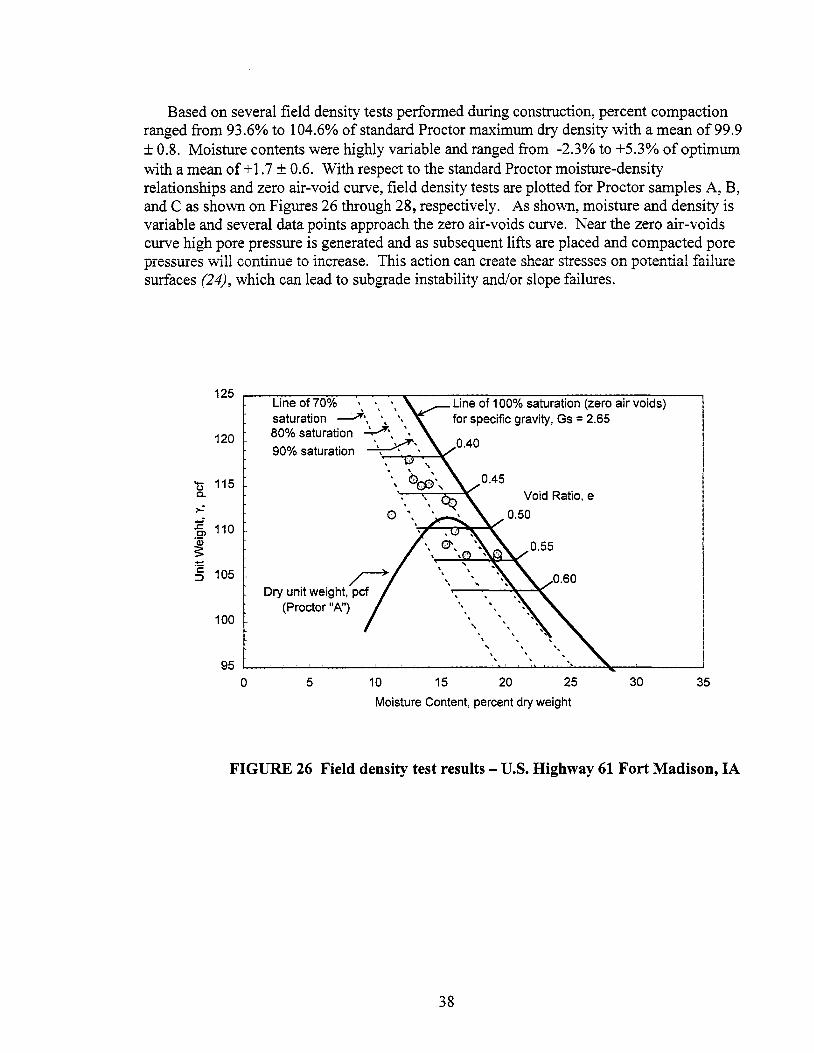
Based on several field density tests performed during construction, percent compaction ranged from 93.6% to 104.6% of standard Proctor maximum dry density with a mean of 99.9 ± 0.8. Moisture contents were highly variable and ranged from -2.3% to +5.3% of optimum with a mean of+ 1. 7 ± 0.6. With respect to the standard Proctor moisture-density relationships and zero air-void curve, field density tests are plotted for Proctor samples A, B, and C as shown on Figures 26 through 28, respectively. As shown, moisture and density is variable and several data points approach the zero air-voids curve. Near the zero air-voids curve high pore pressure is generated and as subsequent lifts are placed and compacted pore pressures will continue to increase. This action cai~ create shear stresses on potential failure surfaces (24), which can lead to subgrade instability and/or slope failures.
125 .----:...,.---,=-.::"'!":'""~~~-..~~---.,...,..--.,,~~~~-,...~~~,.----,-~~--, Line of 70% Line of 100% saturation (zero air voids) saturation __;_;ir._ '. ". for specific gravity, Gs= 2.65 80% saturation ~'. '-
90% saturation ~" 120
'ti 115 Q.
,..: :E Cl
~ -'2 ::::>
110
105
100
95 0
~ ', Dry unit weight, pcf
(Proctor "A")
5 10 15
'•
' '
Void Ratio, e
0.50
'
20 25
Moisture Content, percent dry weight
30 35
FIGURE 26 Field density test results - U.S. Highway 61 Fort Madison, IA
38

'U c.. ;:.:
:E C>
~ ·c: ::::>
'U c..
<-: :E C>
~ -·c: ::::>
115
110
105
100
95
90
85
0
Line of 70% __;;r. " ' saturation ' • ,
80% saturation .:._,;ir " \
90% saturation ·~ \
Dry unit weight, pcf (Proctor "B")
~
5 10 15
' '
20
Line of 100% saturation (zero air voids)for specific gravity, Gs= 2.68
0.55
Void Ratio, e
·. . ' •,
' \
25 30
Moisture Content, percent dry weight
35
FIGURE 27 Field density test results - U.S. Highway 61 Fort Madison, IA
115
110
105
100
95
90
85
0
Line of70% saturation ___;::r '-. '
80% saturation ~ ·., 90% saturation ~
·----~
5
Dry unit weight, pcf (Proctor "C")
~
10 15 20
1ne o o sa ura ion (zero air voids) for specific gravity, Gs = 2.69 0.55
Void Ratio, e
·.
25 30
Moisture Content, percent dry weight
35
FIGURE 28 Field density test results - U.S. Highway 61 Fort Madison, IA
39

Throughout the earthwork construction process at U.S. Highway 61, some construction methods including lift thickness and roller passes were not consistent. Lift thickness, which was measured by placing newspaper between consecutive lifts and later excavating, varied from 7 to 22 inches compacted. Between lifts, leveling was achieved with motor graders and bulldozers. On average, every other lift had some form of lift leveling. Sheepsfoot roller passes were not constant and varied based on the following factors: (1) the area in which the fill was placed, (2) the construction equipment traffic patterns, and (3) from equipment operator to operator. On average from 2 to 8 roller passes were accomplished per lift. In addition, equipment traffic from scrapers and motor graders added to the compaction effort. Regularly, sheepsfoot roller walkout was not achieved in accordance with Iowa DOT Specification 2107.05 unless the material was at optimum or dryer moisture content or the soil was very cohesive, in which case the roller would walk out within a few passes. According to Iowa DOT Specification 2107.05, sheepsfoot roller walkout is determined by measuring the depth of penetration of the roller feet, which is not to exceed 3 inches for an 8 inch loose lift. As shown in Figure 29 sheepsfoot roller penetration was minimal on this extremely plastic clay. These highly cohesive soils exhibited relatively quick sheepsfoot walkout and were often susceptible to "Oreo cookie" effects as measured by the DCP. "Oreo cookie" effects occurred when underlying portions of a lift are not compacted because the overlying material bridges the roller, preventing densification. In the following sections, data showing "Oreo cookie" effects will be discussed in more detail.
FIGURE 29 Highly plastic soil (LL = 61, PI = 45) exhibiting low sheepsfoot penetration and roller walkout within a few passes
40
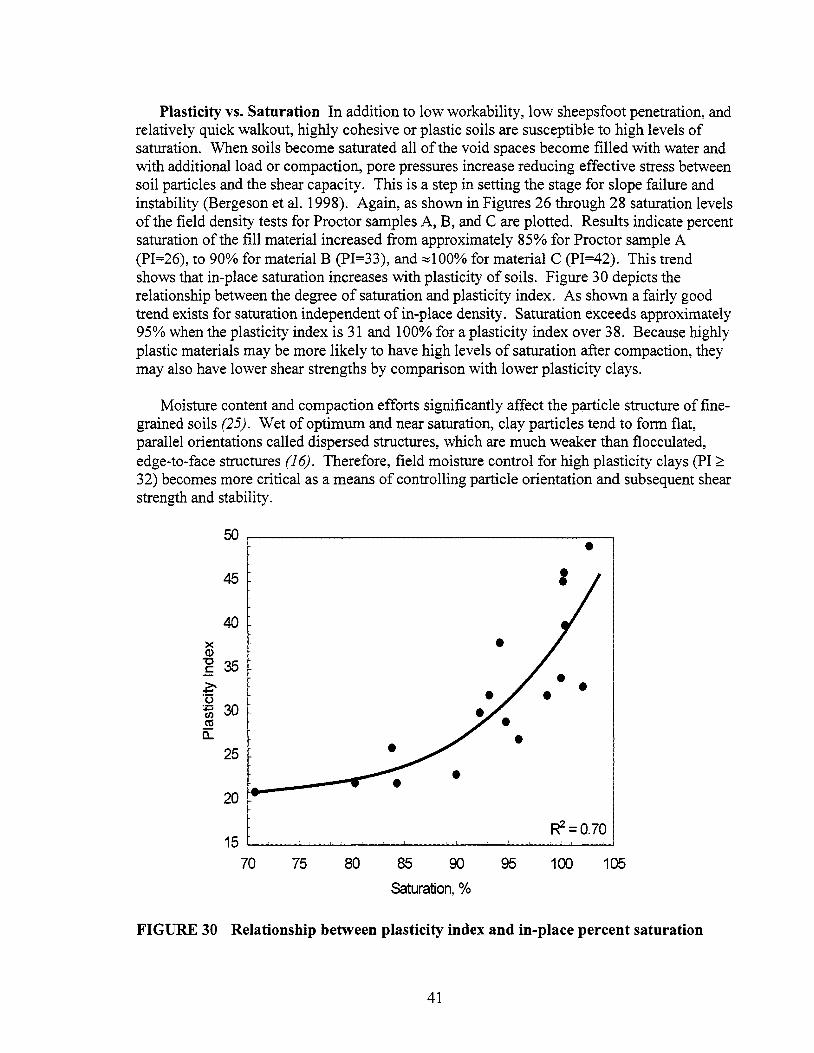
Plasticity vs. Saturation In addition to low workability, low sheepsfoot penetration, and relatively quick walkout, highly cohesive or plastic soils are susceptible to high levels of saturation. When soils become saturated all of the void spaces become filled with water and with additional load or compaction, pore pressures increase reducing effective stress between soil particles and the shear capacity. This is a step in setting the stage for slope failure and instability (Bergeson et al. 1998). Again, as shown in Figures 26 through 28 saturation levels of the field density tests for Proctor samples A, B, and C are plotted. Results indicate percent saturation of the fill material increased from approximately 85% for Proctor sample A (PI=26), to 90% for material B (PI=33), and ~100% for material C (PI=42). This trend shows that in-place saturation increases with plasticity of soils. Figure 30 depicts the relationship between the degree of saturation and plasticity index. As shown a fairly good trend exists for saturation independent of in-place density. Saturation exceeds approximately 95% when the plasticity index is 31 and 100% for a plasticity index over 3 8. Because highly plastic materials may be more likely to have high levels of saturation after compaction, they may also have lower shear strengths by comparison with lower plasticity clays.
Moisture content and compaction efforts significantly affect the particle structure of finegrained soils (25). Wet of optimum and near saturation, clay particles tend to form flat, parallel orientations called dispersed structures, which are much weaker than flocculated, edge-to-face structures (16). Therefore, field moisture control for high plasticity clays (PI;;::::: 32) becomes more critical as a means of controlling particle orientation and subsequent shear strength and stability.
50 • 45
40 x a>
"O 35 .s >. -·c::;
:o::; 30 (/) ctS a..
25
20
R2 = 0.70 15
70 75 80 85 90 95 100 105
Saturation, %
FIGURE 30 Relationship between plasticity index and in-place percent saturation
41

DCP Index Testing - U.S. Highway 61, Lee County
Even when moisture and density parameters are satisfied, insufficient soil stability for supporting construction traffic has been observed (26, 27). To develop an improved understanding between acceptable levels of subgrade stability and soil properties, DCP testing was completed during in-place testing procedures. Relationships between subgrade stability from DCP index values and moisture, density, unconfined compressive strength, and CBR were investigated and are described in the following.
Accompanying the referenced in-place nuclear density and moisture tests described previously (test numbers 1-18), DCP index tests were performed. After performing the nuclear moisture and density tests, which were conducted to an 8-inch depth, corresponding DCP index values were obtained. The DCP was driven within the surface imprint left from the nuclear density gage to depths up to 39 inches. This data was collected to evaluate the stability and shear resistance of compacted fills. Once DCP testing was complete, test pits were excavated and samples were obtained for soil classification and observation. Again as shown in Table 9, A-6 (CL) and A-7-6 (CH) soils types were evaluated.
Continuous records of relative soil strength with depth were collected from the DCP index testing. Profiles showed layer thickness, strength conditions, uniformity, and were correlated to the CBR. CBR is the most common correlation ofDCP index data. The following correlations were used to estimate CBR:
1 CBR = 0.00287l(DCP)
1 CBR = ------
{0.017019(DCP)}2
292 CBR = DCPu2
(CH soils)
(CL soil for CBR < 10)
(All other soils)
DCP index tests, which are expressed in terms of the mm/blow and resultant CBR values, are shown in Figure 31 for test numbers 1 through 4. From these plots lift thickness and soft unstable areas can be identified. For test numbers 1 through 4, the upper lifts varied from about 15 to 20 inches thick while the underlying layers are from 15 to 17 inches thick. At the base of the upper layers soft regions were detected, which formed from the "Oreo cookie" effect (density gradient). Overly thick lifts cause a density gradient from the top down so that the lower portion of the lift is not compacted. According to Peisker (28) a minimum CBR value of 6 should be required in subgrade before paving and, as shown in Figure 31 a large portion of the profiles would not meet this criterion. This result was typical of many of the DCP index tests (test numbers 1 - 18).
42
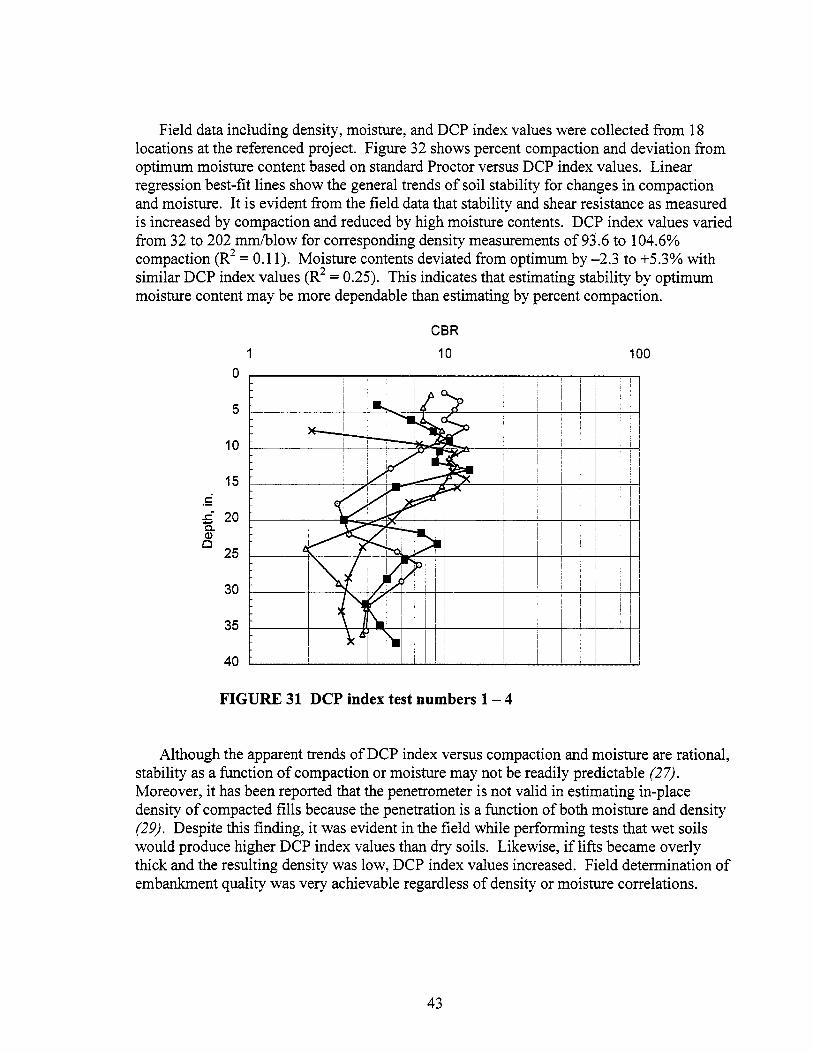
Field data including density, moisture, and DCP index values were collected from 18 locations at the referenced project. Figure 32 shows percent compaction and deviation from optimum moisture content based on standard Proctor versus DCP index values. Linear regression best-fit lines show the general trends of soil stability for changes in compaction and moisture. It is evident from the field data that stability and shear resistance as measured is increased by compaction and reduced by high moisture contents. DCP index values varied from 32 to 202 mm/blow for corresponding density measurements of 93.6 to 104.6% compaction (R2 = 0.11). Moisture contents deviated from optimum by-2.3 to +5.3% with similar DCP index values (R2
= 0.25). This indicates that estimating stability by optimum moisture content may be more dependable than estimating by percent compaction.
CBR
1 10 100 0
5
10
15 .5 .c: 20 -c.. Q)
Cl 25
30
35
40
FIGURE 31 DCP index test numbers 1 - 4
Although the apparent trends of DCP index versus compaction and moisture are rational, stability as a function of compaction or moisture may not be readily predictable (27). Moreover, it has been reported that the penetrometer is not valid in estimating in-place density of compacted fills because the penetration is a function of both moisture and density (29). Despite this finding, it was evident in the field while performing tests that wet soils would produce higher DCP index values than dry soils. Likewise, if lifts became overly thick and the resulting density was low, DCP index values increased. Field determination of embankment quality was very achievable regardless of density or moisture correlations.
43

106
104 .... ~ 0 ........... 102 Cl.~ -·-0 Cf) c: - a.> a; 't:) 100 l: ~ a.> 't:)
!h E 98 c: :J o E :: ·x u ('ti
8_ E 96 E 0 (.)
94
92 0
6
5 E .g 4 c: 0
~ ....... 3 iii§ 9. E 2 ~:a 0 - 0 'E 5 ~ t)
• • • • •
• •
• •
• R2 = 0.11
25 50 75 100 125 150 175 200 225
DCP Index, mm/blow
§ e u Cl. 0 ------------D-------------~ :J
1ii -1 ·o 0
:2: -2
'2> 0 R2 = 0.25
-3
0 25 50 75 100 125 150 175 200 225
DCP Index, mm/blow
FIGURE32 DCP index versus compaction and moisture content
44

Rubber-Tired Compaction
Field density, moisture, DCP index, and unconfined compressive strength tests were performed on fill materials placed in an experimental rubber-tired rolling test section. The objective of the experiment was to compare in-place moisture, density and stability results with soil properties generated from the existing Iowa DOT sheepsfoot walkout specification. The rubber-tired compaction was carried out in highly plastic unoxidized glacial till with soil properties as shown in Table 10. The fill material, which was excavated from a borrow in large slabs and clods, was placed and compacted without manipulation or lift-leveling in a 100 foot by 200 foot test section. Fill material, clod size and compaction equipment is shown in Figure 33. Several large clods ranging in size from 1 to 4 feet in diameter were observed during placement. Compaction was achieved with 1.5 to 2 complete coverages of the rubbertired, loaded, CAT 627 scraper as shown. Compacted lifts thickness varied between 12 and 16 inches. During compaction, large clods were broken down and molded with surrounding materials through the tire's kneading action. Based on this observation, rubber-tired rolling may reduce the need for disking to reduce clod size. However, aeration by disking at this location still would have been advantageous due to high moisture and saturation levels.
TABLE 10 Soil properties of experimental tire rolling section
Percent passing No. 200
No. LL PI sieve AASHTO
ST-la 68 52
b 61 45
ST-2a 64 47
b 62 46
ST-3a 62 47
b 69 53
c 62 46
ST-4a 69 52
b 62 46
c 65 48
ST-5a 63 46
b 60 44
c 61 45
ST-6a 52 37
b 64 47
ST-7a 66 49
b 63 46
c 55 39
Proc. H 63 42
96
96
96
96
96
96
96
96
96
96
97
96
96
96
96
96
96
96
96
A-7-6(55)
A-7-6(47)
A-7-6(49)
A-7-6(48)
A-7-6(49)
A-7-6(56)
A-7-6(48)
A-7-6(55)
A-7-6(48)
A-7-6(51)
A-7-6(49)
A-7-6(46)
A-7-6(47)
A-7-6(38)
A-7-6(49)
A-7-6(52)
A-7-6(48)
A-7-6(40)
A-7-6(45)
In-situ Unconf. In-situ Moisture
Compress. Density content (lb/in2
) (lb/ft3) (%)
30.4
21.8
30.0
34.4
18.7
31.5
20.1
19.2
33.9
28.2
29.8
28.0
28.8
28.2
45
105.5
103.8
105.8
105.9
105.4
101.3
105.5
105.7
105.0
104.7
106.4
106.8
108.4
104.7
103.1
110.7
106.0
101.5
22.8
24.7
22.9
22.6
22.3
26.6
23.6
23.3
23.4
23.5
23.0
22.7
21.6
24.0
24.5
17.3
24.7
20.0
Percent Comp.
103.9
102.3
104.2
104.3
103.8
99.8
103.9
104.1
103.4
103.2
104.8
105.2
106.8
103.2
101.6
109.1
104.4
Deviation from
Optimum Moisture
+2.8
+4.7
+2.9
+2.6
+2.3
+6.6
+3.6
+3.3
+3.4
+3.5
+3.0
+2.7
+1.6
+4.0
+4.5
-2.7
+4.7
DCP Index (mm/ blow)
36
70
73
34
100
69
41
110
67
32
130
46
33
81
51
100
54
47

;: ....
FIGURE 33 Large clod size and compaction from loaded CAT 627 scrapers
46
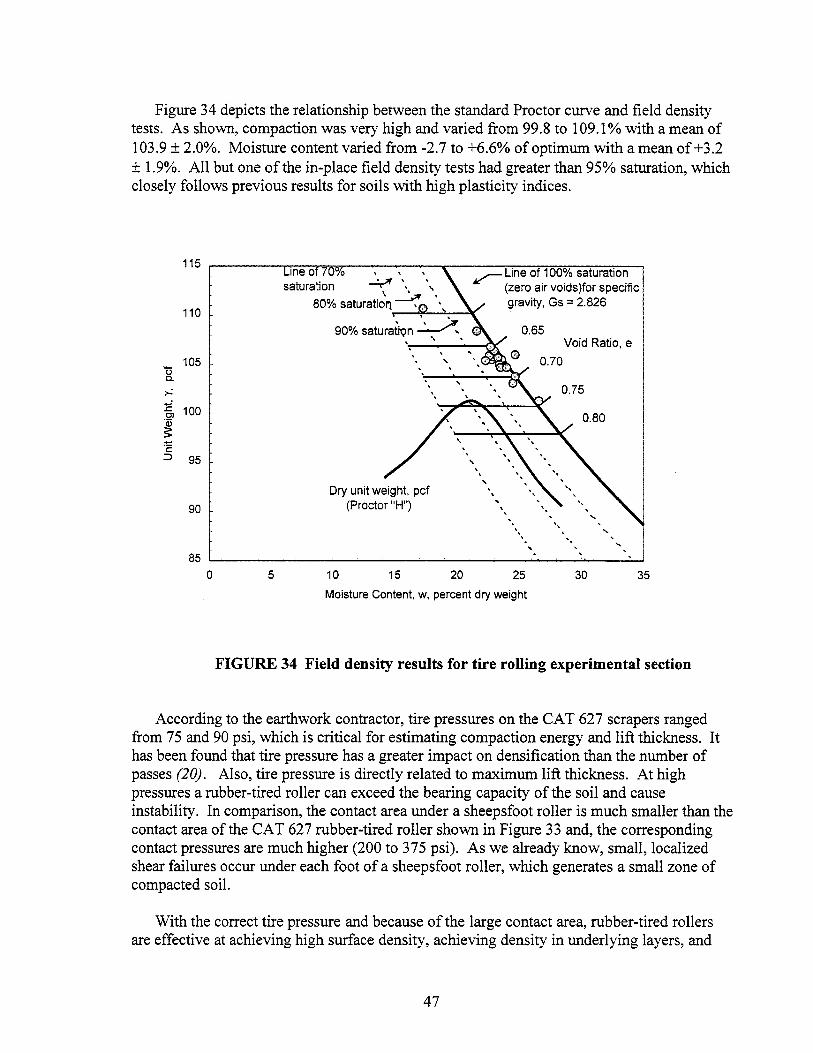
Figure 34 depicts the relationship between the standard Proctor curve and field density tests. As shown, compaction was very high and varied from 99 .8 to 109 .1 % with a mean of 103.9 ± 2.0%. Moisture content varied from -2.7 to +6.6% of optimum with a mean of +3.2 ± 1.9%. All but one of the in-place field density tests had greater than 95% saturation, which closely follows previous results for soils with high plasticity indices.
115
110
- 105 (.) a.
>= :E 100 Cl
~ -·c: ::::> 95
90
85 0 5
1ne o o • •
saturation ~ '. , \~.
80% saturatiol'J. , •
90% saturatiQn ~ . ' '
'
10 15 20
~Line of 100% saturation (zero air voids)for specific gravity, Gs = 2.826
'
'
0.65
. .
25
Void Ratio, e
0.70
0.75
0.80
30 35
Moisture Content, w, percent dry weight
FIGURE 34 Field density results for tire rolling experimental section
According to the earthwork contractor, tire pressures on the CAT 627 scrapers ranged from 75 and 90 psi, which is critical for estimating compaction energy and lift thickness. It has been found that tire pressure has a greater impact on densification than the number of passes (20). Also, tire pressure is directly related to maximum lift thickness. At high pressures a rubber-tired roller can exceed the bearing capacity of the soil and cause instability. In comparison, the contact area under a sheepsfoot roller is much smaller than the contact area of the CAT 627 rubber-tired roller shown in Figure 33 and, the corresponding contact pressures are much higher (200 to 375 psi). As we already know, small, localized shear failures occur under each foot of a sheepsfoot roller, which generates a small zone of compacted soil.
With the correct tire pressure and because of the large contact area, rubber-tired rollers are effective at achieving high surface density, achieving density in underlying layers, and
47

locating weak spots below the surface (30). In comparison, sheepsfoot rollers have higher surface stresses, which equate to better compaction near the surface. However, sheepsfoot roller contact area limits deep compaction. The Iowa DOT specification 2001.0S(A) requires a sheepsfoot roller to have a minimum 200 psi foot contact pressure, which is typical for fine-grained soils (31). Figure 35 depicts the change in vertical stress caused by the referenced CAT 627 rubber-tired roller at 90 psi and a typical 200 psi sheepsfoot roller. As shown the change in vertical stress under the CAT 627 tire is much greater than the sheepsfoot.
Based on observations, a good bond was obtained between lifts when the sheepsfoot roller was used. However, a minimal bond was found between lifts placed in the rubber-tired section. Furthermore, because the material was wet of optimum, lamination was observed. Lamination and a lack of bonding between lifts reduces shear strength, which leads to an increased potential for slope failure. Future embankment compaction with rubber-tired rolling methods should require scarification between lifts, especially with wet soils. For example, scarification from disking or scarifying teeth mounted on graders for lift leveling might work well.
(j) 20 Q)
0
ti e. r a t ~ 30 I
40
I 50 t
FIGURE35
50
Vertical Stress (psi)
100 150
Sheepsfoot roller Contact area 12 in2
Contact pressure 200 psi
--1- Rubber-tired CAT 627
Rubber-tired CAT 627 Contact area 500 in2
Contact pressure 90 psi
200
Change in vertical stress under rubber-tired CAT 627 scraper and typical sheepsfoot roller
48

For a given soil type it is known that there is not a single unique moisture-density relationship curve.· The standard or modified Proctor curves are simply references developed for field comparison of in-place densities, which closely match densities produced from sheepsfoot roller equipment. However, for different roller types, such as rubber-tired rollers, different moisture-density relationships exist. Dry of optimum moisture, an increase in density and soil strength results from the rubber-tired roller (20), which is desirable in embankment construction. To evaluate shear strength of soils compacted with the referenced CAT 627 scraper; several Shelby tube samples of fill were obtained for unconfined compression testing. In addition, corresponding DCP index tests were performed and are discussed in the following.
Unconfined Compressive Strength/DCP Index Comparison The completed rubbertired rolling section was approximately 4 feet deep. Within the test section, fill materials, compaction effort, and lift thickness were uniform. Because normal quality-control testing (nuclear gauge, sand cone, etc.) generally miss the density gradient caused by placement in overly thick lifts (30), three-foot long Shelby tube sampling operations and full depth DCP index tests were performed. Shelby tubes were hydraulically pushed with the drill rig to obtain relatively undisturbed samples and transported to the laboratory where unconfined compressive strength (ASTM D 2166) tests were performed. DCP index tests, which were performed in-place adjacent to the Shelby tube sampling locations, were matched appropriately with corresponding Shelby tube depths and strength results. Individual test results of moisture, density, strength, soil index properties, and DCP index are provided in Table 10. Unconfined compressive strength varied from 18.7 psi (2690 psf) to 33.9 psi (4880 psf) with DCP index values of 100 and 46 mm/blow, respectively. In comparison to moisture and density versus DCP index relationships, Figure 36 depicts a strong relationship between unconfined compressive strength and DCP index. Results of the DCP index showed that rubber-tired rolling was an effective means of compacting highly plastic clays in large 12 to 16 inch lifts and for sufficiently breaking down and remolding large clods. In comparison to many of the DCP index results from sheepsfoot roller sections, the rubber-tired rolling experiment resulted in no "Oreo cookie" effects. Several DCP index tests showed that most of the fill material was uniform and had CBR of 6 or greater as shown in Figure 37.
49
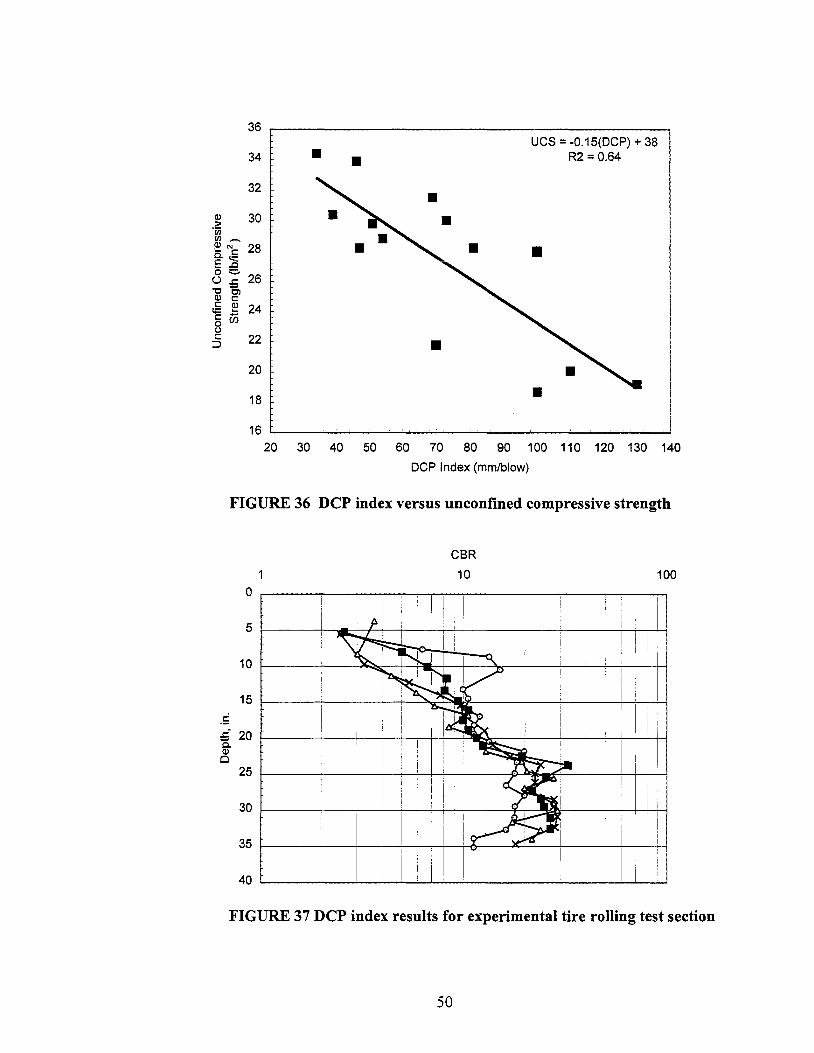
34
32
20
18
• • UCS = -0.15(DCP) + 38
R2 = 0.64
20 30 40 50 60 70 80 90 100 110 120 130 140
DCP Index (mm/blow)
FIGURE 36 DCP index versus unconfined compressive strength
0
5
10
15
. 5
.:.- 20 Q. <1> Cl
25
30
35
40
1
CBR
10
I I
!
100
i •
I ,
FIGURE 37 DCP index results for experimental tire rolling test section
50

Aeration/Cutting by Disking One of the largest oversights observed during embankment construction has been the lack
of compliance with the Iowa DOT specification for disking. This oversight results from the field personnel not enforcing the specification and/or the earthwork contractor lacking the effort. In fact, this particular specification has been one of extreme debate in the field between field inspectors and contractors. On other projects neither the contractor nor the field inspector believed the benefits from disking were significant enough to enforce. The Iowa DOT specification 2107 .04 states:
If the material, as deposited, contains an average of more than one lump per square meter large enough to have at least one dimension greater than 0.3 m, the area shall be covered by at least one pass of a tandem axle disk or two passages of a single axle disk. The disk shall be designed and operated to cut and stir to the full depth of the layer.
In short, if the material has clods larger than about 1 foot, a disk should be on the project and used in the compaction process. All too evident in this specification is the fact that most cohesive soil will have clods larger that the maximum limit. Therefore, it seems disking would be a common sight on any embankment project, which currently it is not.
At the referenced U.S. Highway 61 project an experimental test section was laid out over a 100 foot by 150-foot area to investigate the effects of disking. Not only was disking evaluated as a means of reducing clod size, but it was also used as a method of aerating the soil to reduce moisture content. For the referenced test section, very wet, highly plastic clay was used as fill material. The fill material used in this test section came from a cut located in a soil profile containing a high amount of clay. The liquid limit was 61, the plasticity index was 40 and 99% passed through the No. 200 sieve. Also, perched water in the clayey soil resulted in high moisture contents from +6.3 to +7.3% above optimum moisture content. As it turned out, this highly plastic, cohesive, wet soil was a perfect candidate for aeration by disking.
Fill material was excavated and placed with CAT 627 scrapers and compacted with a 48-inch pull behind sheepsfoot roller. Lifts were controlled near 8 inches compacted and each lift had 8 roller passes with a sheepsfoot. Once a few lifts had been placed and compacted, density, moisture, and DCP index tests were performed. Density tests were completed using the Army Corps of Engineering Surface Soil Sampler. Lifts were then scarified with 2 passes of a tandem axle disk and aerated for 3 hours. During this procedure the temperature was approximately 90° to 95°F and sunny with a slight breeze. Based on the extreme weather conditions, the contractor estimated that the moisture content would decrease at about 1 percent/hour. After aerating the soil by disking and recompacting, the moisture content dropped from between -1.2 to + 3 .4, which indicated an average 1. 7 percent/hour loss in moisture content. Corresponding results for density and DCP index testing before and after disking and aeration are shown in Table 11.
51
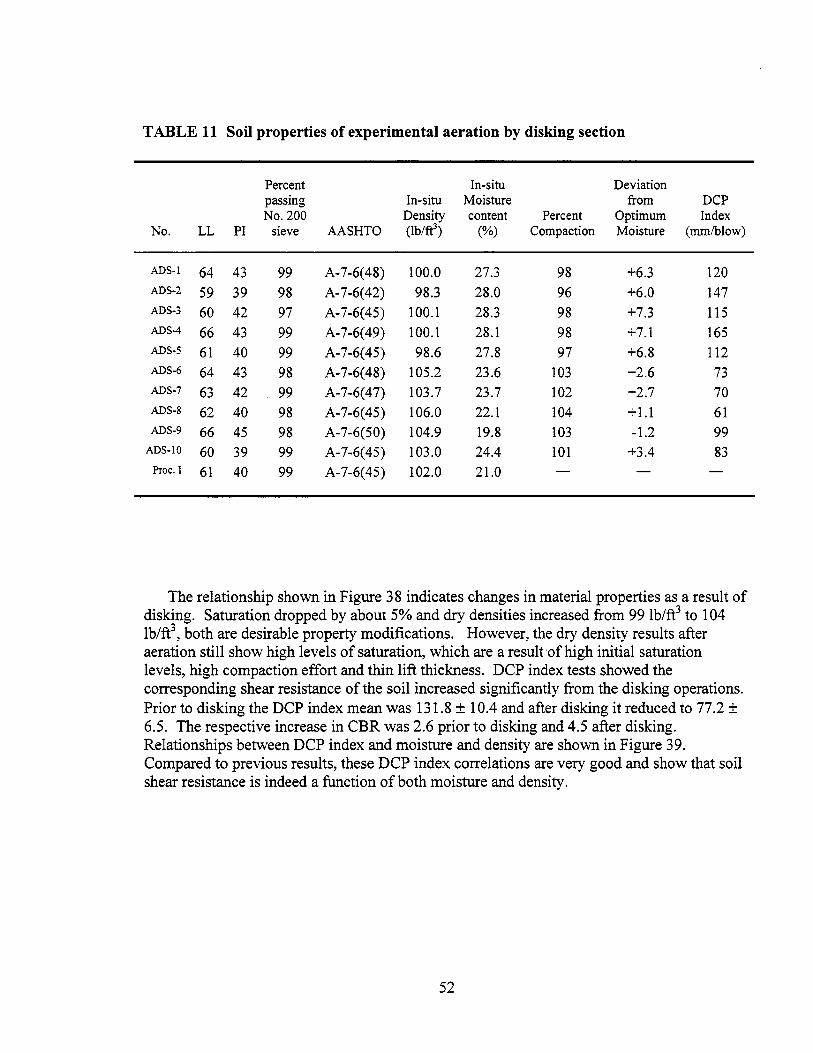
TABLE 11 Soil properties of experimental aeration by disking section
Percent In-situ Deviation passing In-situ Moisture from DCP No. 200 Density content Percent Optimum Index
No. LL PI sieve AASHTO (lb/ft3) (%) Compaction Moisture (mm/blow)
ADS-I 64 43 99 A-7-6(48) 100.0 27.3 98 +6.3 120 ADS-2 59 39 98 A-7-6(42) 98.3 28.0 96 +6.0 147 ADS-3 60 42 97 A-7-6(45) 100.1 28.3 98 +7.3 115 ADS-4 66 43 99 A-7-6(49) 100.1 28.1 98 +7.1 165 ADS-5 61 40 99 A-7-6(45) 98.6 27.8 97 +6.8 112 ADS-6 64 43 98 A-7-6(48) 105.2 23.6 103 +2.6 73 ADS-7 63 42 99 A-7-6(47) 103.7 23.7 102 +2.7 70 ADS-8 62 40 98 A-7-6(45) 106.0 22.l 104 +1.1 61 ADS-9 66 45 98 A-7-6(50) 104.9 19.8 103 -1.2 99
ADS-10 60 39 99 A-7-6(45) 103.0 24.4 101 +3.4 83 Proc. I 61 40 99 A-7-6(45) 102.0 21.0
The relationship shown in Figure 38 indicates changes in material properties as a result of disking. Saturation dropped by about 5% and dry densities increased from 99 lb/ft3 to 104 lb/ft3, both are desirable property modifications. However, the dry density results after aeration still show high levels of saturation, which are a result of high initial saturation levels, high compaction effort and thin lift thickness. DCP index tests showed the corresponding shear resistance of the soil increased significantly from the disking operations. Prior to disking the DCP index mean was 131.8 ± 10.4 and after disking it reduced to 77.2 ± 6.5. The respective increase in CBR was 2.6 prior to disking and 4.5 after disking. Relationships between DCP index and moisture and density are shown in Figure 39. Compared to previous results, these DCP index correlations are very good and show that soil shear resistance is indeed a function of both moisture and density.
52

115
110
105 'ti Q.
,..:
::<: 100 Cl
~ ·c: ::> 95
90
85 0 5
me o o ,
saturation ___.,, \ " ,
80% saturation ~ ", , . ' ' 90% saturation'.~ '.. . '
10 15
~Line of 100% saturation (zero air voids)for specific gravity, Gs= 2.733
0.60
0.65
0.70 Void Ratio, e
0.75
' '
',
' ,, '
'\
' 20 25 30
Moisture Content, w, percent dry weight
35
FIGURE 38 Field density tests for aeration by disking experimental section
Based on this experimental section, it can be seen that enforcing disking can significantly increase desirable fill material properties such as density and strength. However, this was previously known and included in the Iowa DOT specifications. This experiment merely reemphasizes its importance in earthwork and quality control. Under the current Iowa DOT embankment specifications the enforcement of disking may improve quality more than any other action. Furthermore, a renewed emphasis should be placed on educating on the necessity for disking in the minds of earthwork contractors and Iowa DOT field personnel. It should be clearly noted that disking is important for two reasons: (1) reduction of moisture content and (2) reduction of clod size. Once again, for the referenced aeration by disking experiment section, disking was shown to decrease moisture content and increase strength (as measured by DCP).
53

.... 0 0 0 ........... a. >. -.... ·-o en c:
- Q) ai "O
~ ~ Q) "O
e:_ E c: ::J o E
:;::; ·-0 x ro ro a. E E 0
(.)
c: 0
:;:::;
105
104
103
102
101
100
99
98
97
96
95
9
8
7
6 .~> E Q) ::J
e_ E 5 ~a
~ 0 4 - .... ai .8 3 "E g 0 .... 0 a. ~ E 2 e en..,_ ·o ~
2
1
0
-1
-2
j tJ. Post aeration by disking j '
i o In-situ moisture I
R2 = 0.67 -
--------------~ 0 I
0
0 25 50 75 100 125 150 175 200 225
DCP Index, mm/blow
o In-situ moisture .
t; Post aeration by disking [
R2 = 0.48
0 25 50 75 100 125 150 175 200 225
DCP Index, mm/blow
FIGURE 39 DCP index versus compaction and moisture content for wet soil
54
Site and Subsurface Conditions - U.S. Highway 34, Henry County The U.S. Highway 34 project in Henry County was located parallel to the existing two
lane highway and bypasses New London to the south. Prior to construction the land surrounding the site was used for agricultural purposes. The area within the project site used for field-testing and research contained no structures. The focus of field-testing was located in a large swale, which contained a newly constructed concrete box culvert. During construction the swale was filled with compacted glacial till from adjacent hill slopes. Grades throughout the field-testing section sloped from the east at approximately 16% and from west at 18% towards the center of the swale. Subsurface conditions encountered at the site consisted primarily of glacial till. In Henry County the major Pleistocene deposits are Nebraska and Kansas drift with some Illinoian drift to the southeast (32). According to the soil design and borrow sheets drafted by the Iowa DOT prior to construction, soil borings were completed every 200 to 300 feet along the length of the proposed research section. Based on this information, borings encountered only a few inches of silty clay loam topsoil underlain by several feet of firm to very firm glacial till. Dark gray/brown A-7-6 silty clay and light olive brown A-7-6 clay loam were the predominate soils identified in the borings to 30 feet below grade. Once again, it can be stated that the primary geotechnical concerns for this project was the presence of the shrink/swell clay soils being placed near design subgrade elevation and the potential for pavement damage from frost action. In retrospect fill material which contained high amounts of organic content was an additional geotechnical concern.
Field Density Tests - U.S. Highway 34, Henry County Between July 7 and 22, 1998 observations and field density tests were performed on
structural fill material placed for U.S. Highway 34 located in Henry County, Iowa. Field density tests and construction observations were performed from approximately 12 to 15 feet below design subgrade elevation. As shown in Table 12, AASHTO classification for the majority of the structural fill was A-7-6, and CL and CH under the USCS. During fill placement, much of the fill material was observed to be wet of optimum moisture content. The earthwork contractor did not attempt to aerate this material before compaction. Furthermore, at the time of fill placement a disk was not observed on the project. Soil was excavated and placed with a CAT D9L pulling hydraulic CAT 483F scrapers as shown in Figure 40. Compaction was achieved with the pull-behind sheepsfoot roller and by trackingin the soil with the referenced CAT D9L. Also, shown in Figure 40 is the presence of high amounts of organic material in the fill. Organic matter is considered deleterious for fill material, since it contributes a spongy, unstable structure and is chemically reactive (16). Lastly, Figure 40 shows a large slab of soil in the scraper indicating low workability and potentially highly cohesive soils.
55
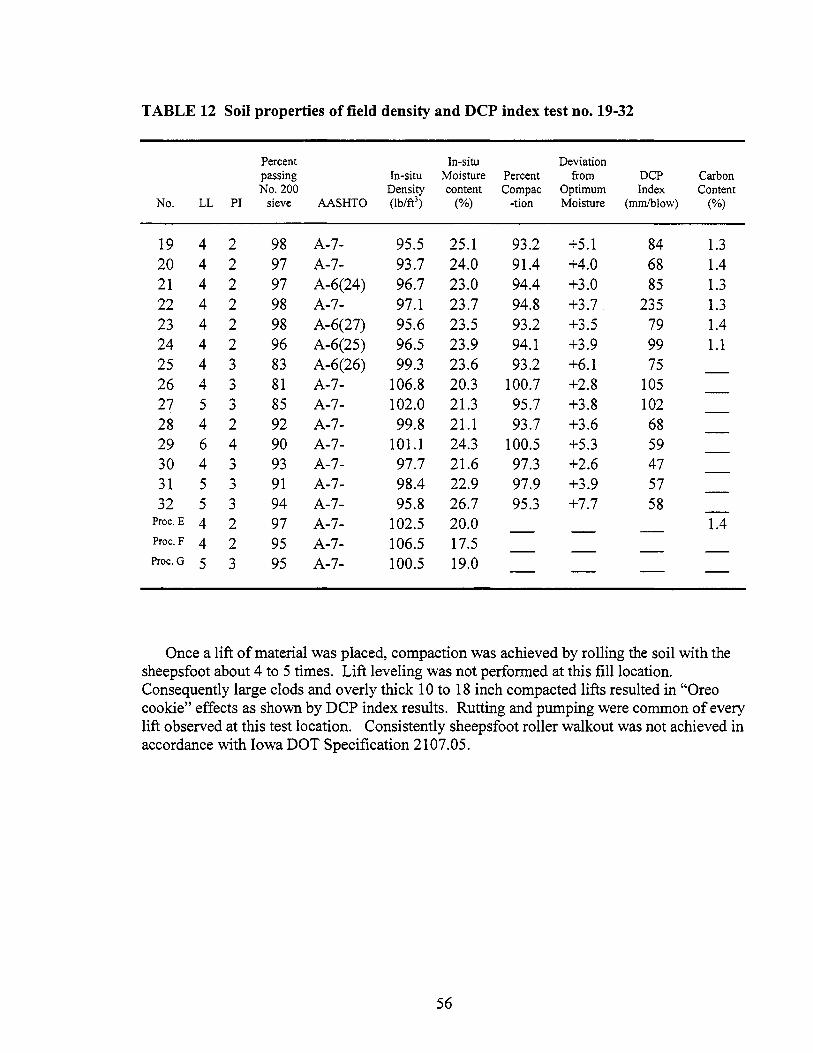
TABLE 12 Soil properties of field density and DCP index test no. 19-32
Percent In-situ Deviation passing In-situ Moisture Percent from DCP Carbon No. 200 Density content Compac Optimum Index Content
No. LL PI sieve AASHTO (lb/ft3) (%) -tion Moisture (mm/blow) (%)
19 4 2 98 A-7- 95.5 25.1 93.2 +5.1 84 1.3 20 4 2 97 A-7- 93.7 24.0 91.4 +4.0 68 1.4 21 4 2 97 A-6(24) 96.7 23.0 94.4 +3.0 85 1.3 22 4 2 98 A-7- 97.l 23.7 94.8 +3.7 235 1.3 23 4 2 98 A-6(27) 95.6 23.5 93.2 +3.5 79 1.4 24 4 2 96 A-6(25) 96.5 23.9 94.l +3.9 99 1.1 25 4 3 83 A-6(26) 99.3 23.6 93.2 +6.1 75 26 4 3 81 A-7- 106.8 20.3 100.7 +2.8 105 27 5 3 85 A-7- 102.0 21.3 95.7 +3.8 102 28 4 2 92 A-7- 99.8 21.1 93.7 +3.6 68 29 6 4 90 A-7- 101.1 24.3 100.5 +5.3 59 30 4 3 93 A-7- 97.7 21.6 97.3 +2.6 47 31 5 3 91 A-7- 98.4 22.9 97.9 +3.9 57 32 5 3 94 A-7- 95.8 26.7 95.3 +7.7 58
Proc. E 4 2 97 A-7- 102.5 20.0 1.4 Proc. F 4 2 95 A-7- 106.5 17.5 Proc. G 5 3 95 A-7- 100.5 19.0
Once a lift of material was placed, compaction was achieved by rolling the soil with the sheepsfoot about 4 to 5 times. Lift leveling was not performed at this fill location. Consequently large clods and overly thick 10 to 18 inch compacted lifts resulted in "Oreo cookie" effects as shown by DCP index results. Rutting and pumping were common of every lift observed at this test location. Consistently sheepsfoot roller walkout was not achieved in accordance with Iowa DOT Specification 2107.05.
56
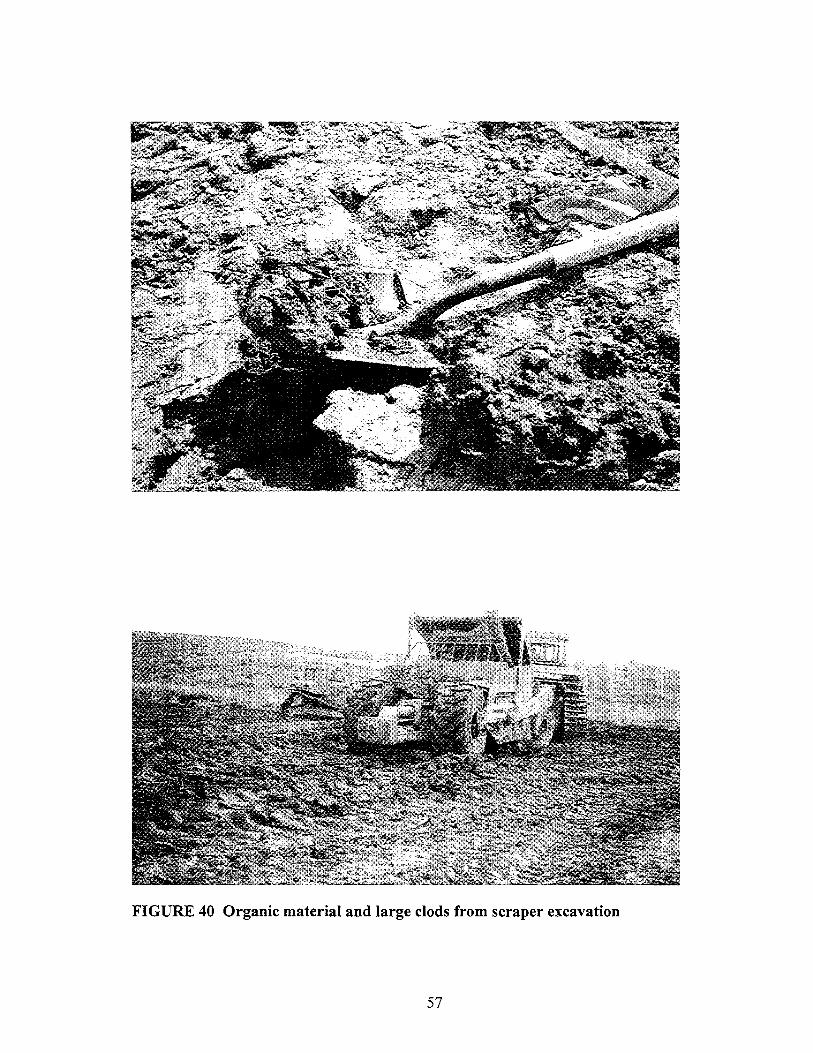
FIGURE 40 Organic material and large clods from scraper excavation
57

Compaction as measured with a nuclear density gauge varied from 91.4 to 100.7% with a mean of95.4 ± 0.7%. Similar to previous results, moisture contents were highly variable and ranged from +2.6 to +7.7% of optimum moisture content with a mean of +4.2 ± 0.4%. With respect to the standard Proctor moisture-density relationships and zero air-void curve, field density tests are plotted for Proctor samples E, F, and Gas shown on Figures 41through43, respectively. As shown moisture and density is variable and several data points approach the zero air-voids curve. Density results for Proctor E were grouped tightly with saturation levels between 80 and 90%. However, these tests showed that the moisture content was above optimum by approximately 4%. From personal experience with nuclear density gages, it is believed that the measured 1.4% carbon content could have reduced these dry unit weight readings enough to produce an erroneous level of saturation. Therefore, these samples may in fact have saturation levels above 95% similar to Proctor samples F and G. Once again, near the zero air-voids curve high pore pressure is generated and as subsequent lifts are placed and compacted pore pressures will continue to increase, which resulted in the observed instability and rutting under construction traffic.
u 0.
>-= :i .Qi
~ ·c: ::::>
115
110
105
100
95
90
85 0
Line of 70% saturation '.:.._,;,,'. '.
80% saturation '. ~ \ 90% saturation'-. ~ .
5 10 15
~Line of 100% saturation (zero air voids)for specific gravity, Gs= 2.66
•,
. . \
20 25
Void Ratio, e 0.65
' '
0.70
'
'
0.75
0.80
. ~
30
Moisture Content, w, percent dry weight
35
FIGURE 41 Field density test results- U.S. Highway 34 Henry County, IA
58
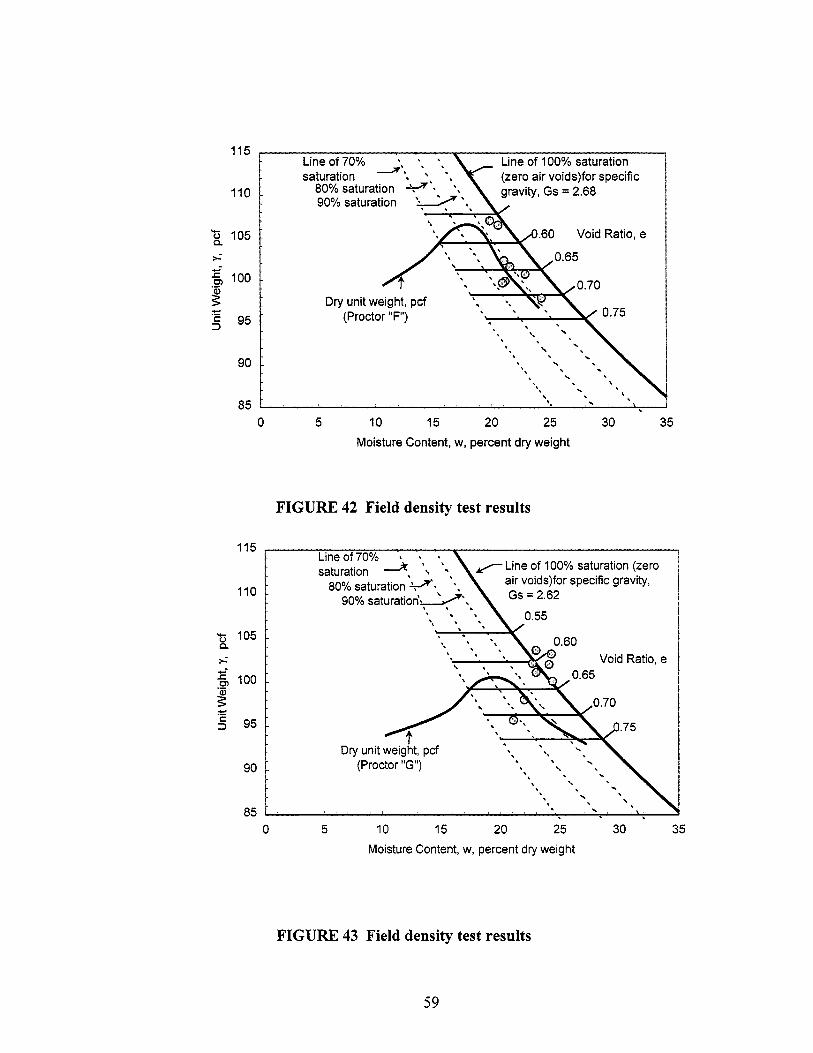
115
110
't5 105 c. ;..;
:E 100 Cl
~ :!: c: 95 :::>
90
85
0
FIGURE 42 Field density test results
Line of 70% , saturation -A, ' •
80% saturation 0', , 90% saturation\ .... ~?', . '
\
'
t Dry unit weight, pcf
(Proctor "G")
5 10 15
~Line of 100% saturation (zero air voids)for specific gravity, Gs= 2.62
20
0.55
' '
'
25
Void Ratio, e 0.65
'
30
Moisture Content, w, percent dry weight
FIGURE 43 Field density test results
59
35

Plasticity vs. Saturation Similar to previous results shown in Figure 30, the plasticity index and corresponding level of saturation for in-place density tests are shown in Figure 44. Again a relatively strong relationship (R2 = 0.74) exists between in-place saturation of compacted soils and plasticity index. Figures 28 through 30 depict the saturation levels of the field density tests for Proctor samples E, F, and G. Percent saturation of the fill material increased from approximately 80 - 90% for Proctor sample E (PI=22), to 85 - 95% for material F (PI=25), and ~100% for material G (PI=30). Surprisingly, for plasticity indices of 33 and 39, saturation is respectfully 95% and 100%, which is similar to data collected at U.S. Highway 61 in Lee County. In summary, highly plastic materials are more likely to have high levels of saturation after compaction and subsequent low shear strengths by comparison with lower plasticity clays. Field moisture control for high plasticity clays is a very effective means of controlling high levels of saturation and deleterious soil properties.
50
45 •
40
x Q)
35 'O c: >. -'(3
:;::::; 30 (/) • ~ • a: 25 • • •
• • 20
R2 = 0.74 15
80 85 90 95 100 105
Saturation, %
FIGURE 44 Relationship between plasticity index and in-place percent saturation
60
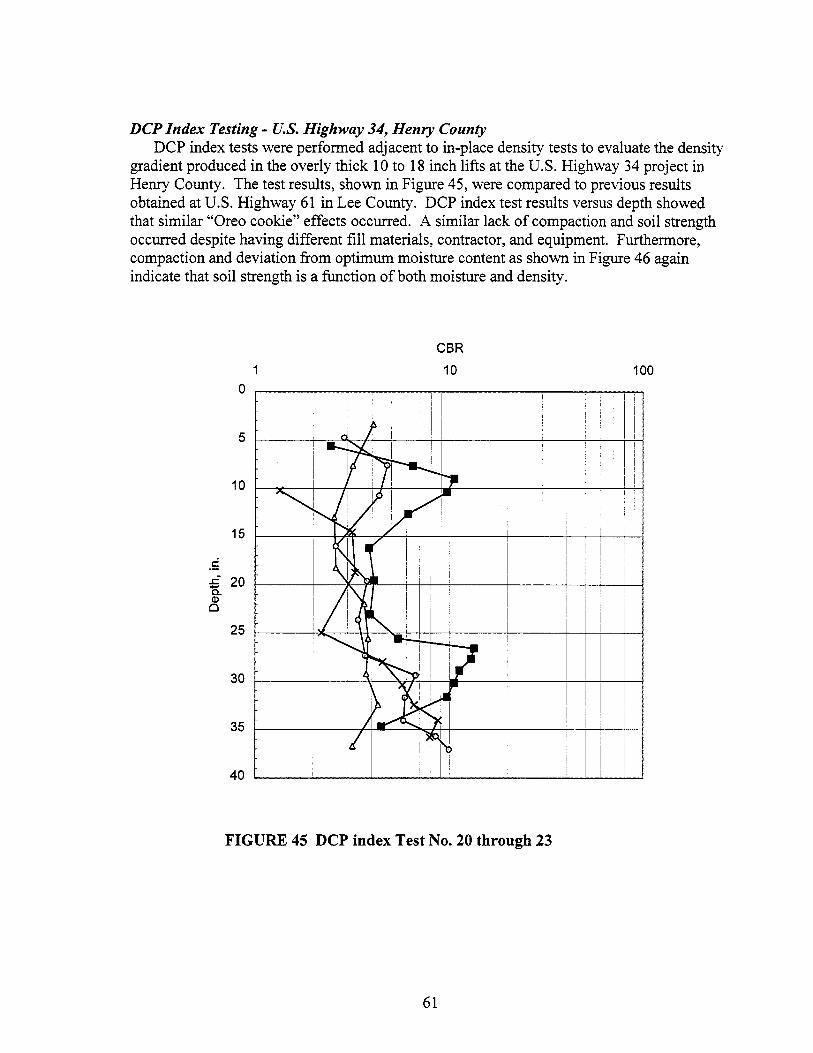
DCP Index Testing - U.S. Highway 34, Henry County DCP index tests were performed adjacent to in-place density tests to evaluate the density
gradient produced in the overly thick 10 to 18 inch lifts at the U.S. Highway 34 project in Henry County. The test results, shown in Figure 45, were compared to previous results obtained at U.S. Highway 61 in Lee County. DCP index test results versus depth showed that similar "Oreo cookie" effects occurred. A similar lack of compaction and soil strength occurred despite having different fill materials, contractor, and equipment. Furthermore, compaction and deviation from optimum moisture content as shown in Figure 46 again indicate that soil strength is a function of both moisture and density.
CBR
10 100 0
5
10
15
.!:
.s= 20 -a. (!)
Cl
25
30
35
40
FIGURE 45 DCP index Test No. 20 through 23
61

102
,_ 0 100 -0 0 ,_ -
11.. .?;--·- 98 0 (/) c - Q) as "O 2~ 96 Q) "O e:_ E c =' g .§ 94 0 >< ro ro a. E E
92 0 0
90
,_ 9 -§ E 8
Cl..
E 7 0 ,_ ..,_ c: 6 0
~-> E 5 a> ::J
9. E ~:a
- 0
4 ..... c: 3 ~ c: 0 2 tJ
~ ::J 1 ..... en ·o ~ 0
•
• •
• • ... •
•
• •
R2 = 0.01
0 20 40 60 80 100 120 140 160 180 200 220 240
DCP Index, mm/blow
0
0
0 0
0 0 co 0 0 0
0 0 0
R2 = 0.04
0 20 40 60 80 100 120 140 160 180 200 220 240
DCP Index, mm/blow
FIGURE 46 DCP index versus compaction and moisture content
62
Subsurface Explorations The subsurface exploration consisted of 4 borings extending to depths of 15 to 18 feet
below grade into the foundation of the proposed embankment at U.S. Highway 61 in Lee County, Iowa. The primary objectives of this investigation were to determine the subsurface conditions after embankment fill placement and to analyze these conditions as they relate to embankment quality. Possible causes of future distressed pavement conditions have been made. At boring location B-1, SPT, CPT, and thin-walled sampling operations were performed. At additional boring locations, B-2 through B-4, CPT tests were carried out. Comparison of bore data showed that soil misplacement a.11d variability of shear strengt.li were the most significant embankment quality defects.
Shelby Tube Sampling and SPT Testing Relatively undisturbed samples of cohesive soils to 16 feet below grade were recovered at boring location B-1, by hydraulically pushing 3-inch 0.D. thin-walled steel sampling tubes into the soil. The boring was stopped once the existing foundation soils were reached. Recovered samples were sealed in the sampling tubes in the field and transported to the laboratory for further classification and investigation. All soil samples were tested to determine in-place moisture content. Information pertaining to liquid and plastic limit, group index, and percent passing the No. 200 sieve was obtained on selected samples to aid in classification and in evaluation of engineering properties. The results of the soil index properties and in-place moisture contents are shown in Figure 47. As indicated moisture contents varied from about 13 to 25%, liquid limit from 33 to 73%, and plasticity index from 19 to 50%. Also, based on the new formula (AASHTO M-145-91), group index values with depth are shown, which indicates soil suitability. Group index values ranged from 8 to 55. The soil index properties revealed that a relatively broad range of fill materials exist within this embankment, ranging from select to unsuitable. Under the current specifications soils with group indices over 30 are considered unsuitable whereas soils under 30 are either suitable or select. At boring location B-1 it is apparent that the earthwork contractor has layered the suitable and unsuitable soils as the embankment was constructed. For example, at 41, 60, and 80 inches below grade suitable glacial fill was placed, but at 13, 45, and 85 inches below grade unsuitable high shrink/swell clays were encountered. Previously, it was stated that the contractor alternated wet and dry soil layers, which typically coincides with unsuitable clayey and suitable leaner soils, respectively. Therefore, moisture content may have been the underlying reason for soil layering, not soil suitability. The Iowa DOT specification 2102.06 (A-3) does not require layering of suitable and unsuitable materials unless the following soil conditions exist: (1) shale material, or (2) A-7-5 or A-5 soils having a T-99 Proctor density greater than 86 pcf but less than 95 pcf.
Consequently, all of the soils shown in the B-1 profile with group index values below 30 should be placed near the top of the embankment instead of the potentially high shrink/swell soils encountered. Unfortunately, high shrink/swell clay with a plasticity index of 41 has been placed within the subgrade section of the embankment, which may cause pavement roughness in the future.
63

Ill Q)
..c: (..')
.E:
..c: -c.. Q)
0
0
20
40
60
80
100
120
140
160
180
200
0
Group Index < 30 Group Index > 30 (suitable) (unsuitable)
_____.._ Liquid Limit -+--Plasticity Index -o-Group Index -x- lnsitu Moisture
10 20 30 40 50 60
Moisture content(%) and Group Index
70 80
FIGURE47 Group index, liquid limit, and plasticity index and in-situ moisture content showing suitable soils from 15 to 40 and 60 to 80 inches below grade
To further evaluate the completed embankment at boring location B-1, SPT tests were performed. Blow counts were recorded for each 6 inch depth interval, and the total number of blows required to advance the sampler the final 12 inches was designated the Standard Penetration Resistance or N 45 value. The N45 values are shown in Table 13 with the corresponding visual soil descriptions. Blow counts were converted to equivalent N6o values and are shown on Figure 48. Soil consistency was stiff from 0-6 feet and medium from 6-15 feet.
64
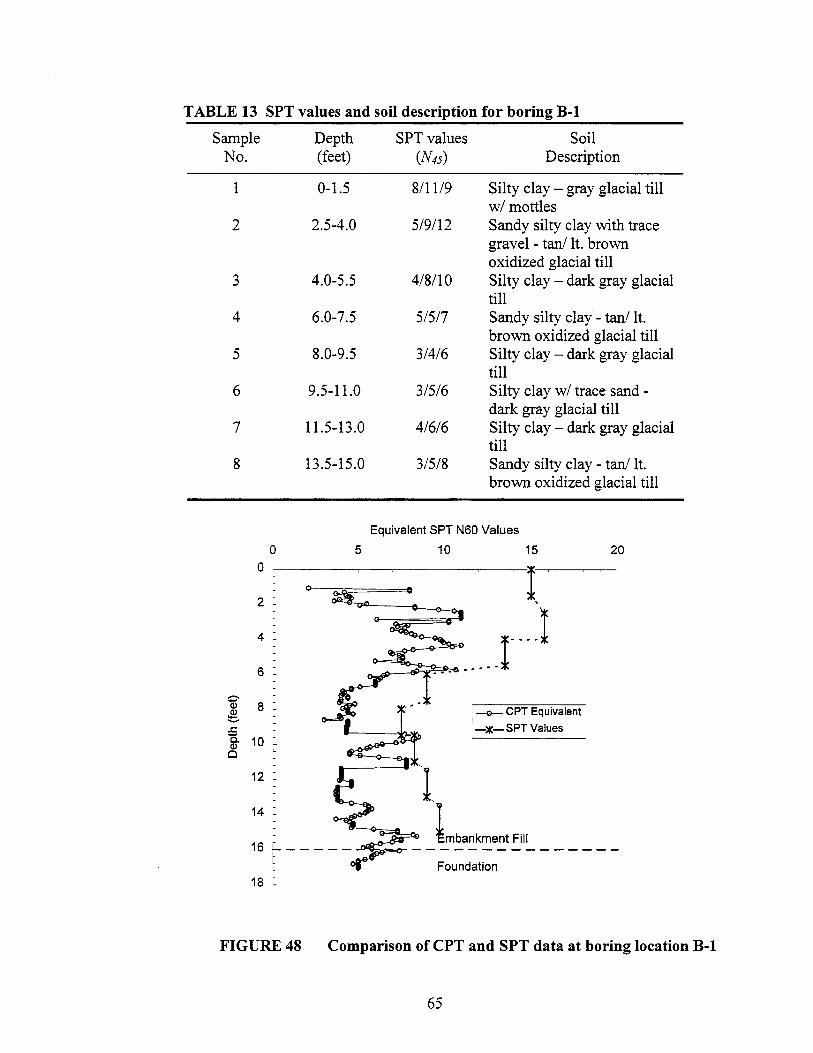
TABLE 13 SPT values and soil description for boring B-1
Sample Depth SPT values Soil No. (feet) (N45) Description
1 0-1.5 8/11/9 Silty clay - gray glacial till w/ mottles
2 2.5-4.0 5/9/12 Sandy silty clay with trace gravel - tan/ lt. brown oxidized glacial till
3 4.0-5.5 4/8/10 Silty clay - dark gray glacial till
4 6.0-7.5 51517 Sandy silty clay - tan/ lt. brown oxidized glacial till
5 8.0-9.5 31416 Silty clay - dark gray glacial till
6 9.5-11.0 31516 Silty clay w/ trace sand -dark gray glacial till
7 11.5-13.0 41616 Silty clay - dark gray glacial till
8 13.5-15.0 3/5/8 Sandy silty clay - tan/ lt. brown oxidized glacial till
Equivalent SPT N60 Values
0 5 10 15 20
0
l 2
___ rJ 4
6
~ 8 ~ i -o- CPT Equivalent ' ........
i -:ii:- SPT Values .r:; 15. 10 Q)
Cl '
:: [ l lmbankment Fill L
16 L _____ ---------------t Foundation 18 -
FIGURE 48 Comparison of CPT and SPT data at boring location B-1
65

Cone Penetration Testing CPT tests are simple tests used to measure a variety of in-situ soil properties that provide continuous measurement. The CPT Piezocone was a favorable tool to use during the embankment investigation because tests were performed in-situ immediately after embankment construction, and the results could be compared with data collected during construction. Data recorded during the investigation included local cone frictional resistance qs, penetration tip resistance qc, pore pressure, and depth. The geotechnical parameters, which were found useful for the engineering embankment evaluation, were equivalent SPT and shear strength. SPT equivalent for boring B-1 is shown in Figure 48 along with actual SPT data. Results indicate that the upper 6 feet was stiffer than the underlying 11 feet. One possible reason for increased stiffness in the upper portion of the embankment may be a result of increased vertical stress from equipment traffic once the embankment was completed.
In addition to an equivalent SPT correlation, continuous shear strength with depth was generated from the CPT measurements. Perhaps shear strength, which is a critical measurement of potential slope failure and stability, was the most valuable information collected.
As is known, a high strength uniform embankment is a desired result. However, Figure 49 depicts highly variable shear strength with depth at the referenced boring location B-1. Based on moisture and density tests performed during construction and placement of overly thick lifts, this finding was expected. Furthermore, areas that show low shear resistance may be attributed to "Oreo cookie" effects previously measured by the DCP index testing. In summary, the CPT shear strength measurements showed that the combined overly thick lifts observed during construction and wet highly saturated soil produce extremely variable shear strength.
66

Qi ~ .=
0 0
8 -
5
+ ++
++
+
Shear Strength (psi)
10 15
+ ++ + + +
+
+
+ + :+ +
$-+
20 25
* +
++ ++
15.. ~ 10 ·~
+ ++ + +
+ + + ++'"+
L
~ + + +
12 t * ;[ + +;+
14 - ++ +-fl'
f + +++* + * t ; l *Embankment Fill
16L---------------~~----~-----------1 ++ + - + i + * Foundation
+
18 -
FIGURE 49 CPT shear strength measurement versus depth
67
SUMMARY OF PHASE II RESULTS
Granular Soils
The following are the general conclusions as to the construction of highway embankments with cohesionless/granular materials:
1. The current Iowa Department of Transportation specification for highway embankment l"nndr11l"tinn .::ic it nPrt.::iinc tn l"nhPcinnlPcc ni.::itPri.::ilc ic ini:irlPmll'ltP "1'V.l..l.IJ"A "4"""""''-'.1..1. ..... ~ """ ,t-'""".&. "_ ... .a..a...., """' --.a..1....,...,.&.'-'.l..&..L_...,..., ...... ..,_.,_.a..a._.a...., ..,....,. ...,..,.., ___ ~ --"-•
2. Current practice does not recognize the difference in behavior among cohesionless materials and between cohesionless materials and cohesive materials.
3. The standard Proctor test is an inadequate test for cohesionless materials. The bulking characteristics and maximum dry density should be determined by the Iowa Modified Relative Density test. Furthermore, maximum moisture content must be identified saturation.
4. Vibratory compaction is required for adequate compaction of cohesionless materials.
5. Confinement is required for adequate compaction of cohesionless materials.
6. Compacted lift thickness of up to twelve inches may be acceptable for clean cohesionless materials.
7. Increasing passes of a roller does not necessarily increase density and may in fact decrease density.
8. Moisture control is essential for cohesionless materials with an appreciable amount (>15%) of fines (passing the No. 200 sieve).
9. The DCP is an adequate in-situ testing tool for cohesionless materials in order to estimate field in-place density.
Fine and Coarse-Grained Soils with Plasticity
The major conclusions derived from this research pertaining to cohesive soils are as follows:
1. The current Iowa DOT specification for sheepsfoot roller walkout is not, for all soils, a reliable indicator of degree of compaction, adequate stability, or compaction moisture content.
2. During fill placement, much of the fill material is typically very wet and compacted at high levels of saturation, which causes instability. Moreover, highly plastic materials are more likely to have high levels of saturation after compaction and consequently low shear
68

strengths by comparison with lower plasticity clays. Field moisture control for highly plastic clays is an effective means of controlling deleterious soil properties.
3. Earthwork construction processes including lift thickness and roller passes were not consistent at several embankment projects. Compacted lift thickness was measured to vary from 7 to 22 inches and roller passes averaged about 4 to 5 passes.
4. Reduction of clod size and aeration of wet soils by disking, which is currently a part of the Iowa DOT specifications, is rarely enforced in the field. Thus, a renewed emphasis should be placed on educating the necessity for disking in the minds of earthwork contractors and Iowa DOT field personnel.
5. The dynamic cone penetrometer (DCP) was found be a valuable field tool for quality control. From penetrations up to 39 inches, plots of soil strength and lift thickness were generated. Furthermore, by testing for soil stability, shortcomings from density tests (density gradients) are avoided. It is evident from the field data that stability and shear resistance as measured by the DCP is increased by compaction and reduced by high moisture contents. Therefore, determination of embankment quality was very achievable regardless of density or moisture correlations.
6. Through experiments involving different rolling patterns and equipment it was found that a rubber-tired loaded scraper (90 psi tire pressure) can effectively compact loose lifts of heavy fat clay up to 14 inches. With the correct tire pressure and because of the large contact area, rubber-tired rollers are effective at achieving high surface density, achieving density in underlying layers, and locating weak spots below the surface. However, in spite of the fact that the rubber-tired rolling results appear favorable, the method will have to be assessed for efficiency in the future.
7. Based only on appearance and feel, predicting the physical performance and judging the suitability of cohesive soils for embankment construction is difficult. The proposed Iowa SDC chart better takes into account complex engineering properties such as swell potential, frost susceptibility, and group index weighting. Also, the SDC will better facilitate design and field identification of soil because it only requires testing of Atterberg Limits and percent passing the No. 200 sieve.
8. By considering changes in soil properties from moisture content and determining desired soil properties and constructability, the proposed Iowa Moisture Construction Chart (MCC) was developed. Objectives of the MCC chart are to increase soil uniformity and overall embankment performance for cohesive soils through specifying soil specific minimum and maximum moisture contents. Acceptable moisture content ranges are based on soil classification per the SDC chart.
9. CPT shear strength measurements showed that the combined overly thick lifts observed during construction and wet highly saturated soil resulted in extremely variable embankment shear strength with depth. Differential settlement would be anticipated based on these results.
69
PROPOSED DESIGN AND CONSTRUCTION SPECIFICATIONS
Based on the results and analysis conducted during Phase I and Phase II of this research program, newly developed soil design and construction methods and testing specifications are proposed. These proposed methods include field soil classification, moisture control, lift thickness changes, and DCP index acceptances procedures. Because construction with soils is one of the most complicated procedures in engineering, the construction methods and testing specifications were developed to be both efficient and practical to meet the needs of the Iowa DOT and earthwork contractors.
Soil Performance Classification for Design and Construction
Iowa's land surface consists primarily of Pleistocene loess deposits (40%), glacial till (40%), alluvium (20%), and residual soils over bedrock (<l %) (16,34). Soils available for embankment construction in Iowa generally range from A-4 soils, which are very fine sands and silts that are subject to frost action, to A-6 and A-7 soils, which are predominate across the state. Some of the glacial derived A-6 and A-7 groups include relatively high shrink/swell clayey soils. In general these soils rate from poor to fair in suitability as subgrade soils; though, their suitability greatly depends on maintaining a uniform moisture content (16). It is critical that the embankments built with these marginal soils are placed at the proper moisture content and unsuitable expansive and frost prone soils are identified and disposed of properly in the embankment.
Soils for Iowa DOT embankment projects are identified during the exploration phase of the construction process. Borings are taken periodically along the proposed route and at potential borrow pits every 50-150 meters to depths of approximately 6-12 meters depending on proposed fill heights. Under the current Iowa DOT specifications, soil samples obtained from the subsurface investigation are tested to determine Atterberg limits, grain-size distribution from hydrometer analysis, carbon content, color, and in-situ moisture and density which are compared to One-point Proctor values (Iowa Test Method Number 103-C). From 1996 to 1999 the Iowa DOT has classified over 12,000 soil samples for an estimated 720 km of completed State, U.S., and Interstate highway embankments.
The soil information obtained from the initial site investigation is reported on soil design sheets for use during earthwork construction. However, even with a large number of soil samples it is impossible to completely characterize soil profiles because of variability between boring iocations and more importantiy, soii mixing during construction. Aithough these soil identification methods are extensive, a process that requires field identification throughout construction of the embankment could greatly improve soil identification and placement. This research program has shown that field personnel and earthwork contractors need a more systematic, repeatable, and rapid field method for classifying embankment soils. This proposed method termed the Iowa Soil Design and Construction (SDC) charts are described in the following section.
70
Iowa Soil Design and Construction (SDC) Charts
The following soil design and construction guidelines apply to roadway and borrow excavation soils used in embankment construction. Herein contains soil classification specifications for soil classification and placement. Approval of materials and their use will be based on the following guidelines. Testing procedures required for soil classification include determination of Atterberg Limits, grain size analysis with No. 40 and No. 200 sieves, and determination of carbon content (see current Iowa DOT Test Methods). The following are the criteria by which a soil is classified as select, suitable, or unsuitable by the Iowa Soil Design and Construction (SDC) charts A and B shown in Figures 50 and 51:
1. Determine amount of material finer than the No. 200 sieve (F2oo) (Test Method No. Iowa 108E).
2. If F200 < 36% see Iowa SDC chart A shown in Figure 50. Determine amount of material finer than the No. 40 sieve (Test method No. Iowa 101.5-B). Plot percent passing the No. 40 and 200 sieves on chart. If classified as suitable, then determine the liquid limit and plasticity index (Test Method No. Iowa 109 C).
3. If F200 ;;:::: 36% determine the liquid limit and plasticity index (Test Method No. Iowa 109 C) and plot values on the Iowa SDC chart B shown in Figure 51. Determine soil classification as select, suitable or unsuitable from guidelines shown in Table 14.
Iowa SDC chart A (Granular Soils) The Iowa SDC chart A, as shown in Figure 50, for cohesionless/granular soils was
based on the current Iowa DOT specification, which requires less than 15% silt and clay for a classification of granular-select treatment material. Thus, there should not be a significant
.. change in soil classification between the Iowa SDC chart A and the current Iowa DOT Specification 2102.06. As previously shown in Table 2, 15% silt and clay is a common boundary that several state DOTs use to identify frost susceptible soils. The Iowa SDC chart A will be helpful for classifying samples in the field during construction.
71

35
1 See Iowa SDC chart B if LL >SO or PI> 10
30
Q) >
25 Q) ·u; 0 0
A-2-4 20 N
0 z A:]:Q_ - 15
C)
---------- c: ·c;; en
Suitable1 Cll c.. 10 -Select c:
Q)
A-2-4 e 5
Q) a.
0
50 60 7 80 90 100
Percent passing No. 40 sieve
FIGURE 50 Iowa SDC chart A
Iowa SDC chart B (Fine and Coarse-Grained Plastic Soils) By taking into consideration the engineering properties of fine and coarse-grained plastic
soils and simple property correlations, Iowa SDC chart B was developed to improve overall soil design and to facilitate field identification during construction. The Iowa SDC chart B, as shown in Figure 51, classifies soil based on three simple tests (1) liquid limit, (2) plasticity index, and (3) fines content (percent passing the No. 200 sieve). Research has shown that the classification method is an effective tool to use when soils are being mixed in the borrow excavation or not identified on the soil design sheets. Once a soil sample is obtained from the borrow (or grade during construction), the referenced liquid limit, plasticity index, and fines content tests are performed and recorded. The Iowa SDC chart B is then used to designate the soil as either select treatment material, suitable soil, or unsuitable soil as described in the following:
Plot the liquid limit and plasticity index on Iowa SDC chart B shown in Figure 51.
1. Determine in which designated region the soil plots; for example LL =56 and PI= 37 plots in the high plasticity inorganic clay region.
2. Determine if the fines content (percent passing the No. 200 sieve) is less than or greater than the Fineness Designation Number as shown.
3. Use guidelines shown in Table 14 to classify soil as select treatment material, suitable soil, or unsuitable soil.
72
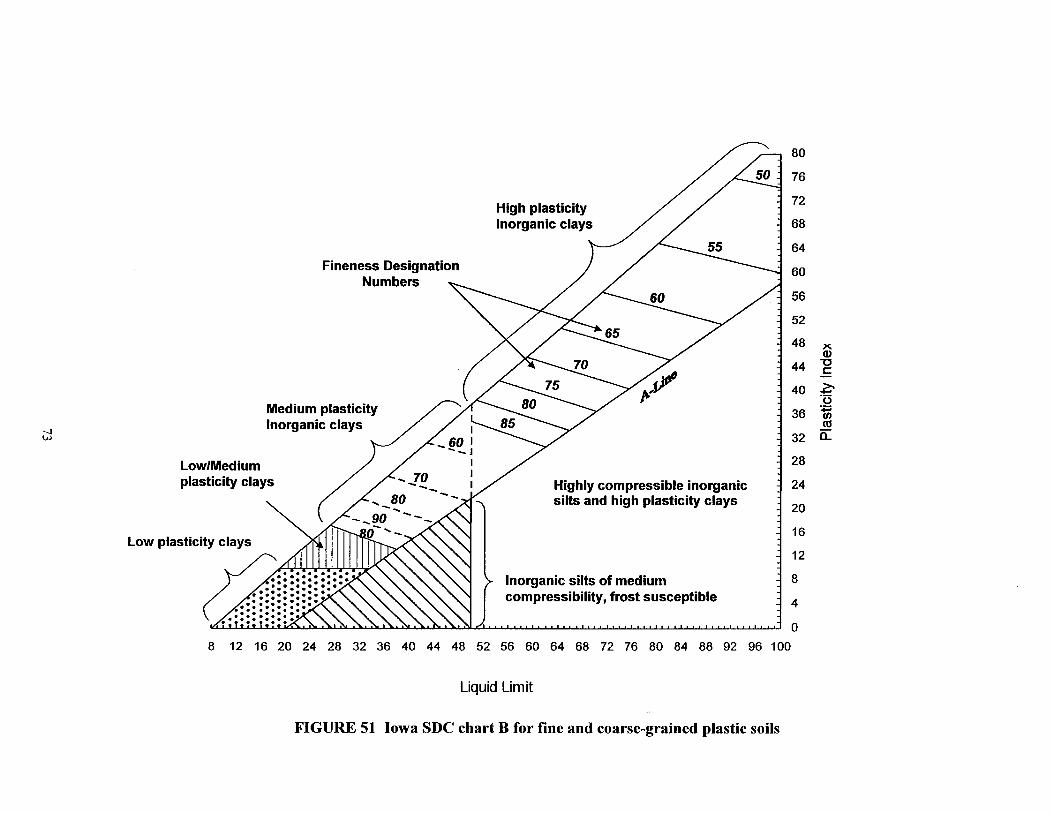
---l w
Fineness Designation Numbers
Medium plasticity Inorganic clays
Low/Medium plasticity clays
Low plasticity clays
High plasticity Inorganic clays
Highly compressible inorganic silts and high plasticity clays
Inorganic silts of medium compressibility, frost susceptible
8 12 16 20 24 28 32 36 40 44 48 52 56 60 64 68 72 76 80 84 88 92 96 100
Liquid Limit
FIGURE 51 Iowa SDC chart B for fine and coarse-grained plastic soils
80
76
72
68
64
60
56
52
48 x Q)
44 "'C c
40 ~ ·5
36 +:i fl) ca
32 a_
28
24
20
16
12
8
4
0

TABLE 14 Iowa Soil Design and Construction (SDC) chart guidelines
Legend
[] . . . . .
lill " " " " " " " " "· ' "·
Designated Soil Regions
Low plasticity clays • Select::;; 45% passing the No. 200 sieve, F 200, and
::;; 70%F-10 • Suitable 46% - 70% F200
• Unsuitable> 70% F 200 (Type C disposal)
Low/Medium plasticity inorganic clays • Select ::;; 60% F200
• Suitable 61 - 70% F200
• Unsuitable ;;:::; 70% F20o (Type C disposal)
Medium plasticity inorganic clays • Select- Plots above A-Line (PI=O. 73(LL-20), and
F200 ::;; fineness designation • Suitable - F 200 > fineness designation
High plasticity inorganic clays • Suitable - Plots above A-Line (PI=0.73(LL-20), and
F20o::;; fineness designation • Unsuitable - F 200 > fineness designation (Type B Disposal)
Inorganic silts of medium compressibility • Unsuitable - Plots below A-Line (PI=0.73(LL-20), • Type B Disposal
Highly compressible inorganic silts and high plasticity organic clays • Unsuitable < 3 .0% carbon (Type A disposal) • Unsuitable;;:::; 3.0% carbon (Slope dressing only)
Note (1) All soils other than "Highly compressible inorganic clays and high plasticity organic clays" containing 3.0% or more carbon are to be placed according to Type C disposal method.
Note (2) Shale is to be placed according to Type A disposal method.
74

Soil Classification Comparison: Proposed vs. Current Method Out of 132 soils classified ranging from A-4 to A-7-6, the Iowa SDC chart B shows a
3.1% reduction in select materials, an 8.4% increase in suitable materials, and a 5.3% reduction in unsuitable soils. Results are shown in Table 14. Of the 132 soil samples, 25 soil classifications contradicted each other. Differences observed by using the Iowa SDC chart B include (1) better identification of frost prone soils, (2) no reliance on density criteria, and (3) elimination of some high plasticity soils previously classified as select. Five soils that had average properties of LL= 31, PI= 11, sand and gravel fraction= 2%, silt= 78%, and clay= 20% classify as suitable under the current Iowa DOT specification. However, these materials have very high silt fractions and should be disposed of below the frost line, and are considered unsuitable under the proposed Iowa SDC chart B classification.
Furthermore, twelve soils that classified as unsuitable under the Iowa DOT specification classified as suitable under the Iowa SDC specification. The soils samples had average properties of LL= 49, PI= 30, GI= 32, sand and gravel fraction= 2%, silt= 63%, and clay= 35%. Although these samples have a GI above 30, it is not believed that using this criterion alone is adequate. As can be seen a LL of 49% with 35% clay content does not indicate high shrink/swell potential. Furthermore, the moderate PI indicates sufficient clay content to aid in prevention of frost action (i.e. reduce permeability). One sample with properties of LL= 45, PI= 22, GI= 12, sand and gravel fraction= 36%, silt= 43%, and clay= 21 % was classified as unsuitable under the current Iowa DOT method because the one-point Proctor density was below 95 lb/ft3
. However, this material at 36% sand and gravel and low PI and silt fraction was classified as select under the proposed Iowa SDC chart B. It is believed that the one-point Proctor density was erroneously low.
TABLE 15 Soil classification comparison between the proposed Iowa SDC chart B And current Iowa DOT specifications
Select Treatment Suitable Unsuitable Method Materials Materials Materials
Iowa DOT Specification 2102.06, A 1-3 26.0% 45.8% 28.2%
Iowa Soil Design and Construction (SOC) ChartB 22.9% 54.2% 22.9%
Difference -3.1% +8.4% -5.3%
In summary, the current Iowa DOT specification and the Iowa SDC classification methods produced somewhat comparable results. But, the performance based Iowa SDC chart does not rely upon one-point Proctor density to determine soil suitability nor historic/ geologic names. Lastly, the Iowa SDC chart better facilitates field identification of soil because it only requires testing of Atterberg Limits and percent passing the No. 200 sieve.
75
Embankment Construction Specifications
Embankment construction methods and testing specifications are intended to ensure that compacted soils are placed uniformly and meet required engineering properties (33). It is common in embankment construction to prescribe a combination of method and end-result specifications to ensure quality construction. For example, method specifications typically consist of maximum lift thickness requirements or minimum roller passes. End-result specifications, such as specifying 95% of standard Proctor, describe the required soil properties or embankment performance requirements. By combining the Iowa SDC and MCC charts with aspects of method and end-result specifications, an alternative embankment construction method and testing specification was developed to allow for construction diversity and provide for improved embankment quality.
Under current Iowa DOT specification section 2107, a pseudo method and end-result density control specification requires sheepsfoot walkout for compaction acceptance. However, when the sheepsfoot roller walkout method is used, soils have been observed in undercompacted and overcompacted conditions. Furthermore, when combined with thick lifts, "Oreo cookie effects" are a problem (26). Also, minimal in-situ quality control testing is performed to determine the in-place density of embankment soils except for subgrade treatment areas. As a result of these construction specifications, highly variable moisture contents, improper soil placement, and instability are common field problems. Moreover, the amount of testing for compaction is insufficient and no new testing procedures have been introduced except for nuclear density methods to determine in-place moisture and density (26). The actual percentage of soil testing conducted for compaction compared to the amount of soil placed is small. Once again construction relies heavily upon the judgement of the inspector and the quality of the earthwork contractor under the current embankment construction specifications.
Alternative construction methods and testing specifications increase quality control testing and reduces reliance upon the experience and judgement of Iowa DOT field inspectors and contractors. Common to all proposed methods is moisture control as indicated by the Iowa MCC charts and soil classification per the Iowa SDC charts.
Moisture Control Charts Reduced shear strength, high compressibility, loss of mobility, reduced workability, and
increased construction time are all outcomes related to soil water content (30). Among practitioners in geotechnical engineering, there is constant debate about whether to compact soils wet or dry of optimum moisture content. The answer depends upon the material, engineering property requirements, and the practicality of obtaining those properties, which are often competing in embankment construction. High strength and density, low permeability, low shrink swell behavior, and low compressibility are all desired outcomes related to soil moisture content. Recent field tests have shown that both cohesionless and cohesive soils excavated from borrows are typically very wet and when compacted are saturated, which results in low in-place density and strength. These high moisture contents can cause differential settlement and consolidation of the embankment and add to the potential for slope failure. By considering changes in soil properties from moisture content
76
and determining desired soil properties and constructability, the Iowa Moisture Content Construction (MCC) charts A (granular soils) and B (fine and coarse-grained plastic soils) were developed.
Granular Soils The objectives of the Iowa MCC chart are to increase soil uniformity and overall embankment performance for soils by specifying soil specific moisture boundaries. Acceptable moisture content ranges are based on soil classification per the Iowa SDC charts, relative density and standard Proctor "optimum" moisture content and "maximum" dry density. Cohesionless soils require identification of the bulking moisture contents (to be avoided during placement) and an upper limit to prevent excessive saturation. To determine the bulking moisture content range the Iowa Modified Relative Density test is performed. Typical results are plotted as shown in Figure 52. From this plot it can be seen that moisture content from 1.1 to 9 .1 % should be avoided for efficiency of field compaction to obtain 80% relative density. The upper bound moisture limit is also based on relative density and is determined by the following equation:
M% upper limit = - 0.3 RD max
50 [I]
where RDmax is the maximum relative density in pounds per cubic foot.
Fine and Coarse-Grained Plastic Soils As shown in Figure 53, standard Proctor optimum moisture content results are used to establish the acceptable moisture content range. Iowa MCC chart B is divided into two sections, one for select and suitable soils and one for unsuitable soils. The acceptable moisture content range for a select or suitable soil is fixed at -1 % to +3% of optimum Proctor moisture content. The objective for select and suitable soils, which are placed in the upper portion of the embankment, is to provide the appropriate moisture content that minimizes swell potential, produce uniform density, and provide adequate stability for equipment and paving operations. A second moisture content boundary has been established for unsuitable soils. The amount of water to be used in compacting unsuitable high plasticity clay soils shall not deviate from optimum on the dry side by more than 90% and not more than 120% on the wet side. However, ifthe optimum Proctor moisture content of the unsuitable material is over 20% (based on dry weight) then the minimum allowable moisture content is -2% and the maximum is +4%. At low optimum moisture content the minimum moisture range is -1 % to +3%. These moisture boundary ranges were set to better represent specific soil properties. For example, a high optimum moisture content typically indicates that the material has a smoother, flatter Proctor curve as opposed to a material with a low optimum moisture content that has a sharper Proctor curve, which indicates that changes in moisture significantly affects density. If used during construction, the Iowa MCC charts could greatly increase the uniformity of compaction density and stability and will minimize low embankment shear strength zones caused by very wet and saturated materials.
77

120
100
~ 80
~ ·c: CJ) Q) 60 "O Q) > ~ Q) 40 0:::
20
0
Bulking Moisture Upper I
H~==~~!!!===:+r------r--~-o.und _ _J /Limit
0 5 10 15 20
Moisture content(%)
FIGURE 52 Iowa MCC chart A (granular soils)
5
*" 4 ~
Unsuitable - Upper Boundary
~ 3 1-------,..::;; ______________________ _
:: Select/Suitable - Upper Boundary E E 2 ~ 0 E ,g c:: Optimum Moisture Content (Percent dry weight) .Q 0 ~ !------------------------~ ·~ 0 Q) -1 :c ~ Ci: -2
Select/Suitable - Lower Boundary -----------------------------· Unsuitable - Lower Bounda
-3 ,___,__,___.__....__..__...__.__.___.___._...__.__.__.___..__...__.__.__._~
10 12 14 16 18 20 22 24 26 28 30
AASHTO T 99 Optimum Moisture Content, %
FIGURE 53 Iowa MCC chart B (fine and coarse grained plastic soils)
78

Embankment Construction Guidelines
The following embankment construction guidelines apply to roadway and borrow excavation soils used in embankment construction. Herein contains an alternative construction method and end-result testing specification. Based on the percent passing the No. 200 sieve (F200), Iowa Modified Relative Density and/or standard Proctor compaction test results, the following are the criteria by which the appropriate construction methods and moisture conditions are determined:
1. Determine F200 (obtained in the initial Soil Design and Construction guidelines for soil classification).
• F200 < 10% perform the Iowa Modified Relative Density Test
• F200 10-35% perform both the Modified Relative Density and Standard Proctor Density Test (Test Method No. Iowa 103-B). The test method yielding the highest maximum dry density will be used as the controlling test procedure and subsequently, used to establish field density requirements.
• F20o;;:::: 36% perform standard Proctor compaction test (Test Method No. Iowa 103-B).
• If the Iowa Modified Relative Density controls, the soil will be considered a granular soil; if standard Proctor compaction test controls, the soil will be considered to be a fine or coarse-grained plastic soil Granular and fine or coarse-grained plastic soils are descriptive names used for determination of appropriate construction methods and the end-result testing specifications.
2. If the Iowa Modified Relative Density controls, use Iowa MCC chart A for allowable construction moisture contents; if standard Proctor compaction test controls use Iowa MCC chartB.
3. Follow the alternative construction method and end-result testing specifications with Moisture Control and DCP Index Testing with Test Strips as described in the following:
Construction Methods I. Moisture content will be controlled per Iowa MCC Charts A and B.
2. Test strips will be used to field determine appropriate lift thickness, roller configuration, and required number of roller passes. For each soil type encountered a minimum 50 feet wide by 250 feet long test strip will be constructed and remain part of the embankment. The test strip will be placed to a minimum 36 inches in depth. (Approximately 5-8 test strips per project would be anticipated but will vary depending on soils encountered.) Based on conventional vibratory rollers, 12-inch loose lifts would be expected for granular soils. For conventional sheepsfoot compaction 8-inch loose lifts for fine and coarse-grained plastic soils would be anticipated. However, changes in lift thickness may be appropriate with new innovations in compaction and/or type of compaction
79

equipment. Each test strip will have 5 DCP tests performed to full depth. An average of the 3 mid-point range DCP tests will provide the acceptable DCP index value. (Note: Density testing may be useful to validate the DCP during construction for different soil types.)
End Result Testing 1. End result acceptance testing will be based on referenced moisture control requirements
and density/stability analysis with the Dynamic Cone Penetrometer (DCP) as shown in Figure 54. A minimum of one DCP test is required for every 100 feet by 250 feet area per lift. DCP index acceptance criteria are shown in Table 16.
TABLE 16 General DCP Index Test Guidelines
Soil Type (Based on Iowa SDC chart A and B classification)
Granular Soils Select Suitable
Fine and Coarse-Grained Plastic Soils Select Suitable Unsuitable
DCPlndex1
(mm/blow)
~ 35 ~45
~ 75 ~ 85 ~95
1Values may be modified according to test strip I DCP index testing
2. Field moisture content to be determined by an appropriate method such as oven drying method, microwave method, nuclear gauge method, or calcium carbide "Speedy" method, etc. A minimum of one test is required for every 100 feet by 250 feet area per lift.
80

i::: ·r-i
"<1'
O'\ (""')
N N
---CJ
..a 0 i...
0 > -
I
.___Handle
Hommer { 17. 6 lb) (10.l lb)
- Anvil
5/8 in. diam Steel
t::;j...--Cono
THE CONE
Cone Angle 60 deg
~. 0.79 in.
FIGURE 54 DCP design and cone tip detail
81
Rod

PILOT PROJECT RESULTS
Pilot project construction was initiated in order to test the practicability of the proposed design and construction specifications. Objectives of the pilot projects were to: (1) determine if the described construction methods and alternative specifications would improve embankment quality, (2) evaluate the feasibility and practicality of utilizing the Iowa MCC and SDC charts, and (3) determine if training Iowa DOT field personnel to perform the required lab and field testing can be accomplished quickly and is feasible and to gain their input.
Granular Soils
The pilot projects for the granular soils with PI <10 and LL< 50 was divided into two separate projects. The A-2-4 materials were tested in the summer of 1998 at U.S. Highway 61 in Fort Madison, Iowa. A test strip consisted of disking A-2-4 material until it fell within the prescribed moisture range using the proposed construction specifications. For the material in question, the prescribed range was 8% to 12.5% as determined by the Iowa Modified Relative Density Test. Figure 55 presents the findings ofrelative density versus DCP index for the A-2-4 material. As shown the DCP index increases as relative density decreases.
0 20 40 60 80 100 120
DPI (mm/blow)
FIGURE 55 Relative density vs. DCP index for A-2-4 material under proposed specification
82

Figure 55 shows a better trend than was previously presented when no moisture control was applied. From this information a limiting DCP index value was estimated. In this particular case, a DCP less than about 35 mm/blow roughly indicates about 80% relative density. For those points with DCP index values greater than 35, additional passes of the approved roller to increase density would be required. In the study of the A-2-4 material, a roller pass study was not practical due to weather and time constraints. However, the issue of roller passes was included in the findings of the pilot project built using the clean A-3 material. Further study for establishing limiting DCP index values is recommended.
The pilot project for the A-3 material was performed on U.S. Highway 520 in Grundy County, Iowa during the summer of 1999. At the request of the contractor and Iowa DOT, three different test strips were initiated. One test strip was built under the current specification and one test strip was built under the proposed specifications using moisture control and DCP testing. Finally, one test strip was constructed without moisture control and with no compaction effort. The material used was classified as A-1-b sand with approximately 5% to 7% fine contents. The findings of the study are presented in Figures 56 and 57.
Figure 56 presents an interesting finding. Nearly all of the points achieved 80% relative density with no compaction or just sheepsfoot compaction. However, the benefits of vibratory rolling are evident in Figure 57 as all of the test strip data points are uniform while the no compaction and sheepsfoot compaction points are scattered. Uniform compaction should eliminate differential settlement of the embankment. The value of the test strip is further strengthened by these findings. If a contractor can prove via the test strip that compaction is unnecessary, there will be time saving for both the contractor and the Iowa DOT. The sheepsfoot test strip received eight passes of the sheepsfoot on approximately one-foot lifts. Similarly, the proposed specification test strip received vibratory compaction on approximately one-foot lifts. Finally the no compaction test strip received no passes of any roller on one-foot lifts.
Conclusions of Granular Soils with PI < 10 and LL < 50 Pilot Project
• Moisture control is essential to the proper construction of an embankment. No other aspect of embankment construction, when controlled, will yield a better product.
• Multiple (8) passes of a roller may not be required.
• Lift thickness can be at least twelve inches in depth for cleaner granular materials.
• Test strips would be an efficient method of quality control.
• The DCP can be a useful tool for ascertaining density when moisture control is applied to the embankment.
• Training the Iowa DOT field personnel to perform the required lab and field-testing was successful.
83
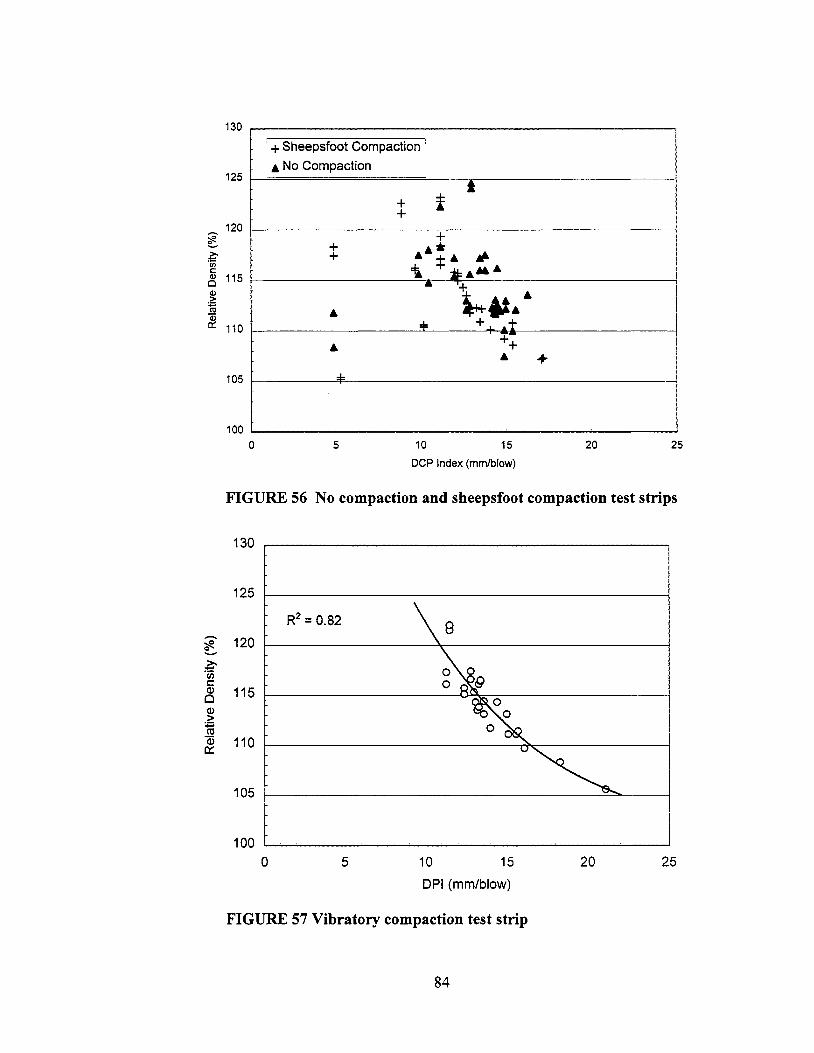
130
125
'1 + Sheepsfoot Compaction
I • No Compaction
I 1 +
+ 120
+ +
.•;. JI. I + =i 'il:•M• I
- +
• ~~.· =I= +_. ... t
~ ~ 'iii c:: Q) 115 Cl Q)
.::: c;; Gi c:t:: 110
+-• + • +
105 ...
100 0 5 10 15 20 25
DCP Index (mm/blow)
FIGURE 56 No compaction and sheepsfoot compaction test strips
130
125
R2 = 0.82
~ e..... 120
~ 'iii c: Q.l 115 Cl Q.l > ~ Q) 110 0:::
105
100 0 5 10 15 20 25
DPI (mm/blow)
FIGURE 57 Vibratory compaction test strip
84

Fine and Coarse-Grained Plastic Soils
U.S. Highway 520 Field tests performed at U.S. Highway 520 included moisture, density, lift thickness, and
DCP index testing. Soils encountered during borrow excavation consisted of loess underlain by select and suitable glacial till. Standard Proctor compaction curves are shown in Figure 58. Maximum dry density increased from loess (99 pcf - 24%) to mixed loess/till (104.5 pcf - 19%) to select glacial till (117 pcf - 14%). During construction loess and glacial till were mixed in the borrow by scrapers excavation. Moisture-density tests shown in Figure 58 indicate that moisture was on the wet side of optimum. For the select glacial till materials moisture varied from 14.7 to 21.2% and averaged 18.0%, which is 4 points above optimum. Percent compaction averaged 92%. A consolidation test performed on the wet/low density select material indicated that 3.1 inches of settlement would occur with 90% consolidation taking 13 years. Moisture for the mixed material varied from 16.8 to 27.9% and averaged 21.9%. Compaction for the mixed material was high at approximately 97 .0%.
120
115
110
0 c. 105 ;.:
:i Cl
~ ~
100 ::>
95
90
85 0
oMixed Soil
+Glacial Till
e Consoildation Test' ' . '
Void Ratio, e 0.65
0.70
0.75
' ' ' ' ' '
' 0 '• ' ' '
'•
'
5 10 15 20 25 30 Moisture Content, w, percent dry weight
FIGURE 58 Field density and moisture results U.S. Highway 520
85
35

Compacted lift thickness was monitored at several locations during construction by excavating test pits and measuring depth to the underlying lift. Over a four-week period, 41 test pits were excavated. This measurement was very critical because inadequate stability was observed during construction - scrapers were pushed through fill sections. Statistical analysis of the data showed that lift thickness averaged 12.l ± 3.0 inches, which combined with high moisture content was evidence for instability. To verify that the thick lifts were causing instability, 50 DCP index tests were performed. Once again, as show in Figure 59, results of "Oreo cookie" effects were present. All of the DCP index tests had at least one portion between 0-36 inches that had a DCP index greater that 75 mm/blow. Analysis showed that 83% (30 inches) passed and 17% (6 inches) of all 50 test failed this index requirement.
CBR
0.1 1.0 10.0 100.0 0
, I
5 i
10 I
' I
15 .5 ~ 20 - ; : :
a. Q)
Cl 25
• I, ''
1 75 mm/blow 30
35
40
FIGURE 59 DCP index test results U.S. Highway 520
After the referenced tests were performed and analyzed the contractor reduced the compacted lift thickness to 10 inches at the request of the Iowa DOT field inspector. However, lift thickness was still above the specified allowable 8-inch loose lift according to the current Iowa DOT specification. How is this possible? The field inspector was completely aware of the situation, but did not believe the effects of large lift thickness could be so deleterious. Subsequently, the inspector was shown how to use the DCP test in the field to evaluate the quality of the fill. His comments were that " it is a good test because it is simple but, I would prefer a test that only takes 30 seconds to 1 minute". Generally, a DCP index takes from 5 to 10 minutes per test.
86

U.S. Highway 6 Similar moisture and density tests were performed at U.S. Highway 6 during summer
1999. Results showed that wet select glacial till material that is disked and aerated prior to compaction has higher density and stability, as would be expected. Figures 60 and 61 indicate moisture density test results and observations for sheepsfoot walkout and disking. Lastly, Figure 62 indicated that the reduced moisture content and increased density was evident by DCP index testing.
112
110 I l
102
100
P.octor No. 1 Hwye.1999 Sr.eepsfoot walkout • NO Disking· NO
LL =42 Pl= 24 F200= $3%
Lift Thick.ne® :;:: S'" to 11"
Moisture content(%)
FIGURE 60 Fill material without disking
• •
120 -·---------.,.--------,----;-------------,
\\ Proe'.or No. 2 Hwy e. 1999 Sheepsfco!. w.IXot..1 • YES
1 ·1 6 Diskmg • YES
.. -l 114
.?i' "' c:
'" ~m c
110
4
LL: 26 P1 11 1i F200 = S:.2%
Li!t Thlkness = s• !O i ~"
€ s
MCCciiart moi&ture range-
•
• • •
95%
• • S3%
10 12 14
Moisture content (%)
FIGURE 61 Fill material with disking
87
\
\
•
16 18 20 22 24

FIGURE 62 Change in DCP index before and after disking
U.S. Highway 5 During fall 1999 a test strip was constructed on U.S. Highway 5 in Polk County, Iowa in
order to evaluate the proposed test strip method for DCP calibration. Fill materials, that ranged from suitable to unsuitable based on Iowa SDC classification, were excavated in layers and consequently mixed. As shown in Figure 63, the layered soils were mixed during excavation with a CAT 375 and hauled by dump truck. The resultant, mixed soil classified as suitable according to Iowa SDC chart B. Construction of the test strip was conducted in an area where the bearing soils were relatively stiff, which provided for a good surface to compact against. Loose lifts were placed in uniform 8-inch lifts, disked twice, and compacted with 8 passes of a sheepsfoot. Moisture and density of the compacted fill averaged 17.9% and 108.3 pcf, respectively. According to the Iowa MCC chart, the acceptable moisture limits ranged from 18 to 22%. The compaction moisture content was actually 1.1 % below optimum. In-place density tests averaged 103% of maximum standard Proctor density.
Once the test strip was completed (approximately 4 feet in depth) nine DCP index tests were performed at depths to 36 inches. Results, as indicated in Figure 64 show that the material was relatively stiff (CBR ~ 4) and well below the preset 85 mm/blow index values for suitable soils. Based on these results a more appropriate value set for the maximum DCP index for field-testing would be 70-75 mm/blow.
88

FIGURE 63 Soil Mixing during excavation
1 CBR = 292/DCP1.12 10 0
I I •I -El • t.XP o ____ -+ I I A -fl)<. O
I I Cl e+a:> X 200 - 1 'i 1;---a--o ~ + 1 x0
- I I I • : +A o Ix• I l I D • : + • o:~X __ _,_-.,--
300 - I I I A D t 't' I 0
100
0
- 400 E
- I I I : A • • TO D I .JM 0 I .x ,. f'I OI..J I I I x-
. I I I • ! - A ~ .#o:J ~ , E ; 500 -c. (1) Cl 600
800
:__; o Test 1 I .1 D b ~ o ~ : i •
~ oTest 2 I .1 D i o I - o : · I • _,x b ' t-ATest3
1
,
1¢. 1 0 0
• ._x: o t xTest 4 ! .
1 . +D !9 · X • • • ' -0 - ¥
:---- •Test 5 1 0 I ~ Q 1 'I' ~ oTest6 1 !t. rjo. - x• ' . 0 • ' :----+Test 7 I ' t.-. ~-~,.--i...---L---' ~ .rests I Do+'-"'.· a; - T x
1
i - I -. o• 1
' 1
=-----rest 9 1 6 <> • ~ d O ~ 1x- , .. ,
0
700
900
1000 _r ____ ~~~-~--~~~---~~
FIGURE 64 DCP test results for U.S. Highway 5 test strip
89
Iowa DOT Training
Throughout the testing completed during summer 1998 and 1999 several Iowa DOT field personnel and contractors were interviewed with regard to the DCP index testing apparatus and proposed specification changes including the Iowa SDC and MCC charts. Feedback for the DCP was very positive. The simple equipment, simple test procedure, and depth of testing were some positive comments. Negative comments pointed out that the equipment was awkward for one person alone to perform and ha..11d calculations \11ere required to determine the DCP index and equivalent CBR values.
Also, to better evaluate the proposed specification changes, four weeks of in-depth laboratory and field training for one Iowa DOT personnel took place at the referenced U.S. Highway 520 project. The field personnel had no prior soil training with the exception of insitu determination of soil moisture content. Atterberg limits, standard Proctor, relative density, moisture testing, DCP index, Nuclear gauge moisture-density testing, and grain size analysis were covered in the training sessions. For the first two weeks we worked side by side performing the above-mentioned analysis. Then for two weeks the field person performed the tests on his own and did an exceptional job. Throughout this training process some shortcomings in the test procedures were identified and corrected.
In order to perform these tests in the field, a lab trailer was equipped with a liquid limit device, small glass plate for plastic limit, microwave, scale, No. 40 and 200 sieves, standard Proctor compaction equipment, and a relative density vibrating plate. In addition a 5000-liter water tank was used for sieve washing. Total testing time to perform soil classification tests in accordance with Iowa SDC charts A and B averaged approximately one hour. Determination of proper in place moisture content by the Iowa MCC chart A method (Iowa Modified Relative Density) took about 2 hours, while the Iowa MCC chart B method (standard Proctor) took about 1.5 hours. In conclusion, the laboratory and field testing training was successful. The abilities of the trainee were well above that which was required to perform the proposed lab and field work. In the future a wet soil-grinding device could significantly improve laboratory results and speed up the process.
90

RECOMMENDATIONS
Short Term
1. Adopt proposed soils design and construction specifications • Iowa SDC chart A (Granular Soils) • Iowa SDC chart B (Fine and Coarse-Grained Plastic Soils)
2. Adopt soil specific moisture control requirements • Iowa MCC charts A and B • Iowa Modified Relative Density
3. Adopt DCP Index and Test Strip construction specifications • Minimum 50 x 500 foot area 30 inches deep • Approximately 5 to 8 test strips per project • Guidelines for minimum DCP index requirements:
a) Granular Soils Select~ 35 mm/blow Suitable ~ 45 mm/blow
b) Fine and Coarse-Grained Plastic Soils Select ~ 7 5 mm/blow Suitable ~ 85 mm/blow Unsuitable ~ 95 mm/blow
4. Develop and initiate a soil certification program for Iowa DOT personnel • Soil classification (liquid limit, plasticity index, grain size analysis) • Lab testing (standard Proctor compaction and Iowa Modified Relative Density) • Field Testing (DCP index and moisture testing)
5. Design and let a pilot project based on proposed soil design and construction specifications
Long Term
1. Develop training programs and workshops for field personnel • Identification of soils and classification • Soil compaction basics • Certification programs through the Iowa DOT for design engineers, field personnel,
and contractors.
2. Establish a quality control/quality acceptance program • Ensure embankment materials are properly identified and placed • Ensure embankment soils are properly moisture conditioned and compacted.
91

3. Lastly, the following flow chart shown in Figure 65 might be considered in the future for a QC/QA program.
Iowa
- DOT
~ l Design and
Design Construction - -Specifications Engineer
l Iowa DOT ......_
Field Inspector
~ Field Earthwork Laboratory
Testing - ~ Testing Contractor
I I 'II
QC Certification
Iowa DOT ~ Final I I
Acceptance I QA I
FIGURE 65 Possible Iowa DOT flow chart for future QC/QA program
ACKNOWLEDGEMENTS
The authors gratefully acknowledge and thank Iowa DOT technical advisors John Vu and Dave Heer for their cooperation, timely assistance, and advice through Phase I and Phase II.
We also thank the steering committee Bob Stanley, Bob Jimerson, Tom Jacobson, Jerry Danforth, John Moyna, Jesse Steger, Chris Reilly, and Larry Thompson for their advice and council.
The Project Development Division of the Iowa Department of Transportation and the Iowa Highway Research Board sponsored his study under contract TR-401.
92

REFERENCES
(1) Ahlvin, R.G., and Smoots, V.A. (1988). Construction Guide for Soils and Foundations, 2nd Edition, Wiley Interscience, New York.
(2) Yamammeuro, J.A., and Lade, P.V., (1997). "Static liquefaction of very loose sands," Canadian Geotechnical Journal, Vol. 34, pp. 905-917.
(3) Hausmann, M. R. (1998). Principles of Geotechnical Engineering, 4th Edition, PWS Publishing, Boston, MA.
(4) Townsend, F.C. "Comparison of vibrated density and standard Compaction Tests of sand with fines," Misc. Paper S-72-29, U.S. Army Waterways Experiment Station, Vicksburg, Mississippi, June 1972.
(5) Spangler, M.G., Handy, R.L. (1973). Soil Engineering. Third Edition, Harper and Row Publishers, New York.
(6) Taber, S. (1929). "Frost heaving," Journal of Geology, vol. 37, no. 5, pp. 428-461.
(7) Berg, R.L., and Wright E.A., "Frost action and its control," Technical Council on Cold Regions Engineering Monograph, ASCE, New York, 1984.
(8) Webster, S.L., Grau, R.H., and Williams, T.P., "Description and Application of Dual Mass Dynamic Cone Penetrometer," USAE Waterways Experiment Station, Vicksburg, MS, May 1992.
(9) Hilf, J. W. (1991). "Compacted Fill," in Fang, Hsai-Yang, Foundation Engineering Handbook. 2nd Edition, VanNostrand Reinhold, New York.
(10) Proctor, R.R. (1933). "The design and construction ofroller earth dams," Engineering News Record III, August 31, September 7, 21, and 28.
(11) Hogentogler, C. A. (1936). "Essentials of soil compaction," Proc. of the Highway Research Board, National Research Council, Washington, D.C., pp. 309-316.
(12) Hilf, J. W. (1956). "An Investigation of Pore-Water Pressure in Compacted Cohesive Soils," Technical Memorandum 654, U.S. Department of he Interior, Bureau of Reclamation, Denver, Colorado.
(13) Lambe, T. W. (1960). "The character and identification of expansive soils, soil PVC meter," Federal Housing Administration, Technical Studies Program, FHA 701.
(14) Olsen, R. E. (1963). "Effective stress theory of soil compaction," Journal of the Soil Mechanics and Foundation Division, ASCE, vol. 89, no. SM2, pp. 27-45.
93

(15) Barden, L. and Sides, G. R. (1970). "Engineering behavior and structure of compacted clay," Journal of he Soil Mechanics and Foundations Division, ASCE, vol. 96, no. SM4, pp. 1171.
(16) Handy, R. L., (1968). "From practice to theory in soil compaction," Thirteenth Annual Convention, National Asphalt Pavement Association, Los Angeles, California.
(17) Lambe, T. W. (1958). "The engineering behavior of compacted clay," Journal of Soil Mechanics, ASCE, vol. 84, SM2.
(18) Porter, 0. J. (1946). "The use of heavy equipment for obtaining maximum compaction of soils," American Road Builders, Technical Bulletin No. 109
(19) Waterways Experiment Station. (1954). "Soil Compaction Investigation: Report No.6, Effect of Size of Feet on Sheepsfoot Roller," technical memorandum no. 3-271, Vicksburg, Miss.
(20) Waterways Experiment Station. (1956). "Soil Compaction Investigation: Report No.7, Effect on Soil Compaction of Tire Pressure and Number of Coverages of Rubber-Tired Rollers and Foot-Contact Pressure of Sheepsfoot Roller," technical memorandum no. 3-271, Vicksburg, Miss
(21) Waterways Experiment Station. (1957). "Soil Compaction Investigation: Report No.8, Effect of Lift Thickness and Tire Pressure," technical memorandum no. 3-271, Vicksburg, Miss.
(22) Clayton, C.R.I. (1990). "SPT energy transmission: theory, measurement and significance", Ground Engineering, vol. 23, no. 10, pp. 35-43.
(23) United States Department of Agriculture - Soil Conservation Service (1979). Soil survey report of Lee County, Iowa. USDA-Soil Conservation Service, Washington, D.C.
(24) Lambe, T. and Whitman, R. (1969). Soil Mechanics. John Wiley & Sons, New York.
(25) Lambe, T. W. (1962). "Soil Stabilization," in Foundation Engineering, G.A. Leonarnds, ed., McGraw-Hill, New York.
(26) Bergeson, K. L., Jahren, C., Wermager, M., and White, D. J. (1998). Embankment Quality Phase I Report, Project development Division of the Iowa Department of Transportation and the Iowa Highway Research Board, Iowa DOT Project TR-401, CTRE Management Project 97-8.
(27) Bratt, T., Twardowski, J. and Wahab, R. (1995) "Dynamic cone penetrometer application for embankment/subgrade inspection," International Symposium on Cone Penetration Testing, Linkoping, Sweden.
94

(28) Peisker, John M. (1995). " Improving Standards to Increases Pavement life," Public Works, vol. 126, no. 8, pp. 46.
(29) Sowers G. F. and Hedges C. S. (1966). "Dynamic cone for shallow in-situ penetration testing," Vane Shear and Cone penetration Resistance Testing ofln-situ Soils, ASTM STP 399, Am. Soc. Testing Mats. pp. 29.
(30) Rollings, M. P., and Rollings, R. S., (1996). Geotechnical Materials in Construction.McGraw-Hill, New York.
(31) Das, B. M. (1998). Principles ofGeotechnical Engineering. Fourth Edition, PWS, Boston.
(32) United States Department of Agriculture - Soil Conservation Service (1979). Soil survey report of Henry County, Iowa. USDA-Soil Conservation Service, Washington, D.C.
(33) Nunnaly, S. W. (1998). Construction Methods and Management. Prentice Hall, Columbus, Ohio.
(34) Oschwald, W.R., F.R. Riecken, R. I. Didriksen, W. H. Scholtes, and F.W Schaller, Principal soils oflowa. Special Report No. 42, Dept. of Agronomy, Iowa State University, Ames, Iowa, 1965.
95
