embedded and surface mounted fiber optic...
TRANSCRIPT

EMBEDDED AND SURFACE MOUNTED FIBER OPTIC SENSORS DETECT MANUFACTURING DEFECTS AND
ACCUMULATED DAMAGE AS A WIND TURBINE BLADE IS CYCLED TO FAILURE
J. Renee Pedrazzani, Sandie M. Klute, Dawn K. Gifford, Alex K. Sang, Mark E. Froggatt
Luna Innovations Incorporated 3157 State St.
Blacksburg VA 24060
ABSTRACT
High resolution fiber optic strain sensing is used to monitor the distributed strain during fatigue testing of a 9-meter CX-100 wind turbine blade with intentionally introduced defects. Commercially available telecommunications-grade optical fiber was embedded in several layers of the carbon fiber spar cap and surface mounted along the spar cap and leading edges of the finished blade. The amplitude and phase of the light reflected from the fibers are measured using a commercial Optical Frequency Domain Reflectometer (OFDR). Changes in the amplitude and phase of the backscattered light are used to determine the strain along the entire length of the fiber with 2.5 millimeter spatial resolution. Distributed strain measurements throughout the depth of the spar cap provide an unprecedented view into the strain field within a composite wind turbine blade with defects during fatigue testing to failure.
1. INTRODUCTION
Current manufacturing of large megawatt-scale wind turbine blades involves the lay-up of hundreds of individual plies of reinforcements, which are frequently in the form of woven or stitched fabrics and can be either dry or prepreg. As a result, the reinforcements are susceptible to localized in-plane waviness, out-of-plane wrinkling, delaminations, voids, and other distortions that compromise the mechanical properties of the final composite structure [1]. The wind industry is moving to scale up manufacturing processes for larger blades, which will escalate the maintenance costs of wind turbine facilities. As the need to decrease Cost of Energy increases, it becomes imperative to detect these defects during the manufacturing process, to screen for defective parts, and to correct problems in situ so that defective components can be recovered prior to final assembly. In addition, providing a Structural Health Monitoring tool that detects damage in real time and predicts failure will enable increased Return on Investment.
Over the past several decades, optical fiber sensing techniques have been developed which make possible the measurement of strain profiles within a composite material. Optical fiber is ideal for this application – it is lightweight, small in diameter, immune to EMI, and composed of fused silica, which is materially compatible with most composites used in the industry. Several sensing methods have been used to provide distributed sensing over a length of fiber, including multiplexed Fiber Bragg Gratings, Brillouin scattering, and Raman scattering [2, 3]. Froggatt et. al. showed that the Rayleigh scatter signal reflected from the fiber can be used to form a fully

distributed fiber sensor using a technique known as Optical Frequency Domain Reflectometry (OFDR) [4]. The three scattering techniques make possible the use of simple, unaltered fiber as the sensor, enabling a relatively inexpensive distributed sensor. Recent work using the OFDR sensing technique has shown strain measurements with spatial resolution as fine as a few millimeters [5-7]. This high spatial resolution enables a detailed and sensitive measure of the strain profile within a composite material.
Previously, optical sensors have been embedded in composites to detect impact damage, delaminations, as well as other failures during testing [8-10]. In recent work, OFDR has been used to detect localized regions of high surface strain prior to the formation of a visible crack on a 9-meter CX-100 blade cycled to failure [11]. Optical fiber embedded in the CX-100 wind blade with intentionally introduced defects has been shown effective in elucidating the defects during a Vacuum Assisted Resin Transfer Molding (VARTM) manufacturing process using a commercially available OFDR instrument [12]. Using this technique, the existence of the defects could be seen as soon as vacuum was pulled as well as during the infusion process. This type of monitoring is also useful to detect dry areas after fabrication, where the resin has failed to wet-out the reinforcing fiber. Additionally, fiber optic sensors can be used to determine residual stresses in the component following fabrication and can remain protected within the structure to monitor strains throughout the lifetime of the component.
2. SENSING TECHNIQUE
The Rayleigh scatter amplitude reflected from an individual fiber as a function of distance is a random pattern that is formed in the fiber when the fiber is manufactured. While random, it is static and forms a unique “fingerprint” of that fiber. If a fiber is stretched, or strained, the spatial frequency of this pattern is also stretched. This elongation leads to a change in the frequency spectrum reflected from this section of the fiber. These changes can be measured and calibrated to determine the local strain in the fiber.
OFDR is an interferometric method used to measure the amplitude and phase of light reflected from an optical fiber as a function of distance [14-15]. Figure 1 shows a diagram of a basic OFDR measurement system. The light from a swept-tunable laser is split between a reference and measurement path of an interferometer using a fiber optic coupler. The light in the measurement path is sent to the fiber under test along the input port of an optical circulator. The light reflected from the fiber under test returns in the output port of the circulator. This light is then recombined with the light in the reference path. The combined signal passes through a polarization beam splitter. The polarization controller in the reference path is used control the polarization such that the reference light is split evenly between the two outputs of the polarization beam splitter. The interference pattern between the measurement and reference signals as the laser is swept across a wavelength range is recorded on two detectors, labeled S and P. A Fourier transform of these detected signals yields the amplitude and phase of the reflected light as a function of delay along the fiber. A second (trigger) interferometer with a known delay is used to compensate for nonlinearities in the laser tuning.
To find the strain at a given location in the fiber, the complex data resulting from the first Fourier transform is windowed around the desired location. The length of this window becomes the gauge length of the strain measurement. This length can be as small as a few millimeters. An

inverse Fourier transform of the bandpass filtered data yields the reflected spectrum from that section of fiber. This spectrum is cross-correlated with a spectrum from the same location measured with the fiber in a nominal, baseline state. The spectral shift between these two data sets is then converted to strain or temperature change using a calibration coefficient. This process is repeated along the fiber length to form a distributed measurement of strain along the fiber [3-6].
Figure 1. Basic OFDR network.
3. EXPERIMENTATION
3.1 Layup of 9-meter Wind Turbine Blade with Embedded Optical Fiber
An experimental CX-100 9-meter wind turbine blade with carbon fiber spar caps, designed by Sandia National Labs, was manufactured at TPI composites in Warren, RI. The blade was manufactured in two halves, with the High Pressure (HP) and Low Pressure (LP) sides of the blade mated after cure. Defects were cast from resin prior to lay-up and introduced into the spar cap region of both the HP and LP sides of the blade at three different spanwise locations, as shown in Figure 2. The three defects are located 3.5m, 5m, and 6m from the blade root and have wave lengths of 45mm, 30mm, and 15mm, respectively. The wave height of all three is 3mm, for aspect ratios of 15, 10, and 5, respectively. Telecom grade, polyimide-coated, low-bend-loss fiber is used as the sensor. The polyimide coating is a commercially available rugged fiber coating that survives temperatures up to 300°C and transfers strain well to the underlying fiber. The outer diameter of the fiber with the coating is 155 micrometers. As such, it has minimal impact on the composite structure.
Optical fibers are embedded in four layers of the composite lay-up in a configuration shown in Figure 2 and Figure 3. The fibers enter the blade along the trailing edge between stations 1000 and 2000 at the maximum chord location, progress from the 2000 station to the 7000 station along the leading edge of the spar cap, return back along the trailing edge, and exit the spar cap at the point of entry. In all layers the fiber was routed in a straight line passing through points 1” inboard of either end of the three defects. At approximately every meter the fiber was woven

into the composite material to maintain its position relative to the structure during the manufacturing process.
The first of four fibers is integrated in the +/-45 layer directly under the defects, with the second, third, and fourth fibers integrated into the triax 16, 17, and 18 layers above the defects, respectively, as shown in Figure 3. The third and fourth fibers extend past the trailing edge data region to encompass the root of the blade. The fiber is protected using small-diameter Teflon tubing for ingress and egress from the spar cap at the transition from carbon to balsa, where a notch of approximately 5mm was cut from the balsa to ease the fiber bend radius.
Figure 2. Drawing of High Pressure side of CX-100 blade showing optical fiber routing configuration and defect locations.
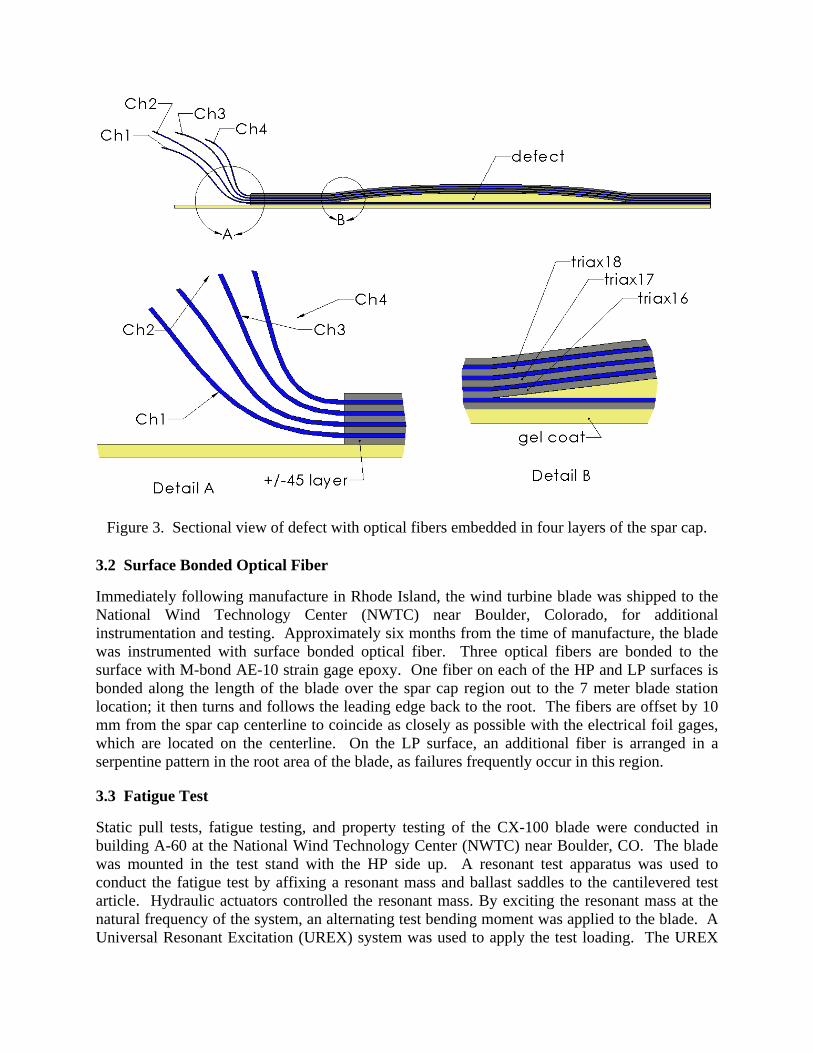
Figure 3. Sectional view of defect with optical fibers embedded in four layers of the spar cap.
3.2 Surface Bonded Optical Fiber
Immediately following manufacture in Rhode Island, the wind turbine blade was shipped to the National Wind Technology Center (NWTC) near Boulder, Colorado, for additional instrumentation and testing. Approximately six months from the time of manufacture, the blade was instrumented with surface bonded optical fiber. Three optical fibers are bonded to the surface with M-bond AE-10 strain gage epoxy. One fiber on each of the HP and LP surfaces is bonded along the length of the blade over the spar cap region out to the 7 meter blade station location; it then turns and follows the leading edge back to the root. The fibers are offset by 10 mm from the spar cap centerline to coincide as closely as possible with the electrical foil gages, which are located on the centerline. On the LP surface, an additional fiber is arranged in a serpentine pattern in the root area of the blade, as failures frequently occur in this region.
3.3 Fatigue Test
Static pull tests, fatigue testing, and property testing of the CX-100 blade were conducted in building A-60 at the National Wind Technology Center (NWTC) near Boulder, CO. The blade was mounted in the test stand with the HP side up. A resonant test apparatus was used to conduct the fatigue test by affixing a resonant mass and ballast saddles to the cantilevered test article. Hydraulic actuators controlled the resonant mass. By exciting the resonant mass at the natural frequency of the system, an alternating test bending moment was applied to the blade. A Universal Resonant Excitation (UREX) system was used to apply the test loading. The UREX

uses a pair of hydraulic actuators mounted to the blade through a ballast saddle. The system was located at the 1600-mm station, with a ballast saddle at the 6750-mm station, as shown in Figure 4. At predetermined intervals throughout the fatigue test the blade was stopped and fiber optic data taken with the blade under no load, -375 lbs, and +/-500 lbs load.
Figure 4. Fatigue test configuration of the CX-100 at the NWTC.
3.4 Sensing Parameters
An Optical Backscatter Reflectometer, a commercially available OFDR system, was used to measure the reflected signal from the fiber throughout the manufacturing process and fatigue testing. A 32-channel optical switch multiplexes the signals from the four fibers in each of the HP and LP halves of the blade and the surface mounted fibers. The instrument is capable of measuring up to 70 m of optical fiber with a sampling spatial resolution of up to 20 microns and strain spatial resolutions as fine as a few millimeters. For these measurements a 20 nm scan range was selected, resulting in a 40 micron sampling spatial resolution. The strain was calculated from this data with 2.5 mm spatial resolution along the entire length of the fiber.

4. RESULTS
4.1 Residual Strain in Blade
The measurement technique compares the state of the fiber in a reference state to the state of the fiber under applied strain. A reference scan was taken of the fiber located under the defects in the HP side of the blade prior to pulling vacuum during the VARTM manufacturing process. The blade manufacture was completed and the blade shipped to NREL for test. While the blade was supported on both ends prior to mounting in the test stand, the same embedded fiber was interrogated to determine the residual strain in the blade, shown in Figure 5. Localized regions of tension on the order of 1000are apparent at each of the defect locations as the fiber runs out from blade station location 2500–7000 along the spar cap and back again from 7000–2500.
Figure 5. Residual strain in fiber embedded under the defects in the HP side of the blade.
4.2 Surface Strain Measurements on Blade under Static Load Prior to Fatigue Testing
Distributed strain data are taken using surface mounted optical fibers running down the spar cap and back along the leading edge of both the HP and LP sides of the CX-100 blade. A reference scan was taken before the blade was mounted in the test stand, while it was supported on both ends during instrumentation. The blade was subsequently mounted in the test stand with the HP surface facing up and a static load of 500lb applied down. Figure 6 shows distributed fiber optic strain data compared with co-located electrical foil gages for the HP and LP spar cap from the 0500 – 7000 blade station locations (upper) and for the leading edge (lower). Readily apparent in the fiber optic strain data are regions of high localized strain at blade station locations that correspond to the known internal defects introduced in the blade during manufacture. Local strain in these regions is approximately three times in amplitude that of the surrounding strain field. The widths of the peaks correlate well with the widths of the defects. Regions of large strain gradients on either side of the defect indicate the extreme stress concentration caused by the simulated 3mm out-of-plan waviness and the ability of the distributed optical measurement technique to resolve critical small scale features that might go undetected with single point sensors.
On both the HP and LP blade surfaces the optical fiber is bonded along the length of the spar cap and is displaced approximately 10 mm to the trailing edge side of the foil gages. Along the leading edge the fibers are bonded 10 mm on either side of the foil gages. There is relatively good agreement between the fiber optic data and electrical gage data. Table 1 presents error
Meters [m]
Str
ain
[ ]
3 4 5 6 7 6 5 4 3-500
0
500
1000
1500

between the foil gages and fiber optic strain data for the HP and LP spar cap region. Fiber optic data were averaged over 1cm to compare with the longer gage length of the foil gages.
Figure 6. Surface Mounted Fiber Optic Strain Data with Co-Located Foil Strain Gages on CX-100 under 500lb Load Prior to Fatigue Test along Spar (upper) and Leading Edge (lower).
Table 1. Comparative data between distributed fiber optic sensor and electrical foil gages.
Fiber Electrical Foil
Gage Foil Gage Strain
[] Fiber Optic Strain Avg over 1cm []
Difference [%]
LP Spar 1.20 m SG-1200-LP -250.32 -306.21 22.33 HP Spar 1.20 m SG-1200-HP 297.26 341.41 14.86 LP Spar 3.00 m SG-3000-LP -438.73 -443.84 1.16 HP Spar 3.00 m SG-3000-HP 467.61 511.06 9.29 LP Spar 4.50 m SG-4500-LP -567.20 -624.14 10.04 HP Spar 4.50 m SG-4500-HP 607.05 732.97 20.74 LP Spar 5.50 m SG-5500-LP -605.80 -629.48 3.91 HP Spar 5.50 m SG-5500-HP 605.89 645.49 6.53 The average difference between the fiber optic and foil strain gage data is 11.1%. The magnitude of the fiber optic strain data is consistently higher than that of the foil gages, possibly a result of the 10mm offset in the chordwise direction. In addition, there appear to be consistent trends in the differences that correlate with the blade station locations on both the HP and LP
Meters [m]
Str
ain
[ ]
0 1 2 3 4 5 6 7-2000
-1000
0
1000
2000 High Pressure Strain (HP Fiber)Low Pressure Strain (LP Fiber)High Pressure Strain GagesLow Pressure Strain Gages
Meters [m]
Str
ain
[ ]
0 1 2 3 4 5 6 7-2000
-1000
0
1000
2000 Leading Edge Strain (HP Fiber)Leading Edge Strain (LP Fiber)Leading Edge Strain Gages

sides of the blade. It would be interesting to section the blade to determine exact locations of the foil gages and fiber with respect to the spar cap and shear web. Noise in the strain data is determined by examining variations in the measurement with the fiber under no strain. The noise in all cases is less than +/-5. In embedded or surface attached regions of the data there are much larger and repeatable variations in the strain measurement believed to be a result of structure in the composite material – the average structure is approximately +/-40 in the spar cap surface fiber, +/-15in the leading edge surface fiber regions, and +/-40in the embedded fibers.
4.3 Strain Measurements During Fatigue Testing
Static distributed strain measurements were taken on all eight embedded and three surface attached fibers periodically throughout the fatigue testing as the blade accumulated cycles. Data were taken with the blade under +/- 500 lbs load, -325 lbs load and under no load. The high sensitivity and spatial resolution of the OFDR technology enabled the data presented in Figure 7 - Figure 13 to be taken under no load, which eliminated any uncertainty in results due to variations in applied load. Data are presented for fibers embedded in the +/-45 layer directly under the defects and in the triax 18 layer above the defects. Measurements are referenced to the strain in the blade while it was supported at both ends during instrumentation. The global strain profile is a result of the blade being subject to its own weight when mounted in the test stand. Immediately obvious are the three defects in the blade at stations 3500, 5000, and 6000 as the fiber crosses them once on the way out to the 7 meter blade station and then crosses them a second time on the way back to the root (plotted continuously along the x axis). Local stains corresponding to the defects vary in amplitude, with the largest occurring at the 5meter blade location on the HP side. It will be shown in this series of Figures that this defect at 5 meters on the HP side accumulates damage at a much faster rate than the other defects, and that this defect ultimately causes failure of the blade at 1968k cycles. Data shown in Figure 7 and Figure 8 are nearly identical and indicate that not much change occurs in the blade over the first couple hundred thousand cycles. These data also demonstrate the repeatability in the strain measurement; the amplitude of the second defect remains consistently higher than those of the other defects. By cycle 614k, the local strain surrounding the defect at 5 meters has grown significantly; this trend continues in Figure 10. It is interesting to note that between cycles 227k and 560k the NWTC detected low level acoustic emission from the blade in the region of the 5 and 6 meter defects. In Figure 11, representing 1184k cycles, the optical fiber in the composite layer under the defects has broken as it passes the 5 meter defect on the return, or leading edge side of the spar cap. By 1716k cycles, Figure 12, the same fiber has broken now as it passes the trailing edge side of that defect on its way out. The lower graph now shows an intensifying of the strain surrounding the 5 meter defect in the fiber embedded above the defect. In Figure 13, at 1803k cycles, the fiber located above the defects has broken, although a signal is still recovered over a significant region of the fiber. By the final data set, which is taken post failure after 1968k cycles, none of the embedded fibers in the HP side of the blade remains intact.

Figure 7. Distributed Strain in Embedded Fibers Located in +/-45 layer Under Defects (above) and in Triax 18 layer Above Defects (below) on HP and LP side of blade, 0 cycles.
Figure 8 Distributed Strain in Embedded Fibers Located in +/-45 layer Under Defects (above) and in Triax 18 layer Above Defects (below) on HP and LP side of blade, 204k cycles.
Meters [m]
Str
ain
[ ]
3 4 5 6 7 6 5 4 3-5000
0
5000
High Pressure Strain, Fiber Under DefectsLow Pressure Strain, Fiber Under Defects
Meters [m]
Str
ain
[ ]
3 4 5 6 7 6 5 4 3-5000
0
5000
High Pressure Strain, Fiber Over DefectsLow Pressure Strain, Fiber Over Defects
Meters [m]
Str
ain
[ ]
3 4 5 6 7 6 5 4 3-5000
0
5000
High Pressure Strain, Fiber Under DefectsLow Pressure Strain, Fiber Under Defects
Meters [m]
Str
ain
[ ]
3 4 5 6 7 6 5 4 3-5000
0
5000
High Pressure Strain, Fiber Over DefectsLow Pressure Strain, Fiber Over Defects

Figure 9. Distributed Strain in Embedded Fibers Located in +/-45 layer Under Defects (above) and in Triax 18 layer Above Defects (below) on HP and LP side of blade, 614k cycles.
Figure 10 Distributed Strain in Embedded Fibers Located in +/-45 layer Under Defects (above) and in Triax 18 layer Above Defects (below) on HP and LP side of blade, 736k cycles.
Meters [m]
Str
ain
[ ]
3 4 5 6 7 6 5 4 3-5000
0
5000
High Pressure Strain, Fiber Under DefectsLow Pressure Strain, Fiber Under Defects
Meters [m]
Str
ain
[ ]
3 4 5 6 7 6 5 4 3-5000
0
5000
High Pressure Strain, Fiber Over DefectsLow Pressure Strain, Fiber Over Defects
Meters [m]
Str
ain
[ ]
3 4 5 6 7 6 5 4 3-5000
0
5000
High Pressure Strain, Fiber Under DefectsLow Pressure Strain, Fiber Under Defects
Meters [m]
Str
ain
[ ]
3 4 5 6 7 6 5 4 3-5000
0
5000
High Pressure Strain, Fiber Over DefectsLow Pressure Strain, Fiber Over Defects

Figure 11. Distributed Strain in Embedded Fibers Located in +/-45 layer Under Defects (above) and in Triax 18 layer Above Defects (below) on HP and LP side of blade, 1184k cycles.
Figure 12 Distributed Strain in Embedded Fibers Located in +/-45 layer Under Defects (above) and in Triax 18 layer Above Defects (below) on HP and LP side of blade, 1716k cycles.
Meters [m]
Str
ain
[ ]
3 4 5 6 7 6 5 4 3-5000
0
5000
High Pressure Strain, Fiber Under DefectsLow Pressure Strain, Fiber Under Defects
Meters [m]
Str
ain
[ ]
3 4 5 6 7 6 5 4 3-5000
0
5000
High Pressure Strain, Fiber Over DefectsLow Pressure Strain, Fiber Over Defects
Meters [m]
Str
ain
[ ]
3 4 5 6 7 6 5 4 3-5000
0
5000
High Pressure Strain, Fiber Under DefectsLow Pressure Strain, Fiber Under Defects
Meters [m]
Str
ain
[ ]
3 4 5 6 7 6 5 4 3-5000
0
5000
High Pressure Strain, Fiber Over DefectsLow Pressure Strain, Fiber Over Defects
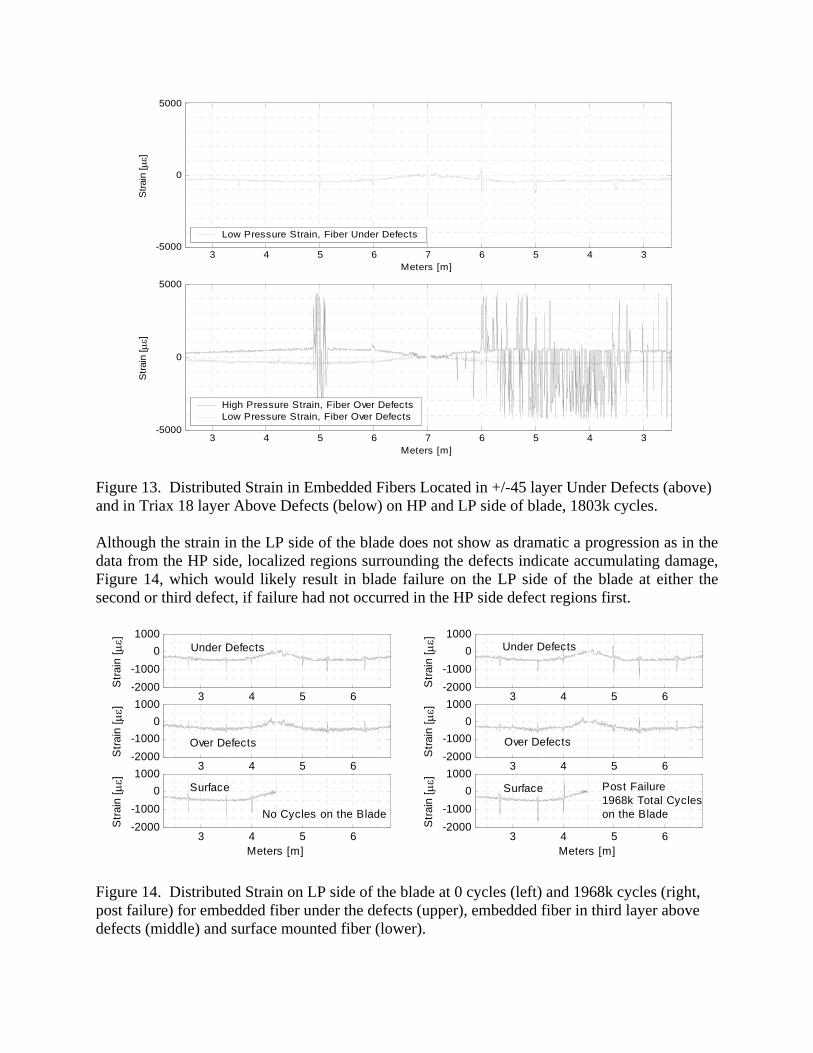
Figure 13. Distributed Strain in Embedded Fibers Located in +/-45 layer Under Defects (above) and in Triax 18 layer Above Defects (below) on HP and LP side of blade, 1803k cycles. Although the strain in the LP side of the blade does not show as dramatic a progression as in the data from the HP side, localized regions surrounding the defects indicate accumulating damage, Figure 14, which would likely result in blade failure on the LP side of the blade at either the second or third defect, if failure had not occurred in the HP side defect regions first.
Figure 14. Distributed Strain on LP side of the blade at 0 cycles (left) and 1968k cycles (right, post failure) for embedded fiber under the defects (upper), embedded fiber in third layer above defects (middle) and surface mounted fiber (lower).
Meters [m]
Str
ain
[ ]
3 4 5 6 7 6 5 4 3-5000
0
5000
Low Pressure Strain, Fiber Under Defects
Meters [m]
Str
ain
[ ]
3 4 5 6 7 6 5 4 3-5000
0
5000
High Pressure Strain, Fiber Over DefectsLow Pressure Strain, Fiber Over Defects
Str
ain
[ ]
3 4 5 6-2000
-1000
0
1000
Str
ain
[ ]
3 4 5 6-2000
-1000
0
1000
Meters [m]
Str
ain
[ ]
3 4 5 6-2000
-1000
0
1000
Str
ain
[ ]
3 4 5 6-2000
-1000
0
1000
Str
ain
[ ]
3 4 5 6-2000
-1000
0
1000
Meters [m]
Str
ain
[ ]
3 4 5 6-2000
-1000
0
1000
Under Defects
Over Defects
Surface
No Cycles on the Blade
Under Defects
Over Defects
Surface Post Failure1968k Total Cycles on the Blade

Data in Figure 15 are the maximum strain amplitudes in the HP (upper) and LP (lower ) 5 meter defect region as the blade is cycled to failure - in the layer of the composite under the defect, three layers over the defect, and on the surface. Unfortunately, the HP surface fiber was broken early in the testing process. The embedded fiber in each layer crosses the defect twice, and both measurements are plotted. This figure clearly shows significant damage in this defect area developing early in the test on the HP side (as early as cycle 614k) in the +/-45 layer under the defect, where the fibers experience localized regions of higher tension from the start. Damage then spreads to the layers above the defect (cycle 1716k for the triax 18 layer). The fibers located above the defects are placed in localized compression at the initiation of the test, and later they experience localized tension. The same defect on the LP surface is substantially less active. These results indicate that embedded distributed fiber sensing is a valuable SHM technology, capable of forecasting potential blade failure with sufficient time for repairs.
Figure 15. Maximum strain surrounding the 5m defect on the HP (top) and LP (bottom) sides
5. CONCLUSIONS
High resolution distributed fiber optic strain sensing is used to detect intentionally introduced defects in a 9-meter wind turbine blade following a VARTM manufacturing process and to measure accumulating damage resulting from these defects as the blade is cycled to failure. Standard optical fiber was embedded in four layers of the carbon spar cap at lay-up and was surface mounted along the spar cap after final blade assembly. The fiber was interrogated with an Optical Backscatter Reflectometer with the blade under a 500 lb load; data compared well with electrical foil gages. Throughout the fatigue test the fibers were interrogated while the blade was under no applied load; embedded and surface mounted fibers show clear evidence of increasing strain in several of the defect locations, and accurately predict the failure location before half the cycles to failure have been completed. Results provide an unprecedented view into the strain field within a composite wind turbine blade throughout its manufacturing process and fatigue testing, with millimeter scale resolution. Embedded fiber optic sensing using Optical
Thousands of Cycles on the Blade
Max
imum
Strai
n, 5
.0 m
eter
Def
ect [ ]
0 200 400 600 800 1000 1200 1400 1600 1800 2000-1000
0
1000
2000
3000
4000
5000
High PressureSide of the Blade
Thousands of Cycles on the Blade
Max
imum
Str
ain,
5.0
met
er D
efec
t [ ]
0 200 400 600 800 1000 1200 1400 1600 1800 2000-1000
0
1000
2000
3000
4000
5000+ Under Defect, First Pass* Under Defect, Second Pass+ Over Defect, First Pass* Over Defect, Second Pass* Surface Attached Low Pressure Side of the Blade

Frequency Domain Reflectometry has the potential to provide a sensing solution throughout the life cycle of composite components.
6. ACKNOWLEDGEMENTS
Luna Innovations Incorporated gratefully acknowledges the University of Massachusetts Lowell’s Wind Energy Research Group (WERG) for allowing us to participate in the Effect of Defects test, funded by the Department of Energy, as well as the National Renewable Energy Laboratory’s National Wind Technology Center (NWTC) for their support and expertise in testing the instrumented blade, and TPI Composites for their assistance in the blade manufacture.
7. REFERENCES
1. Berry, D. “Wind Turbine Blades Blade Mfg Improvements and Issues”. Wind Turbine Blade Reliability Workshop, Albuquerque, New Mexico, February 24-25, 2004. http://www.sandia.gov/wind/04Presentations.htm.
2. A. J. Rogers, “Distributed optical-fibre sensing,” Meas. Sci. Technol. 10, 75-99 (1999).
3. M. A. Davis, A. D. Kersey, “Simultaneous measurement of temperature and strain using fiber Bragg gratings and Brillouin scattering,” Proc. SPIE, 2838, 114-123 (1996).
4. M. Froggatt and J. Moore, “High resolution strain measurement in optical fiber with Rayleigh scatter,” Appl. Opt., 37, 1735-1740 (1998).
5. M. Froggatt, B. Soller, D. Gifford, and M. Wolfe, “Correlation and keying of Rayleigh scatter for loss and temperature sensing in parallel optical networks,” OFC Technical Digest, paper PDP 17 (Los Angeles, March 2004).
6. B. J. Soller, D. K. Gifford, M. S. Wolfe, M. E. Froggatt, M. H. Yu, and P. F. Wysocki, “Measurement of localized heating in fiber optic components with millimeter spatial resolution,” OFC Technical Digest, paper OFN 3, 2006.
7. S. Kreger, D. K. Gifford, M. E. Froggatt, B. J. Soller, and M. S. Wolfe, "High resolution distributed strain or temperature measurements in single- and multi-mode fiber using swept-wavelength interferometry," OFS 18 Technical Digest, Paper ThE42, 2006
8. R.M. Measures, Structural Monitoring with Fiber Optic Technology, 2001, San Diego, California: Academic Press
9. L. Jinsong and A. Asundi, “Structural Health Monitoring of Smart Composite Materials by using EFPI and FBG sensors, Sensors and Actuators,” A: Physical 2003; 103(3): p. 330-340.
10. Guemes, A. Fernandez-Lopez, and B. Soller, Structural Health Monitoring, 9 (3), 2010, pp. 233-245
11. Kaplan, A., Klute, S. M., Heaney, A., “Distributed Optical Fiber Sensing for Wind Blade Strain Monitoring and Defect Detection.” The 8th International Workshop on Structural Health Monitoring. Stanford, California, Sept. 13-15, 2011. CD-ROM expected.
12. Klute, S. M., Sang, A. K., Gifford, D. K., Froggatt, M. E., “Defect Detection During Manufacture of Composite Wind Turbine Blade with Embedded Fiber Optic Distributed Strain Sensor,” 2011 SAMPE Fall Technical Conference, Ft. Worth, Texas, Oct. 17-20, 2011.