emc storage analytics · emc storage analytics 3.1.1 installation and user guide 3. ... emc storage...
TRANSCRIPT
EMC® Storage AnalyticsVersion 3.1.1
Installation and User Guide302-001-532 REV 03
Copyright © 2014-2015 EMC Corporation. All rights reserved. Published in USA.
Published April, 2015
EMC believes the information in this publication is accurate as of its publication date. The information is subject to changewithout notice.
The information in this publication is provided as is. EMC Corporation makes no representations or warranties of any kind withrespect to the information in this publication, and specifically disclaims implied warranties of merchantability or fitness for aparticular purpose. Use, copying, and distribution of any EMC software described in this publication requires an applicablesoftware license.
EMC², EMC, and the EMC logo are registered trademarks or trademarks of EMC Corporation in the United States and othercountries. All other trademarks used herein are the property of their respective owners.
For the most up-to-date regulatory document for your product line, go to EMC Online Support (https://support.emc.com).
EMC CorporationHopkinton, Massachusetts 01748-91031-508-435-1000 In North America 1-866-464-7381www.EMC.com
2 EMC Storage Analytics 3.1.1 Installation and User Guide
5
7
Introduction 9
Overview....................................................................................................... 10References.................................................................................................... 11Terminology.................................................................................................. 12
Installation and Licensing 13
Installation overview..................................................................................... 14Installation and operating requirements........................................................16Installing vRealize Operations Manager.........................................................19Installing the EMC Adapter and dashboards.................................................. 20Installing Navisphere CLI............................................................................... 20Configuring a secure connection for VMAX adapters...................................... 21Adapter instances......................................................................................... 23
Adding an EMC Adapter instance for vCenter.................................... 23Adding EMC Adapter instances for your storage system....................26Editing EMC Adapter instances for your storage system....................30
EMC Storage Analytics Dashboards 31
Topology mapping.........................................................................................32VNX Block topology..........................................................................33VNX File topology............................................................................. 34VMAX topology.................................................................................35VMAX3 topology...............................................................................37VNXe topology................................................................................. 38VPLEX Local topology....................................................................... 39VPLEX Metro topology...................................................................... 40XtremIO topology............................................................................. 42RecoverPoint for Virtual Machines topology......................................43
EMC dashboards........................................................................................... 44Storage Topology dashboard............................................................44Storage Metrics dashboard.............................................................. 46VNX Overview dashboard................................................................. 47VMAX Overview dashboard.............................................................. 49VNXe Overview dashboard............................................................... 52VPLEX Overview dashboard..............................................................53VPLEX Performance dashboard.........................................................54VPLEX Communication dashboard....................................................56XtremIO Overview dashboard........................................................... 57XtremIO Performance dashboard......................................................58RecoverPoint Overview dashboard................................................... 58RecoverPoint for Virtual Machines Performance dashboard.............. 59Topology dashboards.......................................................................60
Figures
Tables
Chapter 1
Chapter 2
Chapter 3
CONTENTS
EMC Storage Analytics 3.1.1 Installation and User Guide 3
Metrics dashboards......................................................................... 61Top-N dashboards............................................................................62Dashboard XChange.........................................................................64
Resource Kinds and Metrics 65
VNX Block metrics......................................................................................... 66VNX File metrics............................................................................................ 76VMAX metrics................................................................................................83VNXe metrics.................................................................................................86VPLEX metrics............................................................................................... 94XtremIO metrics.......................................................................................... 107RecoverPoint for Virtual Machines metrics...................................................112
Troubleshooting 117
Badges for monitoring resources.................................................................118Navigating inventory trees...........................................................................118EMC symptoms, alerts, and recommendations............................................ 119Event correlation......................................................................................... 120
Viewing all alerts............................................................................120Finding resource alerts...................................................................121Locating alerts that affect the health score for a resource............... 121List of alerts and notifications........................................................ 121
Launching Unisphere.................................................................................. 139Installation logs.......................................................................................... 139Log Insight overview....................................................................................140
Log Insight configuration................................................................140Sending logs to Log Insight............................................................ 141
Error handling and event logging................................................................. 143Viewing error logs.......................................................................... 143Creating and downloading a support bundle.................................. 143
Log file sizes and rollover counts.................................................................144Finding adapter instance IDs.......................................................... 144Configuring log file sizes and rollover counts..................................144Activating configuration changes................................................... 145Verifying configuration changes..................................................... 145
Editing the Collection Interval for a resource................................................146Configuring the thread count for an adapter instance.................................. 146Connecting to vRealize Operations Manager by using SSH.......................... 147Frequently Asked Questions........................................................................148
Chapter 4
Chapter 5
CONTENTS
4 EMC Storage Analytics 3.1.1 Installation and User Guide
EMC adapter architecture...............................................................................................11VNX Block topology....................................................................................................... 33VNX File topology...........................................................................................................34VMAX topology.............................................................................................................. 35VMAX3 topology............................................................................................................ 37VNXe topology............................................................................................................... 38VPLEX Local topology.....................................................................................................39VPLEX Metro topology....................................................................................................41XtremIO topology...........................................................................................................42RecoverPoint for Virtual Machines topology................................................................... 43
12345678910
FIGURES
EMC Storage Analytics 3.1.1 Installation and User Guide 5

FIGURES
6 EMC Storage Analytics 3.1.1 Installation and User Guide
Licensing options for vRealize Operations Manager....................................................... 14Installation and upgrade options................................................................................... 15Dashboard-to-product matrix.........................................................................................44VNX Block metrics for Array............................................................................................66VNX Block metrics for Disk.............................................................................................66VNX Block metrics for FAST Cache..................................................................................67VNX Block metrics for Pool LUN......................................................................................68VNX Block metrics for RAID Group.................................................................................. 70VNX Block metrics for RAID Group LUN........................................................................... 70VNX Block metrics for SP Front-end Port......................................................................... 71VNX Block metrics for Storage Pool................................................................................ 72VNX Block metrics for Storage Processor........................................................................73VNX Block metrics for Tier.............................................................................................. 74VNX File metrics for Array............................................................................................... 76VNX File metrics for Data Mover..................................................................................... 76VNX File metrics for dVol................................................................................................80VNX File metrics for File Pool.......................................................................................... 81VNX File metrics for File System..................................................................................... 81VMAX metrics for Device................................................................................................ 83VMAX metrics for FAST VP Policy.................................................................................... 83VMAX metrics for Front-End Director ..............................................................................84VMAX metrics for Front-End Port ....................................................................................84VMAX metrics for Remote Replica Group ....................................................................... 84VMAX metrics for SRDF Director .....................................................................................84VMAX metrics for Storage Group.................................................................................... 85VMAX metrics for Thin Pool ........................................................................................... 85VMAX3 metrics for Storage Resource Pool......................................................................85VNXe metrics for EMC Adapter Instance......................................................................... 86VNXe metrics for Disk.................................................................................................... 86VNXe metrics for Fast Cache...........................................................................................87VNXe metrics for File System..........................................................................................87VNXe metrics for LUN..................................................................................................... 87VNXe metrics for Storage Pool........................................................................................88VNXe metrics for Storage Processor............................................................................... 88VNXe metrics for Tier......................................................................................................93VPLEX metrics for Cluster............................................................................................... 94VPLEX metrics for Director ............................................................................................. 96VPLEX metrics for Distributed Device .............................................................................99VPLEX metrics for Engine .............................................................................................100VPLEX metrics for Ethernet Port ................................................................................... 101VPLEX metrics for Extent Device .................................................................................. 101VPLEX metrics for FC Port ............................................................................................ 101VPLEX metrics for Local Device ....................................................................................102VPLEX metrics for Storage Array .................................................................................. 103VPLEX metrics for Storage View....................................................................................103VPLEX metrics for Storage Volume ...............................................................................104VPLEX metrics for Virtual Volume ................................................................................ 104VPLEX metrics for VPLEX Metro ....................................................................................106XtremIO metrics for Cluster.......................................................................................... 107XtremIO metrics for Data Protection Group...................................................................109XtremIO metrics for Snapshot...................................................................................... 109
123456789101112131415161718192021222324252627282930313233343536373839404142434445464748495051
TABLES
EMC Storage Analytics 3.1.1 Installation and User Guide 7
XtremIO metrics for SSD...............................................................................................110XtremIO metrics for Storage Controller......................................................................... 110XtremIO metrics for Volume......................................................................................... 111XtremIO metrics for X-Brick.......................................................................................... 112RecoverPoint metrics for Cluster.................................................................................. 112RecoverPoint metrics for Consistency Group................................................................ 113RecoverPoint metrics for Copy......................................................................................113RecoverPoint metrics for Journal Volume......................................................................114RecoverPoint metrics for Link.......................................................................................114RecoverPoint metrics for RecoverPoint Appliance (RPA)............................................... 114RecoverPoint metrics for RecoverPoint for Virtual Machines System............................. 115RecoverPoint metrics for Replication Set......................................................................115RecoverPoint metrics for Repository Volume ............................................................... 115RecoverPoint metrics for Splitter ................................................................................. 115RecoverPoint metrics for User Volume..........................................................................115List of VMAX alerts.......................................................................................................122List of VNX Block alerts................................................................................................ 123List of VNX Block notifications..................................................................................... 127List of VNX File alerts................................................................................................... 129List of VNX File notifications.........................................................................................132List of VNXe alerts........................................................................................................137
525354555657585960616263646566676869707172
TABLES
8 EMC Storage Analytics 3.1.1 Installation and User Guide
CHAPTER 1
Introduction
This chapter contains the following topics:
l Overview............................................................................................................... 10l References............................................................................................................ 11l Terminology.......................................................................................................... 12
Introduction 9
OverviewVMware vRealize Operations Manager is a software product that collects performanceand capacity data from monitored software and hardware resources. It provides userswith real‐time information about potential problems in the enterprise.
vRealize Operations Manager presents data and analysis in several ways:
l Through alerts that warn of potential or occurring problems.
l In configurable dashboards and predefined pages that show commonly neededinformation.
l In predefined reports.
EMC®
Storage Analytics links vRealize Operations Manager with an EMC adapter. Theadapter is bundled with a connector that enables vRealize Operations Manager to collectperformance metrics. The adapter is installed with the vRealize Operations Manager userinterface.
The connector types are shown in Figure 1 on page 11.
EMC Storage Analytics uses the power of existing vCenter features to aggregate data frommultiple sources and process the data with proprietary analytic algorithms.
EMC Storage Analytics complies with VMware management pack certificationrequirements and has received the VMware Ready certification.
Introduction
10 EMC Storage Analytics 3.1.1 Installation and User Guide
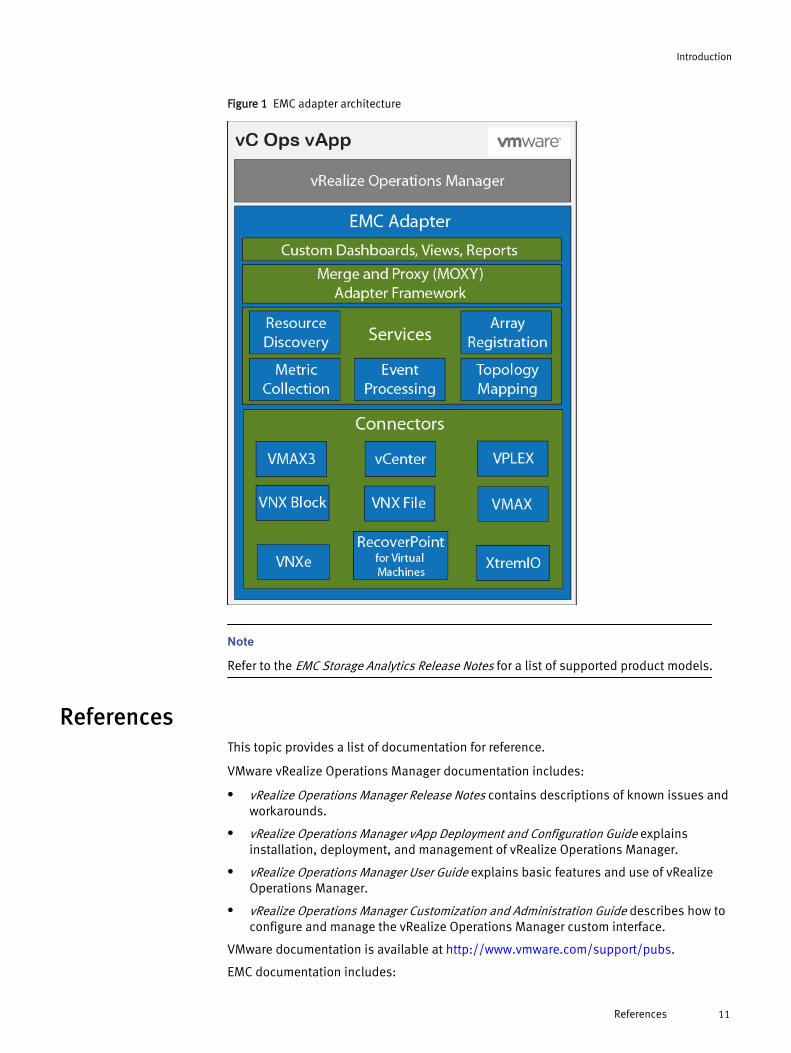
Figure 1 EMC adapter architecture
Note
Refer to the EMC Storage Analytics Release Notes for a list of supported product models.
ReferencesThis topic provides a list of documentation for reference.
VMware vRealize Operations Manager documentation includes:
l vRealize Operations Manager Release Notes contains descriptions of known issues andworkarounds.
l vRealize Operations Manager vApp Deployment and Configuration Guide explainsinstallation, deployment, and management of vRealize Operations Manager.
l vRealize Operations Manager User Guide explains basic features and use of vRealizeOperations Manager.
l vRealize Operations Manager Customization and Administration Guide describes how toconfigure and manage the vRealize Operations Manager custom interface.
VMware documentation is available at http://www.vmware.com/support/pubs.
EMC documentation includes:
Introduction
References 11
l EMC Storage Analytics Release Notes provides a list of the latest supported features,licensing information, and known bugs.
l EMC Storage Analytics Installation and User Guide (this document) provides installationand licensing instructions, a list of resource kinds and their metrics, and informationabout storage topologies and dashboards.
TerminologyThis topic contains a list of commonly used terms.
adapterA vRealize Operations Manager component that collects performance metrics froman external source like a vCenter or storage system. Third-party adapters such as theEMC Adapter are installed on the vRealize Operations Manager server to enablecreation of adapter instances within vRealize Operations Manager.
adapter instanceA specific external source of performance metrics, such as a specific storage system.An adapter instance resource is an instance of an adapter that has a one-to-onerelationship with an external source of data, such as a VNX storage system.
dashboardA tab on the home page of the vRealize Operations Manager GUI. vRealizeOperations Manager ships with default dashboards. Dashboards are also fullycustomizable by the end user.
health ratingAn overview of the current state of any resource, from an individual operation to anentire enterprise. vRealize Operations Manager checks internal metrics for theresource and uses its proprietary analytics formulas to calculate an overall healthscore on a scale of 0 to 100.
iconA pictorial element in a widget that enables a user to perform a specific function.Hovering over an icon displays a tooltip that describes the function.
metricA category of data collected for a resource. For example, the number of readoperations per second is one of the metrics collected for each LUN resource.
resourceAny entity in the environment for which vRealize Operations Manager can collectdata. For example, LUN 27 is a resource.
resource kindA general type of a resource, such as LUN or DISK. The resource kind dictates thetype of metrics collected.
widgetAn area of the EMC Storage Analytics graphical user interface (GUI) that displaysmetrics-related information. A user can customize widgets to their ownenvironments.
Introduction
12 EMC Storage Analytics 3.1.1 Installation and User Guide
CHAPTER 2
Installation and Licensing
This chapter contains the following topics:
l Installation overview............................................................................................. 14l Installation and operating requirements................................................................16l Installing vRealize Operations Manager.................................................................19l Installing the EMC Adapter and dashboards.......................................................... 20l Installing Navisphere CLI....................................................................................... 20l Configuring a secure connection for VMAX adapters.............................................. 21l Adapter instances................................................................................................. 23
Installation and Licensing 13
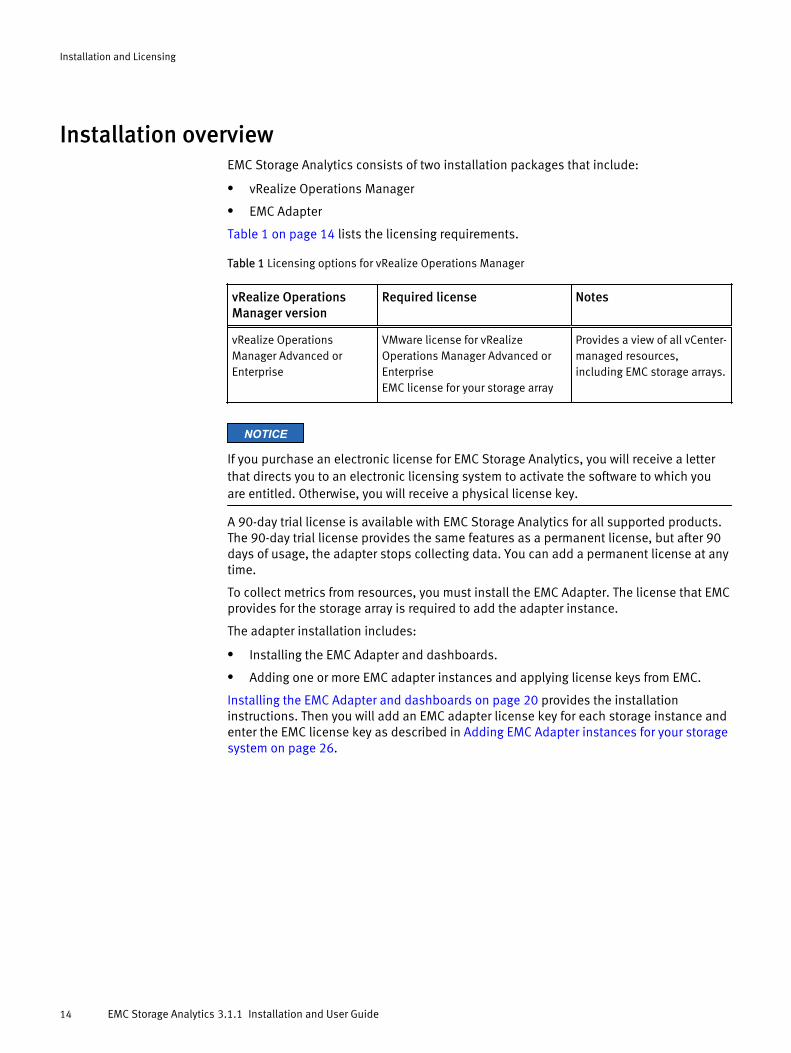
Installation overviewEMC Storage Analytics consists of two installation packages that include:
l vRealize Operations Manager
l EMC Adapter
Table 1 on page 14 lists the licensing requirements.
Table 1 Licensing options for vRealize Operations Manager
vRealize OperationsManager version
Required license Notes
vRealize OperationsManager Advanced orEnterprise
VMware license for vRealizeOperations Manager Advanced orEnterpriseEMC license for your storage array
Provides a view of all vCenter-managed resources,including EMC storage arrays.
NOTICE
If you purchase an electronic license for EMC Storage Analytics, you will receive a letterthat directs you to an electronic licensing system to activate the software to which youare entitled. Otherwise, you will receive a physical license key.
A 90-day trial license is available with EMC Storage Analytics for all supported products.The 90-day trial license provides the same features as a permanent license, but after 90days of usage, the adapter stops collecting data. You can add a permanent license at anytime.
To collect metrics from resources, you must install the EMC Adapter. The license that EMCprovides for the storage array is required to add the adapter instance.
The adapter installation includes:
l Installing the EMC Adapter and dashboards.
l Adding one or more EMC adapter instances and applying license keys from EMC.
Installing the EMC Adapter and dashboards on page 20 provides the installationinstructions. Then you will add an EMC adapter license key for each storage instance andenter the EMC license key as described in Adding EMC Adapter instances for your storagesystem on page 26.
Installation and Licensing
14 EMC Storage Analytics 3.1.1 Installation and User Guide
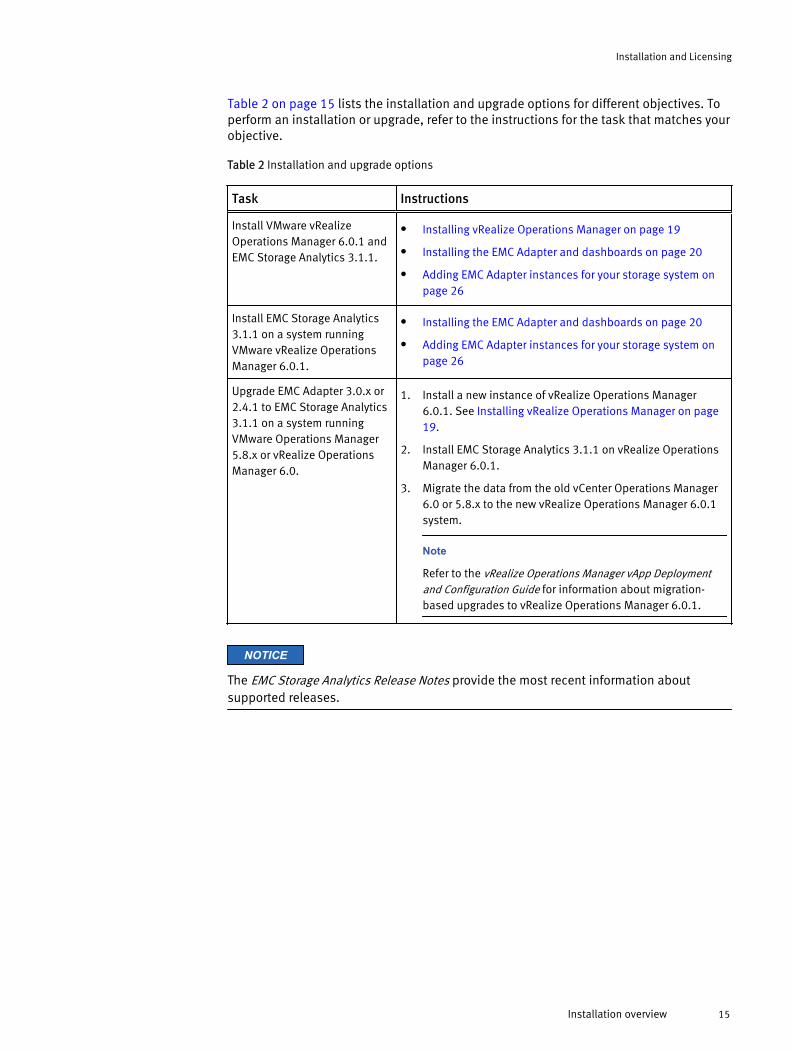
Table 2 on page 15 lists the installation and upgrade options for different objectives. Toperform an installation or upgrade, refer to the instructions for the task that matches yourobjective.
Table 2 Installation and upgrade options
Task Instructions
Install VMware vRealizeOperations Manager 6.0.1 andEMC Storage Analytics 3.1.1.
l Installing vRealize Operations Manager on page 19
l Installing the EMC Adapter and dashboards on page 20
l Adding EMC Adapter instances for your storage system onpage 26
Install EMC Storage Analytics3.1.1 on a system runningVMware vRealize OperationsManager 6.0.1.
l Installing the EMC Adapter and dashboards on page 20
l Adding EMC Adapter instances for your storage system onpage 26
Upgrade EMC Adapter 3.0.x or2.4.1 to EMC Storage Analytics3.1.1 on a system runningVMware Operations Manager5.8.x or vRealize OperationsManager 6.0.
1. Install a new instance of vRealize Operations Manager6.0.1. See Installing vRealize Operations Manager on page19.
2. Install EMC Storage Analytics 3.1.1 on vRealize OperationsManager 6.0.1.
3. Migrate the data from the old vCenter Operations Manager6.0 or 5.8.x to the new vRealize Operations Manager 6.0.1system.
Note
Refer to the vRealize Operations Manager vApp Deploymentand Configuration Guide for information about migration-based upgrades to vRealize Operations Manager 6.0.1.
NOTICE
The EMC Storage Analytics Release Notes provide the most recent information aboutsupported releases.
Installation and Licensing
Installation overview 15
Installation and operating requirementsBefore installing the EMC Adapter, verify that these installation and operatingrequirements are satisfied.
EMC Adapter requirements
Supported vRealize Operations Manager versions
l vRealize Operations Manager Advanced or Enterprise editions from VMware
Note
EMC Storage Analytics does not support vRealize Operations ManagerFoundation and Standard editions.
Deploy the vApp for vRealize Operations Manager before installing the EMC Adapter.Check the vRealize Operations Manager vApp Deployment and Configuration Guide at http://www.vmware.com/support/pubs for system requirements pertaining to yourversion of vRealize Operations Manager.
Supported product modelsSee the EMC Storage Analytics Release Notes for a complete list of supported productmodels.
Supported web browserSee the latest vRealize Operations Manager release notes for a list of supportedbrowsers.
VNX Block systemsThe EMC Adapter uses naviseccli to collect metrics from VNX Block systems. It isbundled into the EMC Adapter install file and is automatically installed along withthe adapter. Storage processors require IP addresses that are reachable from thevRealize Operations Manager server. Bidirectional traffic for this connection flowsthrough port 443 (HTTPS). Statistics logging must be enabled on each storageprocessor (SP) for metric collection (System > System Properties > Statistics Loggingin Unisphere).
VNX File systemsCLI commands issued on the Control Station direct the EMC Adapter to collectmetrics from VNX File systems. The Control Station requires an IP address that isreachable from the vRealize Operations Manager server. Bidirectional Ethernet trafficflows through port 22 using Secure Shell (SSH). If you are using the EMC VNXnas_stig script for security (/nas/tools/nas_stig), do not use root in thepassword credentials. Setting nas_stig On limits direct access for root accounts,preventing the adapter instance from collecting metrics for VNX File.
EMC SMI-S Provider for VMAX requirementsThe EMC SMI-S Provider for VMAX must be on the network and accessible throughsecure port 5989 (default) or nonsecure port 5988 for communication. If the EMCSMI-S Provider is also used for vSphere vStorage API for Storage Awareness (VASA),follow the recommendations in the SMI-S Provider Release Notes to increase thenumber of available connections. The user configured in the EMC Adapter instanceand connecting to the SMI-S instance must have the role of monitor or administrator.See Configuring a secure connection for VMAX adapters on page 21 for steps toconfigure secure port 5989.
Installation and Licensing
16 EMC Storage Analytics 3.1.1 Installation and User Guide
VPLEX EMC adapter instanceOnly one EMC adapter instance is required for VPLEX Local or VPLEX Metro. You canmonitor both clusters in a VPLEX Metro by adding a single EMC adapter instance forone of the clusters. Adding an EMC adapter instance for each cluster in a VPLEXMetro introduces unnecessary stress on the system.
VPLEX data migrationsEMC VPLEX systems are commonly used to perform non-disruptive data migrations.When monitoring a VPLEX system with EMC Storage Analytics, a primary function isto perform analytics of trends on the storage system. When swapping a back-endstorage system on VPLEX, the performance and trends for the entire VPLEX storageenvironment are impacted. Therefore, EMC recommends that you start a new EMCStorage Analytics baseline for the VPLEX after data migration. To start a newbaseline:
1. Before you begin data migration, delete all resources associated with theexisting EMC Storage Analytics VPLEX adapter instance.
2. Remove the existing EMC Storage Analytics VPLEX adapter instance by using theManage Adapter Instances dialog.
3. Perform the data migration.
4. Create a new EMC Storage Analytics VPLEX adapter instance to monitor theupdated VPLEX system.
Optionally, you can stop the VPLEX adapter instance collects during the migrationcycle. When collects are restarted after the migration, orphaned VPLEX resources willappear in EMC Storage Analytics, but those resources will be unavailable. Removethe resources manually.
XtremIOEMC Storage Analytics uses REST APIs to interact with XtremIO arrays. Users mustspecify the IP address of the XtremIO Management Server (XMS) when adding anEMC Adapter for XtremIO.
If enhanced performance is required, administrators can configure the thread countfor the XtremIO adapter instance. See Configuring the thread count for an adapterinstance on page 146.
Minimum OE requirementsSee the EMC Storage Analytics Release Notes for a complete list of minimum OErequirements for supported product models.
User accountsTo create an EMC Adapter instance for a storage array, you must have a user accountthat allows you to connect to the storage array or EMC SMI-S Provider. For example,to add an EMC Adapter for a VNX array, use a global account with operator oradministrator role (a local account will not work).
To create an EMC Adapter instance for vCenter (where Adapter Kind = EMC Adapterand Connection Type = VMware vSphere), you must have an account that allows youaccess to vCenter and the objects it monitors. In this case, vCenter enforces accesscredentials (not the EMC Adapter). To create an EMC Adapter instance for vCenter,use, at minimum, an account assigned to the Read-Only role at the root of vCenter,and enable propagation of permissions to descendant objects. Depending on thesize of the vCenter, wait approximately 30 seconds before testing the EMC Adapter.More information on user accounts and access rights is available in the vSphereAPI/SDK Documentation (see information about authentication and authorization forESXi and vCenter Server).
Installation and Licensing
Installation and operating requirements 17
DNS configurationTo use the EMC Adapter, the vRealize Operations Manager vApp requires networkconnectivity to the storage systems to be monitored. DNS must be correctlyconfigured on the vRealize Operations Manager server to enable hostnameresolution by the EMC Adapter.
Time zone and synchronization settingsEnsure time synchronization for all EMC Storage Analytics resources by usingNetwork Time Protocol (NTP). Also, set correct time zones for EMC Storage Analyticsresources (including the EMC SMI-S Provider if using an adapter for VMAX) andrelated systems. Failure to observe these practices may affect the collection ofperformance metrics and topology updates.
Installation and Licensing
18 EMC Storage Analytics 3.1.1 Installation and User Guide
Installing vRealize Operations ManagerBefore you begin
l Obtain the OVA installation package for vRealize Operations Manager from VMware.
l Obtain a copy of the vRealize Operations Manager vApp Deployment and ConfigurationGuide at http://www.vmware.com/support/pubs.
Refer to the vRealize Operations Manager vApp Deployment and Configuration Guide todeploy the vApp for vRealize Operations Manager.
Procedure
1. Review the system requirements.
2. Follow the instructions to install vRealize Operations Manager and use the VMwarelicense that you received when prompted to assign the vRealize Operations Managerlicense.
3. Conclude the installation by following instructions to verify the vRealize OperationsManager installation.
Installation and Licensing
Installing vRealize Operations Manager 19
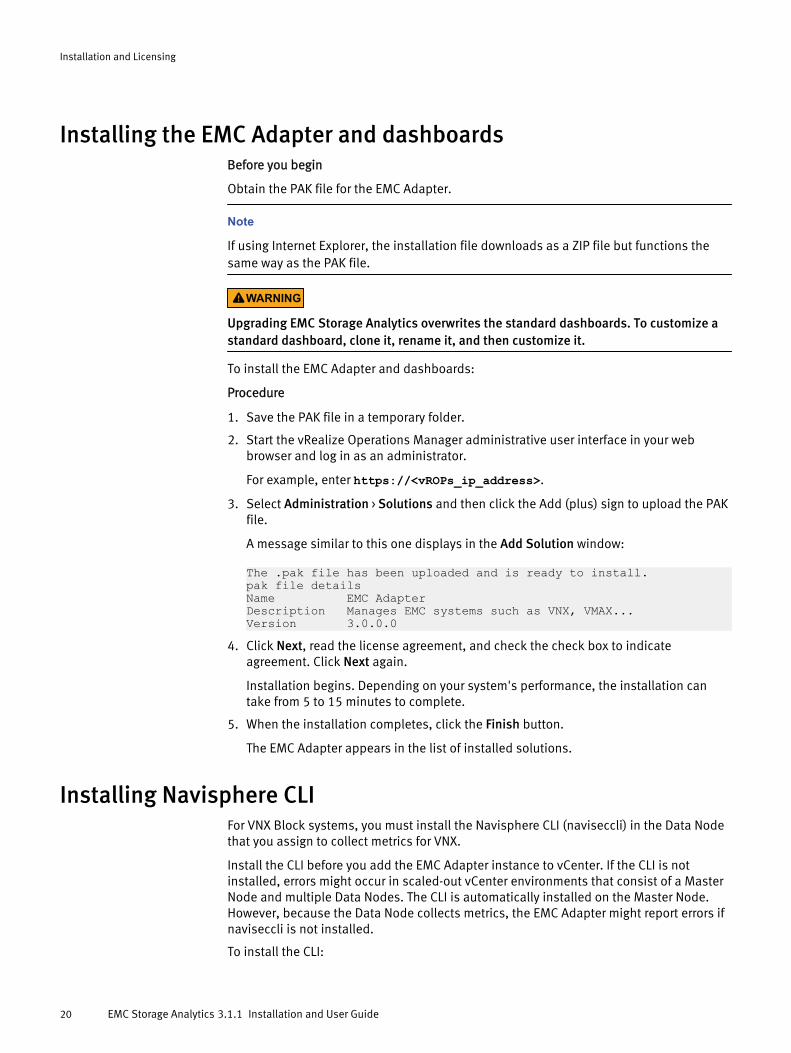
Installing the EMC Adapter and dashboardsBefore you begin
Obtain the PAK file for the EMC Adapter.
Note
If using Internet Explorer, the installation file downloads as a ZIP file but functions thesame way as the PAK file.
WARNING
Upgrading EMC Storage Analytics overwrites the standard dashboards. To customize astandard dashboard, clone it, rename it, and then customize it.
To install the EMC Adapter and dashboards:
Procedure
1. Save the PAK file in a temporary folder.
2. Start the vRealize Operations Manager administrative user interface in your webbrowser and log in as an administrator.
For example, enter https://<vROPs_ip_address>.
3. Select Administration > Solutions and then click the Add (plus) sign to upload the PAKfile.
A message similar to this one displays in the Add Solution window:
The .pak file has been uploaded and is ready to install.pak file detailsName EMC AdapterDescription Manages EMC systems such as VNX, VMAX...Version 3.0.0.0
4. Click Next, read the license agreement, and check the check box to indicateagreement. Click Next again.
Installation begins. Depending on your system's performance, the installation cantake from 5 to 15 minutes to complete.
5. When the installation completes, click the Finish button.
The EMC Adapter appears in the list of installed solutions.
Installing Navisphere CLIFor VNX Block systems, you must install the Navisphere CLI (naviseccli) in the Data Nodethat you assign to collect metrics for VNX.
Install the CLI before you add the EMC Adapter instance to vCenter. If the CLI is notinstalled, errors might occur in scaled-out vCenter environments that consist of a MasterNode and multiple Data Nodes. The CLI is automatically installed on the Master Node.However, because the Data Node collects metrics, the EMC Adapter might report errors ifnaviseccli is not installed.
To install the CLI:
Installation and Licensing
20 EMC Storage Analytics 3.1.1 Installation and User Guide
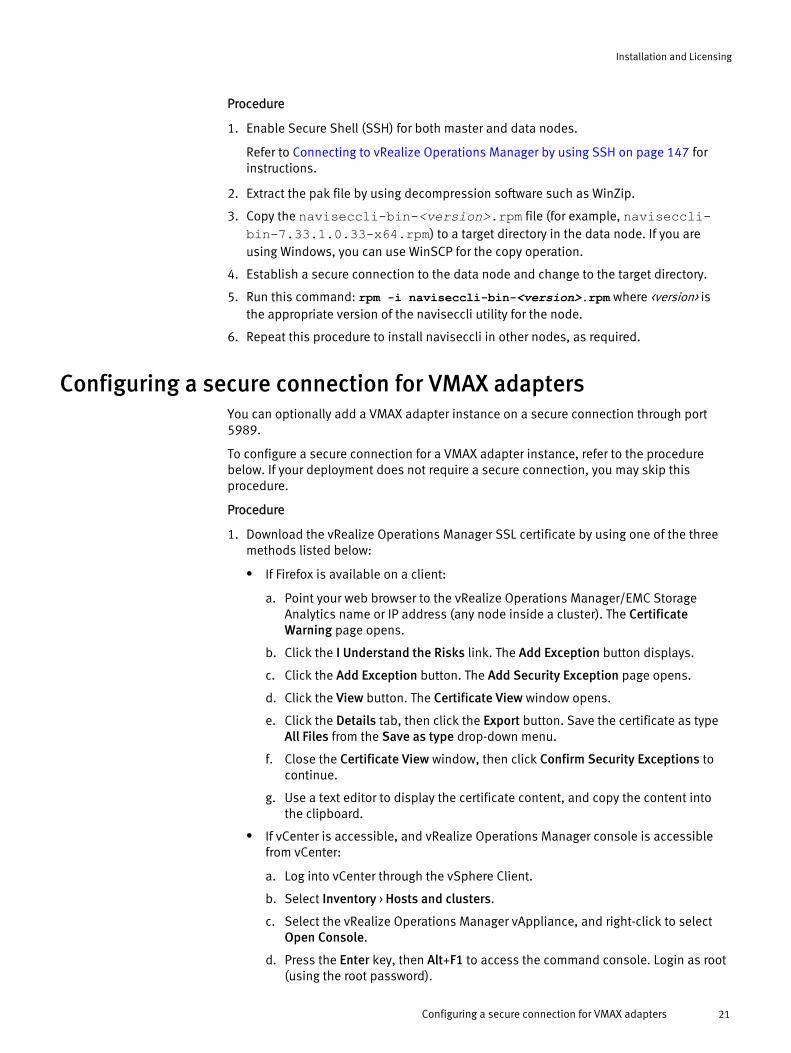
Procedure
1. Enable Secure Shell (SSH) for both master and data nodes.
Refer to Connecting to vRealize Operations Manager by using SSH on page 147 forinstructions.
2. Extract the pak file by using decompression software such as WinZip.
3. Copy the naviseccli-bin-<version>.rpm file (for example, naviseccli-bin-7.33.1.0.33-x64.rpm) to a target directory in the data node. If you areusing Windows, you can use WinSCP for the copy operation.
4. Establish a secure connection to the data node and change to the target directory.
5. Run this command: rpm -i naviseccli-bin-<version>.rpm where <version> isthe appropriate version of the naviseccli utility for the node.
6. Repeat this procedure to install naviseccli in other nodes, as required.
Configuring a secure connection for VMAX adaptersYou can optionally add a VMAX adapter instance on a secure connection through port5989.
To configure a secure connection for a VMAX adapter instance, refer to the procedurebelow. If your deployment does not require a secure connection, you may skip thisprocedure.
Procedure
1. Download the vRealize Operations Manager SSL certificate by using one of the threemethods listed below:
l If Firefox is available on a client:
a. Point your web browser to the vRealize Operations Manager/EMC StorageAnalytics name or IP address (any node inside a cluster). The CertificateWarning page opens.
b. Click the I Understand the Risks link. The Add Exception button displays.
c. Click the Add Exception button. The Add Security Exception page opens.
d. Click the View button. The Certificate View window opens.
e. Click the Details tab, then click the Export button. Save the certificate as typeAll Files from the Save as type drop-down menu.
f. Close the Certificate View window, then click Confirm Security Exceptions tocontinue.
g. Use a text editor to display the certificate content, and copy the content intothe clipboard.
l If vCenter is accessible, and vRealize Operations Manager console is accessiblefrom vCenter:
a. Log into vCenter through the vSphere Client.
b. Select Inventory > Hosts and clusters.
c. Select the vRealize Operations Manager vAppliance, and right-click to selectOpen Console.
d. Press the Enter key, then Alt+F1 to access the command console. Login as root(using the root password).
Installation and Licensing
Configuring a secure connection for VMAX adapters 21
e. Type cat /storage/vcops/user/conf/ssl/cacert.pem, and copy thedisplayed contents into the clipboard.
l If vRealize Operations Manager SSHD is enabled, and SSH terminal is accessible:
a. Log into the vApp as root (using the root password).
b. Type cat /storage/vcops/user/conf/ssl/cacert.pem, and copy thedisplayed contents into the clipboard.
2. Access the SMI-S Provider Ecomconfig site at https://<ip_address>:5989/Ecomconfig. Log in as admin/#1Password (default).
3. Click the SSL Certificate Management link, then select option 3 by clicking Import CACertificate file.
4. Paste the content from the clipboard into the text box. Then click the Submit theCertificate button. The message Successfully imported certificatedisplays.
5. In the vRealize Operations Manager, click the Test connection button in the EMCAdapter window.
The message Test was successful displays. Secure communication isestablished.
Results
A secure connection through port 5989 is established for the VMAX adapter.
Installation and Licensing
22 EMC Storage Analytics 3.1.1 Installation and User Guide
Adapter instancesThe vRealize Operations Manager requires an adapter instance for each resource to bemonitored. The instance specifies the type of adapter to use and the information neededto identify and access the resource.
With EMC Storage Analytics, the vRealize Operations Manager uses EMC Adapterinstances to identify and access the resources. Supported adapter instances include:
l vCenter (prerequisite for other adapter instances)
l VNX File
l VNX Block
l VMAX
l VNXe
l VPLEX
l XtremIO
l RecoverPoint for Virtual Machines
See the EMC Storage Analytics Release Notes for a list of the supported models for eachadapter instance and related OEs.
If the vCenter adapter instance is not configured, other adapter instances will functionnormally but will not display visible connections between the VMware objects and thearray objects.
After adapter instances are created, the vRealize Operations Manager Collector requiresseveral minutes to collect statistics, depending on the size of the storage array. Largestorage array configurations require up to 45 minutes to collect metrics and resourcesand update dashboards. This is a one-time event; future statistical collections runquickly.
Adding an EMC Adapter instance for vCenterFor users to traverse health trees from the virtual environment into the storageenvironment, EMC Storage Analytics requires you to install an EMC Adapter instance forvCenter. All storage system adapter instances require the EMC Adapter instance forvCenter, which you must add first.
To add an EMC Adapter instance for vCenter:
Procedure
1. In a web browser, type: https://<vROps_ip_address>/vcops-web-ent to start thevRealize Operations Manager custom user interface log in as an administrator.
2. Select Administration > Solutions > > EMC Adapter, and then click the Configure icon.
The Manage Solution dialog box appears.
3. Click the Add icon to add a new adapter instance.
Installation and Licensing
Adapter instances 23
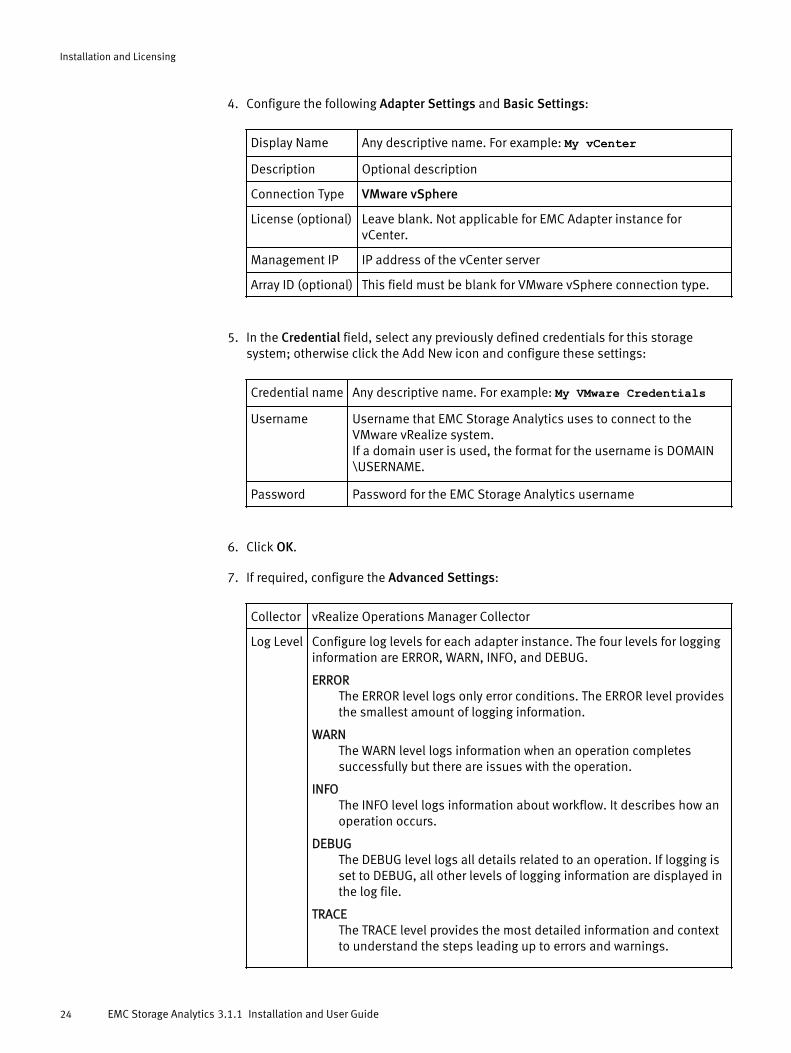
4. Configure the following Adapter Settings and Basic Settings:
Display Name Any descriptive name. For example: My vCenter
Description Optional description
Connection Type VMware vSphere
License (optional) Leave blank. Not applicable for EMC Adapter instance forvCenter.
Management IP IP address of the vCenter server
Array ID (optional) This field must be blank for VMware vSphere connection type.
5. In the Credential field, select any previously defined credentials for this storagesystem; otherwise click the Add New icon and configure these settings:
Credential name Any descriptive name. For example: My VMware Credentials
Username Username that EMC Storage Analytics uses to connect to theVMware vRealize system.If a domain user is used, the format for the username is DOMAIN\USERNAME.
Password Password for the EMC Storage Analytics username
6. Click OK.
7. If required, configure the Advanced Settings:
Collector vRealize Operations Manager Collector
Log Level Configure log levels for each adapter instance. The four levels for logginginformation are ERROR, WARN, INFO, and DEBUG.
ERRORThe ERROR level logs only error conditions. The ERROR level providesthe smallest amount of logging information.
WARNThe WARN level logs information when an operation completessuccessfully but there are issues with the operation.
INFOThe INFO level logs information about workflow. It describes how anoperation occurs.
DEBUGThe DEBUG level logs all details related to an operation. If logging isset to DEBUG, all other levels of logging information are displayed inthe log file.
TRACEThe TRACE level provides the most detailed information and contextto understand the steps leading up to errors and warnings.
Installation and Licensing
24 EMC Storage Analytics 3.1.1 Installation and User Guide
The Manage Solution dialog box appears.
8. To test the adapter instance, click Test Connection.
If the connection is correctly configured, a confirmation box appears.
9. Click OK.
The new adapter instance polls for data every five minutes by default. At everyinterval, the adapter instance will collect information about the VMware vSpheredatastore and virtual machines with Raw Device Mapping (RDM). Consumers of theregistered VMware service can access the mapping information.
Note
To edit the polling interval, select Administration > Environment Overview > EMCAdapter Instance. Select the EMC Adapter instance you want to edit, and click the EditObject icon.
Installation and Licensing
Adding an EMC Adapter instance for vCenter 25
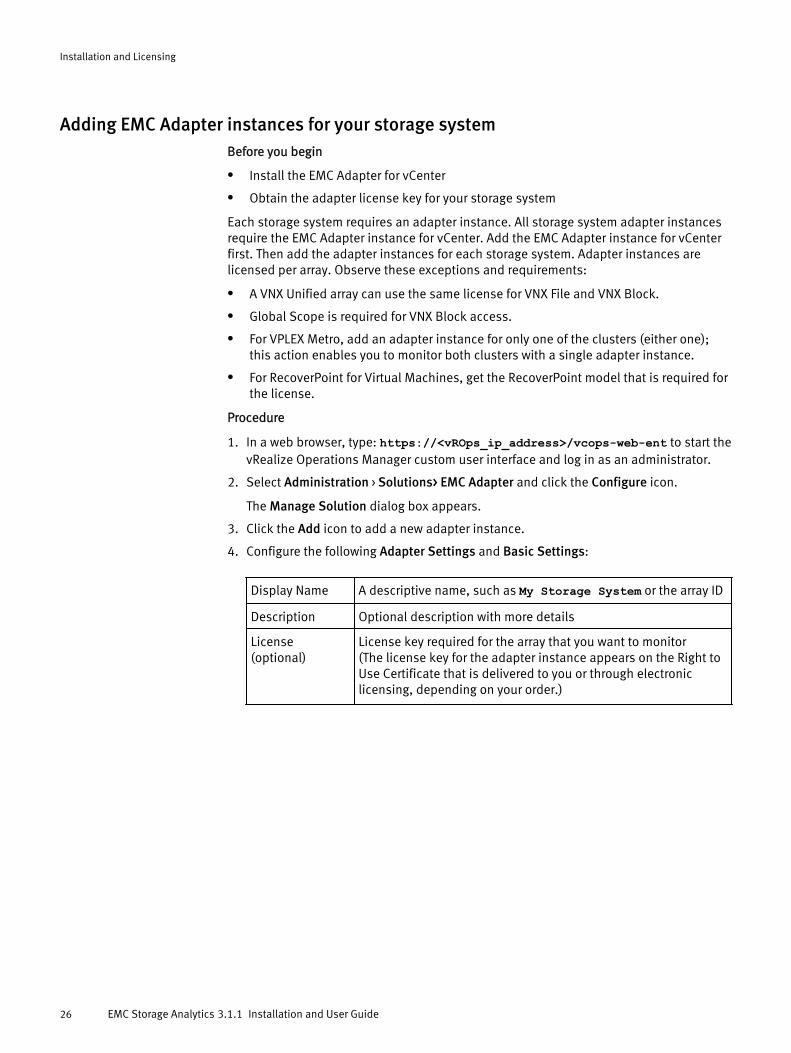
Adding EMC Adapter instances for your storage systemBefore you begin
l Install the EMC Adapter for vCenter
l Obtain the adapter license key for your storage system
Each storage system requires an adapter instance. All storage system adapter instancesrequire the EMC Adapter instance for vCenter. Add the EMC Adapter instance for vCenterfirst. Then add the adapter instances for each storage system. Adapter instances arelicensed per array. Observe these exceptions and requirements:
l A VNX Unified array can use the same license for VNX File and VNX Block.
l Global Scope is required for VNX Block access.
l For VPLEX Metro, add an adapter instance for only one of the clusters (either one);this action enables you to monitor both clusters with a single adapter instance.
l For RecoverPoint for Virtual Machines, get the RecoverPoint model that is required forthe license.
Procedure
1. In a web browser, type: https://<vROps_ip_address>/vcops-web-ent to start thevRealize Operations Manager custom user interface and log in as an administrator.
2. Select Administration > Solutions> EMC Adapter and click the Configure icon.
The Manage Solution dialog box appears.
3. Click the Add icon to add a new adapter instance.
4. Configure the following Adapter Settings and Basic Settings:
Display Name A descriptive name, such as My Storage System or the array ID
Description Optional description with more details
License(optional)
License key required for the array that you want to monitor(The license key for the adapter instance appears on the Right toUse Certificate that is delivered to you or through electroniclicensing, depending on your order.)
Installation and Licensing
26 EMC Storage Analytics 3.1.1 Installation and User Guide
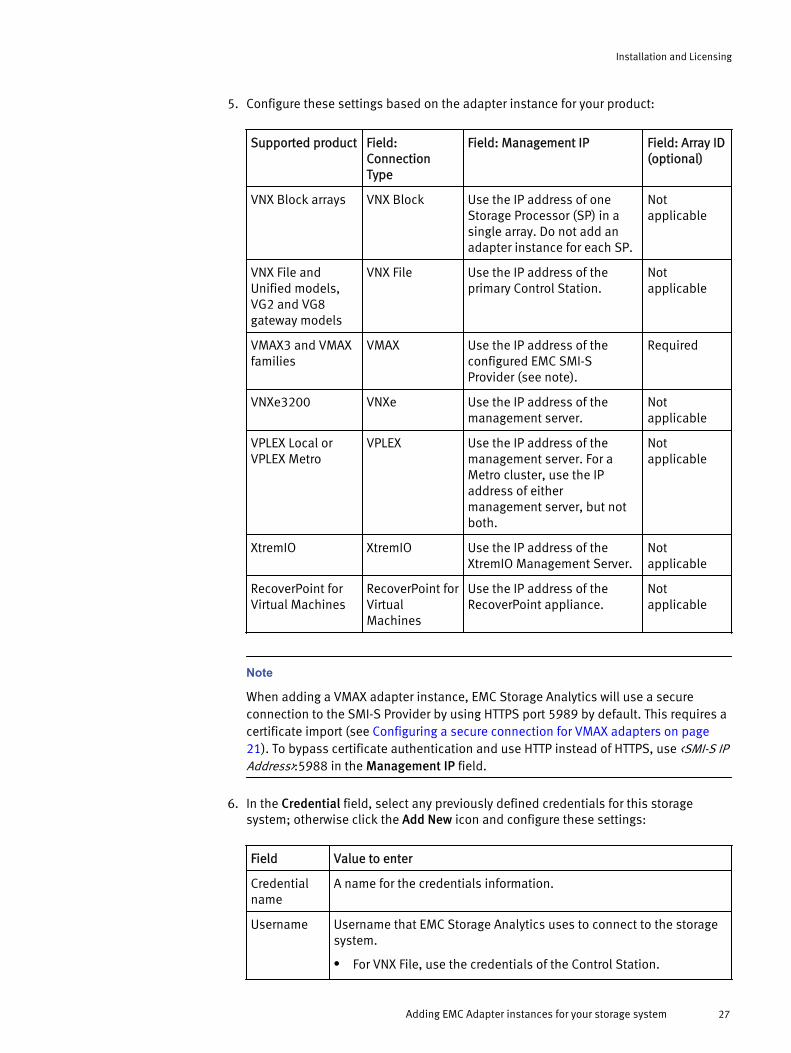
5. Configure these settings based on the adapter instance for your product:
Supported product Field:ConnectionType
Field: Management IP Field: Array ID(optional)
VNX Block arrays VNX Block Use the IP address of oneStorage Processor (SP) in asingle array. Do not add anadapter instance for each SP.
Notapplicable
VNX File andUnified models,VG2 and VG8gateway models
VNX File Use the IP address of theprimary Control Station.
Notapplicable
VMAX3 and VMAXfamilies
VMAX Use the IP address of theconfigured EMC SMI-SProvider (see note).
Required
VNXe3200 VNXe Use the IP address of themanagement server.
Notapplicable
VPLEX Local orVPLEX Metro
VPLEX Use the IP address of themanagement server. For aMetro cluster, use the IPaddress of eithermanagement server, but notboth.
Notapplicable
XtremIO XtremIO Use the IP address of theXtremIO Management Server.
Notapplicable
RecoverPoint forVirtual Machines
RecoverPoint forVirtualMachines
Use the IP address of theRecoverPoint appliance.
Notapplicable
Note
When adding a VMAX adapter instance, EMC Storage Analytics will use a secureconnection to the SMI-S Provider by using HTTPS port 5989 by default. This requires acertificate import (see Configuring a secure connection for VMAX adapters on page21). To bypass certificate authentication and use HTTP instead of HTTPS, use <SMI-S IPAddress>:5988 in the Management IP field.
6. In the Credential field, select any previously defined credentials for this storagesystem; otherwise click the Add New icon and configure these settings:
Field Value to enter
Credentialname
A name for the credentials information.
Username Username that EMC Storage Analytics uses to connect to the storagesystem.
l For VNX File, use the credentials of the Control Station.
Installation and Licensing
Adding EMC Adapter instances for your storage system 27
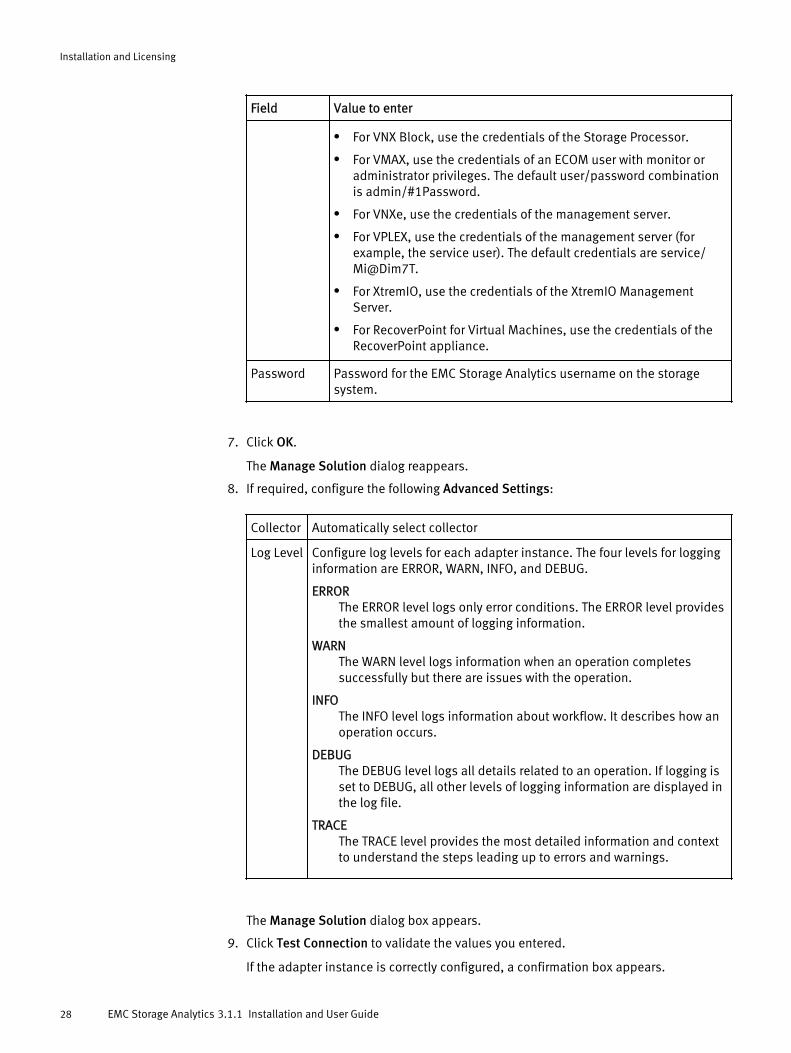
Field Value to enter
l For VNX Block, use the credentials of the Storage Processor.
l For VMAX, use the credentials of an ECOM user with monitor oradministrator privileges. The default user/password combinationis admin/#1Password.
l For VNXe, use the credentials of the management server.
l For VPLEX, use the credentials of the management server (forexample, the service user). The default credentials are service/Mi@Dim7T.
l For XtremIO, use the credentials of the XtremIO ManagementServer.
l For RecoverPoint for Virtual Machines, use the credentials of theRecoverPoint appliance.
Password Password for the EMC Storage Analytics username on the storagesystem.
7. Click OK.
The Manage Solution dialog reappears.
8. If required, configure the following Advanced Settings:
Collector Automatically select collector
Log Level Configure log levels for each adapter instance. The four levels for logginginformation are ERROR, WARN, INFO, and DEBUG.
ERRORThe ERROR level logs only error conditions. The ERROR level providesthe smallest amount of logging information.
WARNThe WARN level logs information when an operation completessuccessfully but there are issues with the operation.
INFOThe INFO level logs information about workflow. It describes how anoperation occurs.
DEBUGThe DEBUG level logs all details related to an operation. If logging isset to DEBUG, all other levels of logging information are displayed inthe log file.
TRACEThe TRACE level provides the most detailed information and contextto understand the steps leading up to errors and warnings.
The Manage Solution dialog box appears.
9. Click Test Connection to validate the values you entered.
If the adapter instance is correctly configured, a confirmation box appears.
Installation and Licensing
28 EMC Storage Analytics 3.1.1 Installation and User Guide

NOTICE
Testing an adapter instance validates the values you entered. Failure to do this stepcauses the adapter instance to change to the (red) warning state if you enter invalidvalues and do not validate them.
10.To finish adding the adapter instance, click OK.
Installation and Licensing
Adding EMC Adapter instances for your storage system 29
Editing EMC Adapter instances for your storage systemBefore you begin
l Install the EMC Adapter
l Configure the EMC Adapter instance for your storage system
l Obtain an adapter license key for your storage system
The EMC Adapter instances for storage systems require licenses. Adapter instances arelicensed per storage array. A VNX Unified array can use the same license for VNX File andVNX Block.
Procedure
1. Start the vRealize Operations Manager custom user interface and log in asadministrator.
For example in a web browser, type: https://<vROps_ip_address>/vcops-web-ent.
2. Select Administration > Environment Overview > EMC Adapter Instance
3. Select the EMC adapter you want to edit and click the Edit Object icon.
The Edit Object dialog appears.
4. Edit the fields you need to change. See Adding EMC Adapter instances for yourstorage system on page 26 for field descriptions.
5. To finish editing the adapter instance, click OK.
Installation and Licensing
30 EMC Storage Analytics 3.1.1 Installation and User Guide
CHAPTER 3
EMC Storage Analytics Dashboards
This chapter contains the following topics:
l Topology mapping.................................................................................................32l EMC dashboards................................................................................................... 44
EMC Storage Analytics Dashboards 31
Topology mappingTopology mapping is viewed and traversed graphically using vRealize OperationsManager health trees. The dashboards developed for EMC Storage Analytics utilizetopology mapping to display resources and metrics.
EMC Storage Analytics establishes mappings between:
l Storage system components
l Storage system objects and vCenter objects
Topology mapping enables health scores and alerts from storage system components,such as storage processors and disks, to appear on affected vCenter objects, such asLUNs, datastores, and VMs. Topology mapping between storage system objects andvCenter objects uses a vCenter adapter instance.
EMC Storage Analytics Dashboards
32 EMC Storage Analytics 3.1.1 Installation and User Guide
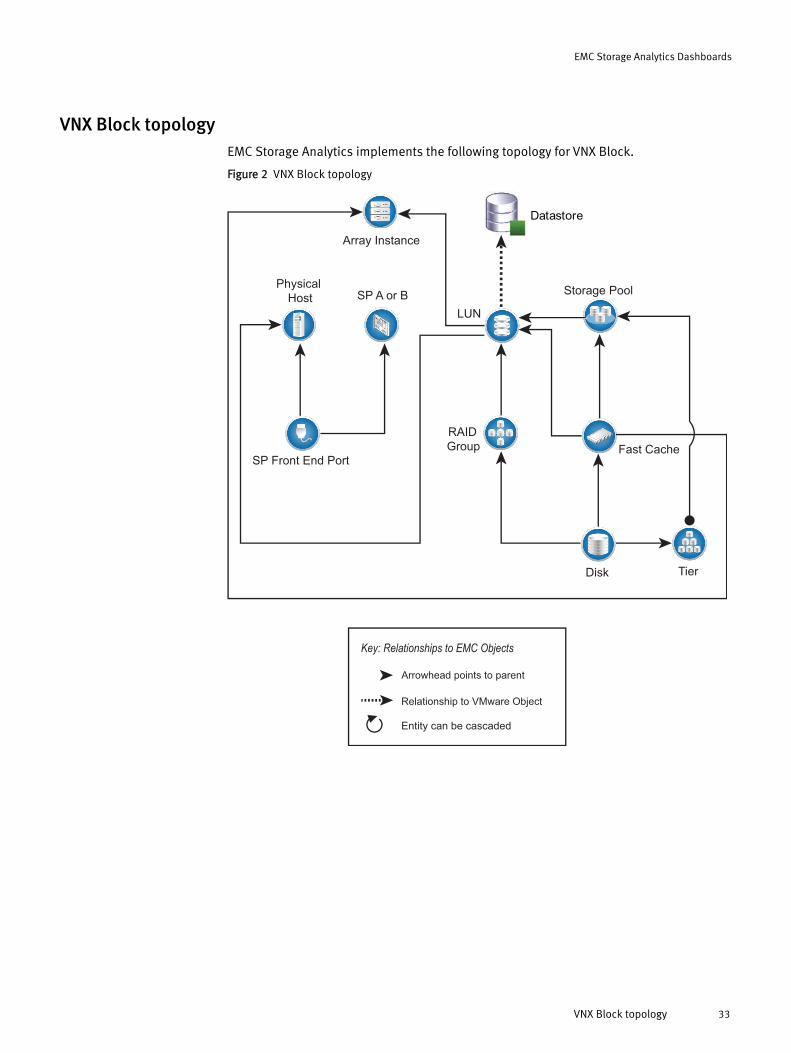
VNX Block topologyEMC Storage Analytics implements the following topology for VNX Block.
Figure 2 VNX Block topology
Datastore
Array Instance
Fast Cache
RAID
Group
Storage Pool
LUN
SP A or B
SP Front End Port
Disk Tier
Physical
Host
Relationship to VMware Object
Arrowhead points to parent
Key: Relationships to EMC Objects
Entity can be cascaded
EMC Storage Analytics Dashboards
VNX Block topology 33
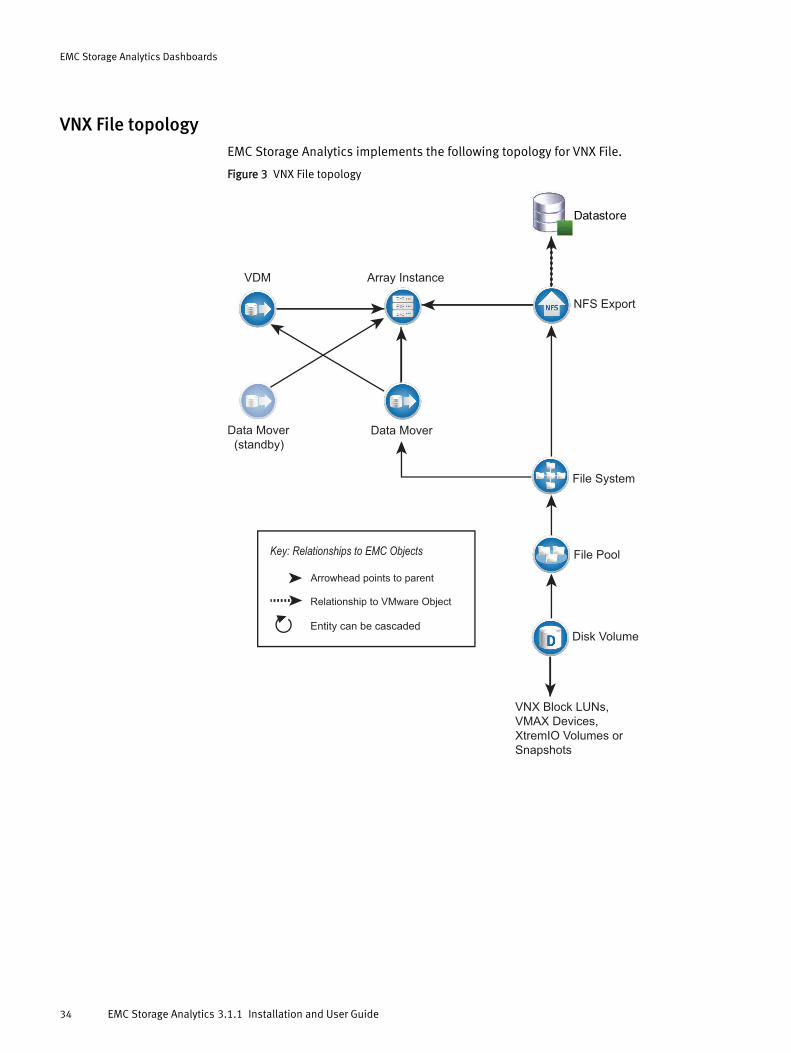
VNX File topologyEMC Storage Analytics implements the following topology for VNX File.
Figure 3 VNX File topology
Array Instance
NFS Export
VDM
File System
Data MoverData Mover
(standby)
File Pool
Disk Volume
Datastore
VNX Block LUNs,
VMAX Devices,
XtremIO Volumes or
Snapshots
Relationship to VMware Object
Arrowhead points to parent
Key: Relationships to EMC Objects
Entity can be cascaded
EMC Storage Analytics Dashboards
34 EMC Storage Analytics 3.1.1 Installation and User Guide
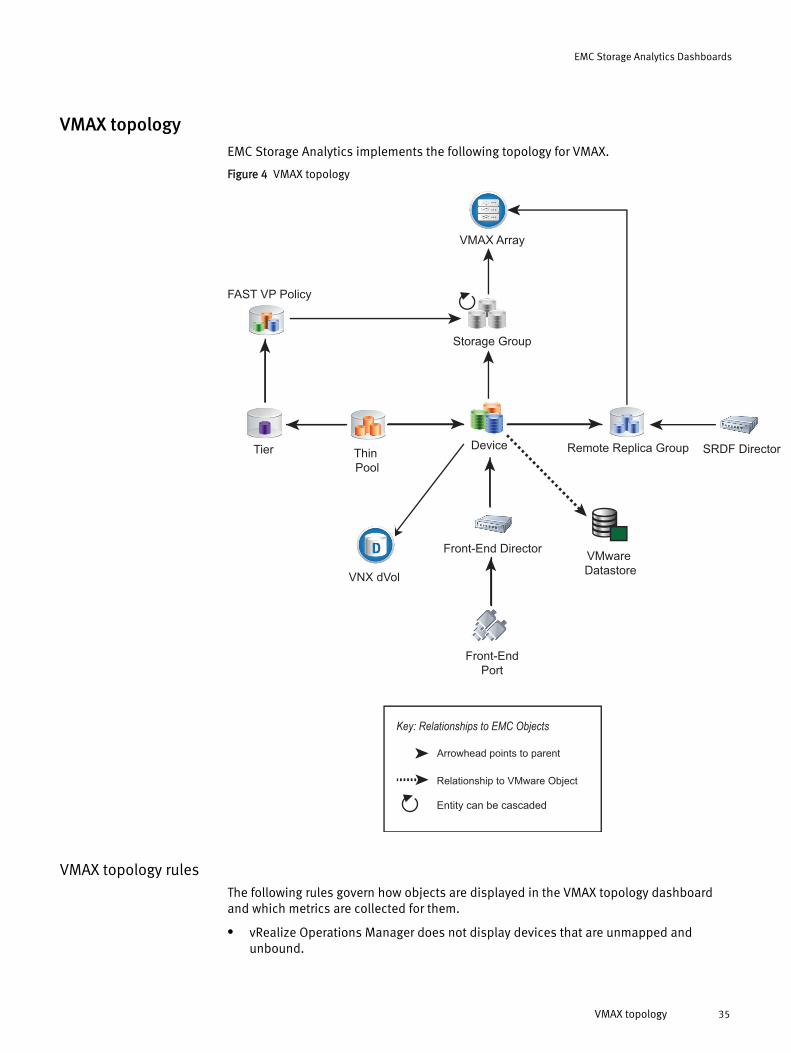
VMAX topologyEMC Storage Analytics implements the following topology for VMAX.
Figure 4 VMAX topology
VMAX Array
VMware
Datastore
Thin
Pool
SRDF DirectorDevice Remote Replica Group
Front-End Director
Front-End
Port
Storage Group
VNX dVol
FAST VP Policy
Tier
Relationship to VMware Object
Arrowhead points to parent
Key: Relationships to EMC Objects
Entity can be cascaded
VMAX topology rulesThe following rules govern how objects are displayed in the VMAX topology dashboardand which metrics are collected for them.
l vRealize Operations Manager does not display devices that are unmapped andunbound.
EMC Storage Analytics Dashboards
VMAX topology 35
l vRealize Operations Manager does not display devices that are mapped and boundbut unused by VMware, VNX, or VPLEX. Performance metrics for these devices areaggregated into the parent Storage Group performance metrics.
l If the corresponding EMC vSphere adapter instance is running on the same vRealizeOperations Manager appliance, then the vRealize Operations Manager displaysdevices that are mapped, bound, and used by VMware datastores or RDMs.
l If the corresponding EMC VNX File adapter instance is running on the same vRealizeOperations Manager appliance, then the vRealize Operations Manager displaysdevices that are mapped, bound, and used by VNX File Disk Volumes.
l A VMAX device will display when the corresponding VPLEX adapter instance is added.
l vRealize Operations Manager does not display Storage Groups with unmapped andunbound devices.
l vRealize Operations Manager displays Storage Groups that contain mapped andbound devices, and their metrics are aggregates of the member devices.
EMC Storage Analytics Dashboards
36 EMC Storage Analytics 3.1.1 Installation and User Guide
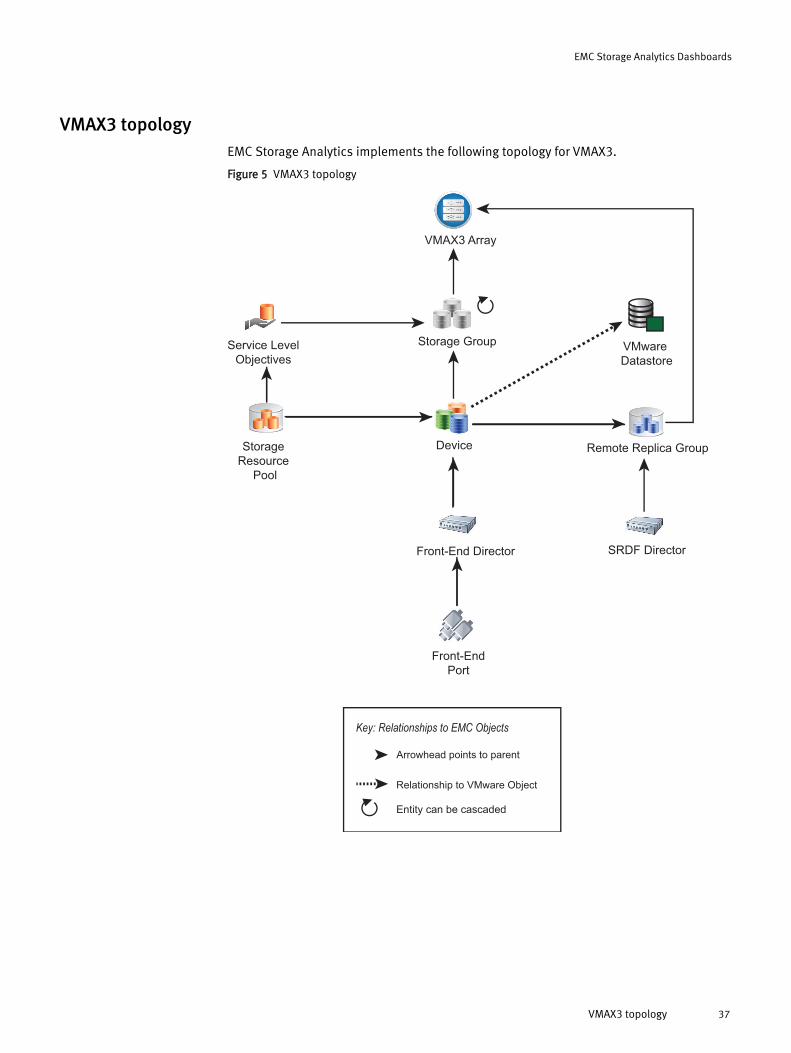
VMAX3 topologyEMC Storage Analytics implements the following topology for VMAX3.
Figure 5 VMAX3 topology
VMAX3 Array
VMware
Datastore
Storage
Resource
Pool
SRDF Director
Device Remote Replica Group
Front-End Director
Front-End
Port
Storage GroupService Level
Objectives
Relationship to VMware Object
Arrowhead points to parent
Key: Relationships to EMC Objects
Entity can be cascaded
EMC Storage Analytics Dashboards
VMAX3 topology 37
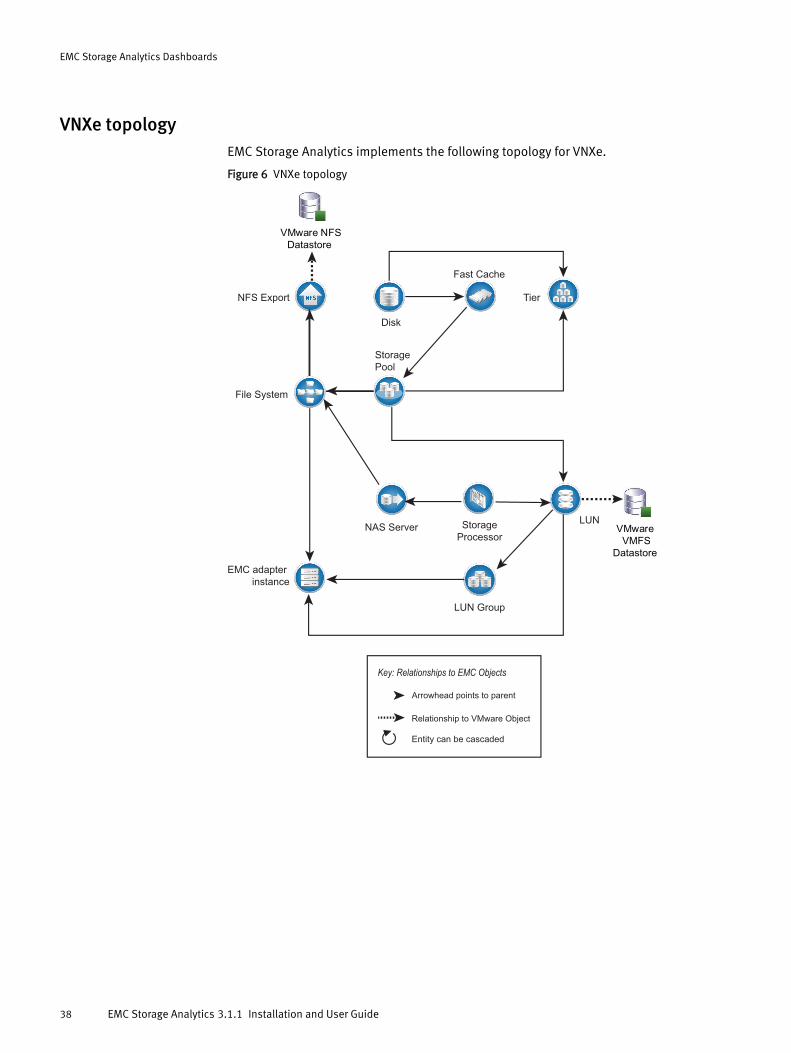
VNXe topologyEMC Storage Analytics implements the following topology for VNXe.
Figure 6 VNXe topology
VMware NFS
Datastore
NFS Export
File System
NAS Server Storage
Processor
LUN
Storage
Pool
Disk
Fast Cache
Tier
EMC adapter
instance
LUN Group
VMware
VMFS
Datastore
Relationship to VMware Object
Arrowhead points to parent
Key: Relationships to EMC Objects
Entity can be cascaded
EMC Storage Analytics Dashboards
38 EMC Storage Analytics 3.1.1 Installation and User Guide
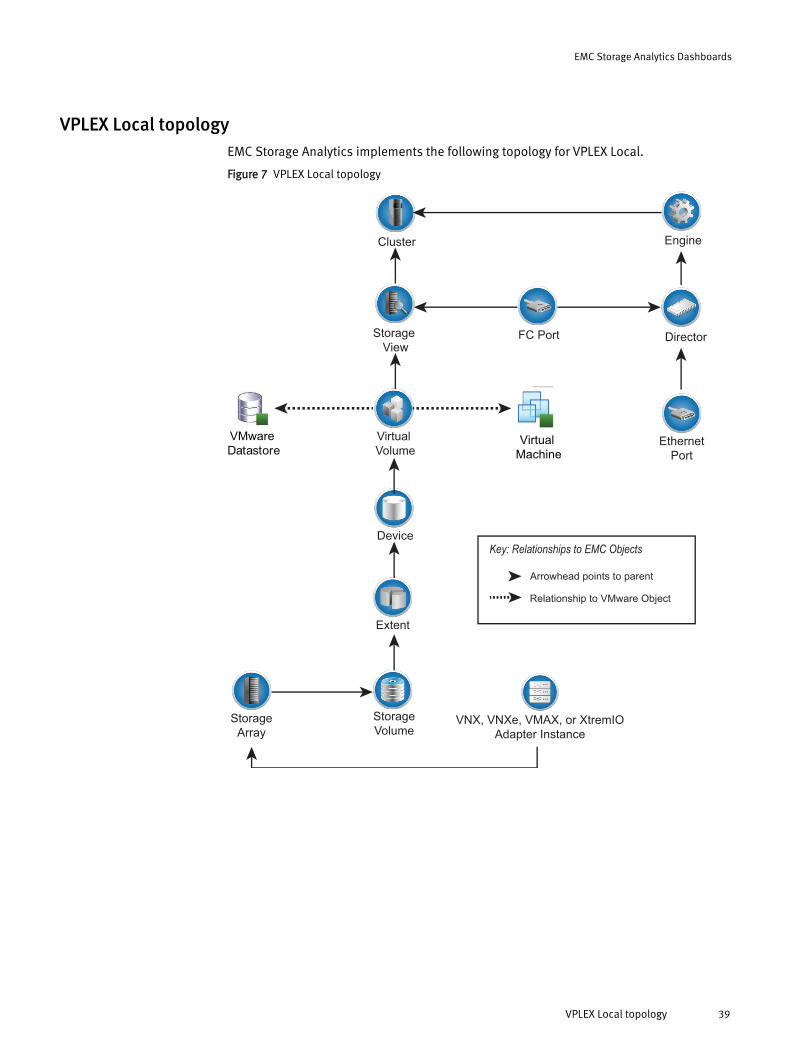
VPLEX Local topologyEMC Storage Analytics implements the following topology for VPLEX Local.
Figure 7 VPLEX Local topology
VMware
Datastore
Cluster Engine
DirectorFC Port
Ethernet
Port
Storage
View
Device
Extent
VNX, VNXe, VMAX, or XtremIO
Adapter Instance
Virtual
Volume
Storage
Array
Virtual
Machine
Storage
Volume
Relationship to VMware Object
Arrowhead points to parent
Key: Relationships to EMC Objects
EMC Storage Analytics Dashboards
VPLEX Local topology 39
VPLEX Metro topologyEMC Storage Analytics implements the following topology for VPLEX Metro.
EMC Storage Analytics Dashboards
40 EMC Storage Analytics 3.1.1 Installation and User Guide
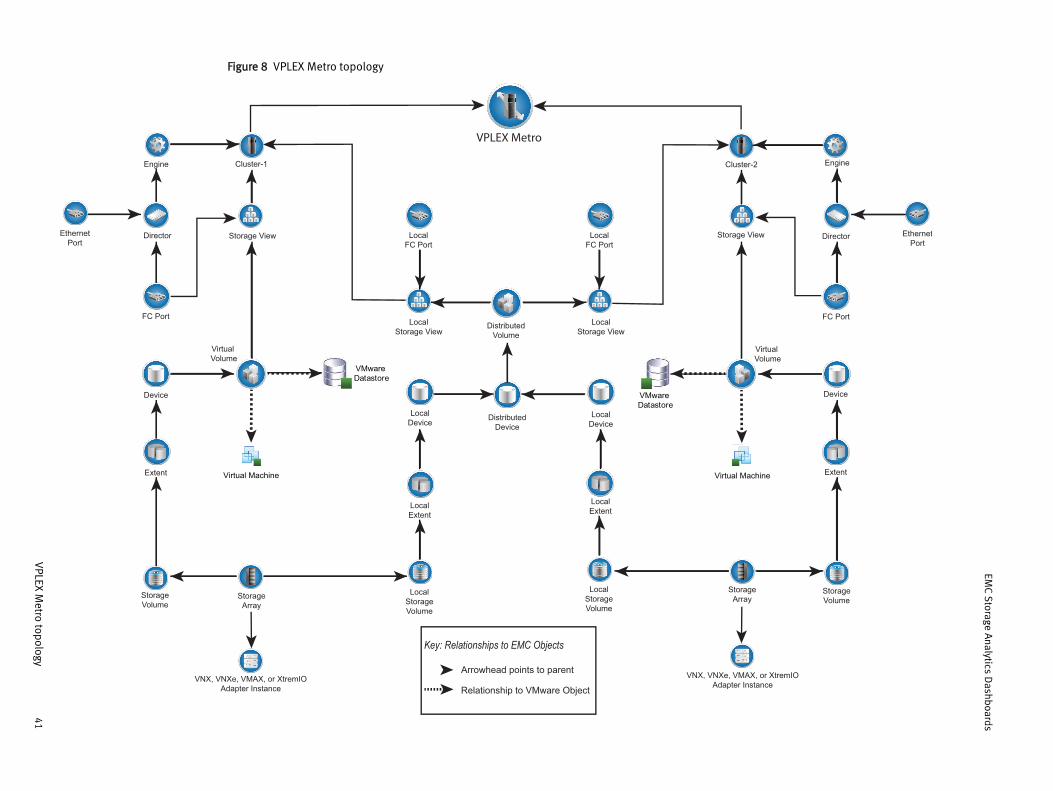
Figure 8 VPLEX Metro topology
VPLEX Metro
Local
Storage View
Local
Storage
Volume
Local
Extent
Local
FC Port
Distributed
Volume
Local
DeviceDistributed
Device
Local
Storage View
Local
Storage
Volume
Local
Extent
Local
FC Port
Local
Device
VMware
Datastore
Storage View
Storage
Volume
Extent
Cluster-1Engine
Director
Storage
Array
VNX, VNXe, VMAX, or XtremIO
Adapter Instance
Virtual Machine
FC Port
Ethernet
Port
Virtual
Volumeme
Device VMware
Datastore
Storage View
Storage
Volume
Extent
Cluster-2 Engine
Director
Storage
Array
VNX, VNXe, VMAX, or XtremIO
Adapter Instance
Virtual Machine
FC Port
Ethernet
Port
Virtual
VolumeVolu
Device
Relationship to VMware Object
Arrowhead points to parent
Key: Relationships to EMC Objects
EMC S
torage Analytics D
ashboards
VPLEX M
etro topology 41
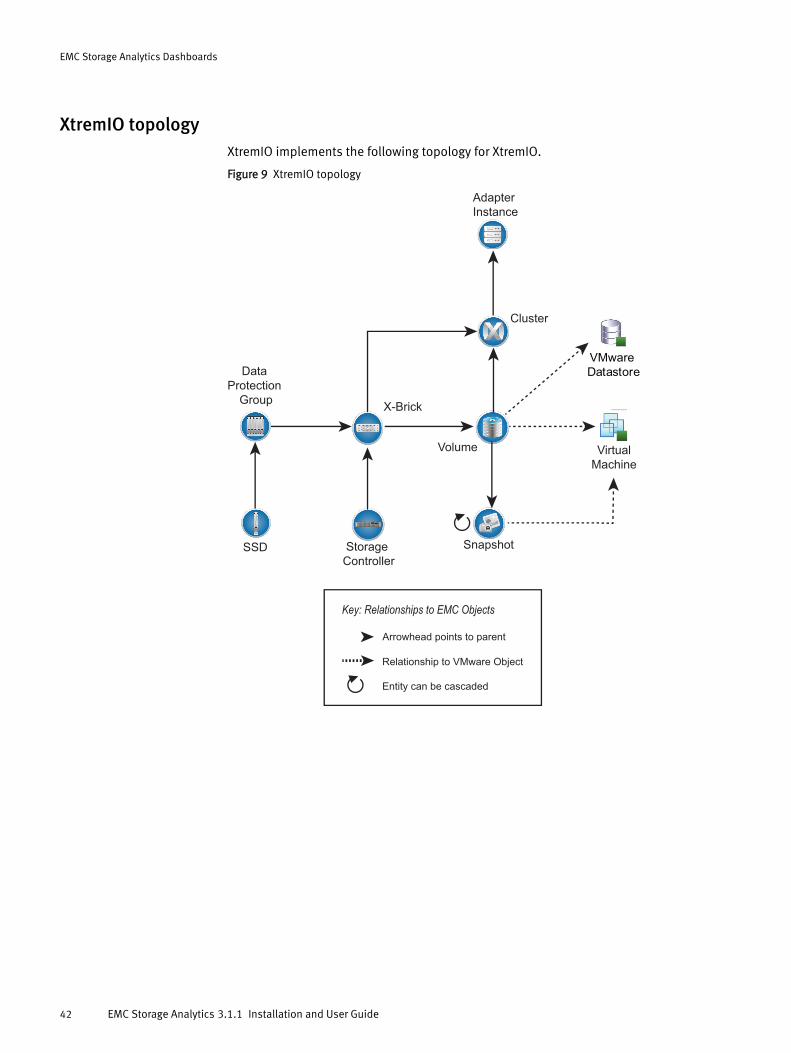
XtremIO topologyXtremIO implements the following topology for XtremIO.
Figure 9 XtremIO topology
VMware
Datastore
Adapter
Instance
X-Brick
Storage
Controller
Data
Protection
Group
SSD
Virtual
Machine
Volume
Cluster
Snapshot
Relationship to VMware Object
Arrowhead points to parent
Key: Relationships to EMC Objects
Entity can be cascaded
EMC Storage Analytics Dashboards
42 EMC Storage Analytics 3.1.1 Installation and User Guide
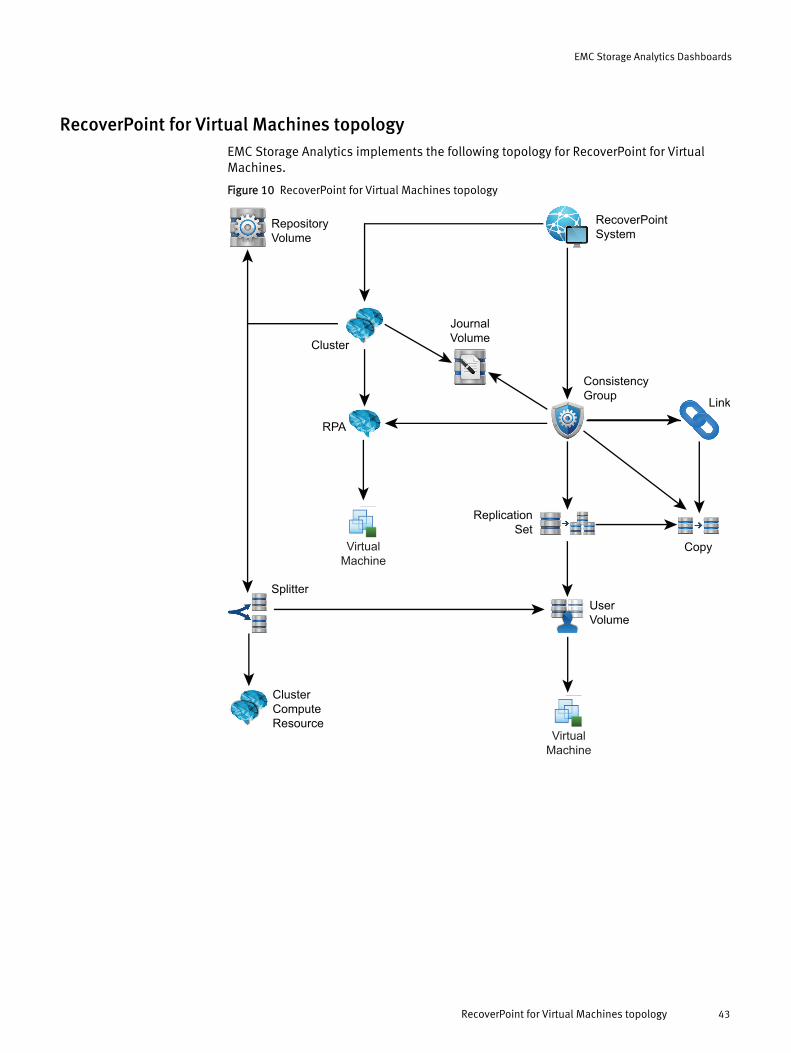
RecoverPoint for Virtual Machines topologyEMC Storage Analytics implements the following topology for RecoverPoint for VirtualMachines.
Figure 10 RecoverPoint for Virtual Machines topology
RecoverPoint
SystemRepository
Volume
Cluster
RPA
Virtual
Machine
Splitter
Cluster
Compute
ResourceVirtual
Machine
Journal
Volume
Consistency
Group
Replication
Set
User
Volume
Link
Copy
EMC Storage Analytics Dashboards
RecoverPoint for Virtual Machines topology 43
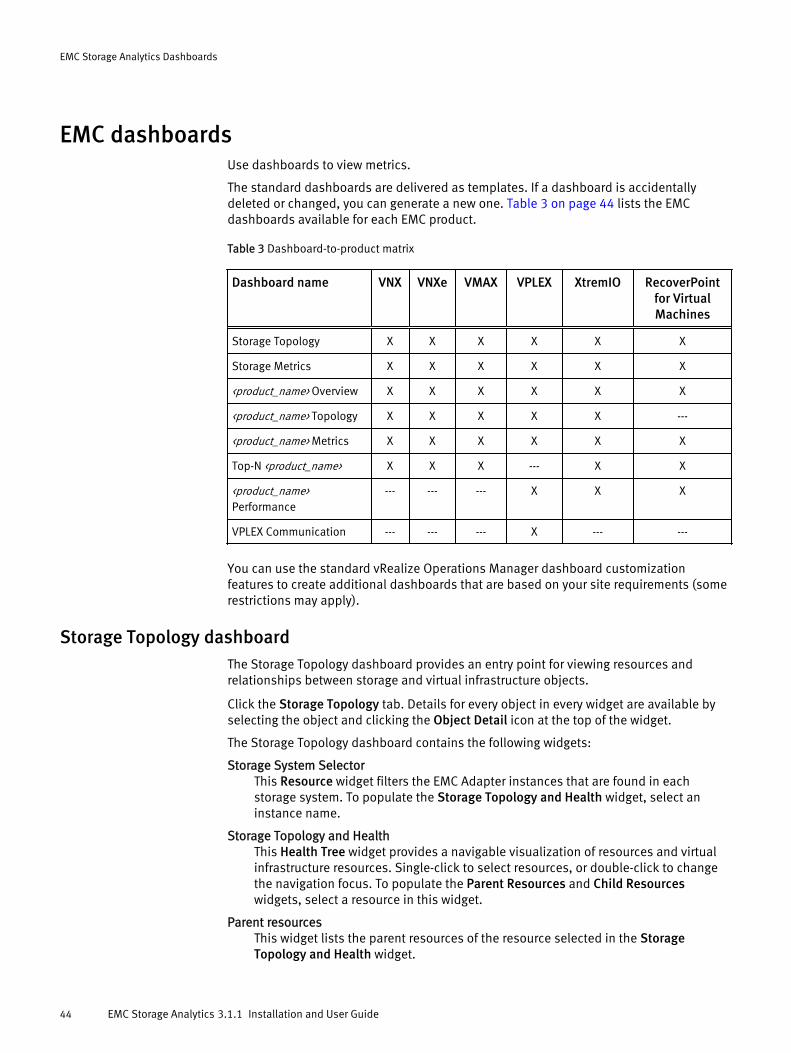
EMC dashboardsUse dashboards to view metrics.
The standard dashboards are delivered as templates. If a dashboard is accidentallydeleted or changed, you can generate a new one. Table 3 on page 44 lists the EMCdashboards available for each EMC product.
Table 3 Dashboard-to-product matrix
Dashboard name VNX VNXe VMAX VPLEX XtremIO RecoverPointfor VirtualMachines
Storage Topology X X X X X X
Storage Metrics X X X X X X
<product_name> Overview X X X X X X
<product_name> Topology X X X X X ---
<product_name> Metrics X X X X X X
Top-N <product_name> X X X --- X X
<product_name>Performance
--- --- --- X X X
VPLEX Communication --- --- --- X --- ---
You can use the standard vRealize Operations Manager dashboard customizationfeatures to create additional dashboards that are based on your site requirements (somerestrictions may apply).
Storage Topology dashboardThe Storage Topology dashboard provides an entry point for viewing resources andrelationships between storage and virtual infrastructure objects.
Click the Storage Topology tab. Details for every object in every widget are available byselecting the object and clicking the Object Detail icon at the top of the widget.
The Storage Topology dashboard contains the following widgets:
Storage System SelectorThis Resource widget filters the EMC Adapter instances that are found in eachstorage system. To populate the Storage Topology and Health widget, select aninstance name.
Storage Topology and HealthThis Health Tree widget provides a navigable visualization of resources and virtualinfrastructure resources. Single-click to select resources, or double-click to changethe navigation focus. To populate the Parent Resources and Child Resourceswidgets, select a resource in this widget.
Parent resourcesThis widget lists the parent resources of the resource selected in the StorageTopology and Health widget.
EMC Storage Analytics Dashboards
44 EMC Storage Analytics 3.1.1 Installation and User Guide

Child resourcesThis widget lists the child resources of the resource selected in the Storage Topologyand Health widget.
EMC Storage Analytics Dashboards
Storage Topology dashboard 45

Storage Metrics dashboardClick the Storage Metrics tab to display resource and metrics for storage systems andview graphs of resource metrics.
The Storage Metrics dashboard contains the following widgets:
Storage System SelectorThis Resource widget lists all configured EMC Adapter instances. To populate theResource Selector widget, select an instance name.
Resource SelectorThis Health Tree widget lists each resource associated with the adapter instanceselected in the Storage System Selector. To populate the Metric Picker widget,select a resource.
Metric PickerThis widget lists all the metrics that are collected for the resource selected in theResource Selector widget. The search feature of this widget allows users to locatespecific objects. Double-click a metric to create a graph of the metric in the MetricGraph widget.
Metric GraphThis widget graphs the metrics selected in the Metric Picker widget. Display multiplemetrics simultaneously in a single graph or in multiple graphs.
EMC Storage Analytics Dashboards
46 EMC Storage Analytics 3.1.1 Installation and User Guide
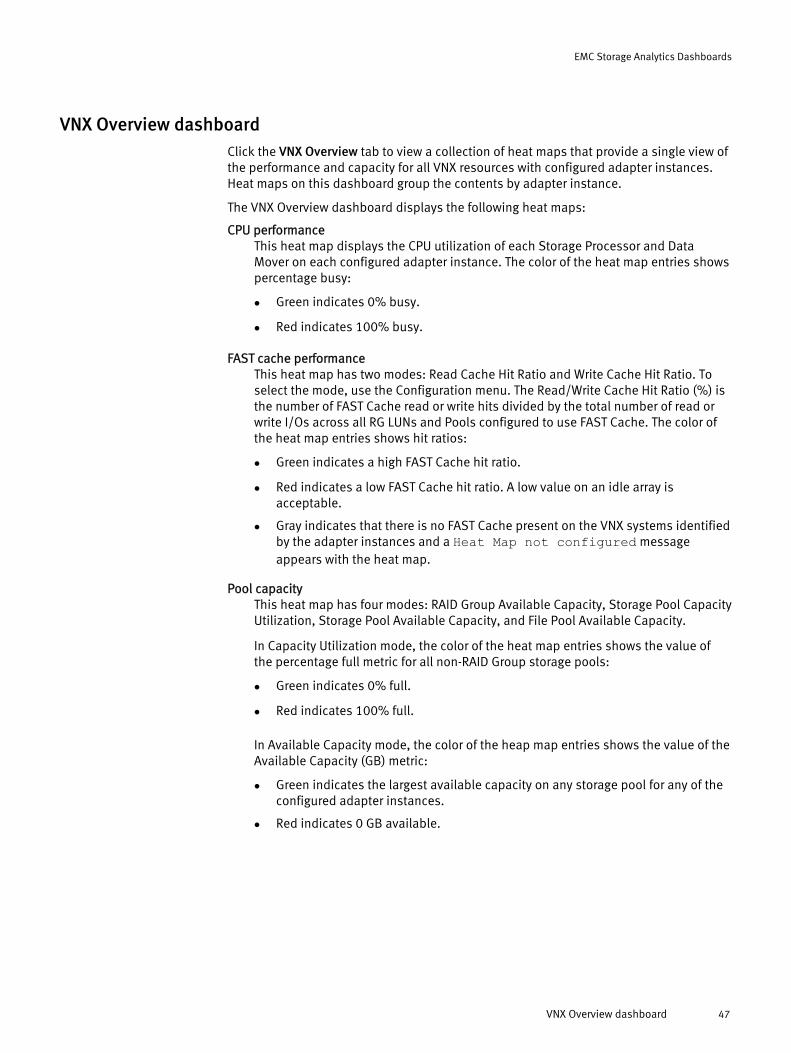
VNX Overview dashboardClick the VNX Overview tab to view a collection of heat maps that provide a single view ofthe performance and capacity for all VNX resources with configured adapter instances.Heat maps on this dashboard group the contents by adapter instance.
The VNX Overview dashboard displays the following heat maps:
CPU performanceThis heat map displays the CPU utilization of each Storage Processor and DataMover on each configured adapter instance. The color of the heat map entries showspercentage busy:
l Green indicates 0% busy.
l Red indicates 100% busy.
FAST cache performanceThis heat map has two modes: Read Cache Hit Ratio and Write Cache Hit Ratio. Toselect the mode, use the Configuration menu. The Read/Write Cache Hit Ratio (%) isthe number of FAST Cache read or write hits divided by the total number of read orwrite I/Os across all RG LUNs and Pools configured to use FAST Cache. The color ofthe heat map entries shows hit ratios:
l Green indicates a high FAST Cache hit ratio.
l Red indicates a low FAST Cache hit ratio. A low value on an idle array isacceptable.
l Gray indicates that there is no FAST Cache present on the VNX systems identifiedby the adapter instances and a Heat Map not configured messageappears with the heat map.
Pool capacityThis heat map has four modes: RAID Group Available Capacity, Storage Pool CapacityUtilization, Storage Pool Available Capacity, and File Pool Available Capacity.
In Capacity Utilization mode, the color of the heat map entries shows the value ofthe percentage full metric for all non-RAID Group storage pools:
l Green indicates 0% full.
l Red indicates 100% full.
In Available Capacity mode, the color of the heap map entries shows the value of theAvailable Capacity (GB) metric:
l Green indicates the largest available capacity on any storage pool for any of theconfigured adapter instances.
l Red indicates 0 GB available.
EMC Storage Analytics Dashboards
VNX Overview dashboard 47
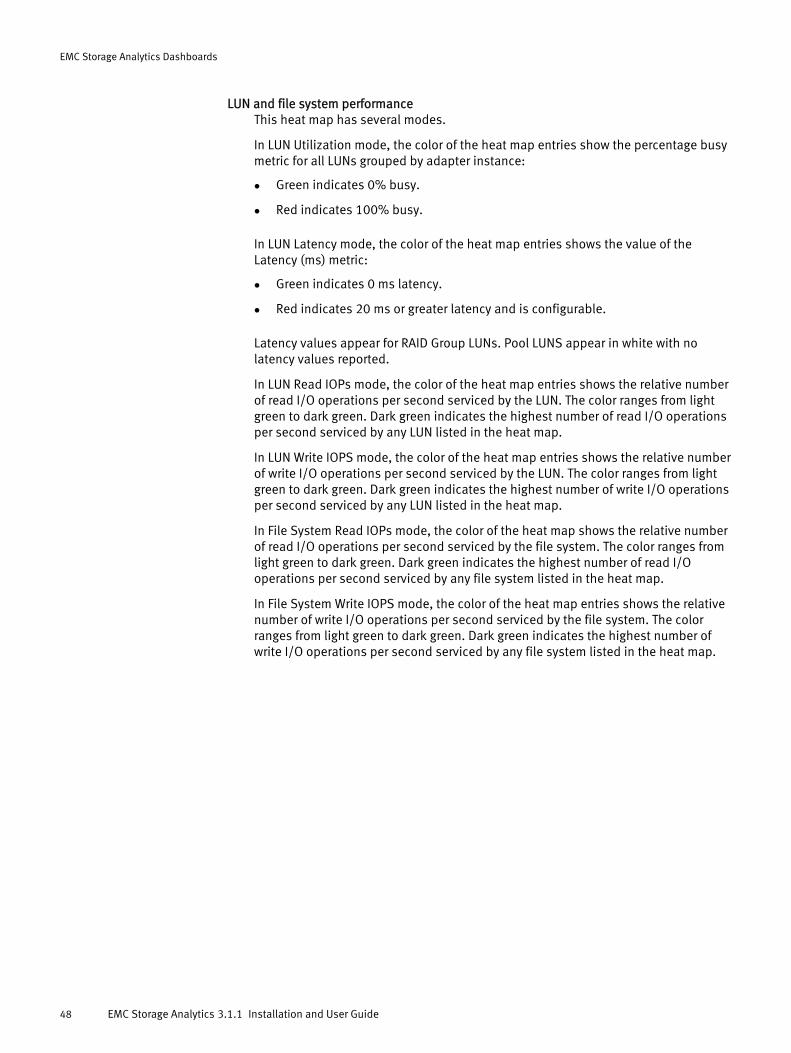
LUN and file system performanceThis heat map has several modes.
In LUN Utilization mode, the color of the heat map entries show the percentage busymetric for all LUNs grouped by adapter instance:
l Green indicates 0% busy.
l Red indicates 100% busy.
In LUN Latency mode, the color of the heat map entries shows the value of theLatency (ms) metric:
l Green indicates 0 ms latency.
l Red indicates 20 ms or greater latency and is configurable.
Latency values appear for RAID Group LUNs. Pool LUNS appear in white with nolatency values reported.
In LUN Read IOPs mode, the color of the heat map entries shows the relative numberof read I/O operations per second serviced by the LUN. The color ranges from lightgreen to dark green. Dark green indicates the highest number of read I/O operationsper second serviced by any LUN listed in the heat map.
In LUN Write IOPS mode, the color of the heat map entries shows the relative numberof write I/O operations per second serviced by the LUN. The color ranges from lightgreen to dark green. Dark green indicates the highest number of write I/O operationsper second serviced by any LUN listed in the heat map.
In File System Read IOPs mode, the color of the heat map shows the relative numberof read I/O operations per second serviced by the file system. The color ranges fromlight green to dark green. Dark green indicates the highest number of read I/Ooperations per second serviced by any file system listed in the heat map.
In File System Write IOPS mode, the color of the heat map entries shows the relativenumber of write I/O operations per second serviced by the file system. The colorranges from light green to dark green. Dark green indicates the highest number ofwrite I/O operations per second serviced by any file system listed in the heat map.
EMC Storage Analytics Dashboards
48 EMC Storage Analytics 3.1.1 Installation and User Guide
VMAX Overview dashboardClick the VMAX Overview tab to view a collection of heat maps that provide a single viewof the performance and capacity for all VMAX resources with configured adapterinstances. Heat maps on this dashboard group the contents by adapter instance.
The VMAX dashboard displays the following heat maps for all applicable VMAX models.For each heat map and selected metric, the configured VMAX adapter is shown:
Thin Pool UsageThis heat map displays the Percent Allocated metric. Percent Allocated displays theallocated capacity in each thin pool. The color of the heat map entries ranges fromgreen to red and corresponds to the percent allocated as follows:
l Green indicates that 0% of the thin pool is allocated.
l Yellow indicates that 50% of the thin pool is allocated.
l Red indicates that 100% of the thin pool is allocated.
The VMAX dashboard displays the following heat maps for VMAX3. For each heat mapand selected metric, the configured VMAX adapter is shown:
Storage Resource PoolThis heat map displays the Percent Allocated metric. Percent Allocated displays theallocated capacity in each thin pool. The color of the heat map entries ranges fromgreen to red and corresponds to the percent allocated as follows:
l Green indicates that 0% of the thin pool is allocated.
l Yellow indicates that 50% of the thin pool is allocated.
l Red indicates that 100% of the thin pool is allocated.
The VMAX dashboard displays the following heat maps for all supported VMAX models.For each heat map and selected metric, the configured VMAX adapter is shown:
EMC Storage Analytics Dashboards
VMAX Overview dashboard 49
Storage GroupThis heat map has four modes: Total Reads (IOPS), Total Writes (IOPS), Read Latency(ms), and Write Latency (ms).
Total Reads and Writes represent the aggregate reads or writes for all LUNs in thestorage group. Write and Read Latency is the average write or read latency of allLUNs in the storage group.
For Total Reads and Writes, the color of the heat map entries shows the relativenumber of total reads or writes across all the storage groups. The color ranges fromlight blue to dark blue. Dark blue indicates the storage group(s) with the highestnumber of total reads or writes while light blue indicates the lowest. Because therange of values for total reads or writes has no lower or upper limits, the numericaldifference between light and dark blue may be very small.
For Write and Read Latency, the color of the heat map entries is based on a scale oflatency from 0 to 40ms. This scale is a based on average customer requirements andmay not represent a customer's particular requirements for latency. In such cases,EMC recommends adjusting the scale appropriately. The color of the heat mapentries ranges from green to red as follows:
l Green indicates a latency of 0ms.
l Yellow indicates a latency of 20ms.
l Red indicates a latency of 40ms.
LUN PerformanceThis heat map has four modes: Reads (IOPS), Writes (IOPS), Read Latency (ms), andWrite Latency (ms).
Reads and Writes represent the total reads or writes for a particular LUN. Read andWrite Latency is the average read or write latency of all LUNs in the storage group.
For Reads and Writes, the color of the heat map entries shows the relative number ofreads or writes across all the LUNs. The color ranges from light blue to dark blue.Dark blue indicates the LUN(s) with the highest number of reads or writes while lightblue indicates the lowest. Because the range of values for reads or writes has nolower or upper limits, the numerical difference between light and dark blue may bevery small.
For Read and Write Latency, the color of the heat map entries ranges from green tored and is based on a scale of latency from 0 to 40ms. This scale is a based onaverage customer requirements and may not represent a customer's particularrequirements for latency. In such cases EMC recommends adjusting the scaleappropriately. The color of the heat map entries range from green to red as follows:
l Green indicates a latency of 0ms.
l Yellow indicates a latency of 20ms.
l Red indicates a latency of 40ms.
EMC Storage Analytics Dashboards
50 EMC Storage Analytics 3.1.1 Installation and User Guide
Front End DirectorThis heat map has two modes: Total Bandwidth (MB/s) and Total Operations (IOPS).
Total Bandwidth is the cumulative amount of data transferred over all ports of thefront-end director (measured in Megabytes per second). Total Operations is the totalnumber of operations taking place over all ports of a front-end director (measured inIOs per second).
The color of the heat map entries is the same for both metrics. It shows the relativetotal bandwidth or relative total number of operations, depending on the selectedmetric. The color ranges from light blue to dark blue. Dark blue indicates the front-end director(s) with the highest number of total operations or the greatest totalbandwidth, depending on the selected metric. Light blue indicates the lowestnumber of operations or the least total bandwidth. Because the range of values foroperations or bandwidth has no lower or upper limits, the numerical differencebetween light and dark blue may be very small.
SRDF DirectorThis heat map has two modes: Total Bandwidth (MB/s) and Total Writes (IOPS).
Total Bandwidth is the cumulative amount of data transferred over an SRDF director(measured in Megabytes per second). Total Writes is the total number of writes overan SRDF director (measured in IOs per second).
The color of the heat map entries is the same for both metrics. It shows the relativetotal bandwidth or relative total number of writes, depending on the selected metric.The color ranges from light blue to dark blue. Dark blue indicates the SRDFdirector(s) with the highest number of total writes or the greatest total bandwidth,depending on the selected metric. Light blue indicates the lowest number of writesor the least total bandwidth. Because the range of values for bandwidth or writeshas no lower or upper limits, the numerical difference between light and dark bluemay be very small.
SRDF GroupsThis heat map has four modes: Devices in Session (count), Average Cycle Time(seconds), Writes (IOPS), and Writes (MB/s).
Devices in Session represents the number of devices in an SRDF session in the SRDFgroup. The Average Cycle Time is an SRDF/A metric that provides the averageelapsed time between data transfer cycles. Writes (IOPs) represents the number ofwrites per second on the devices in the SRDF group. Writes (MB/s) represents thenumber of megabytes per second sent from the SRDF group.
The color of the heat map entries is the same for all metrics. It shows the relativedevices in session, average cycle time, total bandwidth, or the relative number ofwrites, depending on the selected metric. The color ranges from light blue to darkblue. Dark blue indicates the SRDF group(s) with the highest number of one thesemetrics and light blue indicates the lowest number of one of these metrics. Becausethe range of values has no lower or upper limits, the numerical difference betweenlight and dark blue may be very small.
EMC Storage Analytics Dashboards
VMAX Overview dashboard 51
VNXe Overview dashboardClick the VNXe Overview tab to view a collection of heat maps that provide a single viewof the performance and capacity for all VNXe resources with configured adapterinstances. Heat maps on this dashboard group the contents by adapter instance.
The VNXe Overview dashboard displays the following heat maps:
CPU PerformanceThis heat map displays the CPU Utilization, such as % busy, of each StorageProcessor on each configured adapter instance. The color of the heat map entriesshows % busy:
l Green indicates 0% busy
l Red indicates 100% busy
Pool capacityThis heat map has two modes: Storage Pool Capacity Utilization and Storage PoolAvailable Capacity.
In Capacity Utilization mode, the color of the heat map entries shows the value ofthe % full metric for all storage pools:
l Green indicates 0% full.
l Red indicates 100% full.
In Available Capacity mode, the color of the heap map entries shows the value of theAvailable Capacity (GB) metric:
l Green indicates the largest available capacity on any storage pool for any of theconfigured adapter instances.
l Red indicates 0 GB available.
LUN PerformanceThis heat map has two modes: LUN Read IOPS and LUN Write IOPS.
LUN Read IOPS and LUN Write IOPS represent the total reads or writes for a particularLUN. The color of the heat map entries shows the relative number of reads or writesacross all the LUNs. The color ranges from light green to dark green. Dark greenindicates the LUN(s) with the highest number of reads or writes while light greenindicates the lowest. Because the range of values for reads or writes has no lower orupper limits, the numerical difference between light and dark green may be verysmall.
EMC Storage Analytics Dashboards
52 EMC Storage Analytics 3.1.1 Installation and User Guide
VPLEX Overview dashboardClick the VPLEX Overview tab to view a collection of scorecard widgets that provide anoverview of the health for the VPLEX system.
The EMC VPLEX Overview dashboard displays the following widgets:
Note
Red, yellow, and orange colors correlate with the Health State or Operational Status ofthe object. Any Health State or Operational Status other than those listed below will showgreen (good). Also note that because VMware expects numeric values, you cannot modifythese widgets.
CPU HealthThis widget displays the CPU usage, as a percentage, for each director on the VPLEX.The color of the directors in the widget reflects the CPU usage:
l Green indicates CPU usage of 0 - 75%.
l Yellow indicates CPU usage of 75 - 85%.
l Orange indicates CPU usage of 85 - 95%.
l Red indicates CPU usage of 95 - 100%.
Generally, a director should stay below 75% CPU usage. Correct an imbalance of CPUusage across directors by adjusting the amount of I/O to the busier directors; makethis adjustment by modifying existing storage view configurations. Identify busiervolumes and hosts and move them to less busy directors. Alternately, add moredirector ports to a storage view to create a better load balance across the availabledirectors.
Memory HealthThis widget displays the memory usage, as a percentage, of each director on theVPLEX. The color of the directors in the widget reflects the memory usage:
l Green indicates memory usage of 0 - 70%.
l Yellow indicates memory usage of 70 - 80%.
l Orange indicates memory usage of 80 - 90%.
l Red indicates memory usage of 90 - 100%.
Front-End Latency - Read/WriteThis widget displays read and write latency (in ms) for each Front-end Director.
l Green indicates latency values between 0 ms and 7 ms.
l Yellow indicates latency values of 7 ms up to 11 ms.
l Orange indicates latency values of 11 ms up to 15 ms.
l Red indicates latency values over 15 ms.
Front-End OperationsThis widget displays the active and total operations (in counts/s) for each Front-endDirector.
EMC Storage Analytics Dashboards
VPLEX Overview dashboard 53
VPLEX Performance dashboardClick the VPLEX Metrics tab to view a collection of heat maps that provide a single view ofthe most important performance metrics for VPLEX resources.
The EMC VPLEX Metrics dashboard displays two types of heat maps:
l Metrics with definitive measurements such as CPU usage (0-100%) or response timelatency (0-15ms) are assigned color ranges from lowest (green) to highest (red).
l Metrics with varied values that cannot be assigned a range show relative values fromlowest (light blue) to highest (dark blue).
Front-end BandwidthThis heat map has three modes: Reads (MB/s), Writes (MB/s), and Active Operations(Counts/s)
Reads and Writes represent the total reads or writes for the storage volumes acrossthe front-end ports on a director.
For Reads and Writes, the color of the heat map entries shows the relative front-endbandwidth on a director, depending upon the selected metric.
Active Operations represents the number of active, outstanding I/O operations onthe director's front-end ports.
Back-end BandwidthThis heat map has three modes: Reads (MB/s), Writes (MB/s), and Operations(Counts/s).
Reads and Writes represent the total reads or writes for the storage volumes acrossthe back-end ports on a director.
For Reads and Writes, the color of the heat map entries shows the relative back-endbandwidth on a director, depending upon the selected metric.
Operations represents the number of I/O operations per second through thedirector's back-end ports.
Back-end ErrorsThis heat map has three modes: Resets (count/s), Timeouts (count/s), and Aborts(count/s). Resets are LUN resets sent by VPLEX to a storage array LUN when it doesnot respond to I/O operations for over 20 seconds. Timeouts occur when an I/O fromVPLEX to a storage array LUN takes longer than 10 seconds to complete. Abortsoccur when an I/O from VPLEX to a storage array LUN is cancelled in transit. Resetsindicate more serious problems than timeouts and aborts.
The color of the heat map entries is the same for all metrics. It shows the relativeamount of resets, timeouts, or aborts, depending on the selected metric.
EMC Storage Analytics Dashboards
54 EMC Storage Analytics 3.1.1 Installation and User Guide
Front-end LatencyThis heat map has three modes: Read Latency (ms), Write Latency (ms), and QueuedOperations (Counts/s).
Write and Read Latency is the average write or read latency for all virtual volumesacross all front-end ports on a director.
For Read and Write Latency, the color of the heat map entries is based on a scale oflatency from 0 to 15ms, depending upon the selected metric. This scale is a basedon average customer requirements and may not represent a customer's particularrequirements for latency. In such cases, EMC recommends adjusting the scaleappropriately.
For VPLEX Metro systems consisting primarily of distributed devices, the WAN round-trip time greatly affects the front-end write latency. See the COM Latency widgets andthe WAN Link Usage widget in the VPLEX Communication dashboard.
Virtual Volumes LatencyThis heat map has three modes: Read Latency (ms), Write Latency (ms), and TotalReads & Writes (Counts/s).
Write and Read Latency is the average write or read latency for all virtual volumes ona director.
For Read and Write Latency, the color of the heat map entries is based on a scale oflatency from 0 to 15ms, depending on the selected metric. This scale is a based onaverage customer requirements and may not represent a customer's particularrequirements for latency. In such cases, EMC recommends adjusting the scaleappropriately.
Total Reads & Writes represents the virtual volume total reads and writes perdirector.
Storage Volumes LatencyThis heat map has two modes: Read Latency (ms) and Write Latency (ms).
Write and Read Latency is the average write or read latency for all storage volumeson a director.
For Read and Write Latency, the color of the heat map entries is based on a scale oflatency from 0 to 15ms, depending on the selected metric. This scale is a based onaverage customer requirements and may not represent a customer's particularrequirements for latency. In such cases, EMC recommends adjusting the scaleappropriately.
EMC Storage Analytics Dashboards
VPLEX Performance dashboard 55
VPLEX Communication dashboardClick the VPLEX Communication tab to view a collection of heat maps that provide asingle view of the performance of the communication links for a VPLEX configuration.
The EMC VPLEX Communication dashboard displays two types of heat maps:
l Metrics with definitive measurements such as intra-cluster local COM latency(0-15ms) are assigned color ranges from lowest (green) to highest (red).
l Metrics with varied values that cannot be assigned a range show relative values fromlowest (light blue) to highest (dark blue).
Cluster-1 COM LatencyThis heat map has one mode: Avererage Latency (ms).
The Cluster-1 latency statistics represent the intra-cluster local COM latency, whichoccurs within the rack and is typically fast (less than 1 msec).
For COM Latency, the color of the heat map entries is based on a scale of latencyfrom 0 to 15ms, depending upon the selected metric. This scale is a based onaverage customer requirements and may not represent a customer's particularrequirements for latency. In such cases, EMC recommends adjusting the scaleappropriately.
For VPLEX Metro, EMC recommends adjusting the scale based on your discoveredWAN round-trip time.
Cluster-2 COM LatencyThis heat map has one mode: Avererage Latency (ms).
The Cluster-2 latency statistics represent the intra-cluster local COM latency, whichoccurs within the rack and is typically small (less than 1 msec).
For COM Latency, the color of the heat map entries is based on a scale of latencyfrom 0 to 15ms, depending upon the selected metric. This scale is a based onaverage customer requirements and may not represent a customer's particularrequirements for latency. In such cases, EMC recommends adjusting the scaleappropriately.
For VPLEX Metro, EMC recommends adjusting the scale based on your discoveredWAN round-trip time.
WAN Link Usage (VPLEX Metro only)This heat map has four modes:
l Distributed Device Bytes Received (MB/s)
l Distributed Device Bytes Sent (MB/s)
l Distributed Device Rebuild Bytes Received (MB/s)
l Distributed Device Rebuild Bytes Sent (MB/s)
Distributed Device Bytes Received or Sent represent the total amount of trafficreceived or sent for all distributed devices on a director.
Distributed Device Rebuild Bytes Received or Sent represent the total amount ofrebuild/migration traffic received or sent for all distributed devices on a director.
The color of the heat map entries shows the relative number of distributed devicebytes transferred on a director, depending upon the selected metric.
EMC Storage Analytics Dashboards
56 EMC Storage Analytics 3.1.1 Installation and User Guide
XtremIO Overview dashboardClick the XtremIO Overview tab to view a collection of scorecard widgets that provide anoverview of the health for the XtremIO system.
The XtremIO Overview dashboard displays two types of heat maps:
l Metrics with definitive measurements are assigned color ranges from lowest (green)to highest (red).
l Metrics with varied values that cannot be assigned a range show relative values fromlowest (light blue) to highest (dark blue).
Cluster Data ReductionThis widget displays the Data Deduplication Ratio and Compression Ratio of eachcluster.
Note
Compression Ratio shows as blue if XtremIO version 2.4.1 is running.
Cluster EfficiencyThis widget displays the Thin Provisioning Savings (%) and the Total Efficiency ofeach cluster.
VolumeThis widget displays volumes in one of two modes: Total Capacity or ConsumedCapacity. Select a volume to display its sparkline charts.
ClusterThis widget displays, for each cluster, the Total Physical and Logical Capacity;Available Physical and Logical Capacity; and Consumed Physical and LogicalCapacity.
SnapshotThis widget displays snapshots in one of two modes: Total Capacity or ConsumedCapacity. Select a snapshot to display its sparkline charts.
EMC Storage Analytics Dashboards
XtremIO Overview dashboard 57
XtremIO Performance dashboardThe XtremIO Performance dashboard provides percent utilization of the StorageController CPUs, key volume, and SSD metrics and sparklines.
The XtremIO Performance dashboard displays two types of heat maps:
l Metrics with definitive measurements such as CPU usage (0-100%) are assignedcolor ranges from lowest (green) to highest (red).
l Metrics with varied values that cannot be assigned a range show relative values fromlowest (light blue) to highest (dark blue).
Storage Controllers CPU 1 Utilization (%)This widget shows the percent utilization of CPU 1.
Storage Controllers CPU 2 Utilization (%)This widget shows the percent utilization of CPU 2.
VolumeThis widget provides five modes: Total Operations, Total Bandwidth, Total Latency,Unaligned (%), and Average Block Size. Select a volume from this widget to displaysparklines for it.
SSDThis widget provides two modes: Endurance Remaining and Disk Utilization. Selectan SSD from this widget to display sparklines for it.
RecoverPoint Overview dashboardClick the RecoverPoint Overview tab to view a collection of heat maps that provide asingle view of the performance and capacity for all resources of VMAX with configuredadapter instances. Heat maps on this dashboard group the contents by adapter instance.
The XtremIO Overview dashboard displays heat maps for metrics with definitivemeasurements are assigned color ranges from lowest (green) to highest (red).
RecoverPoint for Virtual Machines SystemThis widget displays the number of RecoverPoint splitters and RecoverPoint clusters.It also provides summary information about the systems and clusters.
RecoverPoint ClusterThis widget displays the following for each RecoverPoint system, including summaryinformation:
l The number of consistency groups and the number of clusters
l The number of protected VMDKs and the number of protected user volumes
l The number of protected virtual machines for each RecoverPoint system
l The number of RecoverPoint Appliances (RPAs) for each cluster
Consistency GroupThis widget displays all enabled RecoverPoint consistency groups.
EMC Storage Analytics Dashboards
58 EMC Storage Analytics 3.1.1 Installation and User Guide
SplitterThis widget displays the following for each RecoverPoint system, including summaryinformation:
l The number of vSphere ESX Clusters, the related splitters, and the number ofconnected clusters
l The number of attached volumes
RecoverPoint for Virtual Machines Performance dashboardThe RecoverPoint Virtual Machines Performance dashboard provides a single view of themost important performance metrics for the resources.
The Performance dashboard displays two types of heat maps:
l Metrics with definitive measurements such as CPU usage (0-100%) are assignedcolor ranges from lowest (green) to highest (red).
l Metrics with varied values that cannot be assigned a range show relative values fromlowest (light blue) to highest (dark blue).
Lag (%)This widget shows the percent of the current lag for the link and for protection.
Current Protection Window (Hrs)This widget shows the protection window ratio in hours for consistency groups.
CPU Utilization (%)This widget shows the percent utilization of virtual RecoverPoint appliance (RPA)CPUs.
ClusterThis widget shows the performance for incoming writes (IOPS and KB/s) to clusters.
Consistency GroupThis widget shows the performance for incoming writes (IOPS and KB/s) toconsistency groups.
RecoverPoint Appliance (RPA)This widget shows the performance for incoming writes (IOPS and KB/s) to RPAs.
EMC Storage Analytics Dashboards
RecoverPoint for Virtual Machines Performance dashboard 59
Topology dashboardsThe topology dashboards provide an entry point for viewing resources and relationshipsbetween storage and virtual infrastructure objects for supported adapter instances.
Depending on the EMC adapter instance you installed, click the:
l VNX Topology tab
l VNXe Topology tab
l VMAX Topology tab
l VPLEX Topology tab
l XtremIO Topology tab
l RecoverPoint for Virtual Machines Topology tab
Details for every object in every widget are available by selecting the object and clickingthe Resource Detail icon at the top of each widget.
The topology dashboards contain the following widgets:
Resource TreeThis widget shows the end-to-end topology and health of resources across vSphereand storage domains. You can configure the hierarchy that is shown by changing thewidget settings; changing these settings does not alter the underlying objectrelationships in the database. Select any resource in this widget to view relatedresources in the stack.
Health TreeThe Health Tree widget provides a navigable visualization of resources that haveparent or child relationships to the resource you select in the Resource Tree widget.Single-click to select resources, or double-click to change the navigation focus.
Metric SparklinesThis widget shows sparklines for the metrics of the resource you select in theResource Tree widget.
EMC Storage Analytics Dashboards
60 EMC Storage Analytics 3.1.1 Installation and User Guide
Metrics dashboardsThe metrics dashboards display resources and metrics for storage systems and allow theuser to view graphs of resource metrics.
Depending on the EMC adapter instance you installed, click the:
l VNX Metrics tab
l VNXe Metrics tab
l VMAX Metrics tab
l XtremIO Metrics tab
l RecoverPoint for Virtual Machines Metrics tab
Widgets for the metrics dashboards are described next.
Resource Tree/Environment OverviewThis widget shows the end-to-end topology and health of resources across vSphereand storage domains. You can configure the hierarchy that is shown by changing thewidget settings; changing these settings does not alter the underlying objectrelationships in the database. Select any resource in this widget to view relatedresources in the stack.
Metric Selector/Metric PickerThis widget lists all the metrics that are collected for the resource you select in theResource Tree/Environment Overview widget. Double-click a metric to create a graphof the metric in the Metric Graph/Metric Chart widget.
Metric Graph/Metric ChartThis widget graphs the metrics you select in the Metric Selector/Metric Pickerwidget. Display multiple metrics simultaneously in a single graph or in multiplegraphs.
Resource Events (VNX/VNXe only)The resource event widget shows a graph that illustrates the health of the selectedobject over a period of time. Object events are labeled on the graph. When you hoverover or click a label, event details appear in a message box:
Id: 460Start Time: May 23, 2014 4:30:52 AMCancel Time: May 23, 2014 4:38:28 AMTrigger: NotificationResource: Pool 0 (Storage Pool)Details: FAST VP relocation completed.
The message box includes the event ID, start time, cancel time, trigger, resourcename, and event details.
To close the message box, click the X button at the top-right corner.
EMC Storage Analytics Dashboards
Metrics dashboards 61
Top-N dashboardsClick a Top-N dashboard to view your top performing devices at a glance.
The Top-N dashboards are available for:
l VNX
l VNXe
l VMAX
l XtremIO
l RecoverPoint for Virtual Machines
Top performing devices are selected based on the current value of the associated metricthat you configured for each widget. You can change the time period.
You can also change the number of objects in your top performer list.
VNX and VNXeBy default, a Top-N dashboard shows the top 5 devices in the following categories acrossyour VNX or VNXe systems:
l Top-5 by Read (IOPS)
l Top-5 by Write (IOPS)
l Top-5 by Read (MB/s)
l Top-5 by Write (MB/s)
l Top-5 by Consumed Capacity
VMAXBy default, a Top-N dashboard shows the top 10 devices in the following categoriesacross your VMAX system.
l Top-10 by Read (IOPS)
l Top-10 by Write (IOPS)
l Top-10 by Read (MB/s)
l Top-10 by Write (MB/s)
l Top-10 by Read Latency (ms)
l Top-10 by Write Latency (ms)
XtremIOBy default, a Top-N dashboard shows the top 10 devices in the following categoriesacross your XtremIO system.
l Top-10 by Read (IOPS)
l Top-10 by Write (IOPS)
l Top-10 by Read Latency (usec)
l Top-10 by Write (usec)
l Top-10 by Read Block Size (KB)
l Top-10 by Write Block Size (KB)
l Top-10 by Total Capacity (GB)
RecoverPoint for Virtual MachinesBy default, a Top-N dashboard shows the top 10 devices in the following categoriesacross RecoverPoint for Virtual Machine systems.
EMC Storage Analytics Dashboards
62 EMC Storage Analytics 3.1.1 Installation and User Guide

l Top-10 RPAs by Write (IOPS)
l Top-10 RPAs by Write (KB/s)
l Top-10 Clusters by Write (IOPS)
l Top-10 Clusters by Write (KB/s)
l Top-10 Consistency Groups by Write (IOPS)
l Top-10 Consistency Groups by Write (KB/s)
EMC Storage Analytics Dashboards
Top-N dashboards 63
Dashboard XChangeThe Dashboard XChange is a user community page for users to exchange EMC StorageAnalytics custom dashboards.
EMC Storage Analytics provides a set of default dashboards that provide you with avariety of functional views into your storage environment. EMC Storage Analytics alsoenables you to create custom dashboards that allow you to visualize collected dataaccording to your own requirements. The Dashboard XChange is an extension of thatfeature that enables you to:
l Export custom dashboards to the Dashboard XChange to benefit a wider EMC StorageAnalytics community
l Import custom dashboards from the Dashboard XChange to add value to your ownenvironment
The Dashboard XChange, hosted on the EMC Community Network, will also hostdashboards designed by EMC to showcase widget functions that may satisfy a particularuse-case in your environment. You can import these dashboards into your existingenvironment to enhance the functionality offered by EMC Storage Analytics. You can alsoedit imported dashboards to meet the specific requirements of your own storageenvironment.
The Dashboard XChange provides these resources to assist you in creating customdashboards:
l How-to video that shows how to create custom dashboards
l Best practices guide that provides detailed guidelines for dashboard creation
l Slide show that demonstrates how to import dashboards from or export them to theDashboard XChange
The EMC Storage Analytics Dashboard XChange is available at https://community.emc.com/community/connect/esa. Note that there are XChange Zones forsupported platforms.
EMC Storage Analytics Dashboards
64 EMC Storage Analytics 3.1.1 Installation and User Guide
CHAPTER 4
Resource Kinds and Metrics
This chapter contains the following topics:
l VNX Block metrics................................................................................................. 66l VNX File metrics.................................................................................................... 76l VMAX metrics........................................................................................................83l VNXe metrics.........................................................................................................86l VPLEX metrics....................................................................................................... 94l XtremIO metrics.................................................................................................. 107l RecoverPoint for Virtual Machines metrics...........................................................112
Resource Kinds and Metrics 65
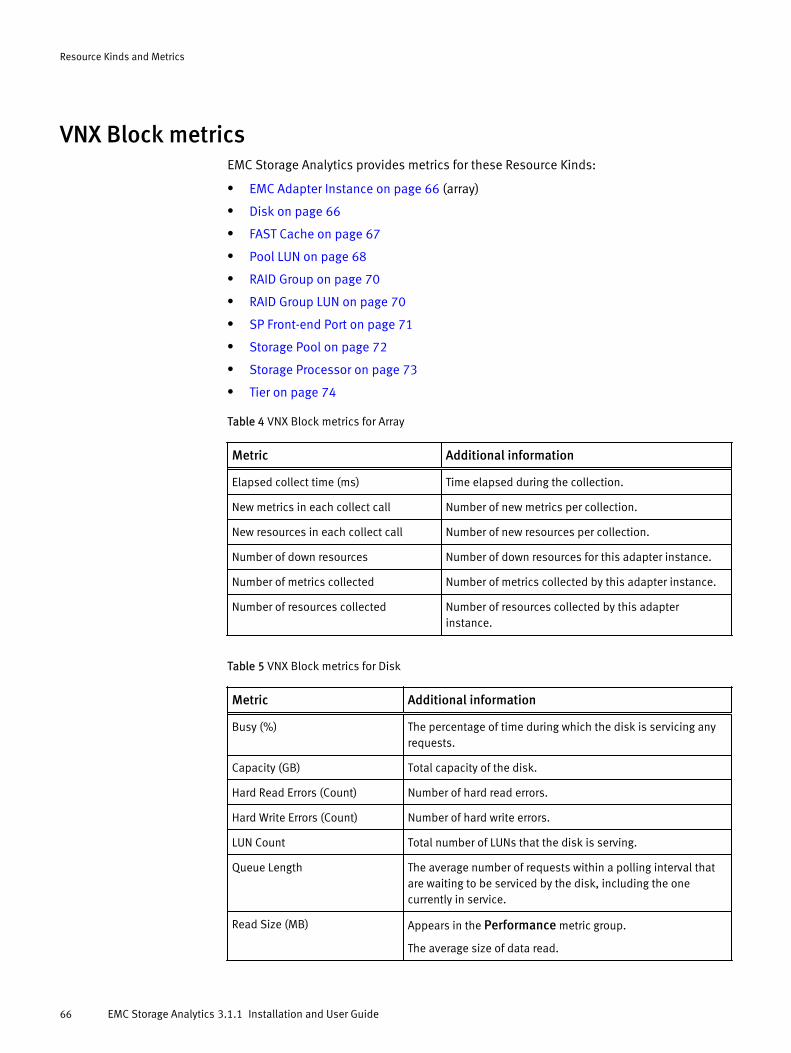
VNX Block metricsEMC Storage Analytics provides metrics for these Resource Kinds:
l EMC Adapter Instance on page 66 (array)
l Disk on page 66
l FAST Cache on page 67
l Pool LUN on page 68
l RAID Group on page 70
l RAID Group LUN on page 70
l SP Front-end Port on page 71
l Storage Pool on page 72
l Storage Processor on page 73
l Tier on page 74
Table 4 VNX Block metrics for Array
Metric Additional information
Elapsed collect time (ms) Time elapsed during the collection.
New metrics in each collect call Number of new metrics per collection.
New resources in each collect call Number of new resources per collection.
Number of down resources Number of down resources for this adapter instance.
Number of metrics collected Number of metrics collected by this adapter instance.
Number of resources collected Number of resources collected by this adapterinstance.
Table 5 VNX Block metrics for Disk
Metric Additional information
Busy (%) The percentage of time during which the disk is servicing anyrequests.
Capacity (GB) Total capacity of the disk.
Hard Read Errors (Count) Number of hard read errors.
Hard Write Errors (Count) Number of hard write errors.
LUN Count Total number of LUNs that the disk is serving.
Queue Length The average number of requests within a polling interval thatare waiting to be serviced by the disk, including the onecurrently in service.
Read Size (MB) Appears in the Performance metric group.
The average size of data read.
Resource Kinds and Metrics
66 EMC Storage Analytics 3.1.1 Installation and User Guide
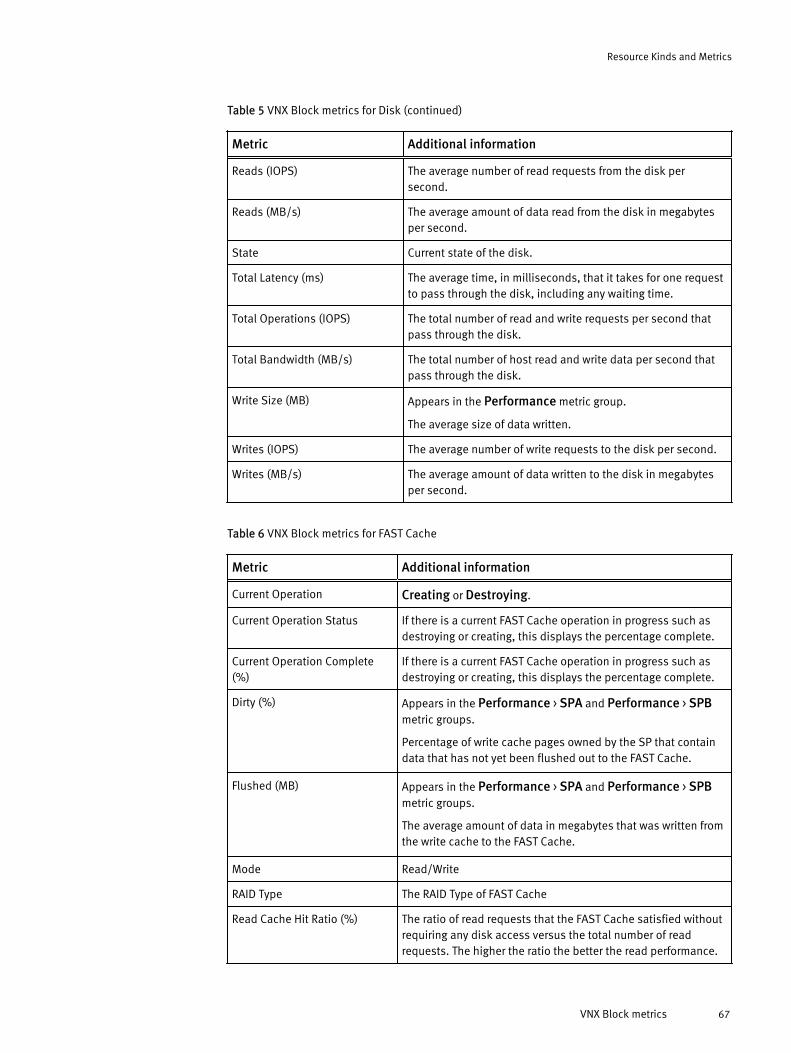
Table 5 VNX Block metrics for Disk (continued)
Metric Additional information
Reads (IOPS) The average number of read requests from the disk persecond.
Reads (MB/s) The average amount of data read from the disk in megabytesper second.
State Current state of the disk.
Total Latency (ms) The average time, in milliseconds, that it takes for one requestto pass through the disk, including any waiting time.
Total Operations (IOPS) The total number of read and write requests per second thatpass through the disk.
Total Bandwidth (MB/s) The total number of host read and write data per second thatpass through the disk.
Write Size (MB) Appears in the Performance metric group.
The average size of data written.
Writes (IOPS) The average number of write requests to the disk per second.
Writes (MB/s) The average amount of data written to the disk in megabytesper second.
Table 6 VNX Block metrics for FAST Cache
Metric Additional information
Current Operation Creating or Destroying.
Current Operation Status If there is a current FAST Cache operation in progress such asdestroying or creating, this displays the percentage complete.
Current Operation Complete(%)
If there is a current FAST Cache operation in progress such asdestroying or creating, this displays the percentage complete.
Dirty (%) Appears in the Performance > SPA and Performance > SPBmetric groups.
Percentage of write cache pages owned by the SP that containdata that has not yet been flushed out to the FAST Cache.
Flushed (MB) Appears in the Performance > SPA and Performance > SPBmetric groups.
The average amount of data in megabytes that was written fromthe write cache to the FAST Cache.
Mode Read/Write
RAID Type The RAID Type of FAST Cache
Read Cache Hit Ratio (%) The ratio of read requests that the FAST Cache satisfied withoutrequiring any disk access versus the total number of readrequests. The higher the ratio the better the read performance.
Resource Kinds and Metrics
VNX Block metrics 67
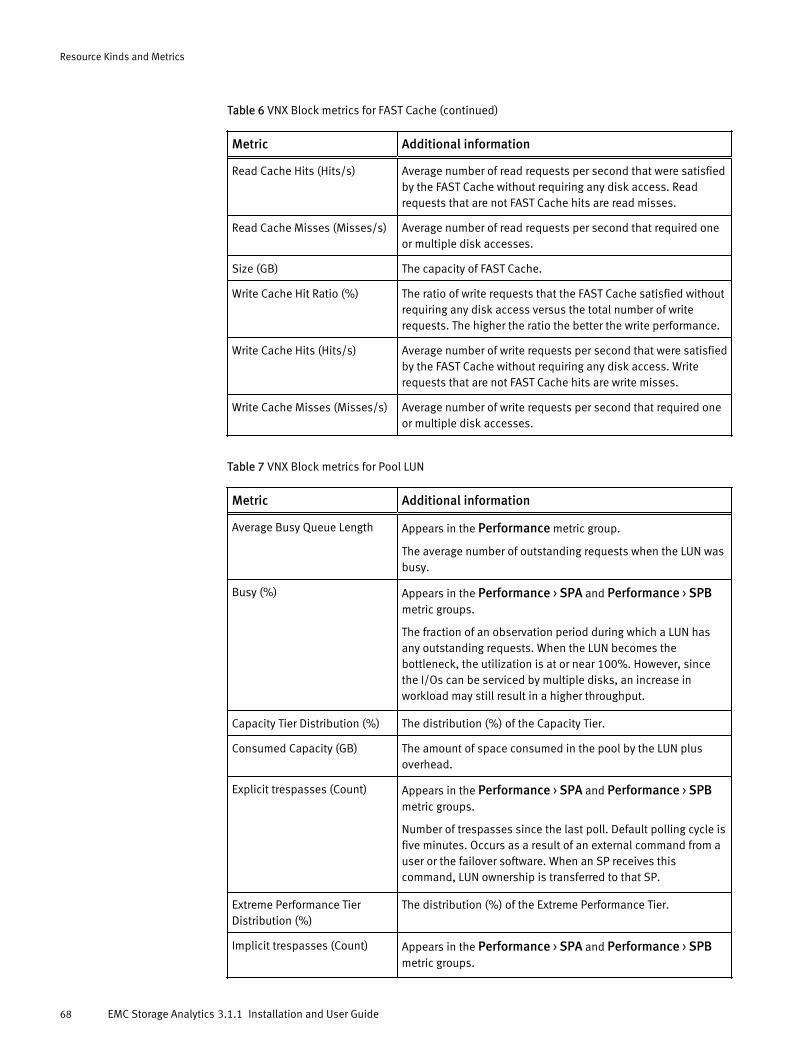
Table 6 VNX Block metrics for FAST Cache (continued)
Metric Additional information
Read Cache Hits (Hits/s) Average number of read requests per second that were satisfiedby the FAST Cache without requiring any disk access. Readrequests that are not FAST Cache hits are read misses.
Read Cache Misses (Misses/s) Average number of read requests per second that required oneor multiple disk accesses.
Size (GB) The capacity of FAST Cache.
Write Cache Hit Ratio (%) The ratio of write requests that the FAST Cache satisfied withoutrequiring any disk access versus the total number of writerequests. The higher the ratio the better the write performance.
Write Cache Hits (Hits/s) Average number of write requests per second that were satisfiedby the FAST Cache without requiring any disk access. Writerequests that are not FAST Cache hits are write misses.
Write Cache Misses (Misses/s) Average number of write requests per second that required oneor multiple disk accesses.
Table 7 VNX Block metrics for Pool LUN
Metric Additional information
Average Busy Queue Length Appears in the Performance metric group.
The average number of outstanding requests when the LUN wasbusy.
Busy (%) Appears in the Performance > SPA and Performance > SPBmetric groups.
The fraction of an observation period during which a LUN hasany outstanding requests. When the LUN becomes thebottleneck, the utilization is at or near 100%. However, sincethe I/Os can be serviced by multiple disks, an increase inworkload may still result in a higher throughput.
Capacity Tier Distribution (%) The distribution (%) of the Capacity Tier.
Consumed Capacity (GB) The amount of space consumed in the pool by the LUN plusoverhead.
Explicit trespasses (Count) Appears in the Performance > SPA and Performance > SPBmetric groups.
Number of trespasses since the last poll. Default polling cycle isfive minutes. Occurs as a result of an external command from auser or the failover software. When an SP receives thiscommand, LUN ownership is transferred to that SP.
Extreme Performance TierDistribution (%)
The distribution (%) of the Extreme Performance Tier.
Implicit trespasses (Count) Appears in the Performance > SPA and Performance > SPBmetric groups.
Resource Kinds and Metrics
68 EMC Storage Analytics 3.1.1 Installation and User Guide
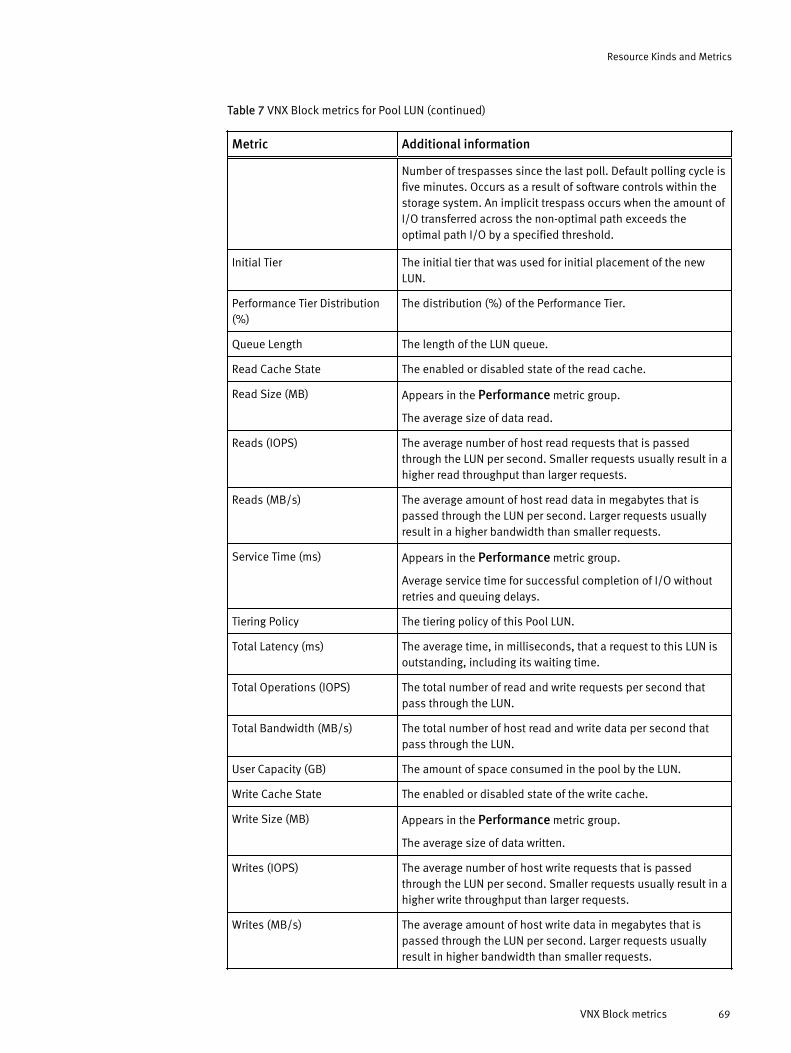
Table 7 VNX Block metrics for Pool LUN (continued)
Metric Additional information
Number of trespasses since the last poll. Default polling cycle isfive minutes. Occurs as a result of software controls within thestorage system. An implicit trespass occurs when the amount ofI/O transferred across the non-optimal path exceeds theoptimal path I/O by a specified threshold.
Initial Tier The initial tier that was used for initial placement of the newLUN.
Performance Tier Distribution(%)
The distribution (%) of the Performance Tier.
Queue Length The length of the LUN queue.
Read Cache State The enabled or disabled state of the read cache.
Read Size (MB) Appears in the Performance metric group.
The average size of data read.
Reads (IOPS) The average number of host read requests that is passedthrough the LUN per second. Smaller requests usually result in ahigher read throughput than larger requests.
Reads (MB/s) The average amount of host read data in megabytes that ispassed through the LUN per second. Larger requests usuallyresult in a higher bandwidth than smaller requests.
Service Time (ms) Appears in the Performance metric group.
Average service time for successful completion of I/O withoutretries and queuing delays.
Tiering Policy The tiering policy of this Pool LUN.
Total Latency (ms) The average time, in milliseconds, that a request to this LUN isoutstanding, including its waiting time.
Total Operations (IOPS) The total number of read and write requests per second thatpass through the LUN.
Total Bandwidth (MB/s) The total number of host read and write data per second thatpass through the LUN.
User Capacity (GB) The amount of space consumed in the pool by the LUN.
Write Cache State The enabled or disabled state of the write cache.
Write Size (MB) Appears in the Performance metric group.
The average size of data written.
Writes (IOPS) The average number of host write requests that is passedthrough the LUN per second. Smaller requests usually result in ahigher write throughput than larger requests.
Writes (MB/s) The average amount of host write data in megabytes that ispassed through the LUN per second. Larger requests usuallyresult in higher bandwidth than smaller requests.
Resource Kinds and Metrics
VNX Block metrics 69
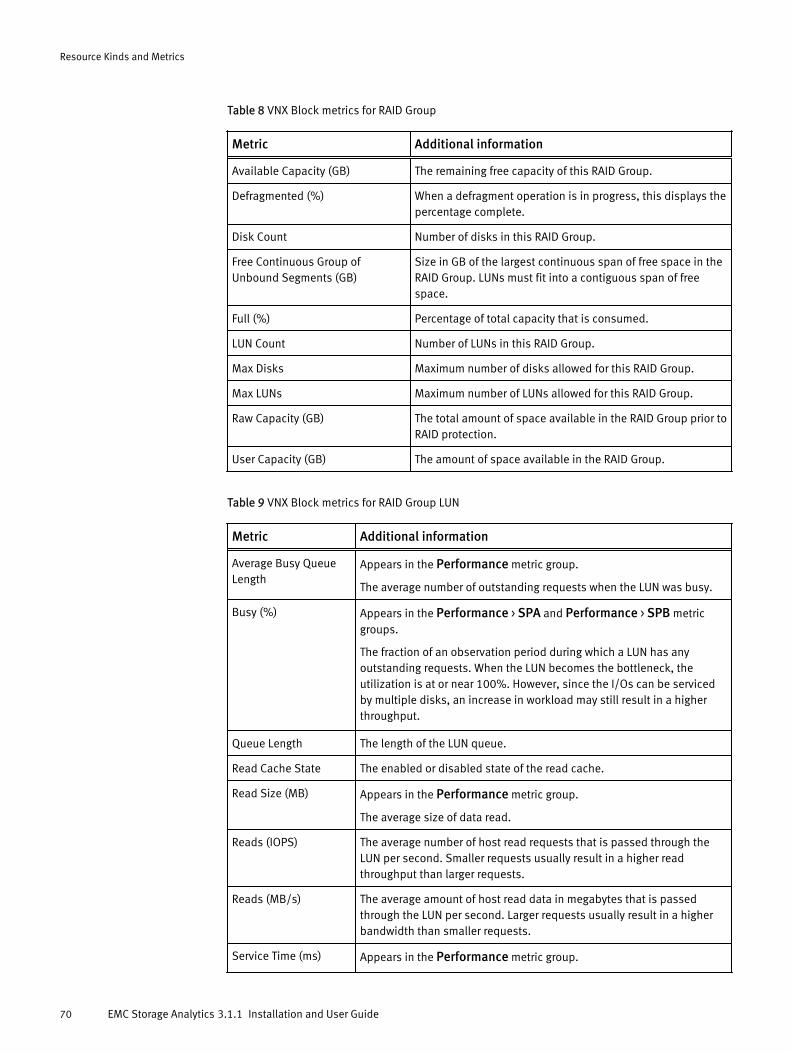
Table 8 VNX Block metrics for RAID Group
Metric Additional information
Available Capacity (GB) The remaining free capacity of this RAID Group.
Defragmented (%) When a defragment operation is in progress, this displays thepercentage complete.
Disk Count Number of disks in this RAID Group.
Free Continuous Group ofUnbound Segments (GB)
Size in GB of the largest continuous span of free space in theRAID Group. LUNs must fit into a contiguous span of freespace.
Full (%) Percentage of total capacity that is consumed.
LUN Count Number of LUNs in this RAID Group.
Max Disks Maximum number of disks allowed for this RAID Group.
Max LUNs Maximum number of LUNs allowed for this RAID Group.
Raw Capacity (GB) The total amount of space available in the RAID Group prior toRAID protection.
User Capacity (GB) The amount of space available in the RAID Group.
Table 9 VNX Block metrics for RAID Group LUN
Metric Additional information
Average Busy QueueLength
Appears in the Performance metric group.
The average number of outstanding requests when the LUN was busy.
Busy (%) Appears in the Performance > SPA and Performance > SPB metricgroups.
The fraction of an observation period during which a LUN has anyoutstanding requests. When the LUN becomes the bottleneck, theutilization is at or near 100%. However, since the I/Os can be servicedby multiple disks, an increase in workload may still result in a higherthroughput.
Queue Length The length of the LUN queue.
Read Cache State The enabled or disabled state of the read cache.
Read Size (MB) Appears in the Performance metric group.
The average size of data read.
Reads (IOPS) The average number of host read requests that is passed through theLUN per second. Smaller requests usually result in a higher readthroughput than larger requests.
Reads (MB/s) The average amount of host read data in megabytes that is passedthrough the LUN per second. Larger requests usually result in a higherbandwidth than smaller requests.
Service Time (ms) Appears in the Performance metric group.
Resource Kinds and Metrics
70 EMC Storage Analytics 3.1.1 Installation and User Guide
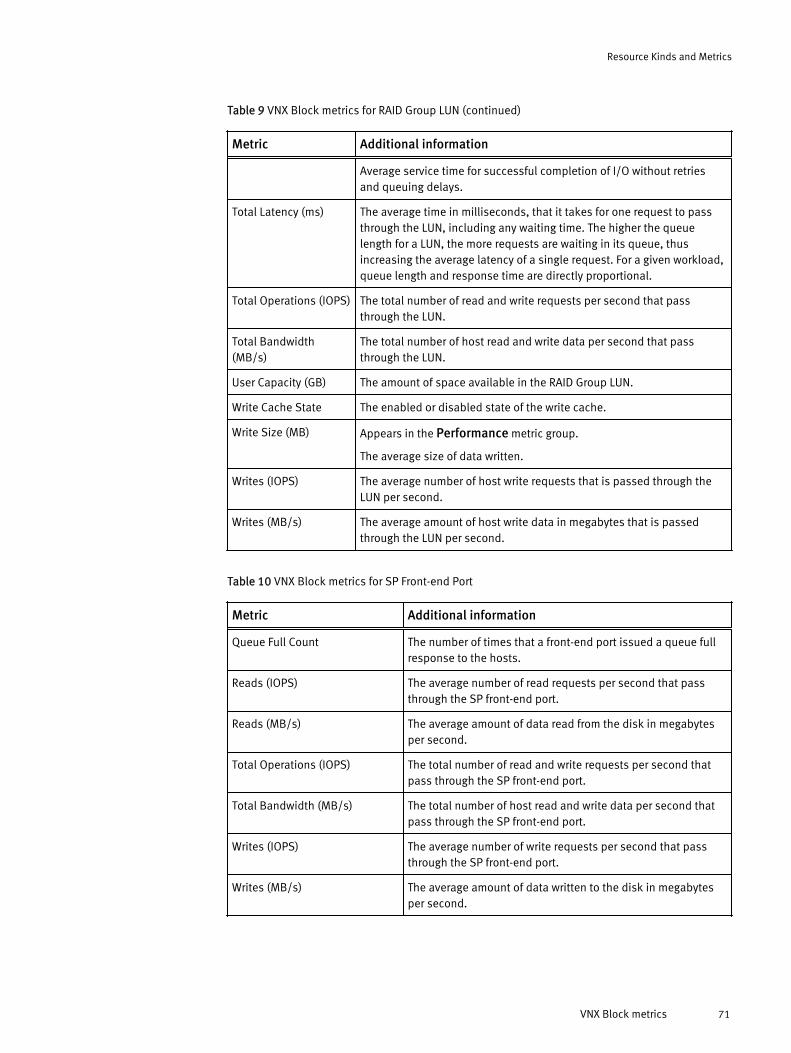
Table 9 VNX Block metrics for RAID Group LUN (continued)
Metric Additional information
Average service time for successful completion of I/O without retriesand queuing delays.
Total Latency (ms) The average time in milliseconds, that it takes for one request to passthrough the LUN, including any waiting time. The higher the queuelength for a LUN, the more requests are waiting in its queue, thusincreasing the average latency of a single request. For a given workload,queue length and response time are directly proportional.
Total Operations (IOPS) The total number of read and write requests per second that passthrough the LUN.
Total Bandwidth(MB/s)
The total number of host read and write data per second that passthrough the LUN.
User Capacity (GB) The amount of space available in the RAID Group LUN.
Write Cache State The enabled or disabled state of the write cache.
Write Size (MB) Appears in the Performance metric group.
The average size of data written.
Writes (IOPS) The average number of host write requests that is passed through theLUN per second.
Writes (MB/s) The average amount of host write data in megabytes that is passedthrough the LUN per second.
Table 10 VNX Block metrics for SP Front-end Port
Metric Additional information
Queue Full Count The number of times that a front-end port issued a queue fullresponse to the hosts.
Reads (IOPS) The average number of read requests per second that passthrough the SP front-end port.
Reads (MB/s) The average amount of data read from the disk in megabytesper second.
Total Operations (IOPS) The total number of read and write requests per second thatpass through the SP front-end port.
Total Bandwidth (MB/s) The total number of host read and write data per second thatpass through the SP front-end port.
Writes (IOPS) The average number of write requests per second that passthrough the SP front-end port.
Writes (MB/s) The average amount of data written to the disk in megabytesper second.
Resource Kinds and Metrics
VNX Block metrics 71
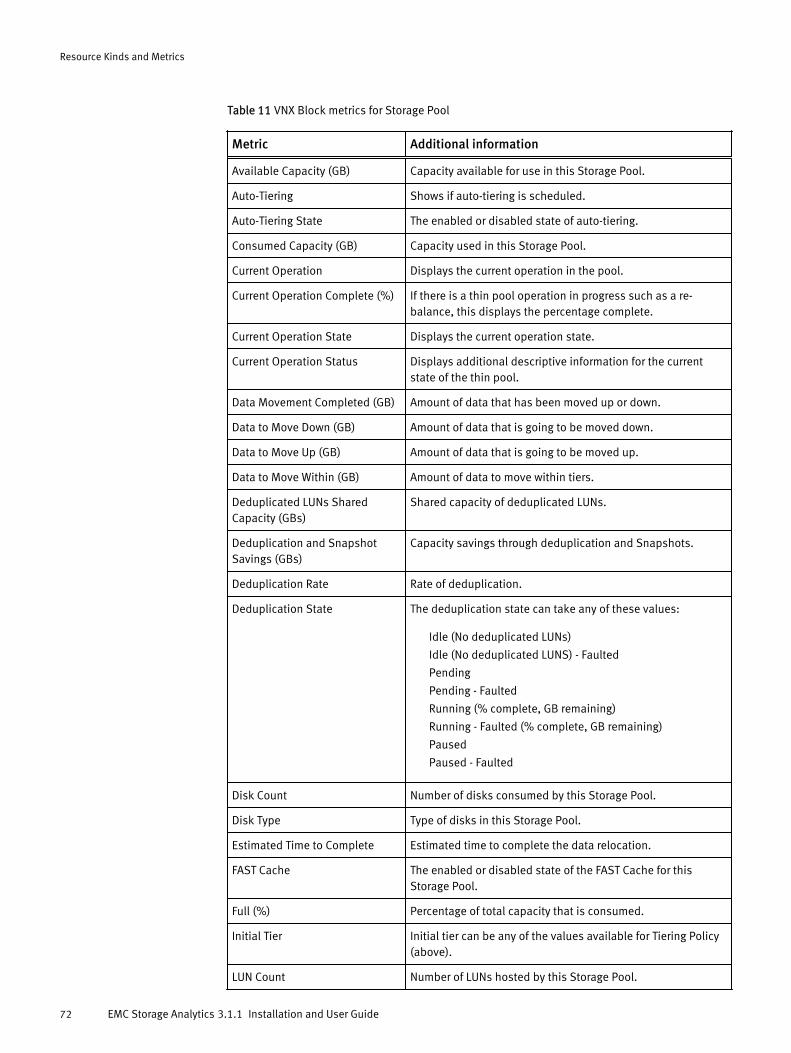
Table 11 VNX Block metrics for Storage Pool
Metric Additional information
Available Capacity (GB) Capacity available for use in this Storage Pool.
Auto-Tiering Shows if auto-tiering is scheduled.
Auto-Tiering State The enabled or disabled state of auto-tiering.
Consumed Capacity (GB) Capacity used in this Storage Pool.
Current Operation Displays the current operation in the pool.
Current Operation Complete (%) If there is a thin pool operation in progress such as a re-balance, this displays the percentage complete.
Current Operation State Displays the current operation state.
Current Operation Status Displays additional descriptive information for the currentstate of the thin pool.
Data Movement Completed (GB) Amount of data that has been moved up or down.
Data to Move Down (GB) Amount of data that is going to be moved down.
Data to Move Up (GB) Amount of data that is going to be moved up.
Data to Move Within (GB) Amount of data to move within tiers.
Deduplicated LUNs SharedCapacity (GBs)
Shared capacity of deduplicated LUNs.
Deduplication and SnapshotSavings (GBs)
Capacity savings through deduplication and Snapshots.
Deduplication Rate Rate of deduplication.
Deduplication State The deduplication state can take any of these values:
Idle (No deduplicated LUNs)
Idle (No deduplicated LUNS) - Faulted
Pending
Pending - Faulted
Running (% complete, GB remaining)
Running - Faulted (% complete, GB remaining)
Paused
Paused - Faulted
Disk Count Number of disks consumed by this Storage Pool.
Disk Type Type of disks in this Storage Pool.
Estimated Time to Complete Estimated time to complete the data relocation.
FAST Cache The enabled or disabled state of the FAST Cache for thisStorage Pool.
Full (%) Percentage of total capacity that is consumed.
Initial Tier Initial tier can be any of the values available for Tiering Policy(above).
LUN Count Number of LUNs hosted by this Storage Pool.
Resource Kinds and Metrics
72 EMC Storage Analytics 3.1.1 Installation and User Guide
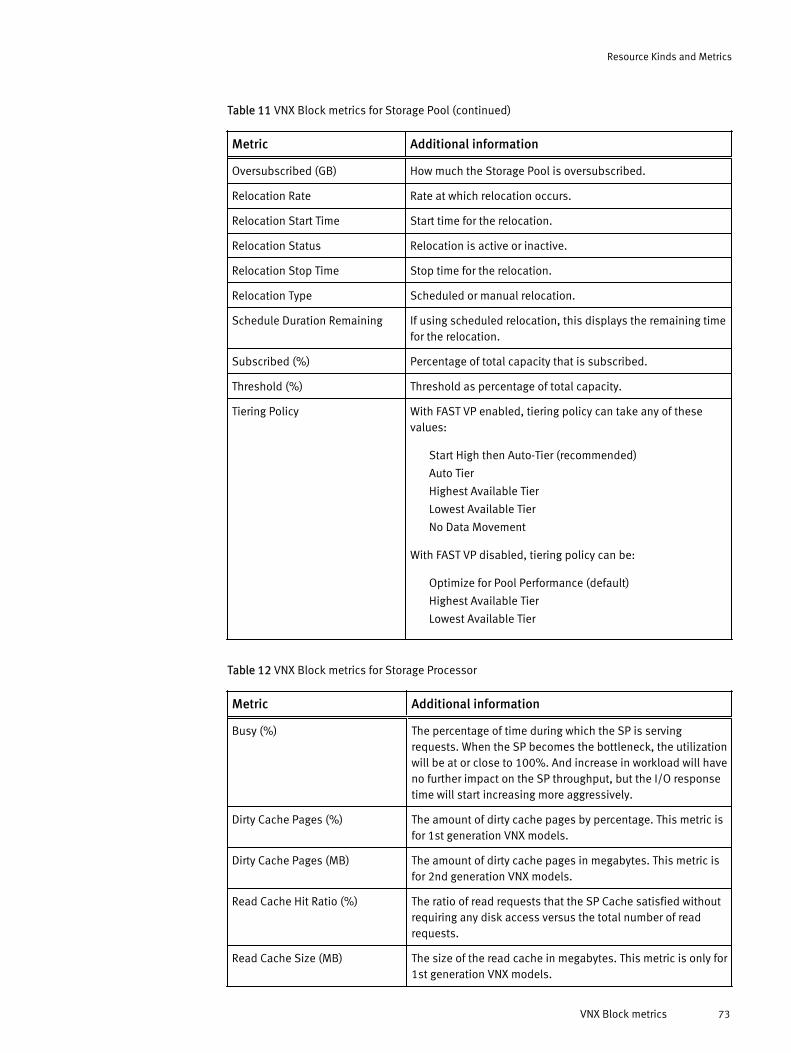
Table 11 VNX Block metrics for Storage Pool (continued)
Metric Additional information
Oversubscribed (GB) How much the Storage Pool is oversubscribed.
Relocation Rate Rate at which relocation occurs.
Relocation Start Time Start time for the relocation.
Relocation Status Relocation is active or inactive.
Relocation Stop Time Stop time for the relocation.
Relocation Type Scheduled or manual relocation.
Schedule Duration Remaining If using scheduled relocation, this displays the remaining timefor the relocation.
Subscribed (%) Percentage of total capacity that is subscribed.
Threshold (%) Threshold as percentage of total capacity.
Tiering Policy With FAST VP enabled, tiering policy can take any of thesevalues:
Start High then Auto-Tier (recommended)
Auto Tier
Highest Available Tier
Lowest Available Tier
No Data Movement
With FAST VP disabled, tiering policy can be:
Optimize for Pool Performance (default)
Highest Available Tier
Lowest Available Tier
Table 12 VNX Block metrics for Storage Processor
Metric Additional information
Busy (%) The percentage of time during which the SP is servingrequests. When the SP becomes the bottleneck, the utilizationwill be at or close to 100%. And increase in workload will haveno further impact on the SP throughput, but the I/O responsetime will start increasing more aggressively.
Dirty Cache Pages (%) The amount of dirty cache pages by percentage. This metric isfor 1st generation VNX models.
Dirty Cache Pages (MB) The amount of dirty cache pages in megabytes. This metric isfor 2nd generation VNX models.
Read Cache Hit Ratio (%) The ratio of read requests that the SP Cache satisfied withoutrequiring any disk access versus the total number of readrequests.
Read Cache Size (MB) The size of the read cache in megabytes. This metric is only for1st generation VNX models.
Resource Kinds and Metrics
VNX Block metrics 73
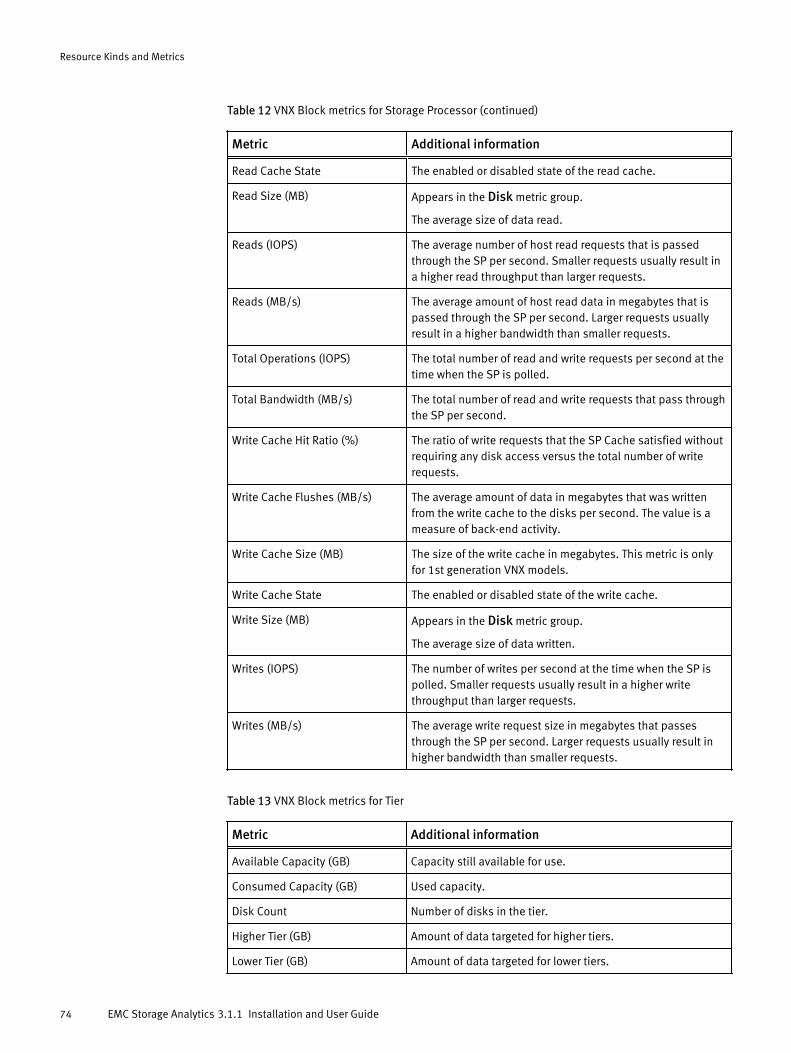
Table 12 VNX Block metrics for Storage Processor (continued)
Metric Additional information
Read Cache State The enabled or disabled state of the read cache.
Read Size (MB) Appears in the Disk metric group.
The average size of data read.
Reads (IOPS) The average number of host read requests that is passedthrough the SP per second. Smaller requests usually result ina higher read throughput than larger requests.
Reads (MB/s) The average amount of host read data in megabytes that ispassed through the SP per second. Larger requests usuallyresult in a higher bandwidth than smaller requests.
Total Operations (IOPS) The total number of read and write requests per second at thetime when the SP is polled.
Total Bandwidth (MB/s) The total number of read and write requests that pass throughthe SP per second.
Write Cache Hit Ratio (%) The ratio of write requests that the SP Cache satisfied withoutrequiring any disk access versus the total number of writerequests.
Write Cache Flushes (MB/s) The average amount of data in megabytes that was writtenfrom the write cache to the disks per second. The value is ameasure of back-end activity.
Write Cache Size (MB) The size of the write cache in megabytes. This metric is onlyfor 1st generation VNX models.
Write Cache State The enabled or disabled state of the write cache.
Write Size (MB) Appears in the Disk metric group.
The average size of data written.
Writes (IOPS) The number of writes per second at the time when the SP ispolled. Smaller requests usually result in a higher writethroughput than larger requests.
Writes (MB/s) The average write request size in megabytes that passesthrough the SP per second. Larger requests usually result inhigher bandwidth than smaller requests.
Table 13 VNX Block metrics for Tier
Metric Additional information
Available Capacity (GB) Capacity still available for use.
Consumed Capacity (GB) Used capacity.
Disk Count Number of disks in the tier.
Higher Tier (GB) Amount of data targeted for higher tiers.
Lower Tier (GB) Amount of data targeted for lower tiers.
Resource Kinds and Metrics
74 EMC Storage Analytics 3.1.1 Installation and User Guide
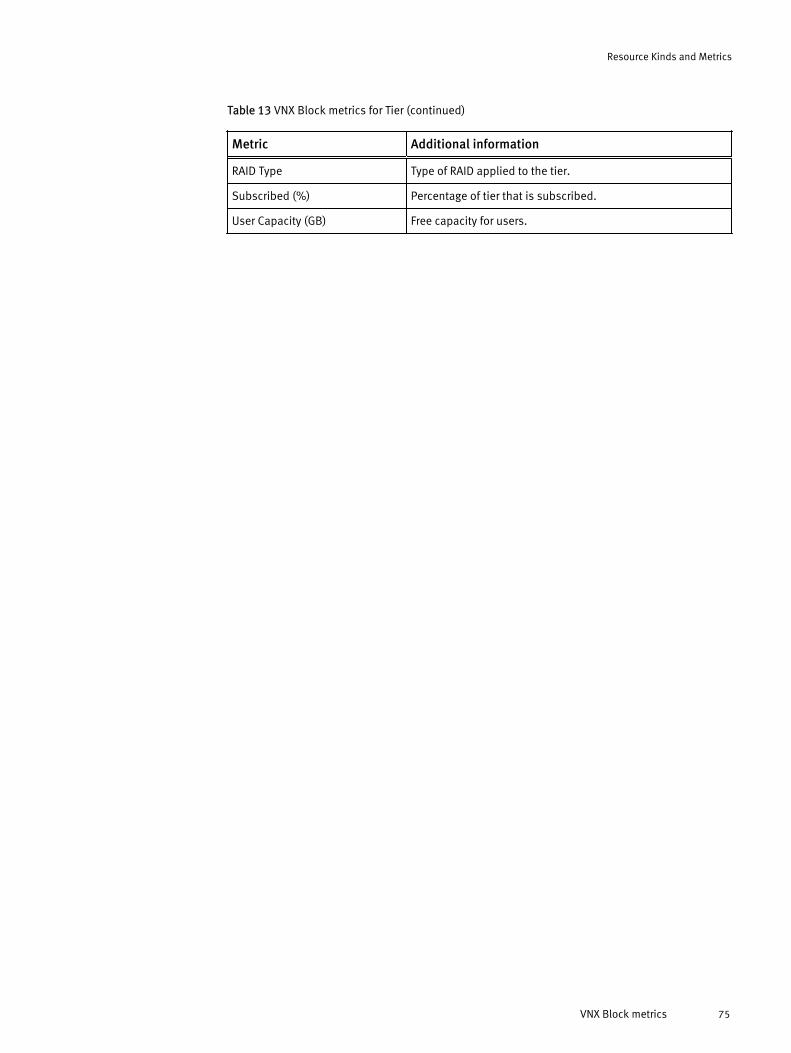
Table 13 VNX Block metrics for Tier (continued)
Metric Additional information
RAID Type Type of RAID applied to the tier.
Subscribed (%) Percentage of tier that is subscribed.
User Capacity (GB) Free capacity for users.
Resource Kinds and Metrics
VNX Block metrics 75
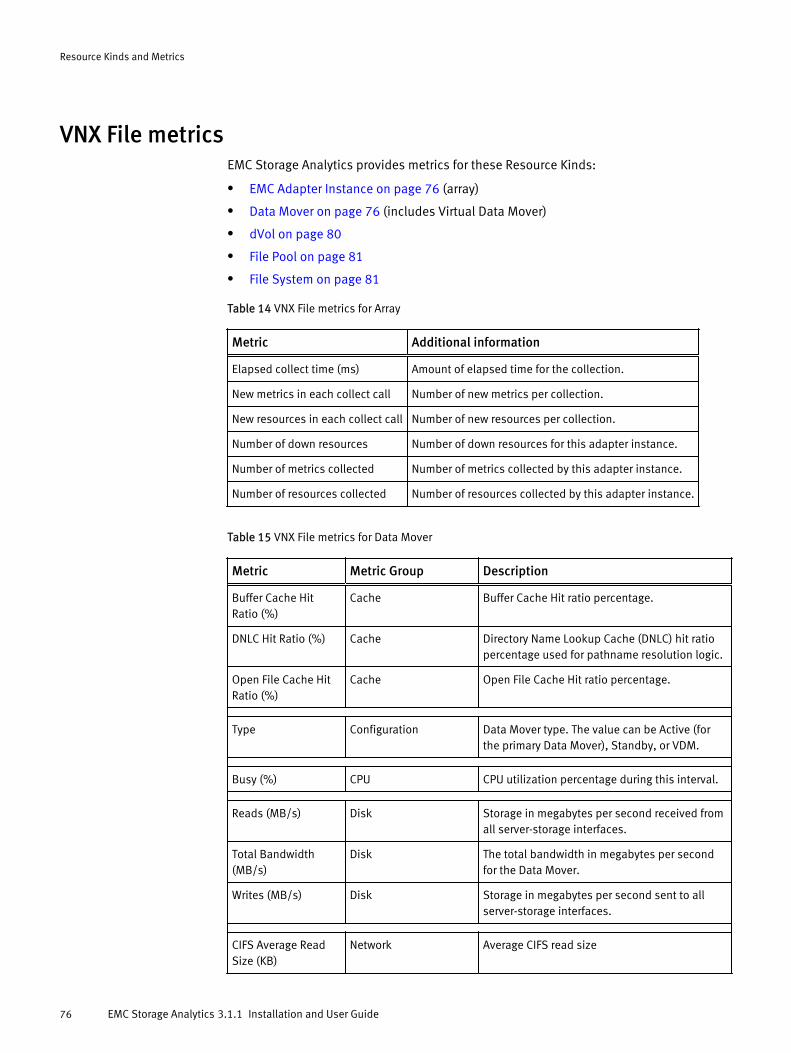
VNX File metricsEMC Storage Analytics provides metrics for these Resource Kinds:
l EMC Adapter Instance on page 76 (array)
l Data Mover on page 76 (includes Virtual Data Mover)
l dVol on page 80
l File Pool on page 81
l File System on page 81
Table 14 VNX File metrics for Array
Metric Additional information
Elapsed collect time (ms) Amount of elapsed time for the collection.
New metrics in each collect call Number of new metrics per collection.
New resources in each collect call Number of new resources per collection.
Number of down resources Number of down resources for this adapter instance.
Number of metrics collected Number of metrics collected by this adapter instance.
Number of resources collected Number of resources collected by this adapter instance.
Table 15 VNX File metrics for Data Mover
Metric Metric Group Description
Buffer Cache HitRatio (%)
Cache Buffer Cache Hit ratio percentage.
DNLC Hit Ratio (%) Cache Directory Name Lookup Cache (DNLC) hit ratiopercentage used for pathname resolution logic.
Open File Cache HitRatio (%)
Cache Open File Cache Hit ratio percentage.
Type Configuration Data Mover type. The value can be Active (forthe primary Data Mover), Standby, or VDM.
Busy (%) CPU CPU utilization percentage during this interval.
Reads (MB/s) Disk Storage in megabytes per second received fromall server-storage interfaces.
Total Bandwidth(MB/s)
Disk The total bandwidth in megabytes per secondfor the Data Mover.
Writes (MB/s) Disk Storage in megabytes per second sent to allserver-storage interfaces.
CIFS Average ReadSize (KB)
Network Average CIFS read size
Resource Kinds and Metrics
76 EMC Storage Analytics 3.1.1 Installation and User Guide
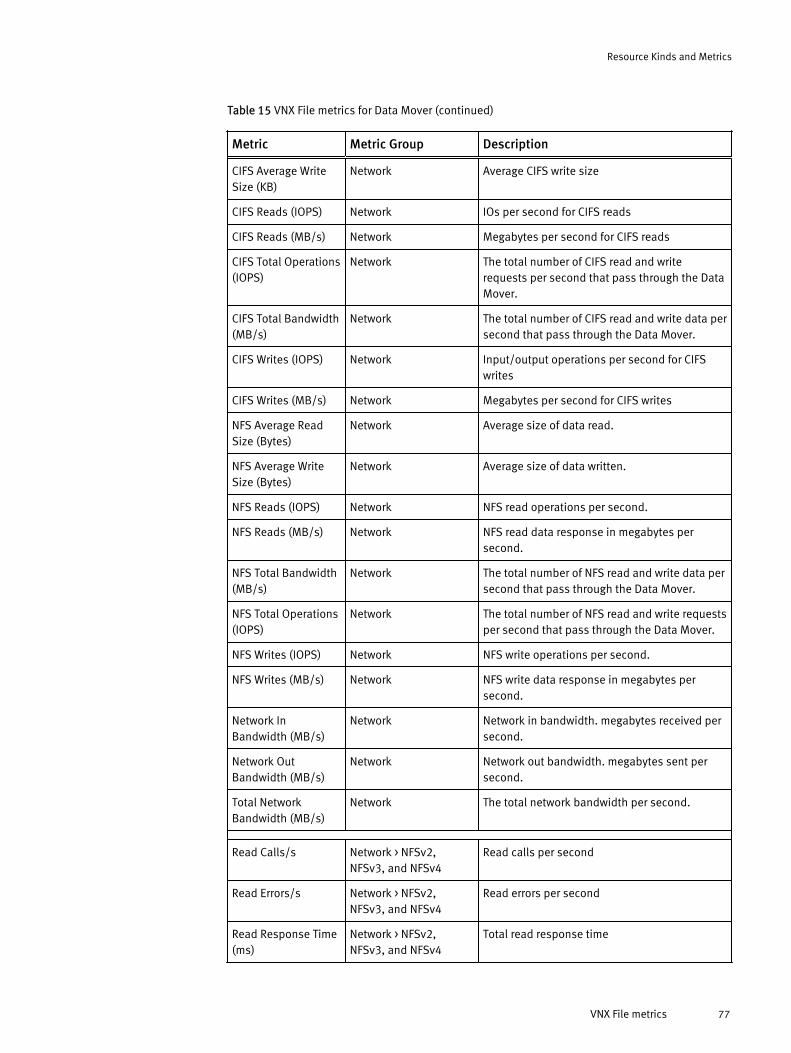
Table 15 VNX File metrics for Data Mover (continued)
Metric Metric Group Description
CIFS Average WriteSize (KB)
Network Average CIFS write size
CIFS Reads (IOPS) Network IOs per second for CIFS reads
CIFS Reads (MB/s) Network Megabytes per second for CIFS reads
CIFS Total Operations(IOPS)
Network The total number of CIFS read and writerequests per second that pass through the DataMover.
CIFS Total Bandwidth(MB/s)
Network The total number of CIFS read and write data persecond that pass through the Data Mover.
CIFS Writes (IOPS) Network Input/output operations per second for CIFSwrites
CIFS Writes (MB/s) Network Megabytes per second for CIFS writes
NFS Average ReadSize (Bytes)
Network Average size of data read.
NFS Average WriteSize (Bytes)
Network Average size of data written.
NFS Reads (IOPS) Network NFS read operations per second.
NFS Reads (MB/s) Network NFS read data response in megabytes persecond.
NFS Total Bandwidth(MB/s)
Network The total number of NFS read and write data persecond that pass through the Data Mover.
NFS Total Operations(IOPS)
Network The total number of NFS read and write requestsper second that pass through the Data Mover.
NFS Writes (IOPS) Network NFS write operations per second.
NFS Writes (MB/s) Network NFS write data response in megabytes persecond.
Network InBandwidth (MB/s)
Network Network in bandwidth. megabytes received persecond.
Network OutBandwidth (MB/s)
Network Network out bandwidth. megabytes sent persecond.
Total NetworkBandwidth (MB/s)
Network The total network bandwidth per second.
Read Calls/s Network > NFSv2,NFSv3, and NFSv4
Read calls per second
Read Errors/s Network > NFSv2,NFSv3, and NFSv4
Read errors per second
Read Response Time(ms)
Network > NFSv2,NFSv3, and NFSv4
Total read response time
Resource Kinds and Metrics
VNX File metrics 77
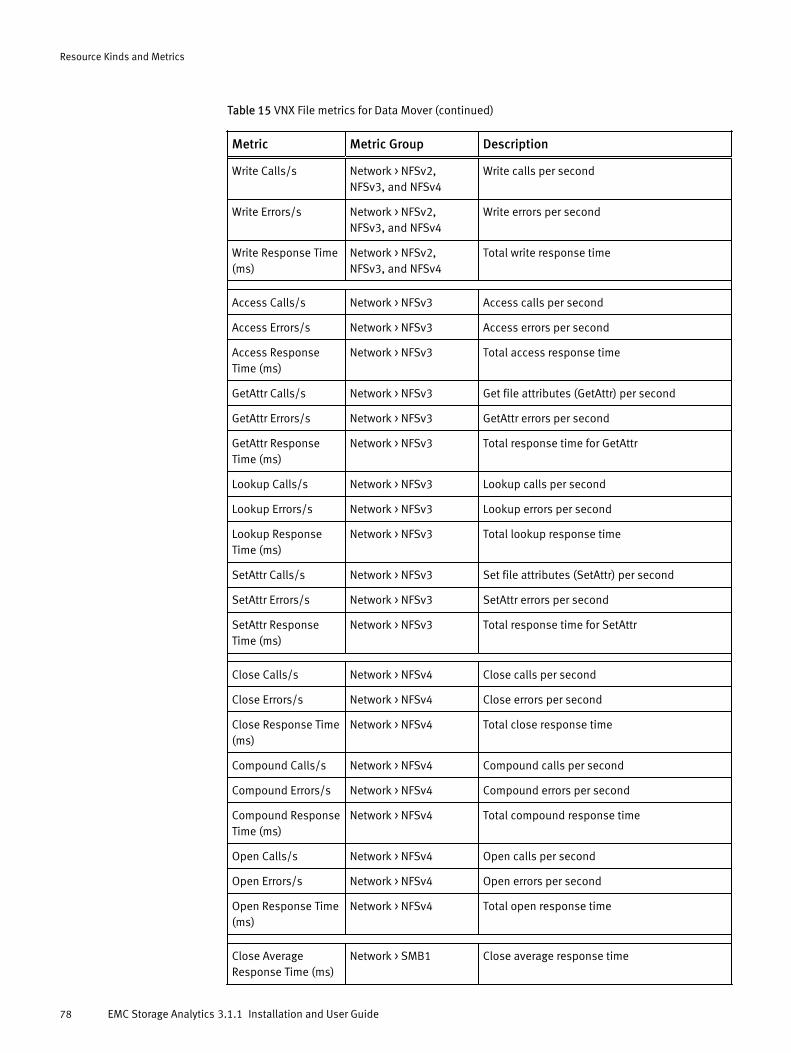
Table 15 VNX File metrics for Data Mover (continued)
Metric Metric Group Description
Write Calls/s Network > NFSv2,NFSv3, and NFSv4
Write calls per second
Write Errors/s Network > NFSv2,NFSv3, and NFSv4
Write errors per second
Write Response Time(ms)
Network > NFSv2,NFSv3, and NFSv4
Total write response time
Access Calls/s Network > NFSv3 Access calls per second
Access Errors/s Network > NFSv3 Access errors per second
Access ResponseTime (ms)
Network > NFSv3 Total access response time
GetAttr Calls/s Network > NFSv3 Get file attributes (GetAttr) per second
GetAttr Errors/s Network > NFSv3 GetAttr errors per second
GetAttr ResponseTime (ms)
Network > NFSv3 Total response time for GetAttr
Lookup Calls/s Network > NFSv3 Lookup calls per second
Lookup Errors/s Network > NFSv3 Lookup errors per second
Lookup ResponseTime (ms)
Network > NFSv3 Total lookup response time
SetAttr Calls/s Network > NFSv3 Set file attributes (SetAttr) per second
SetAttr Errors/s Network > NFSv3 SetAttr errors per second
SetAttr ResponseTime (ms)
Network > NFSv3 Total response time for SetAttr
Close Calls/s Network > NFSv4 Close calls per second
Close Errors/s Network > NFSv4 Close errors per second
Close Response Time(ms)
Network > NFSv4 Total close response time
Compound Calls/s Network > NFSv4 Compound calls per second
Compound Errors/s Network > NFSv4 Compound errors per second
Compound ResponseTime (ms)
Network > NFSv4 Total compound response time
Open Calls/s Network > NFSv4 Open calls per second
Open Errors/s Network > NFSv4 Open errors per second
Open Response Time(ms)
Network > NFSv4 Total open response time
Close AverageResponse Time (ms)
Network > SMB1 Close average response time
Resource Kinds and Metrics
78 EMC Storage Analytics 3.1.1 Installation and User Guide
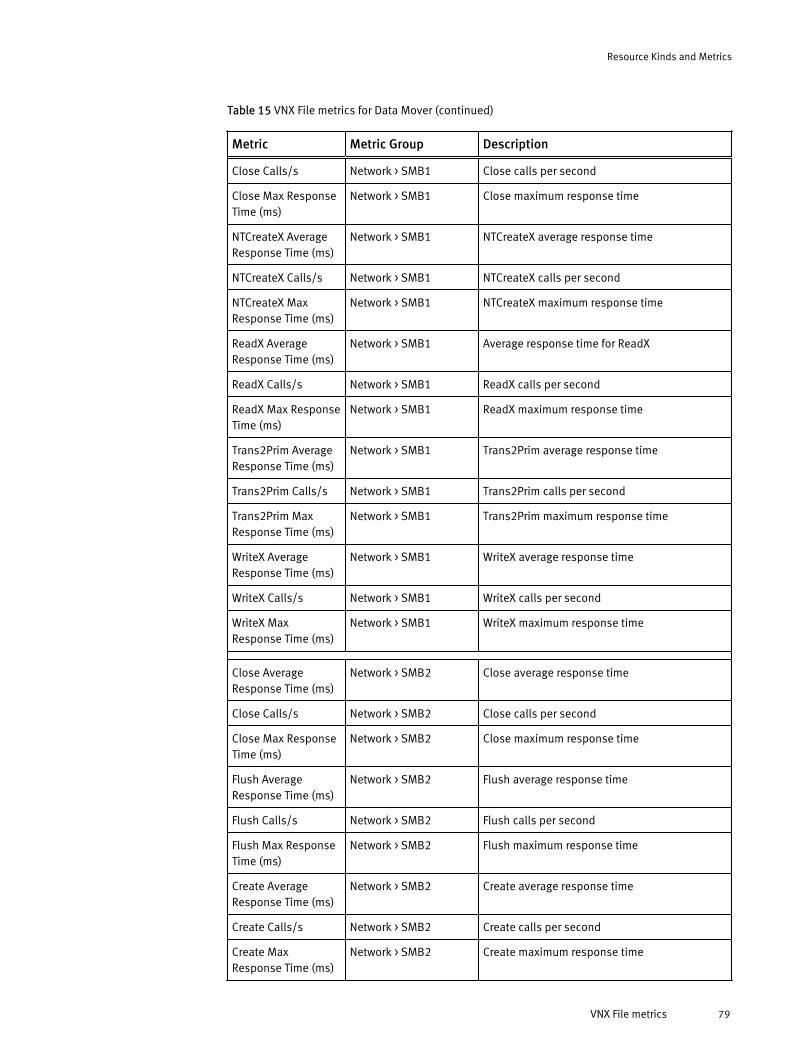
Table 15 VNX File metrics for Data Mover (continued)
Metric Metric Group Description
Close Calls/s Network > SMB1 Close calls per second
Close Max ResponseTime (ms)
Network > SMB1 Close maximum response time
NTCreateX AverageResponse Time (ms)
Network > SMB1 NTCreateX average response time
NTCreateX Calls/s Network > SMB1 NTCreateX calls per second
NTCreateX MaxResponse Time (ms)
Network > SMB1 NTCreateX maximum response time
ReadX AverageResponse Time (ms)
Network > SMB1 Average response time for ReadX
ReadX Calls/s Network > SMB1 ReadX calls per second
ReadX Max ResponseTime (ms)
Network > SMB1 ReadX maximum response time
Trans2Prim AverageResponse Time (ms)
Network > SMB1 Trans2Prim average response time
Trans2Prim Calls/s Network > SMB1 Trans2Prim calls per second
Trans2Prim MaxResponse Time (ms)
Network > SMB1 Trans2Prim maximum response time
WriteX AverageResponse Time (ms)
Network > SMB1 WriteX average response time
WriteX Calls/s Network > SMB1 WriteX calls per second
WriteX MaxResponse Time (ms)
Network > SMB1 WriteX maximum response time
Close AverageResponse Time (ms)
Network > SMB2 Close average response time
Close Calls/s Network > SMB2 Close calls per second
Close Max ResponseTime (ms)
Network > SMB2 Close maximum response time
Flush AverageResponse Time (ms)
Network > SMB2 Flush average response time
Flush Calls/s Network > SMB2 Flush calls per second
Flush Max ResponseTime (ms)
Network > SMB2 Flush maximum response time
Create AverageResponse Time (ms)
Network > SMB2 Create average response time
Create Calls/s Network > SMB2 Create calls per second
Create MaxResponse Time (ms)
Network > SMB2 Create maximum response time
Resource Kinds and Metrics
VNX File metrics 79
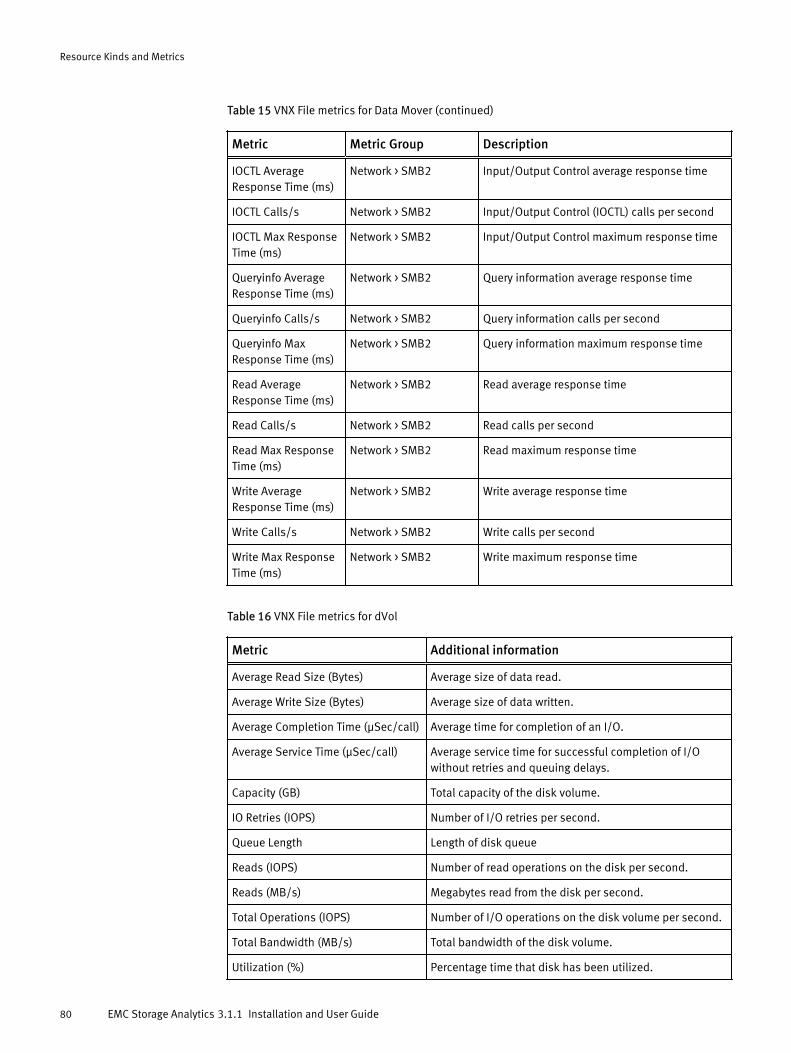
Table 15 VNX File metrics for Data Mover (continued)
Metric Metric Group Description
IOCTL AverageResponse Time (ms)
Network > SMB2 Input/Output Control average response time
IOCTL Calls/s Network > SMB2 Input/Output Control (IOCTL) calls per second
IOCTL Max ResponseTime (ms)
Network > SMB2 Input/Output Control maximum response time
Queryinfo AverageResponse Time (ms)
Network > SMB2 Query information average response time
Queryinfo Calls/s Network > SMB2 Query information calls per second
Queryinfo MaxResponse Time (ms)
Network > SMB2 Query information maximum response time
Read AverageResponse Time (ms)
Network > SMB2 Read average response time
Read Calls/s Network > SMB2 Read calls per second
Read Max ResponseTime (ms)
Network > SMB2 Read maximum response time
Write AverageResponse Time (ms)
Network > SMB2 Write average response time
Write Calls/s Network > SMB2 Write calls per second
Write Max ResponseTime (ms)
Network > SMB2 Write maximum response time
Table 16 VNX File metrics for dVol
Metric Additional information
Average Read Size (Bytes) Average size of data read.
Average Write Size (Bytes) Average size of data written.
Average Completion Time (µSec/call) Average time for completion of an I/O.
Average Service Time (µSec/call) Average service time for successful completion of I/Owithout retries and queuing delays.
Capacity (GB) Total capacity of the disk volume.
IO Retries (IOPS) Number of I/O retries per second.
Queue Length Length of disk queue
Reads (IOPS) Number of read operations on the disk per second.
Reads (MB/s) Megabytes read from the disk per second.
Total Operations (IOPS) Number of I/O operations on the disk volume per second.
Total Bandwidth (MB/s) Total bandwidth of the disk volume.
Utilization (%) Percentage time that disk has been utilized.
Resource Kinds and Metrics
80 EMC Storage Analytics 3.1.1 Installation and User Guide
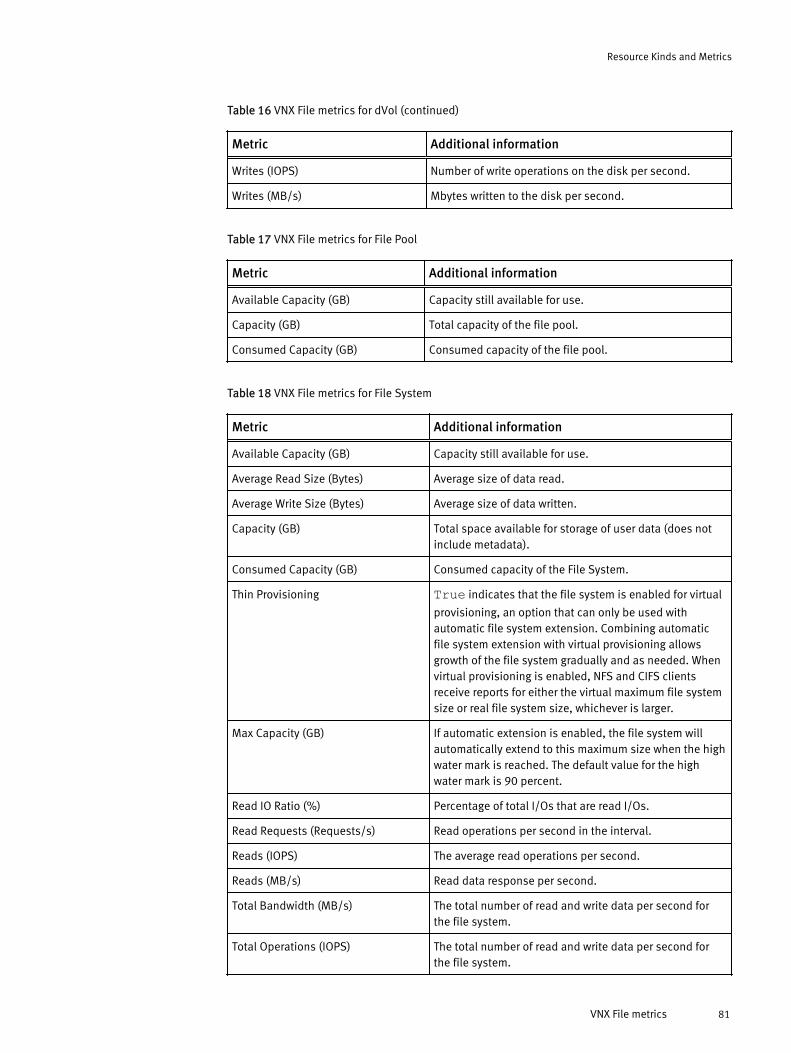
Table 16 VNX File metrics for dVol (continued)
Metric Additional information
Writes (IOPS) Number of write operations on the disk per second.
Writes (MB/s) Mbytes written to the disk per second.
Table 17 VNX File metrics for File Pool
Metric Additional information
Available Capacity (GB) Capacity still available for use.
Capacity (GB) Total capacity of the file pool.
Consumed Capacity (GB) Consumed capacity of the file pool.
Table 18 VNX File metrics for File System
Metric Additional information
Available Capacity (GB) Capacity still available for use.
Average Read Size (Bytes) Average size of data read.
Average Write Size (Bytes) Average size of data written.
Capacity (GB) Total space available for storage of user data (does notinclude metadata).
Consumed Capacity (GB) Consumed capacity of the File System.
Thin Provisioning True indicates that the file system is enabled for virtual
provisioning, an option that can only be used withautomatic file system extension. Combining automaticfile system extension with virtual provisioning allowsgrowth of the file system gradually and as needed. Whenvirtual provisioning is enabled, NFS and CIFS clientsreceive reports for either the virtual maximum file systemsize or real file system size, whichever is larger.
Max Capacity (GB) If automatic extension is enabled, the file system willautomatically extend to this maximum size when the highwater mark is reached. The default value for the highwater mark is 90 percent.
Read IO Ratio (%) Percentage of total I/Os that are read I/Os.
Read Requests (Requests/s) Read operations per second in the interval.
Reads (IOPS) The average read operations per second.
Reads (MB/s) Read data response per second.
Total Bandwidth (MB/s) The total number of read and write data per second forthe file system.
Total Operations (IOPS) The total number of read and write data per second forthe file system.
Resource Kinds and Metrics
VNX File metrics 81
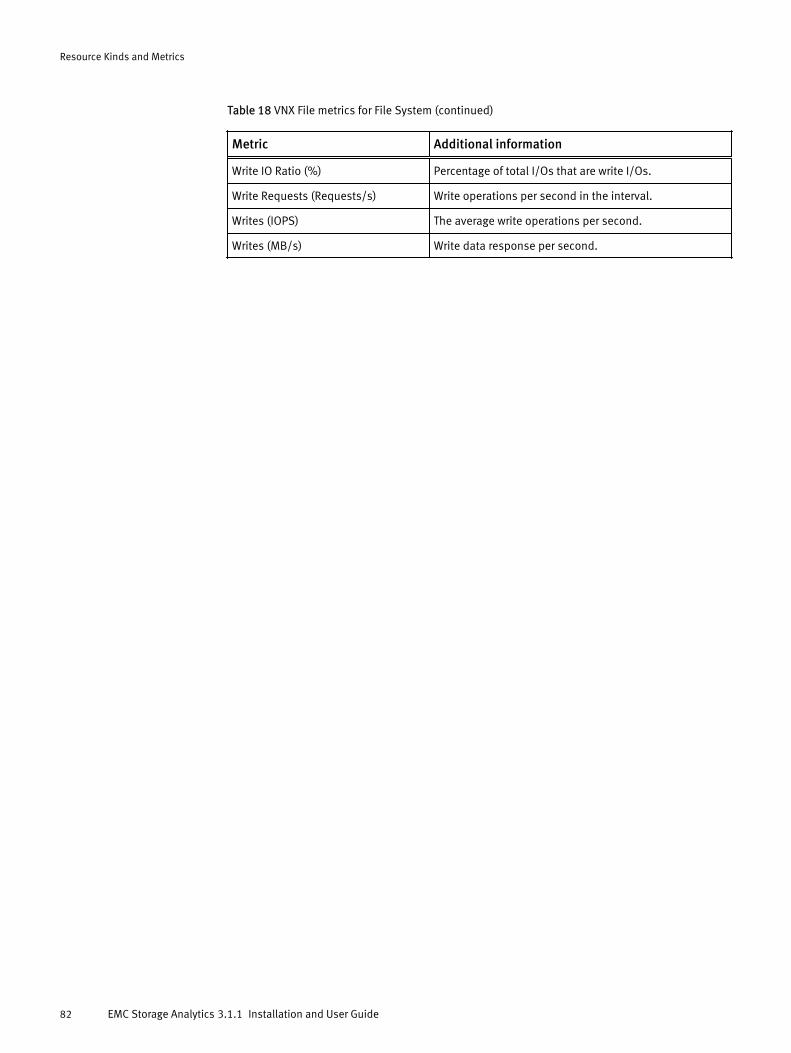
Table 18 VNX File metrics for File System (continued)
Metric Additional information
Write IO Ratio (%) Percentage of total I/Os that are write I/Os.
Write Requests (Requests/s) Write operations per second in the interval.
Writes (IOPS) The average write operations per second.
Writes (MB/s) Write data response per second.
Resource Kinds and Metrics
82 EMC Storage Analytics 3.1.1 Installation and User Guide
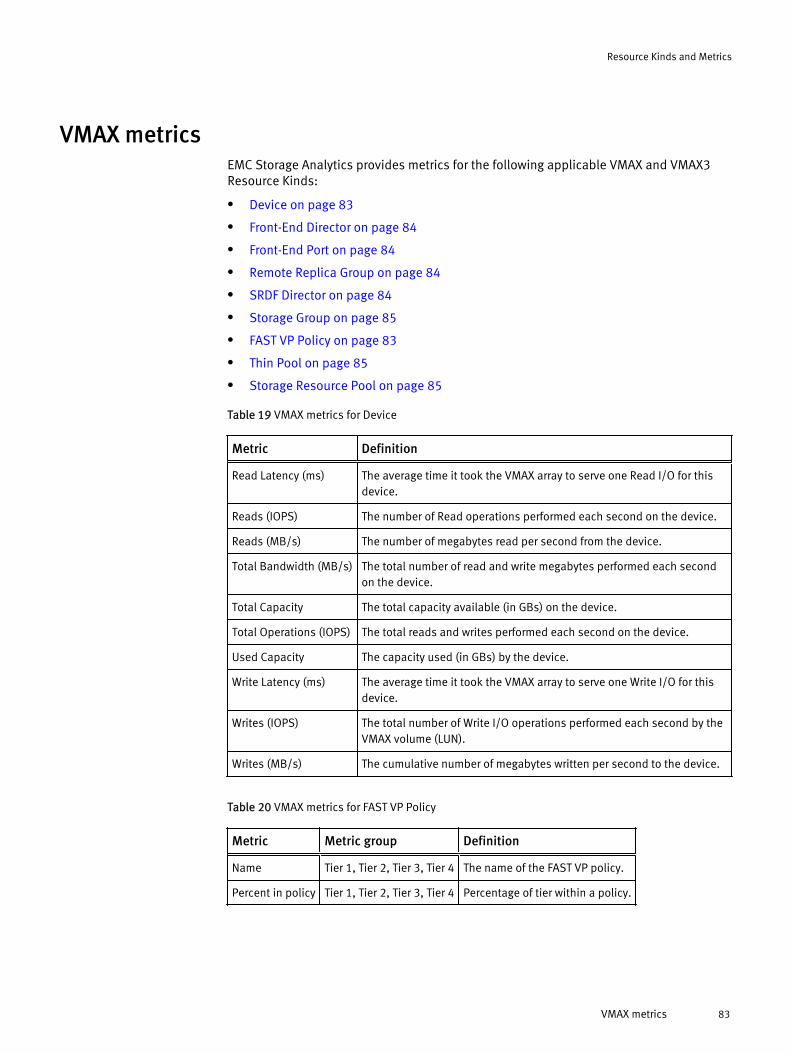
VMAX metricsEMC Storage Analytics provides metrics for the following applicable VMAX and VMAX3Resource Kinds:
l Device on page 83
l Front-End Director on page 84
l Front-End Port on page 84
l Remote Replica Group on page 84
l SRDF Director on page 84
l Storage Group on page 85
l FAST VP Policy on page 83
l Thin Pool on page 85
l Storage Resource Pool on page 85
Table 19 VMAX metrics for Device
Metric Definition
Read Latency (ms) The average time it took the VMAX array to serve one Read I/O for thisdevice.
Reads (IOPS) The number of Read operations performed each second on the device.
Reads (MB/s) The number of megabytes read per second from the device.
Total Bandwidth (MB/s) The total number of read and write megabytes performed each secondon the device.
Total Capacity The total capacity available (in GBs) on the device.
Total Operations (IOPS) The total reads and writes performed each second on the device.
Used Capacity The capacity used (in GBs) by the device.
Write Latency (ms) The average time it took the VMAX array to serve one Write I/O for thisdevice.
Writes (IOPS) The total number of Write I/O operations performed each second by theVMAX volume (LUN).
Writes (MB/s) The cumulative number of megabytes written per second to the device.
Table 20 VMAX metrics for FAST VP Policy
Metric Metric group Definition
Name Tier 1, Tier 2, Tier 3, Tier 4 The name of the FAST VP policy.
Percent in policy Tier 1, Tier 2, Tier 3, Tier 4 Percentage of tier within a policy.
Resource Kinds and Metrics
VMAX metrics 83
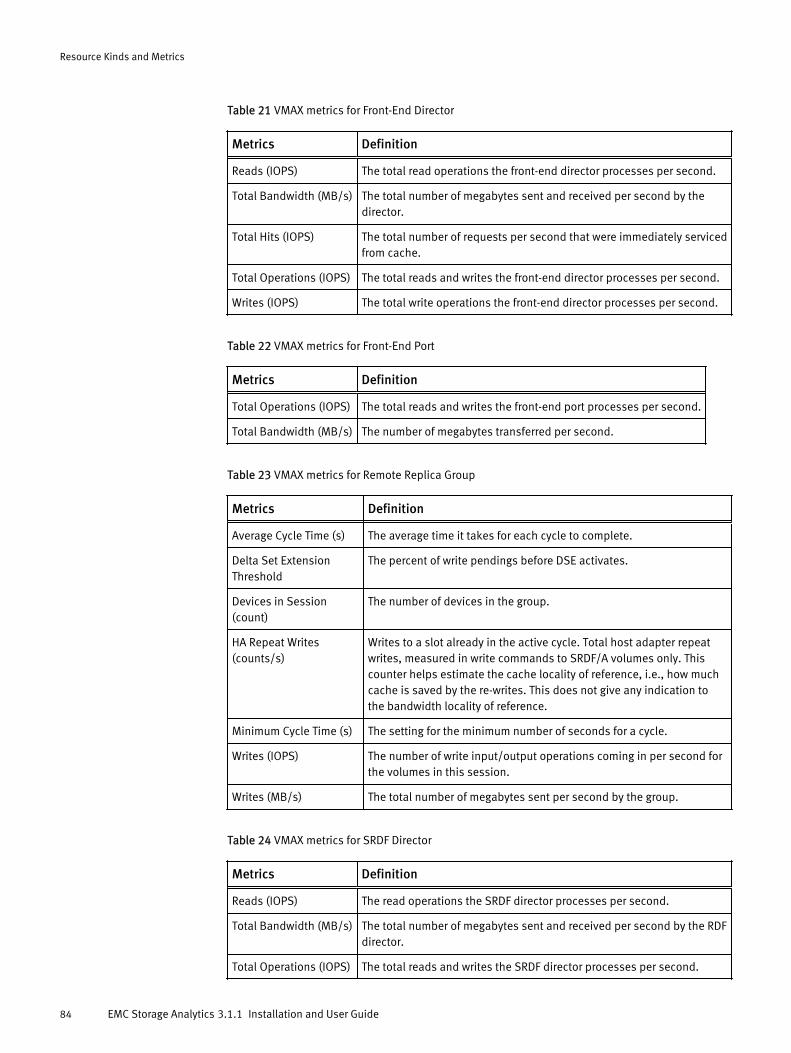
Table 21 VMAX metrics for Front-End Director
Metrics Definition
Reads (IOPS) The total read operations the front-end director processes per second.
Total Bandwidth (MB/s) The total number of megabytes sent and received per second by thedirector.
Total Hits (IOPS) The total number of requests per second that were immediately servicedfrom cache.
Total Operations (IOPS) The total reads and writes the front-end director processes per second.
Writes (IOPS) The total write operations the front-end director processes per second.
Table 22 VMAX metrics for Front-End Port
Metrics Definition
Total Operations (IOPS) The total reads and writes the front-end port processes per second.
Total Bandwidth (MB/s) The number of megabytes transferred per second.
Table 23 VMAX metrics for Remote Replica Group
Metrics Definition
Average Cycle Time (s) The average time it takes for each cycle to complete.
Delta Set ExtensionThreshold
The percent of write pendings before DSE activates.
Devices in Session(count)
The number of devices in the group.
HA Repeat Writes(counts/s)
Writes to a slot already in the active cycle. Total host adapter repeatwrites, measured in write commands to SRDF/A volumes only. Thiscounter helps estimate the cache locality of reference, i.e., how muchcache is saved by the re-writes. This does not give any indication tothe bandwidth locality of reference.
Minimum Cycle Time (s) The setting for the minimum number of seconds for a cycle.
Writes (IOPS) The number of write input/output operations coming in per second forthe volumes in this session.
Writes (MB/s) The total number of megabytes sent per second by the group.
Table 24 VMAX metrics for SRDF Director
Metrics Definition
Reads (IOPS) The read operations the SRDF director processes per second.
Total Bandwidth (MB/s) The total number of megabytes sent and received per second by the RDFdirector.
Total Operations (IOPS) The total reads and writes the SRDF director processes per second.
Resource Kinds and Metrics
84 EMC Storage Analytics 3.1.1 Installation and User Guide
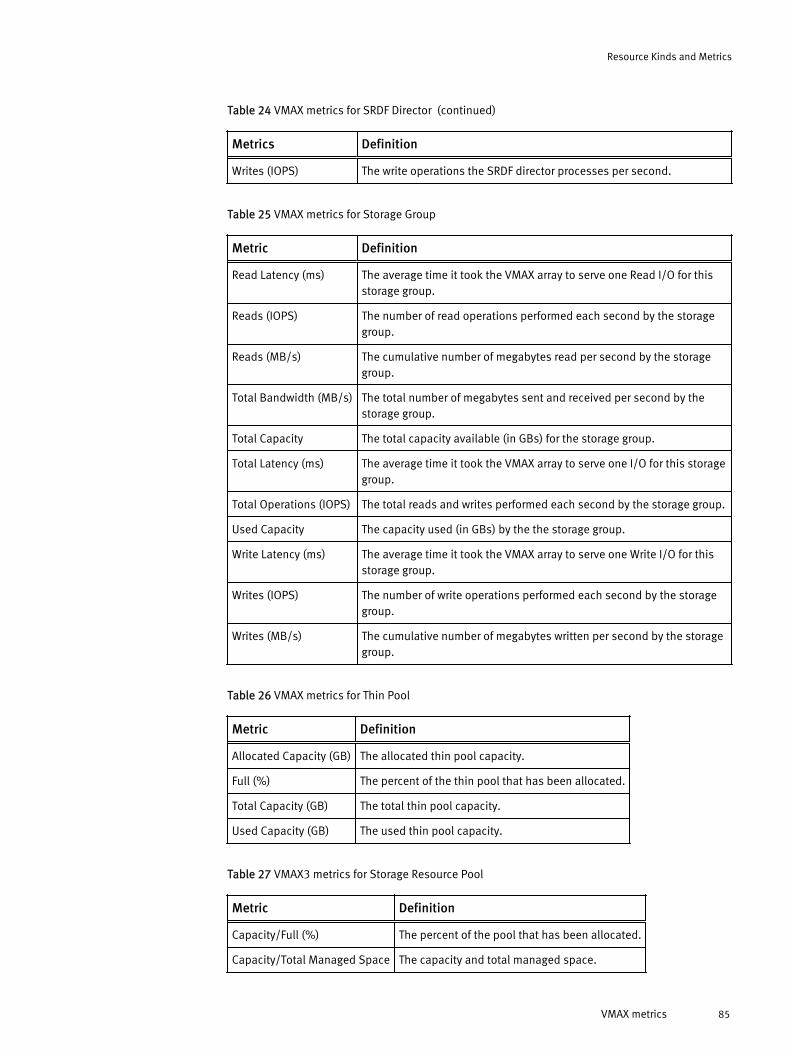
Table 24 VMAX metrics for SRDF Director (continued)
Metrics Definition
Writes (IOPS) The write operations the SRDF director processes per second.
Table 25 VMAX metrics for Storage Group
Metric Definition
Read Latency (ms) The average time it took the VMAX array to serve one Read I/O for thisstorage group.
Reads (IOPS) The number of read operations performed each second by the storagegroup.
Reads (MB/s) The cumulative number of megabytes read per second by the storagegroup.
Total Bandwidth (MB/s) The total number of megabytes sent and received per second by thestorage group.
Total Capacity The total capacity available (in GBs) for the storage group.
Total Latency (ms) The average time it took the VMAX array to serve one I/O for this storagegroup.
Total Operations (IOPS) The total reads and writes performed each second by the storage group.
Used Capacity The capacity used (in GBs) by the the storage group.
Write Latency (ms) The average time it took the VMAX array to serve one Write I/O for thisstorage group.
Writes (IOPS) The number of write operations performed each second by the storagegroup.
Writes (MB/s) The cumulative number of megabytes written per second by the storagegroup.
Table 26 VMAX metrics for Thin Pool
Metric Definition
Allocated Capacity (GB) The allocated thin pool capacity.
Full (%) The percent of the thin pool that has been allocated.
Total Capacity (GB) The total thin pool capacity.
Used Capacity (GB) The used thin pool capacity.
Table 27 VMAX3 metrics for Storage Resource Pool
Metric Definition
Capacity/Full (%) The percent of the pool that has been allocated.
Capacity/Total Managed Space The capacity and total managed space.
Resource Kinds and Metrics
VMAX metrics 85
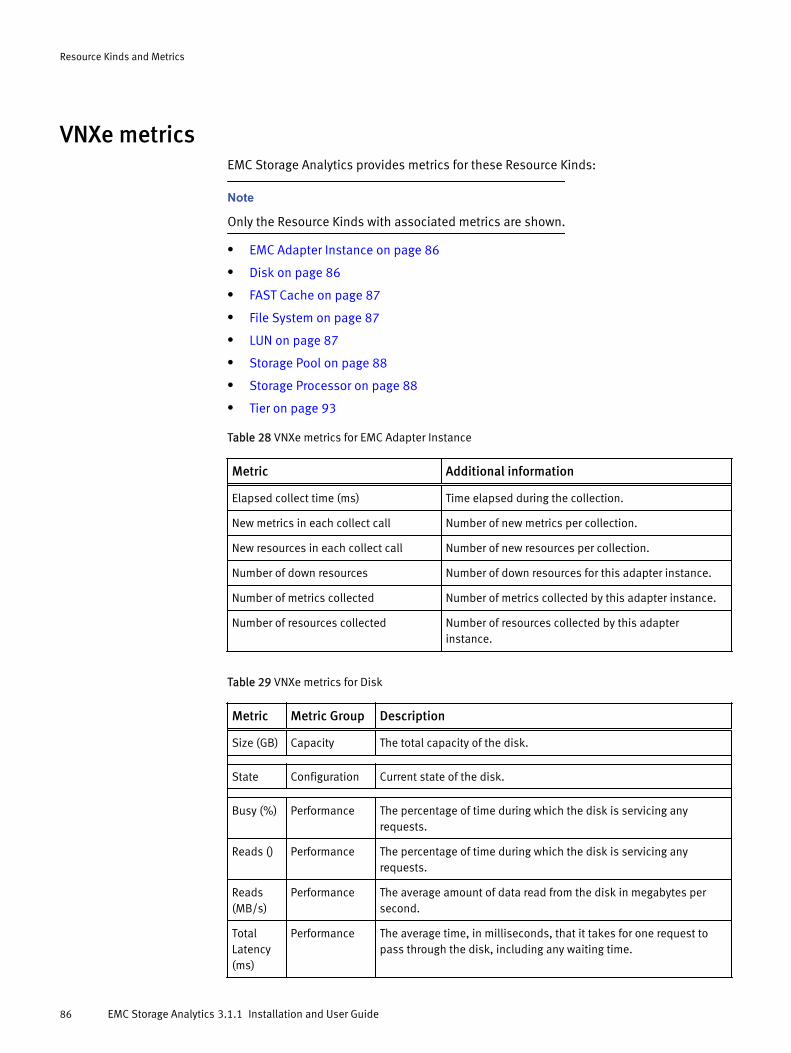
VNXe metricsEMC Storage Analytics provides metrics for these Resource Kinds:
Note
Only the Resource Kinds with associated metrics are shown.
l EMC Adapter Instance on page 86
l Disk on page 86
l FAST Cache on page 87
l File System on page 87
l LUN on page 87
l Storage Pool on page 88
l Storage Processor on page 88
l Tier on page 93
Table 28 VNXe metrics for EMC Adapter Instance
Metric Additional information
Elapsed collect time (ms) Time elapsed during the collection.
New metrics in each collect call Number of new metrics per collection.
New resources in each collect call Number of new resources per collection.
Number of down resources Number of down resources for this adapter instance.
Number of metrics collected Number of metrics collected by this adapter instance.
Number of resources collected Number of resources collected by this adapterinstance.
Table 29 VNXe metrics for Disk
Metric Metric Group Description
Size (GB) Capacity The total capacity of the disk.
State Configuration Current state of the disk.
Busy (%) Performance The percentage of time during which the disk is servicing anyrequests.
Reads () Performance The percentage of time during which the disk is servicing anyrequests.
Reads(MB/s)
Performance The average amount of data read from the disk in megabytes persecond.
TotalLatency(ms)
Performance The average time, in milliseconds, that it takes for one request topass through the disk, including any waiting time.
Resource Kinds and Metrics
86 EMC Storage Analytics 3.1.1 Installation and User Guide
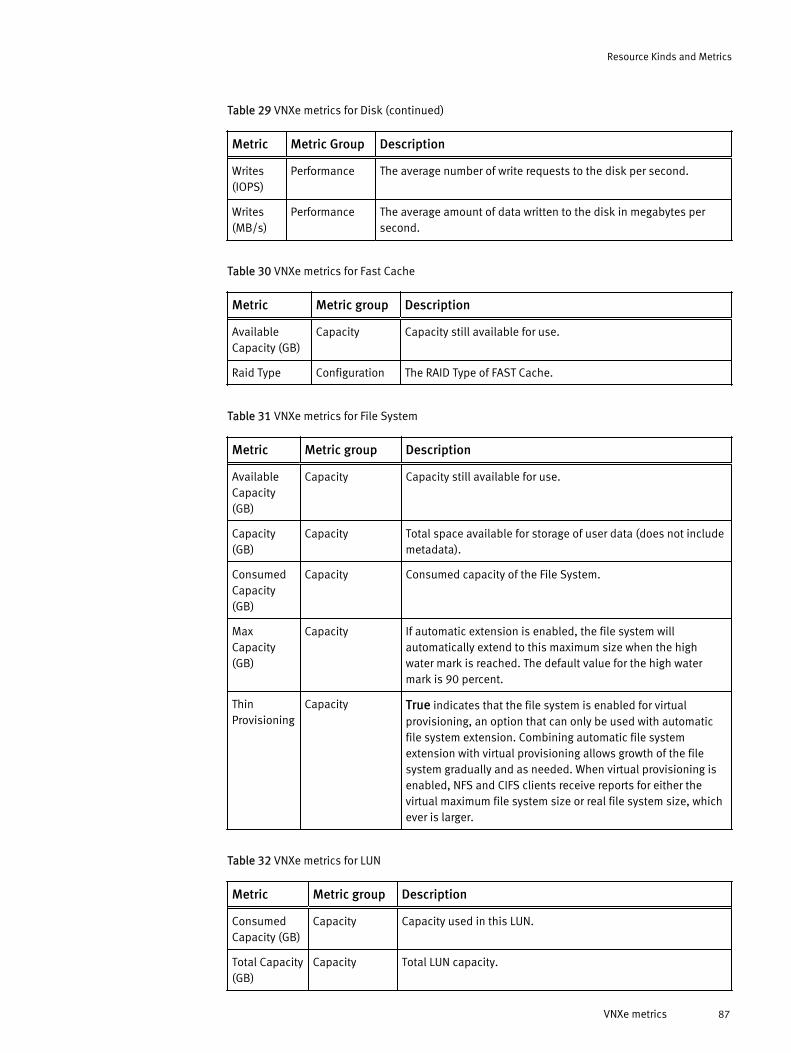
Table 29 VNXe metrics for Disk (continued)
Metric Metric Group Description
Writes(IOPS)
Performance The average number of write requests to the disk per second.
Writes(MB/s)
Performance The average amount of data written to the disk in megabytes persecond.
Table 30 VNXe metrics for Fast Cache
Metric Metric group Description
AvailableCapacity (GB)
Capacity Capacity still available for use.
Raid Type Configuration The RAID Type of FAST Cache.
Table 31 VNXe metrics for File System
Metric Metric group Description
AvailableCapacity(GB)
Capacity Capacity still available for use.
Capacity(GB)
Capacity Total space available for storage of user data (does not includemetadata).
ConsumedCapacity(GB)
Capacity Consumed capacity of the File System.
MaxCapacity(GB)
Capacity If automatic extension is enabled, the file system willautomatically extend to this maximum size when the highwater mark is reached. The default value for the high watermark is 90 percent.
ThinProvisioning
Capacity True indicates that the file system is enabled for virtualprovisioning, an option that can only be used with automaticfile system extension. Combining automatic file systemextension with virtual provisioning allows growth of the filesystem gradually and as needed. When virtual provisioning isenabled, NFS and CIFS clients receive reports for either thevirtual maximum file system size or real file system size, whichever is larger.
Table 32 VNXe metrics for LUN
Metric Metric group Description
ConsumedCapacity (GB)
Capacity Capacity used in this LUN.
Total Capacity(GB)
Capacity Total LUN capacity.
Resource Kinds and Metrics
VNXe metrics 87
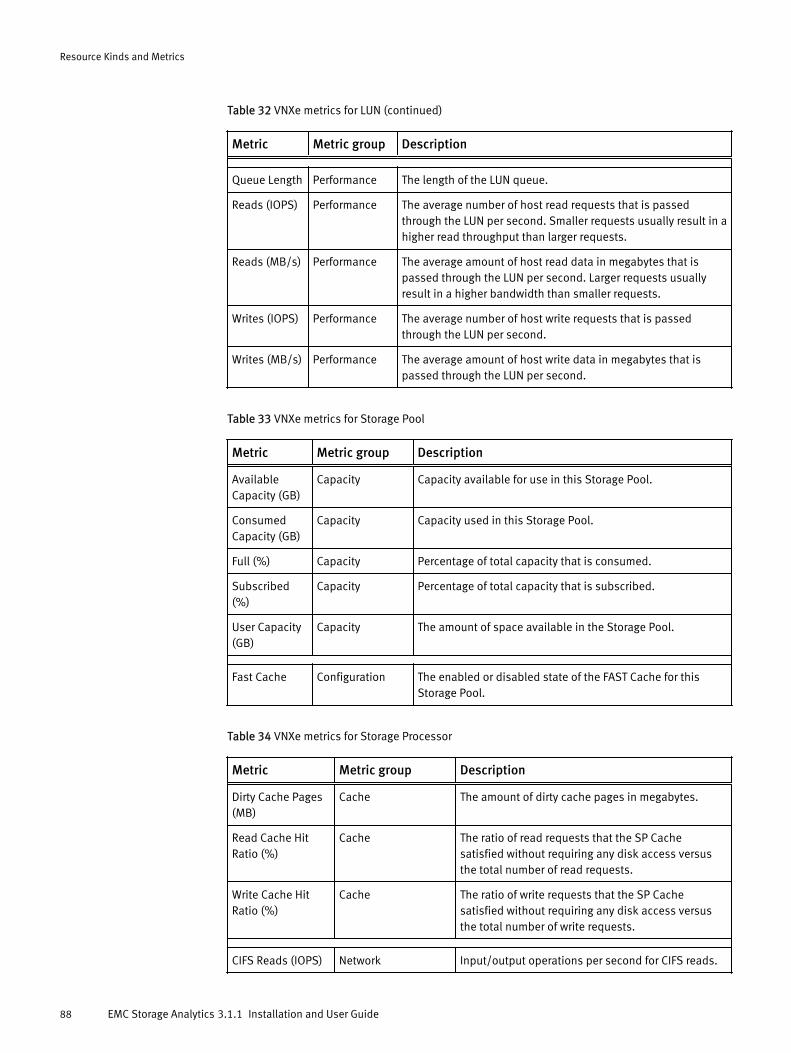
Table 32 VNXe metrics for LUN (continued)
Metric Metric group Description
Queue Length Performance The length of the LUN queue.
Reads (IOPS) Performance The average number of host read requests that is passedthrough the LUN per second. Smaller requests usually result in ahigher read throughput than larger requests.
Reads (MB/s) Performance The average amount of host read data in megabytes that ispassed through the LUN per second. Larger requests usuallyresult in a higher bandwidth than smaller requests.
Writes (IOPS) Performance The average number of host write requests that is passedthrough the LUN per second.
Writes (MB/s) Performance The average amount of host write data in megabytes that ispassed through the LUN per second.
Table 33 VNXe metrics for Storage Pool
Metric Metric group Description
AvailableCapacity (GB)
Capacity Capacity available for use in this Storage Pool.
ConsumedCapacity (GB)
Capacity Capacity used in this Storage Pool.
Full (%) Capacity Percentage of total capacity that is consumed.
Subscribed(%)
Capacity Percentage of total capacity that is subscribed.
User Capacity(GB)
Capacity The amount of space available in the Storage Pool.
Fast Cache Configuration The enabled or disabled state of the FAST Cache for thisStorage Pool.
Table 34 VNXe metrics for Storage Processor
Metric Metric group Description
Dirty Cache Pages(MB)
Cache The amount of dirty cache pages in megabytes.
Read Cache HitRatio (%)
Cache The ratio of read requests that the SP Cachesatisfied without requiring any disk access versusthe total number of read requests.
Write Cache HitRatio (%)
Cache The ratio of write requests that the SP Cachesatisfied without requiring any disk access versusthe total number of write requests.
CIFS Reads (IOPS) Network Input/output operations per second for CIFS reads.
Resource Kinds and Metrics
88 EMC Storage Analytics 3.1.1 Installation and User Guide
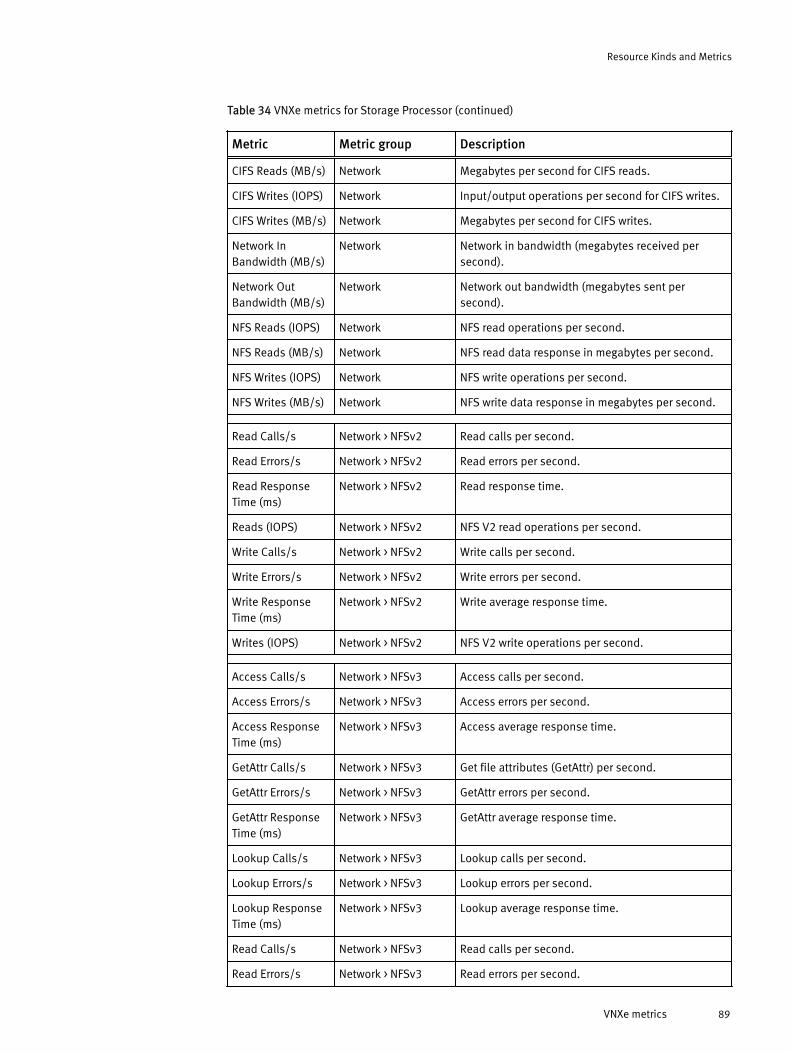
Table 34 VNXe metrics for Storage Processor (continued)
Metric Metric group Description
CIFS Reads (MB/s) Network Megabytes per second for CIFS reads.
CIFS Writes (IOPS) Network Input/output operations per second for CIFS writes.
CIFS Writes (MB/s) Network Megabytes per second for CIFS writes.
Network InBandwidth (MB/s)
Network Network in bandwidth (megabytes received persecond).
Network OutBandwidth (MB/s)
Network Network out bandwidth (megabytes sent persecond).
NFS Reads (IOPS) Network NFS read operations per second.
NFS Reads (MB/s) Network NFS read data response in megabytes per second.
NFS Writes (IOPS) Network NFS write operations per second.
NFS Writes (MB/s) Network NFS write data response in megabytes per second.
Read Calls/s Network > NFSv2 Read calls per second.
Read Errors/s Network > NFSv2 Read errors per second.
Read ResponseTime (ms)
Network > NFSv2 Read response time.
Reads (IOPS) Network > NFSv2 NFS V2 read operations per second.
Write Calls/s Network > NFSv2 Write calls per second.
Write Errors/s Network > NFSv2 Write errors per second.
Write ResponseTime (ms)
Network > NFSv2 Write average response time.
Writes (IOPS) Network > NFSv2 NFS V2 write operations per second.
Access Calls/s Network > NFSv3 Access calls per second.
Access Errors/s Network > NFSv3 Access errors per second.
Access ResponseTime (ms)
Network > NFSv3 Access average response time.
GetAttr Calls/s Network > NFSv3 Get file attributes (GetAttr) per second.
GetAttr Errors/s Network > NFSv3 GetAttr errors per second.
GetAttr ResponseTime (ms)
Network > NFSv3 GetAttr average response time.
Lookup Calls/s Network > NFSv3 Lookup calls per second.
Lookup Errors/s Network > NFSv3 Lookup errors per second.
Lookup ResponseTime (ms)
Network > NFSv3 Lookup average response time.
Read Calls/s Network > NFSv3 Read calls per second.
Read Errors/s Network > NFSv3 Read errors per second.
Resource Kinds and Metrics
VNXe metrics 89
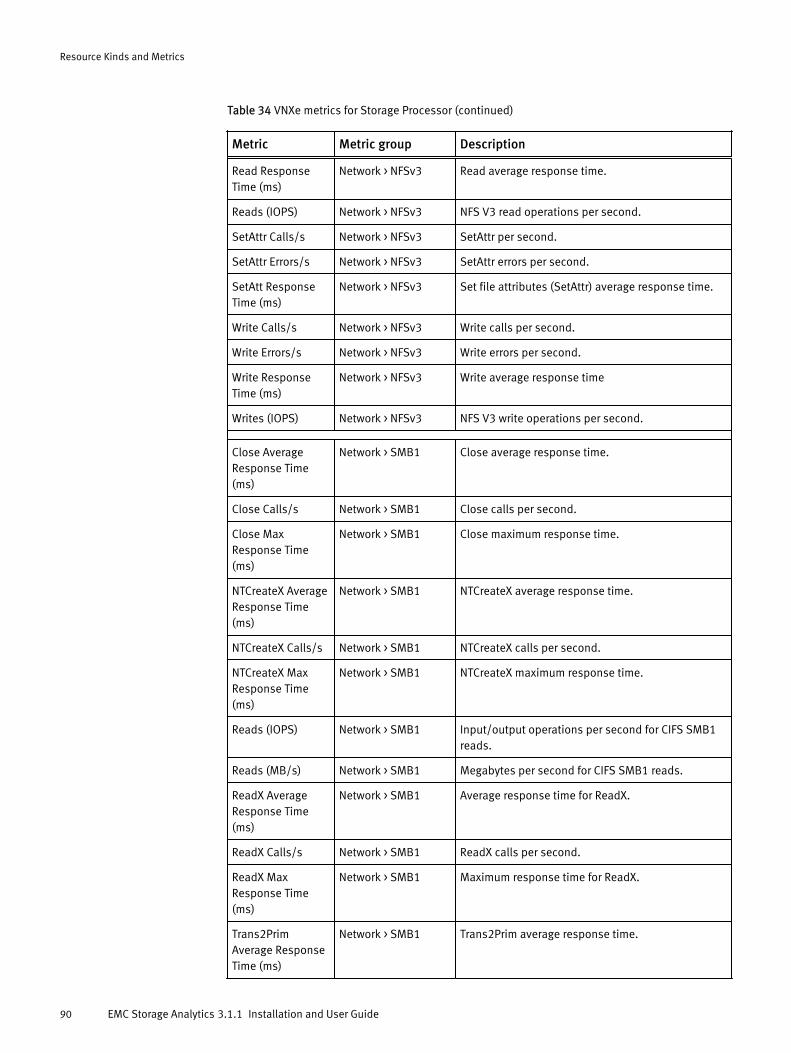
Table 34 VNXe metrics for Storage Processor (continued)
Metric Metric group Description
Read ResponseTime (ms)
Network > NFSv3 Read average response time.
Reads (IOPS) Network > NFSv3 NFS V3 read operations per second.
SetAttr Calls/s Network > NFSv3 SetAttr per second.
SetAttr Errors/s Network > NFSv3 SetAttr errors per second.
SetAtt ResponseTime (ms)
Network > NFSv3 Set file attributes (SetAttr) average response time.
Write Calls/s Network > NFSv3 Write calls per second.
Write Errors/s Network > NFSv3 Write errors per second.
Write ResponseTime (ms)
Network > NFSv3 Write average response time
Writes (IOPS) Network > NFSv3 NFS V3 write operations per second.
Close AverageResponse Time(ms)
Network > SMB1 Close average response time.
Close Calls/s Network > SMB1 Close calls per second.
Close MaxResponse Time(ms)
Network > SMB1 Close maximum response time.
NTCreateX AverageResponse Time(ms)
Network > SMB1 NTCreateX average response time.
NTCreateX Calls/s Network > SMB1 NTCreateX calls per second.
NTCreateX MaxResponse Time(ms)
Network > SMB1 NTCreateX maximum response time.
Reads (IOPS) Network > SMB1 Input/output operations per second for CIFS SMB1reads.
Reads (MB/s) Network > SMB1 Megabytes per second for CIFS SMB1 reads.
ReadX AverageResponse Time(ms)
Network > SMB1 Average response time for ReadX.
ReadX Calls/s Network > SMB1 ReadX calls per second.
ReadX MaxResponse Time(ms)
Network > SMB1 Maximum response time for ReadX.
Trans2PrimAverage ResponseTime (ms)
Network > SMB1 Trans2Prim average response time.
Resource Kinds and Metrics
90 EMC Storage Analytics 3.1.1 Installation and User Guide
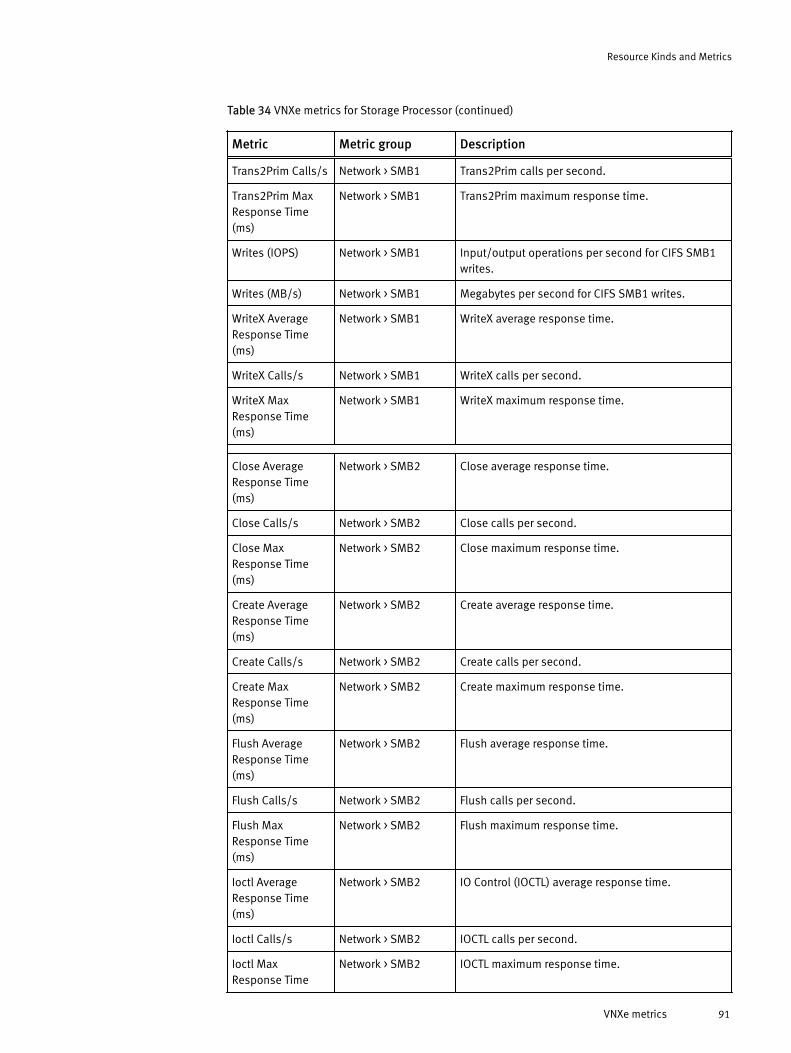
Table 34 VNXe metrics for Storage Processor (continued)
Metric Metric group Description
Trans2Prim Calls/s Network > SMB1 Trans2Prim calls per second.
Trans2Prim MaxResponse Time(ms)
Network > SMB1 Trans2Prim maximum response time.
Writes (IOPS) Network > SMB1 Input/output operations per second for CIFS SMB1writes.
Writes (MB/s) Network > SMB1 Megabytes per second for CIFS SMB1 writes.
WriteX AverageResponse Time(ms)
Network > SMB1 WriteX average response time.
WriteX Calls/s Network > SMB1 WriteX calls per second.
WriteX MaxResponse Time(ms)
Network > SMB1 WriteX maximum response time.
Close AverageResponse Time(ms)
Network > SMB2 Close average response time.
Close Calls/s Network > SMB2 Close calls per second.
Close MaxResponse Time(ms)
Network > SMB2 Close maximum response time.
Create AverageResponse Time(ms)
Network > SMB2 Create average response time.
Create Calls/s Network > SMB2 Create calls per second.
Create MaxResponse Time(ms)
Network > SMB2 Create maximum response time.
Flush AverageResponse Time(ms)
Network > SMB2 Flush average response time.
Flush Calls/s Network > SMB2 Flush calls per second.
Flush MaxResponse Time(ms)
Network > SMB2 Flush maximum response time.
Ioctl AverageResponse Time(ms)
Network > SMB2 IO Control (IOCTL) average response time.
Ioctl Calls/s Network > SMB2 IOCTL calls per second.
Ioctl MaxResponse Time
Network > SMB2 IOCTL maximum response time.
Resource Kinds and Metrics
VNXe metrics 91
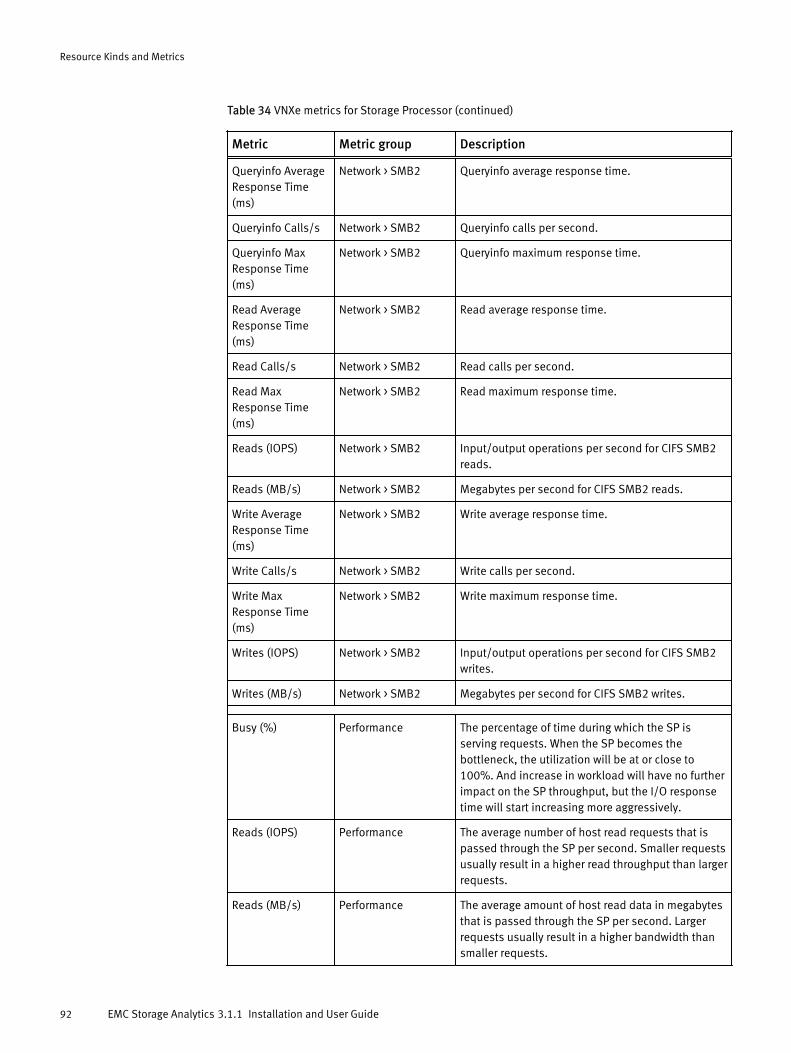
Table 34 VNXe metrics for Storage Processor (continued)
Metric Metric group Description
Queryinfo AverageResponse Time(ms)
Network > SMB2 Queryinfo average response time.
Queryinfo Calls/s Network > SMB2 Queryinfo calls per second.
Queryinfo MaxResponse Time(ms)
Network > SMB2 Queryinfo maximum response time.
Read AverageResponse Time(ms)
Network > SMB2 Read average response time.
Read Calls/s Network > SMB2 Read calls per second.
Read MaxResponse Time(ms)
Network > SMB2 Read maximum response time.
Reads (IOPS) Network > SMB2 Input/output operations per second for CIFS SMB2reads.
Reads (MB/s) Network > SMB2 Megabytes per second for CIFS SMB2 reads.
Write AverageResponse Time(ms)
Network > SMB2 Write average response time.
Write Calls/s Network > SMB2 Write calls per second.
Write MaxResponse Time(ms)
Network > SMB2 Write maximum response time.
Writes (IOPS) Network > SMB2 Input/output operations per second for CIFS SMB2writes.
Writes (MB/s) Network > SMB2 Megabytes per second for CIFS SMB2 writes.
Busy (%) Performance The percentage of time during which the SP isserving requests. When the SP becomes thebottleneck, the utilization will be at or close to100%. And increase in workload will have no furtherimpact on the SP throughput, but the I/O responsetime will start increasing more aggressively.
Reads (IOPS) Performance The average number of host read requests that ispassed through the SP per second. Smaller requestsusually result in a higher read throughput than largerrequests.
Reads (MB/s) Performance The average amount of host read data in megabytesthat is passed through the SP per second. Largerrequests usually result in a higher bandwidth thansmaller requests.
Resource Kinds and Metrics
92 EMC Storage Analytics 3.1.1 Installation and User Guide
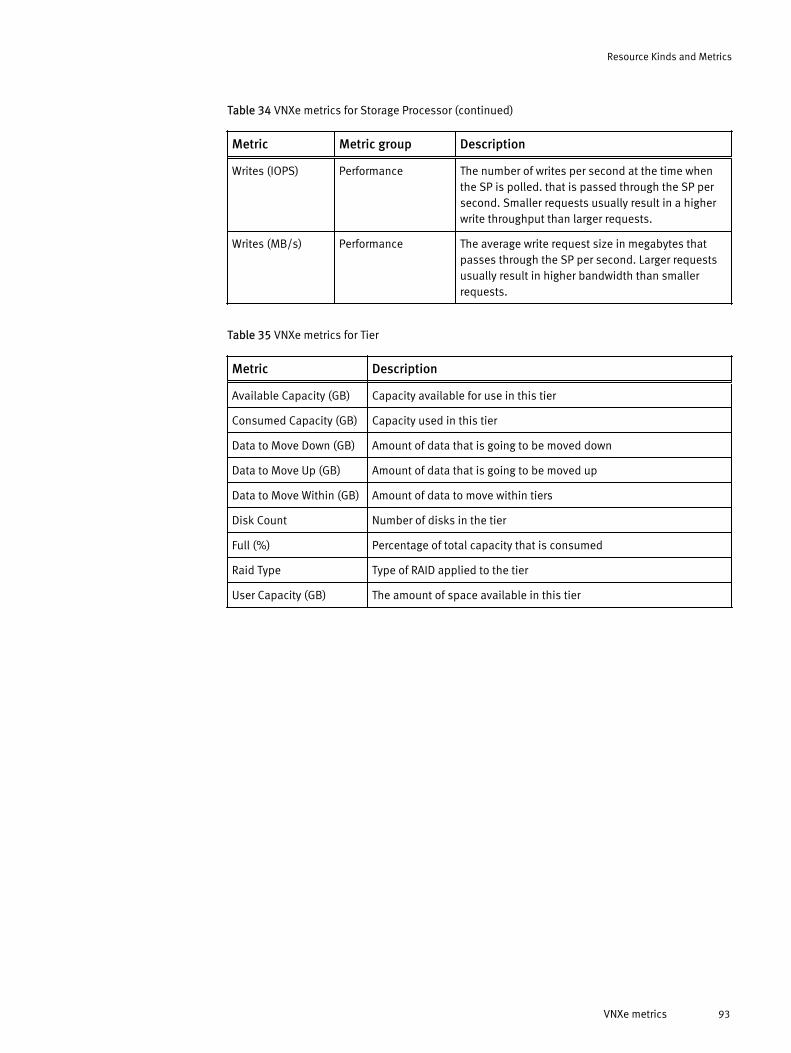
Table 34 VNXe metrics for Storage Processor (continued)
Metric Metric group Description
Writes (IOPS) Performance The number of writes per second at the time whenthe SP is polled. that is passed through the SP persecond. Smaller requests usually result in a higherwrite throughput than larger requests.
Writes (MB/s) Performance The average write request size in megabytes thatpasses through the SP per second. Larger requestsusually result in higher bandwidth than smallerrequests.
Table 35 VNXe metrics for Tier
Metric Description
Available Capacity (GB) Capacity available for use in this tier
Consumed Capacity (GB) Capacity used in this tier
Data to Move Down (GB) Amount of data that is going to be moved down
Data to Move Up (GB) Amount of data that is going to be moved up
Data to Move Within (GB) Amount of data to move within tiers
Disk Count Number of disks in the tier
Full (%) Percentage of total capacity that is consumed
Raid Type Type of RAID applied to the tier
User Capacity (GB) The amount of space available in this tier
Resource Kinds and Metrics
VNXe metrics 93
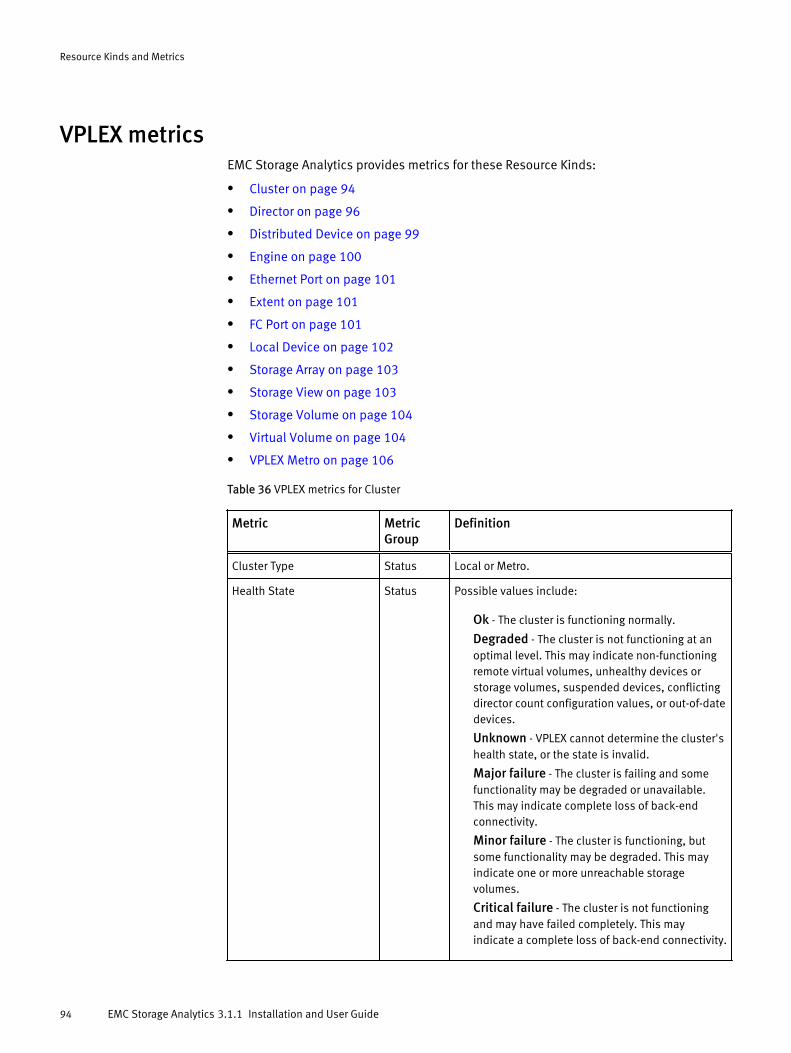
VPLEX metricsEMC Storage Analytics provides metrics for these Resource Kinds:
l Cluster on page 94
l Director on page 96
l Distributed Device on page 99
l Engine on page 100
l Ethernet Port on page 101
l Extent on page 101
l FC Port on page 101
l Local Device on page 102
l Storage Array on page 103
l Storage View on page 103
l Storage Volume on page 104
l Virtual Volume on page 104
l VPLEX Metro on page 106
Table 36 VPLEX metrics for Cluster
Metric MetricGroup
Definition
Cluster Type Status Local or Metro.
Health State Status Possible values include:
Ok - The cluster is functioning normally.
Degraded - The cluster is not functioning at anoptimal level. This may indicate non-functioningremote virtual volumes, unhealthy devices orstorage volumes, suspended devices, conflictingdirector count configuration values, or out-of-datedevices.
Unknown - VPLEX cannot determine the cluster'shealth state, or the state is invalid.
Major failure - The cluster is failing and somefunctionality may be degraded or unavailable.This may indicate complete loss of back-endconnectivity.
Minor failure - The cluster is functioning, butsome functionality may be degraded. This mayindicate one or more unreachable storagevolumes.
Critical failure - The cluster is not functioningand may have failed completely. This mayindicate a complete loss of back-end connectivity.
Resource Kinds and Metrics
94 EMC Storage Analytics 3.1.1 Installation and User Guide
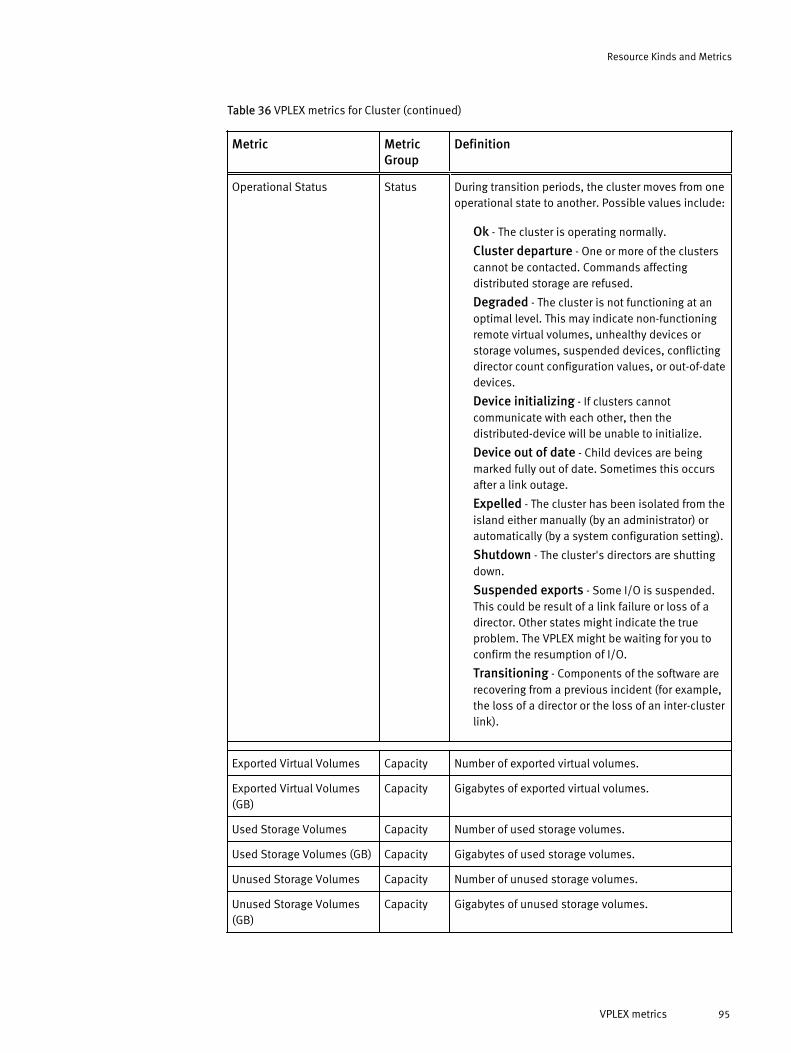
Table 36 VPLEX metrics for Cluster (continued)
Metric MetricGroup
Definition
Operational Status Status During transition periods, the cluster moves from oneoperational state to another. Possible values include:
Ok - The cluster is operating normally.
Cluster departure - One or more of the clusterscannot be contacted. Commands affectingdistributed storage are refused.
Degraded - The cluster is not functioning at anoptimal level. This may indicate non-functioningremote virtual volumes, unhealthy devices orstorage volumes, suspended devices, conflictingdirector count configuration values, or out-of-datedevices.
Device initializing - If clusters cannotcommunicate with each other, then thedistributed-device will be unable to initialize.
Device out of date - Child devices are beingmarked fully out of date. Sometimes this occursafter a link outage.
Expelled - The cluster has been isolated from theisland either manually (by an administrator) orautomatically (by a system configuration setting).
Shutdown - The cluster's directors are shuttingdown.
Suspended exports - Some I/O is suspended.This could be result of a link failure or loss of adirector. Other states might indicate the trueproblem. The VPLEX might be waiting for you toconfirm the resumption of I/O.
Transitioning - Components of the software arerecovering from a previous incident (for example,the loss of a director or the loss of an inter-clusterlink).
Exported Virtual Volumes Capacity Number of exported virtual volumes.
Exported Virtual Volumes(GB)
Capacity Gigabytes of exported virtual volumes.
Used Storage Volumes Capacity Number of used storage volumes.
Used Storage Volumes (GB) Capacity Gigabytes of used storage volumes.
Unused Storage Volumes Capacity Number of unused storage volumes.
Unused Storage Volumes(GB)
Capacity Gigabytes of unused storage volumes.
Resource Kinds and Metrics
VPLEX metrics 95
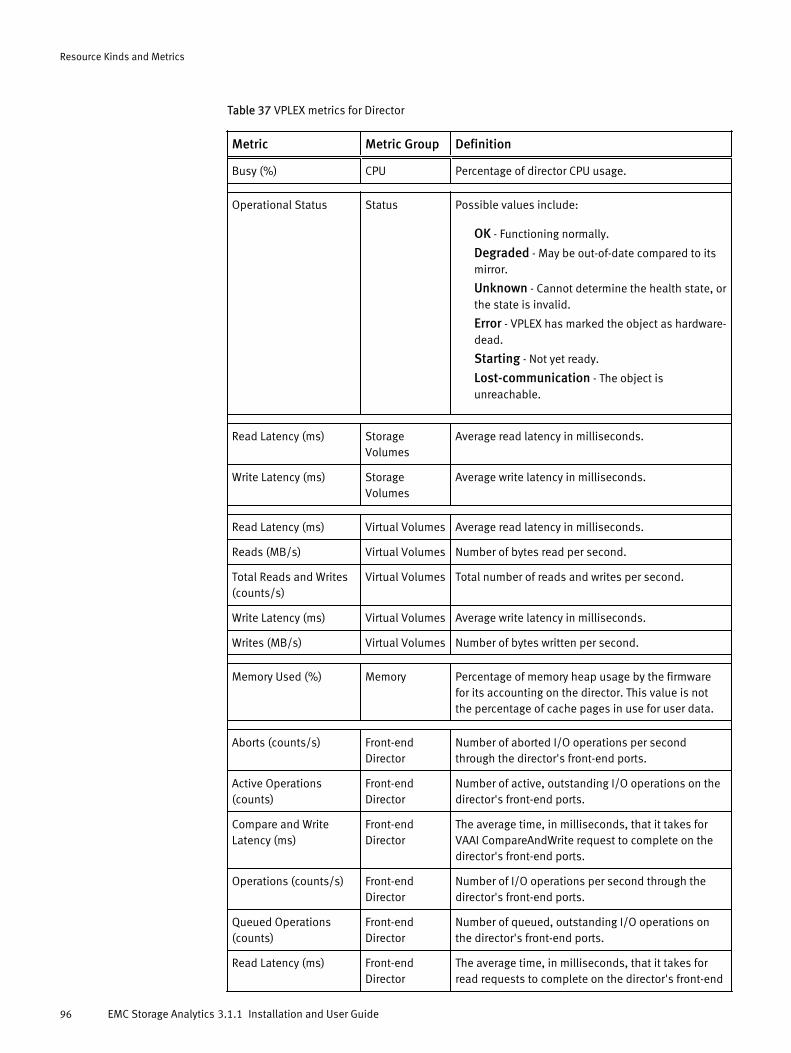
Table 37 VPLEX metrics for Director
Metric Metric Group Definition
Busy (%) CPU Percentage of director CPU usage.
Operational Status Status Possible values include:
OK - Functioning normally.
Degraded - May be out-of-date compared to itsmirror.
Unknown - Cannot determine the health state, orthe state is invalid.
Error - VPLEX has marked the object as hardware-dead.
Starting - Not yet ready.
Lost-communication - The object isunreachable.
Read Latency (ms) StorageVolumes
Average read latency in milliseconds.
Write Latency (ms) StorageVolumes
Average write latency in milliseconds.
Read Latency (ms) Virtual Volumes Average read latency in milliseconds.
Reads (MB/s) Virtual Volumes Number of bytes read per second.
Total Reads and Writes(counts/s)
Virtual Volumes Total number of reads and writes per second.
Write Latency (ms) Virtual Volumes Average write latency in milliseconds.
Writes (MB/s) Virtual Volumes Number of bytes written per second.
Memory Used (%) Memory Percentage of memory heap usage by the firmwarefor its accounting on the director. This value is notthe percentage of cache pages in use for user data.
Aborts (counts/s) Front-endDirector
Number of aborted I/O operations per secondthrough the director's front-end ports.
Active Operations(counts)
Front-endDirector
Number of active, outstanding I/O operations on thedirector's front-end ports.
Compare and WriteLatency (ms)
Front-endDirector
The average time, in milliseconds, that it takes forVAAI CompareAndWrite request to complete on thedirector's front-end ports.
Operations (counts/s) Front-endDirector
Number of I/O operations per second through thedirector's front-end ports.
Queued Operations(counts)
Front-endDirector
Number of queued, outstanding I/O operations onthe director's front-end ports.
Read Latency (ms) Front-endDirector
The average time, in milliseconds, that it takes forread requests to complete on the director's front-end
Resource Kinds and Metrics
96 EMC Storage Analytics 3.1.1 Installation and User Guide
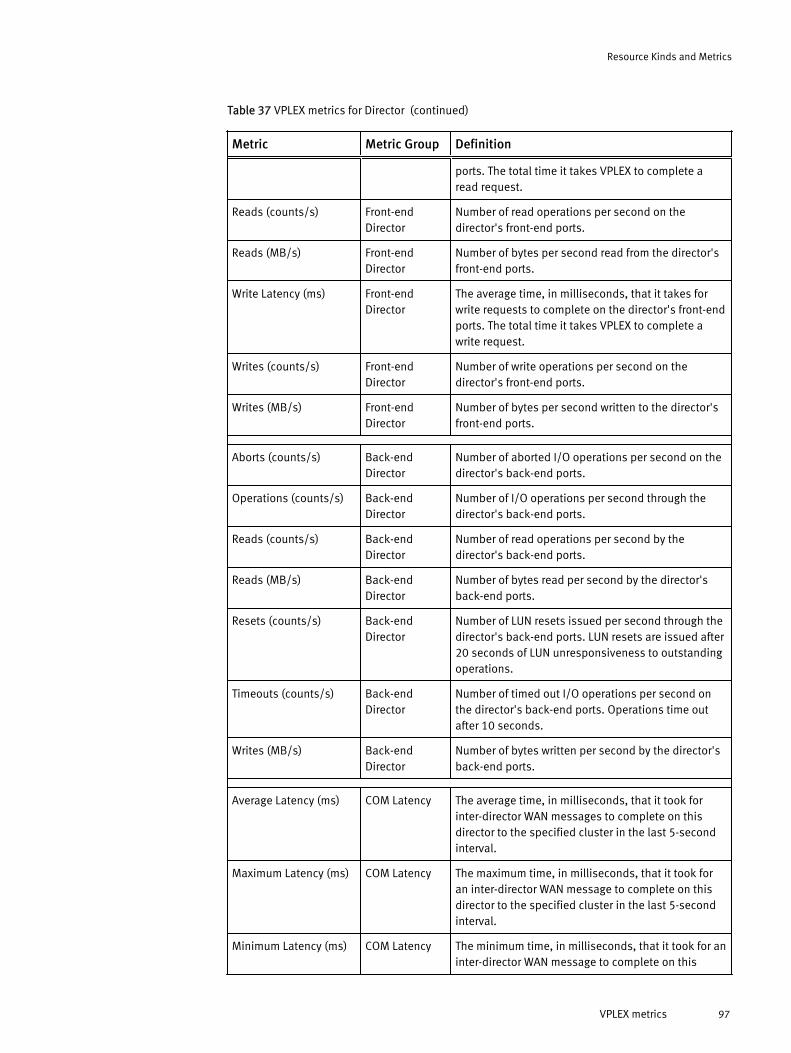
Table 37 VPLEX metrics for Director (continued)
Metric Metric Group Definition
ports. The total time it takes VPLEX to complete aread request.
Reads (counts/s) Front-endDirector
Number of read operations per second on thedirector's front-end ports.
Reads (MB/s) Front-endDirector
Number of bytes per second read from the director'sfront-end ports.
Write Latency (ms) Front-endDirector
The average time, in milliseconds, that it takes forwrite requests to complete on the director's front-endports. The total time it takes VPLEX to complete awrite request.
Writes (counts/s) Front-endDirector
Number of write operations per second on thedirector's front-end ports.
Writes (MB/s) Front-endDirector
Number of bytes per second written to the director'sfront-end ports.
Aborts (counts/s) Back-endDirector
Number of aborted I/O operations per second on thedirector's back-end ports.
Operations (counts/s) Back-endDirector
Number of I/O operations per second through thedirector's back-end ports.
Reads (counts/s) Back-endDirector
Number of read operations per second by thedirector's back-end ports.
Reads (MB/s) Back-endDirector
Number of bytes read per second by the director'sback-end ports.
Resets (counts/s) Back-endDirector
Number of LUN resets issued per second through thedirector's back-end ports. LUN resets are issued after20 seconds of LUN unresponsiveness to outstandingoperations.
Timeouts (counts/s) Back-endDirector
Number of timed out I/O operations per second onthe director's back-end ports. Operations time outafter 10 seconds.
Writes (MB/s) Back-endDirector
Number of bytes written per second by the director'sback-end ports.
Average Latency (ms) COM Latency The average time, in milliseconds, that it took forinter-director WAN messages to complete on thisdirector to the specified cluster in the last 5-secondinterval.
Maximum Latency (ms) COM Latency The maximum time, in milliseconds, that it took foran inter-director WAN message to complete on thisdirector to the specified cluster in the last 5-secondinterval.
Minimum Latency (ms) COM Latency The minimum time, in milliseconds, that it took for aninter-director WAN message to complete on this
Resource Kinds and Metrics
VPLEX metrics 97
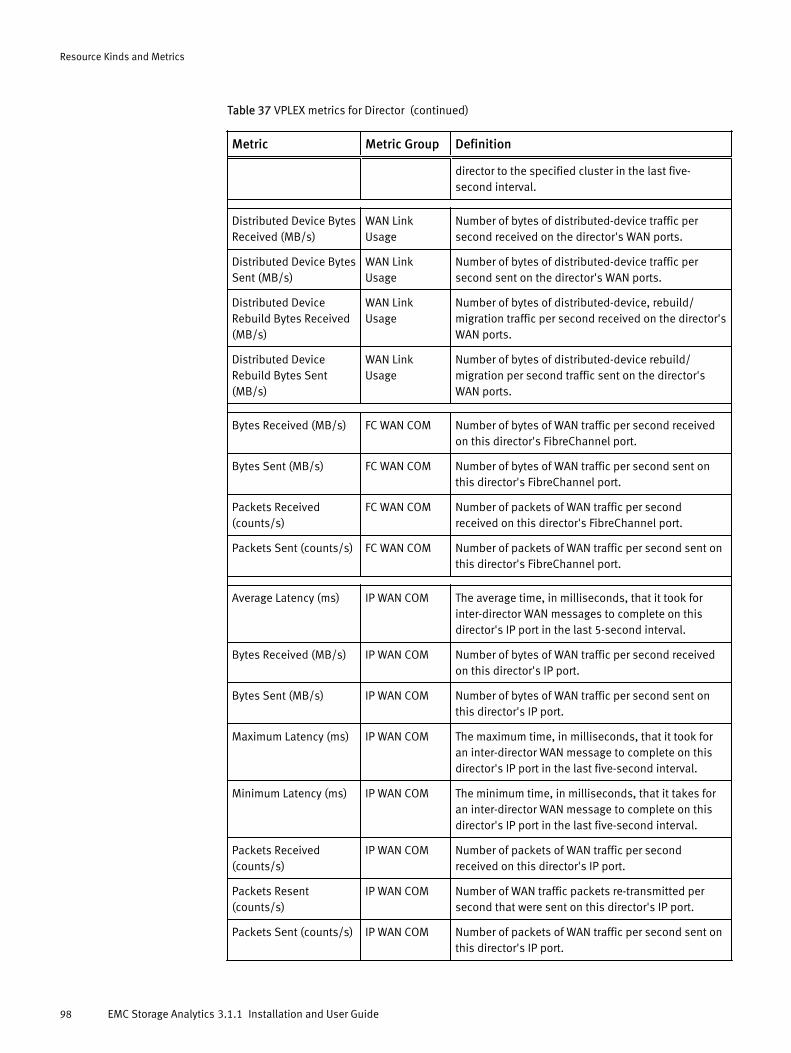
Table 37 VPLEX metrics for Director (continued)
Metric Metric Group Definition
director to the specified cluster in the last five-second interval.
Distributed Device BytesReceived (MB/s)
WAN LinkUsage
Number of bytes of distributed-device traffic persecond received on the director's WAN ports.
Distributed Device BytesSent (MB/s)
WAN LinkUsage
Number of bytes of distributed-device traffic persecond sent on the director's WAN ports.
Distributed DeviceRebuild Bytes Received(MB/s)
WAN LinkUsage
Number of bytes of distributed-device, rebuild/migration traffic per second received on the director'sWAN ports.
Distributed DeviceRebuild Bytes Sent(MB/s)
WAN LinkUsage
Number of bytes of distributed-device rebuild/migration per second traffic sent on the director'sWAN ports.
Bytes Received (MB/s) FC WAN COM Number of bytes of WAN traffic per second receivedon this director's FibreChannel port.
Bytes Sent (MB/s) FC WAN COM Number of bytes of WAN traffic per second sent onthis director's FibreChannel port.
Packets Received(counts/s)
FC WAN COM Number of packets of WAN traffic per secondreceived on this director's FibreChannel port.
Packets Sent (counts/s) FC WAN COM Number of packets of WAN traffic per second sent onthis director's FibreChannel port.
Average Latency (ms) IP WAN COM The average time, in milliseconds, that it took forinter-director WAN messages to complete on thisdirector's IP port in the last 5-second interval.
Bytes Received (MB/s) IP WAN COM Number of bytes of WAN traffic per second receivedon this director's IP port.
Bytes Sent (MB/s) IP WAN COM Number of bytes of WAN traffic per second sent onthis director's IP port.
Maximum Latency (ms) IP WAN COM The maximum time, in milliseconds, that it took foran inter-director WAN message to complete on thisdirector's IP port in the last five-second interval.
Minimum Latency (ms) IP WAN COM The minimum time, in milliseconds, that it takes foran inter-director WAN message to complete on thisdirector's IP port in the last five-second interval.
Packets Received(counts/s)
IP WAN COM Number of packets of WAN traffic per secondreceived on this director's IP port.
Packets Resent(counts/s)
IP WAN COM Number of WAN traffic packets re-transmitted persecond that were sent on this director's IP port.
Packets Sent (counts/s) IP WAN COM Number of packets of WAN traffic per second sent onthis director's IP port.
Resource Kinds and Metrics
98 EMC Storage Analytics 3.1.1 Installation and User Guide
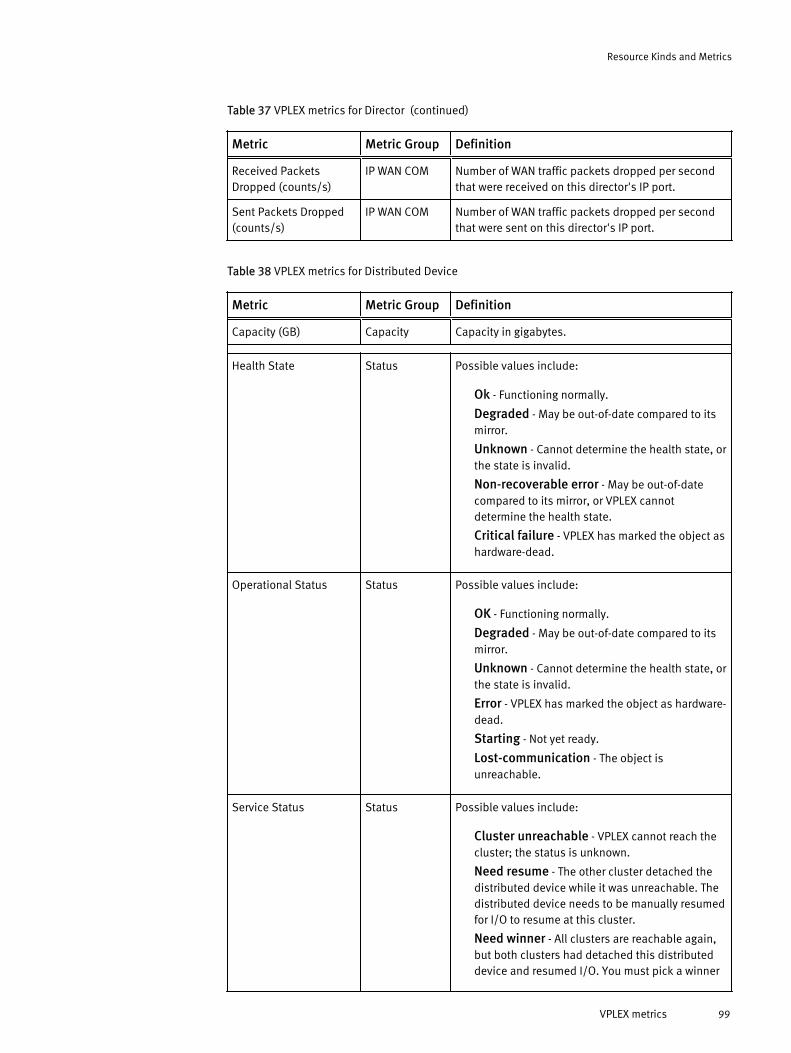
Table 37 VPLEX metrics for Director (continued)
Metric Metric Group Definition
Received PacketsDropped (counts/s)
IP WAN COM Number of WAN traffic packets dropped per secondthat were received on this director's IP port.
Sent Packets Dropped(counts/s)
IP WAN COM Number of WAN traffic packets dropped per secondthat were sent on this director's IP port.
Table 38 VPLEX metrics for Distributed Device
Metric Metric Group Definition
Capacity (GB) Capacity Capacity in gigabytes.
Health State Status Possible values include:
Ok - Functioning normally.
Degraded - May be out-of-date compared to itsmirror.
Unknown - Cannot determine the health state, orthe state is invalid.
Non-recoverable error - May be out-of-datecompared to its mirror, or VPLEX cannotdetermine the health state.
Critical failure - VPLEX has marked the object ashardware-dead.
Operational Status Status Possible values include:
OK - Functioning normally.
Degraded - May be out-of-date compared to itsmirror.
Unknown - Cannot determine the health state, orthe state is invalid.
Error - VPLEX has marked the object as hardware-dead.
Starting - Not yet ready.
Lost-communication - The object isunreachable.
Service Status Status Possible values include:
Cluster unreachable - VPLEX cannot reach thecluster; the status is unknown.
Need resume - The other cluster detached thedistributed device while it was unreachable. Thedistributed device needs to be manually resumedfor I/O to resume at this cluster.
Need winner - All clusters are reachable again,but both clusters had detached this distributeddevice and resumed I/O. You must pick a winner
Resource Kinds and Metrics
VPLEX metrics 99
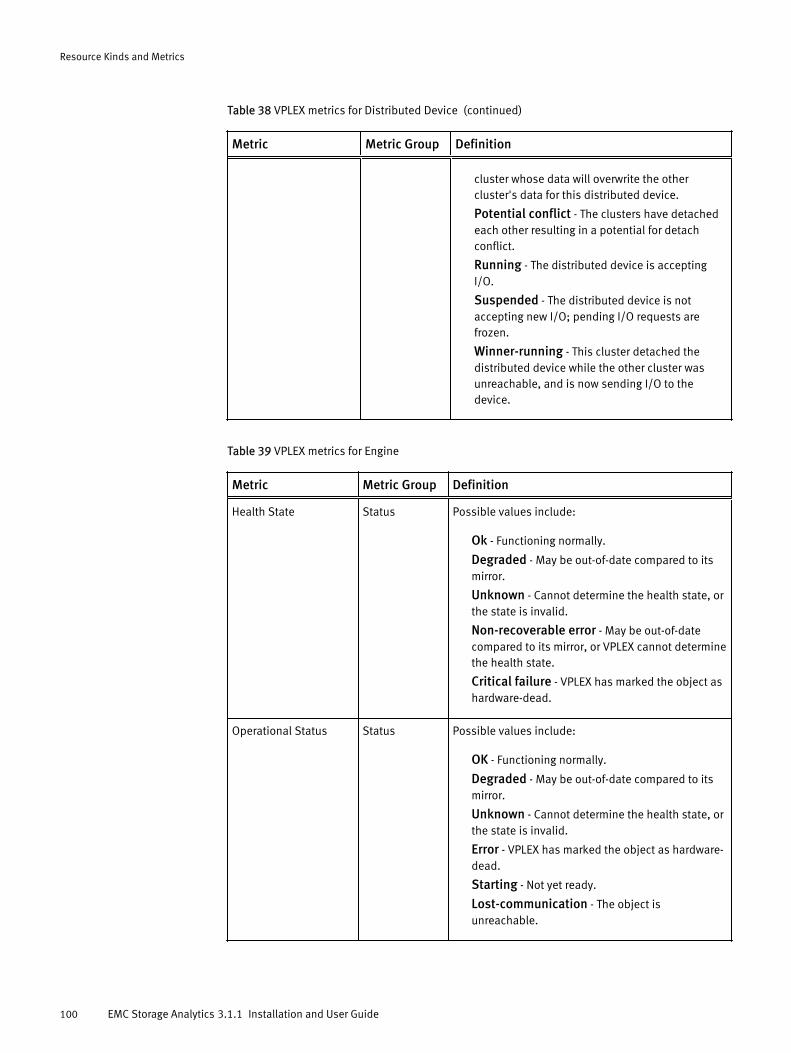
Table 38 VPLEX metrics for Distributed Device (continued)
Metric Metric Group Definition
cluster whose data will overwrite the othercluster's data for this distributed device.
Potential conflict - The clusters have detachedeach other resulting in a potential for detachconflict.
Running - The distributed device is acceptingI/O.
Suspended - The distributed device is notaccepting new I/O; pending I/O requests arefrozen.
Winner-running - This cluster detached thedistributed device while the other cluster wasunreachable, and is now sending I/O to thedevice.
Table 39 VPLEX metrics for Engine
Metric Metric Group Definition
Health State Status Possible values include:
Ok - Functioning normally.
Degraded - May be out-of-date compared to itsmirror.
Unknown - Cannot determine the health state, orthe state is invalid.
Non-recoverable error - May be out-of-datecompared to its mirror, or VPLEX cannot determinethe health state.
Critical failure - VPLEX has marked the object ashardware-dead.
Operational Status Status Possible values include:
OK - Functioning normally.
Degraded - May be out-of-date compared to itsmirror.
Unknown - Cannot determine the health state, orthe state is invalid.
Error - VPLEX has marked the object as hardware-dead.
Starting - Not yet ready.
Lost-communication - The object isunreachable.
Resource Kinds and Metrics
100 EMC Storage Analytics 3.1.1 Installation and User Guide
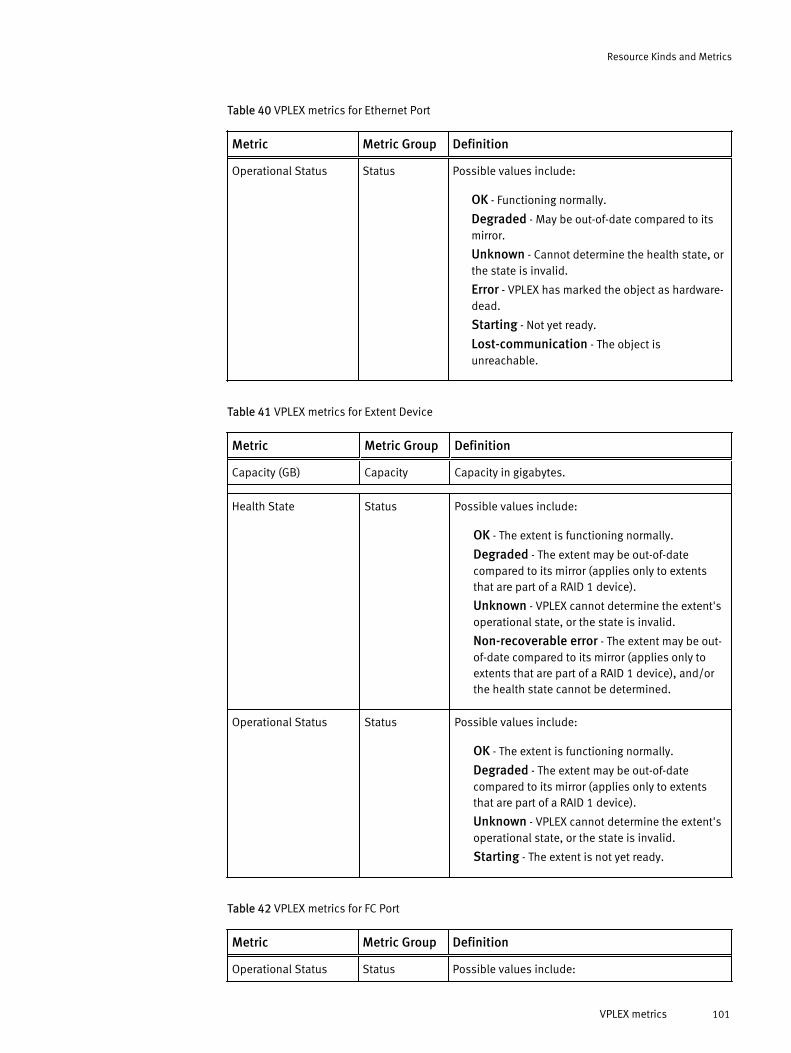
Table 40 VPLEX metrics for Ethernet Port
Metric Metric Group Definition
Operational Status Status Possible values include:
OK - Functioning normally.
Degraded - May be out-of-date compared to itsmirror.
Unknown - Cannot determine the health state, orthe state is invalid.
Error - VPLEX has marked the object as hardware-dead.
Starting - Not yet ready.
Lost-communication - The object isunreachable.
Table 41 VPLEX metrics for Extent Device
Metric Metric Group Definition
Capacity (GB) Capacity Capacity in gigabytes.
Health State Status Possible values include:
OK - The extent is functioning normally.
Degraded - The extent may be out-of-datecompared to its mirror (applies only to extentsthat are part of a RAID 1 device).
Unknown - VPLEX cannot determine the extent'soperational state, or the state is invalid.
Non-recoverable error - The extent may be out-of-date compared to its mirror (applies only toextents that are part of a RAID 1 device), and/orthe health state cannot be determined.
Operational Status Status Possible values include:
OK - The extent is functioning normally.
Degraded - The extent may be out-of-datecompared to its mirror (applies only to extentsthat are part of a RAID 1 device).
Unknown - VPLEX cannot determine the extent'soperational state, or the state is invalid.
Starting - The extent is not yet ready.
Table 42 VPLEX metrics for FC Port
Metric Metric Group Definition
Operational Status Status Possible values include:
Resource Kinds and Metrics
VPLEX metrics 101
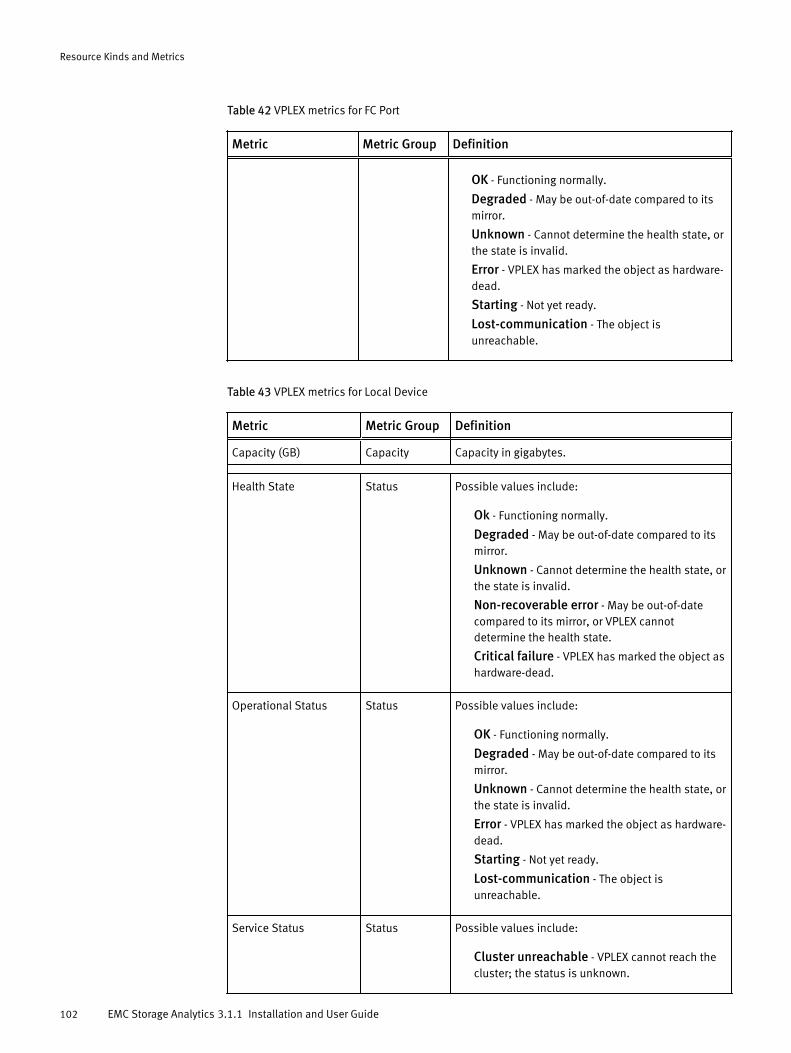
Table 42 VPLEX metrics for FC Port
Metric Metric Group Definition
OK - Functioning normally.
Degraded - May be out-of-date compared to itsmirror.
Unknown - Cannot determine the health state, orthe state is invalid.
Error - VPLEX has marked the object as hardware-dead.
Starting - Not yet ready.
Lost-communication - The object isunreachable.
Table 43 VPLEX metrics for Local Device
Metric Metric Group Definition
Capacity (GB) Capacity Capacity in gigabytes.
Health State Status Possible values include:
Ok - Functioning normally.
Degraded - May be out-of-date compared to itsmirror.
Unknown - Cannot determine the health state, orthe state is invalid.
Non-recoverable error - May be out-of-datecompared to its mirror, or VPLEX cannotdetermine the health state.
Critical failure - VPLEX has marked the object ashardware-dead.
Operational Status Status Possible values include:
OK - Functioning normally.
Degraded - May be out-of-date compared to itsmirror.
Unknown - Cannot determine the health state, orthe state is invalid.
Error - VPLEX has marked the object as hardware-dead.
Starting - Not yet ready.
Lost-communication - The object isunreachable.
Service Status Status Possible values include:
Cluster unreachable - VPLEX cannot reach thecluster; the status is unknown.
Resource Kinds and Metrics
102 EMC Storage Analytics 3.1.1 Installation and User Guide
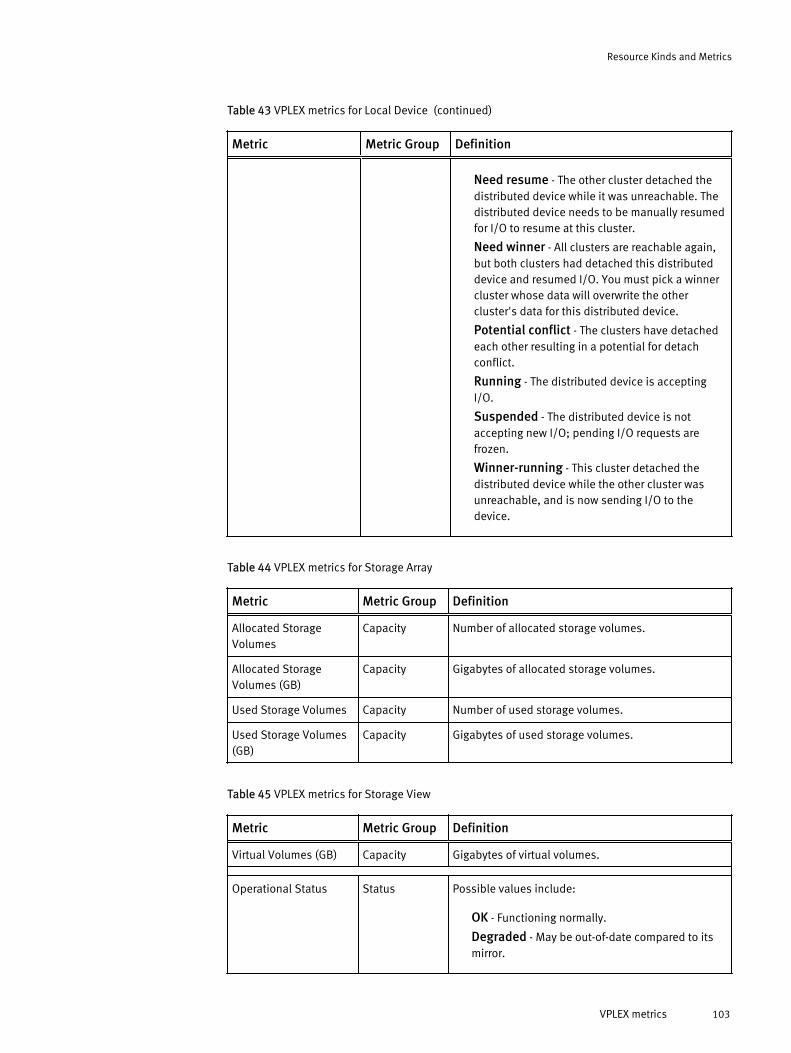
Table 43 VPLEX metrics for Local Device (continued)
Metric Metric Group Definition
Need resume - The other cluster detached thedistributed device while it was unreachable. Thedistributed device needs to be manually resumedfor I/O to resume at this cluster.
Need winner - All clusters are reachable again,but both clusters had detached this distributeddevice and resumed I/O. You must pick a winnercluster whose data will overwrite the othercluster's data for this distributed device.
Potential conflict - The clusters have detachedeach other resulting in a potential for detachconflict.
Running - The distributed device is acceptingI/O.
Suspended - The distributed device is notaccepting new I/O; pending I/O requests arefrozen.
Winner-running - This cluster detached thedistributed device while the other cluster wasunreachable, and is now sending I/O to thedevice.
Table 44 VPLEX metrics for Storage Array
Metric Metric Group Definition
Allocated StorageVolumes
Capacity Number of allocated storage volumes.
Allocated StorageVolumes (GB)
Capacity Gigabytes of allocated storage volumes.
Used Storage Volumes Capacity Number of used storage volumes.
Used Storage Volumes(GB)
Capacity Gigabytes of used storage volumes.
Table 45 VPLEX metrics for Storage View
Metric Metric Group Definition
Virtual Volumes (GB) Capacity Gigabytes of virtual volumes.
Operational Status Status Possible values include:
OK - Functioning normally.
Degraded - May be out-of-date compared to itsmirror.
Resource Kinds and Metrics
VPLEX metrics 103
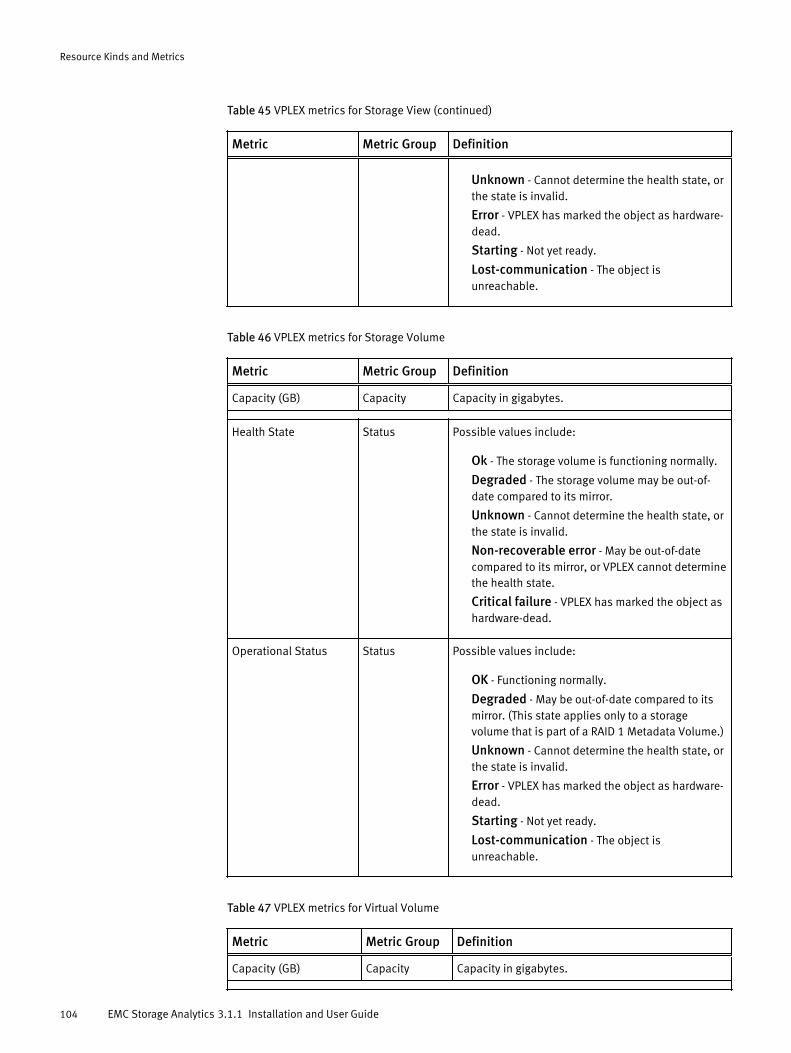
Table 45 VPLEX metrics for Storage View (continued)
Metric Metric Group Definition
Unknown - Cannot determine the health state, orthe state is invalid.
Error - VPLEX has marked the object as hardware-dead.
Starting - Not yet ready.
Lost-communication - The object isunreachable.
Table 46 VPLEX metrics for Storage Volume
Metric Metric Group Definition
Capacity (GB) Capacity Capacity in gigabytes.
Health State Status Possible values include:
Ok - The storage volume is functioning normally.
Degraded - The storage volume may be out-of-date compared to its mirror.
Unknown - Cannot determine the health state, orthe state is invalid.
Non-recoverable error - May be out-of-datecompared to its mirror, or VPLEX cannot determinethe health state.
Critical failure - VPLEX has marked the object ashardware-dead.
Operational Status Status Possible values include:
OK - Functioning normally.
Degraded - May be out-of-date compared to itsmirror. (This state applies only to a storagevolume that is part of a RAID 1 Metadata Volume.)
Unknown - Cannot determine the health state, orthe state is invalid.
Error - VPLEX has marked the object as hardware-dead.
Starting - Not yet ready.
Lost-communication - The object isunreachable.
Table 47 VPLEX metrics for Virtual Volume
Metric Metric Group Definition
Capacity (GB) Capacity Capacity in gigabytes.
Resource Kinds and Metrics
104 EMC Storage Analytics 3.1.1 Installation and User Guide
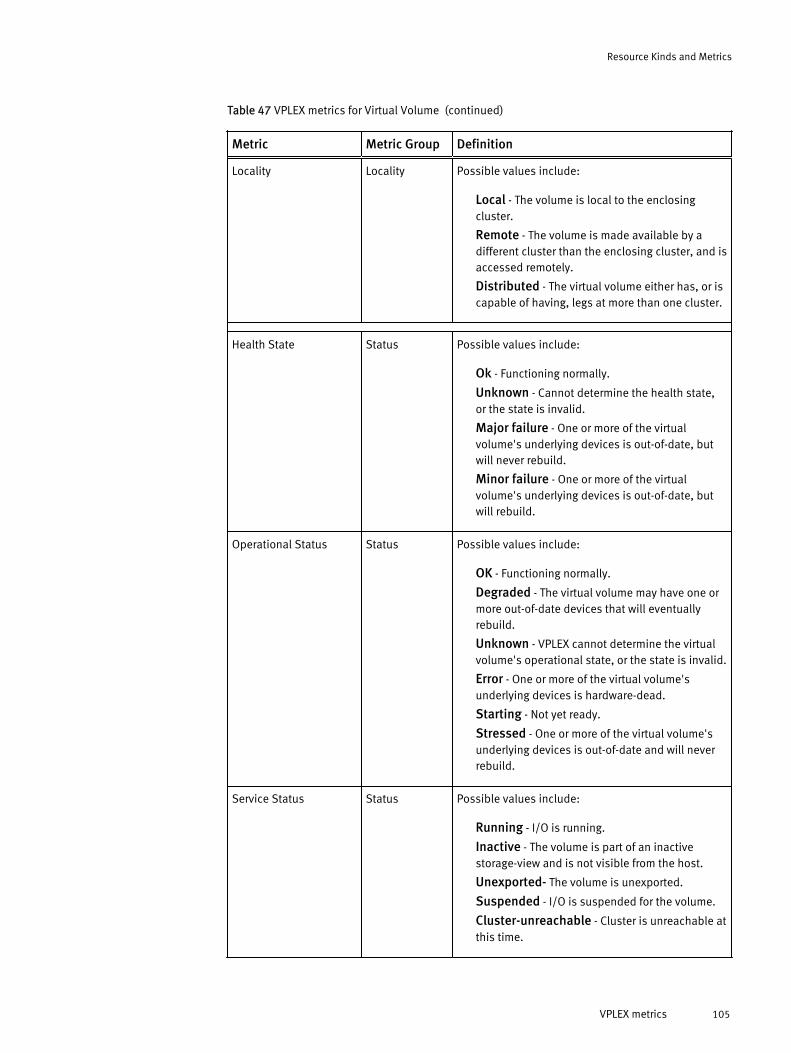
Table 47 VPLEX metrics for Virtual Volume (continued)
Metric Metric Group Definition
Locality Locality Possible values include:
Local - The volume is local to the enclosingcluster.
Remote - The volume is made available by adifferent cluster than the enclosing cluster, and isaccessed remotely.
Distributed - The virtual volume either has, or iscapable of having, legs at more than one cluster.
Health State Status Possible values include:
Ok - Functioning normally.
Unknown - Cannot determine the health state,or the state is invalid.
Major failure - One or more of the virtualvolume's underlying devices is out-of-date, butwill never rebuild.
Minor failure - One or more of the virtualvolume's underlying devices is out-of-date, butwill rebuild.
Operational Status Status Possible values include:
OK - Functioning normally.
Degraded - The virtual volume may have one ormore out-of-date devices that will eventuallyrebuild.
Unknown - VPLEX cannot determine the virtualvolume's operational state, or the state is invalid.
Error - One or more of the virtual volume'sunderlying devices is hardware-dead.
Starting - Not yet ready.
Stressed - One or more of the virtual volume'sunderlying devices is out-of-date and will neverrebuild.
Service Status Status Possible values include:
Running - I/O is running.
Inactive - The volume is part of an inactivestorage-view and is not visible from the host.
Unexported- The volume is unexported.
Suspended - I/O is suspended for the volume.
Cluster-unreachable - Cluster is unreachable atthis time.
Resource Kinds and Metrics
VPLEX metrics 105
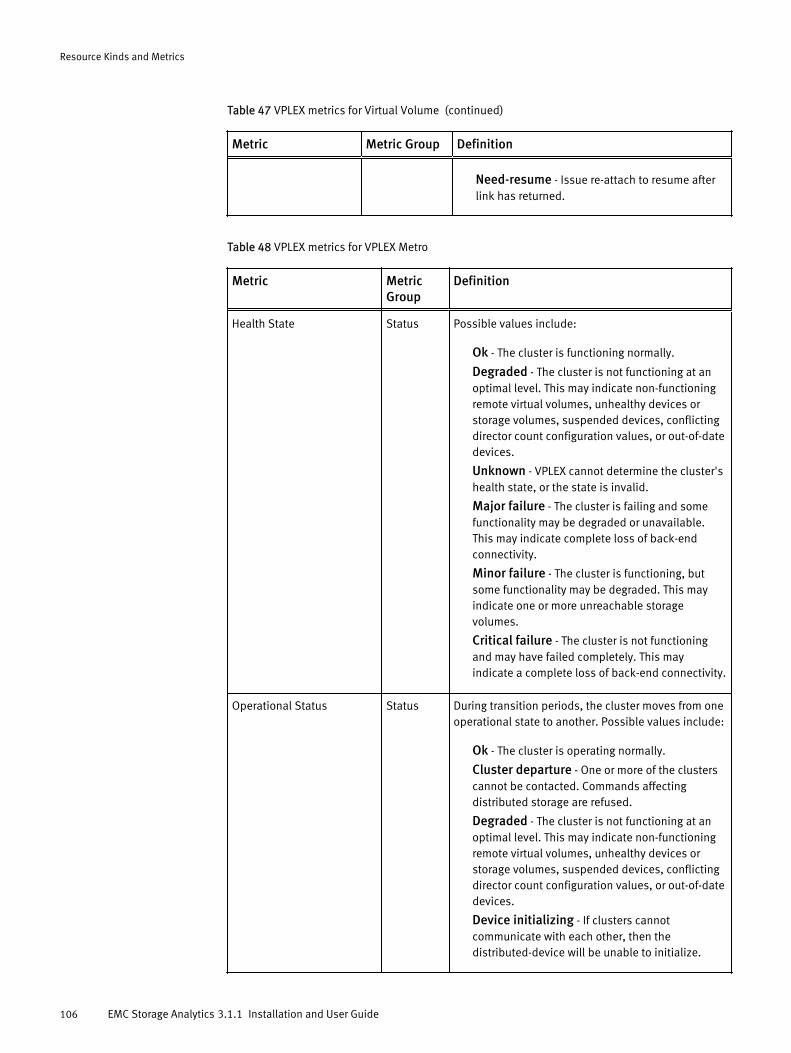
Table 47 VPLEX metrics for Virtual Volume (continued)
Metric Metric Group Definition
Need-resume - Issue re-attach to resume afterlink has returned.
Table 48 VPLEX metrics for VPLEX Metro
Metric MetricGroup
Definition
Health State Status Possible values include:
Ok - The cluster is functioning normally.
Degraded - The cluster is not functioning at anoptimal level. This may indicate non-functioningremote virtual volumes, unhealthy devices orstorage volumes, suspended devices, conflictingdirector count configuration values, or out-of-datedevices.
Unknown - VPLEX cannot determine the cluster'shealth state, or the state is invalid.
Major failure - The cluster is failing and somefunctionality may be degraded or unavailable.This may indicate complete loss of back-endconnectivity.
Minor failure - The cluster is functioning, butsome functionality may be degraded. This mayindicate one or more unreachable storagevolumes.
Critical failure - The cluster is not functioningand may have failed completely. This mayindicate a complete loss of back-end connectivity.
Operational Status Status During transition periods, the cluster moves from oneoperational state to another. Possible values include:
Ok - The cluster is operating normally.
Cluster departure - One or more of the clusterscannot be contacted. Commands affectingdistributed storage are refused.
Degraded - The cluster is not functioning at anoptimal level. This may indicate non-functioningremote virtual volumes, unhealthy devices orstorage volumes, suspended devices, conflictingdirector count configuration values, or out-of-datedevices.
Device initializing - If clusters cannotcommunicate with each other, then thedistributed-device will be unable to initialize.
Resource Kinds and Metrics
106 EMC Storage Analytics 3.1.1 Installation and User Guide
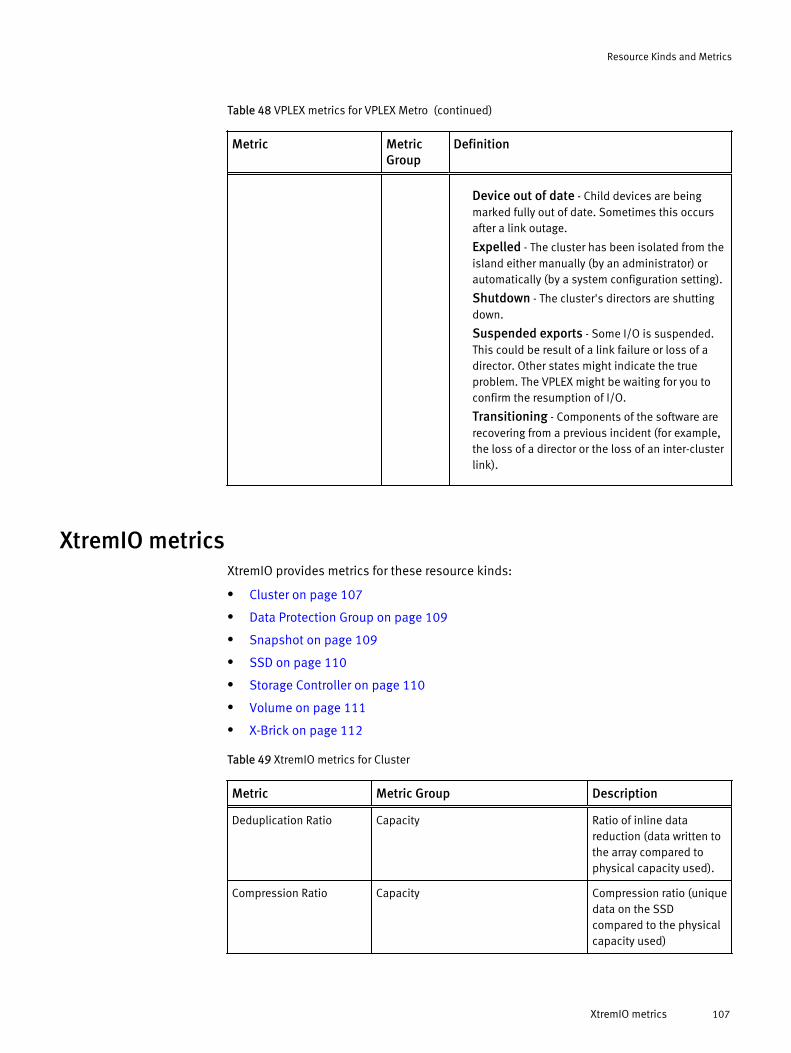
Table 48 VPLEX metrics for VPLEX Metro (continued)
Metric MetricGroup
Definition
Device out of date - Child devices are beingmarked fully out of date. Sometimes this occursafter a link outage.
Expelled - The cluster has been isolated from theisland either manually (by an administrator) orautomatically (by a system configuration setting).
Shutdown - The cluster's directors are shuttingdown.
Suspended exports - Some I/O is suspended.This could be result of a link failure or loss of adirector. Other states might indicate the trueproblem. The VPLEX might be waiting for you toconfirm the resumption of I/O.
Transitioning - Components of the software arerecovering from a previous incident (for example,the loss of a director or the loss of an inter-clusterlink).
XtremIO metricsXtremIO provides metrics for these resource kinds:
l Cluster on page 107
l Data Protection Group on page 109
l Snapshot on page 109
l SSD on page 110
l Storage Controller on page 110
l Volume on page 111
l X-Brick on page 112
Table 49 XtremIO metrics for Cluster
Metric Metric Group Description
Deduplication Ratio Capacity Ratio of inline datareduction (data written tothe array compared tophysical capacity used).
Compression Ratio Capacity Compression ratio (uniquedata on the SSDcompared to the physicalcapacity used)
Resource Kinds and Metrics
XtremIO metrics 107
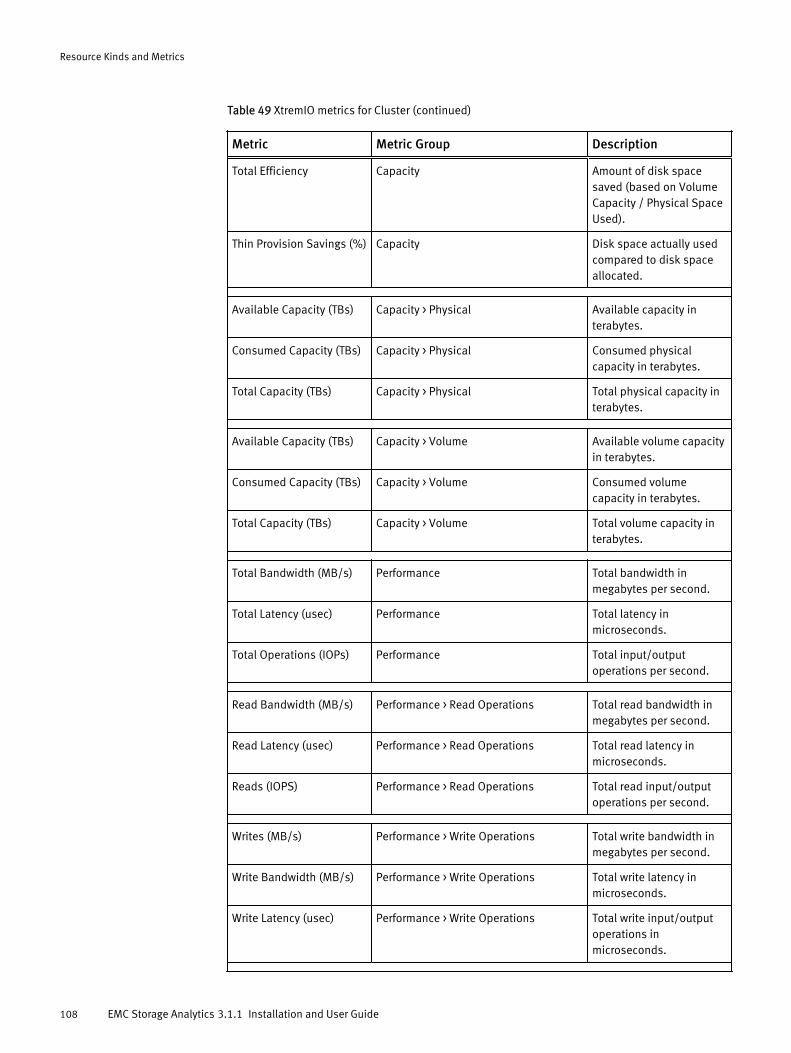
Table 49 XtremIO metrics for Cluster (continued)
Metric Metric Group Description
Total Efficiency Capacity Amount of disk spacesaved (based on VolumeCapacity / Physical SpaceUsed).
Thin Provision Savings (%) Capacity Disk space actually usedcompared to disk spaceallocated.
Available Capacity (TBs) Capacity > Physical Available capacity interabytes.
Consumed Capacity (TBs) Capacity > Physical Consumed physicalcapacity in terabytes.
Total Capacity (TBs) Capacity > Physical Total physical capacity interabytes.
Available Capacity (TBs) Capacity > Volume Available volume capacityin terabytes.
Consumed Capacity (TBs) Capacity > Volume Consumed volumecapacity in terabytes.
Total Capacity (TBs) Capacity > Volume Total volume capacity interabytes.
Total Bandwidth (MB/s) Performance Total bandwidth inmegabytes per second.
Total Latency (usec) Performance Total latency inmicroseconds.
Total Operations (IOPs) Performance Total input/outputoperations per second.
Read Bandwidth (MB/s) Performance > Read Operations Total read bandwidth inmegabytes per second.
Read Latency (usec) Performance > Read Operations Total read latency inmicroseconds.
Reads (IOPS) Performance > Read Operations Total read input/outputoperations per second.
Writes (MB/s) Performance > Write Operations Total write bandwidth inmegabytes per second.
Write Bandwidth (MB/s) Performance > Write Operations Total write latency inmicroseconds.
Write Latency (usec) Performance > Write Operations Total write input/outputoperations inmicroseconds.
Resource Kinds and Metrics
108 EMC Storage Analytics 3.1.1 Installation and User Guide
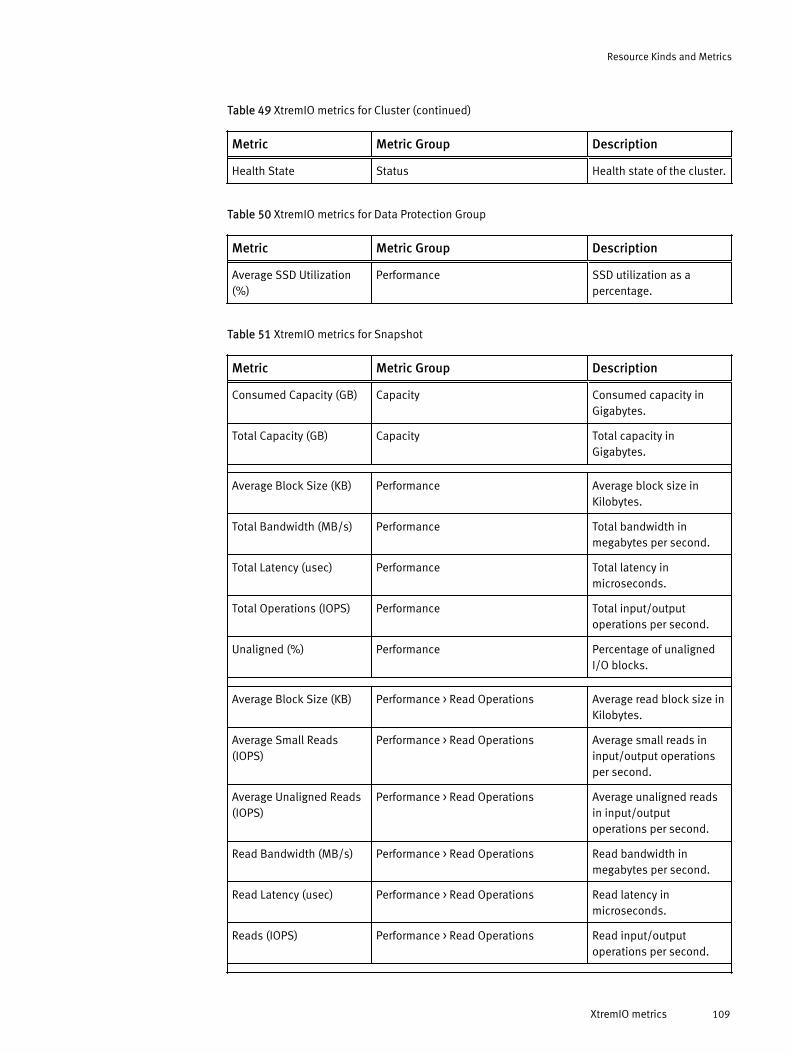
Table 49 XtremIO metrics for Cluster (continued)
Metric Metric Group Description
Health State Status Health state of the cluster.
Table 50 XtremIO metrics for Data Protection Group
Metric Metric Group Description
Average SSD Utilization(%)
Performance SSD utilization as apercentage.
Table 51 XtremIO metrics for Snapshot
Metric Metric Group Description
Consumed Capacity (GB) Capacity Consumed capacity inGigabytes.
Total Capacity (GB) Capacity Total capacity inGigabytes.
Average Block Size (KB) Performance Average block size inKilobytes.
Total Bandwidth (MB/s) Performance Total bandwidth inmegabytes per second.
Total Latency (usec) Performance Total latency inmicroseconds.
Total Operations (IOPS) Performance Total input/outputoperations per second.
Unaligned (%) Performance Percentage of unalignedI/O blocks.
Average Block Size (KB) Performance > Read Operations Average read block size inKilobytes.
Average Small Reads(IOPS)
Performance > Read Operations Average small reads ininput/output operationsper second.
Average Unaligned Reads(IOPS)
Performance > Read Operations Average unaligned readsin input/outputoperations per second.
Read Bandwidth (MB/s) Performance > Read Operations Read bandwidth inmegabytes per second.
Read Latency (usec) Performance > Read Operations Read latency inmicroseconds.
Reads (IOPS) Performance > Read Operations Read input/outputoperations per second.
Resource Kinds and Metrics
XtremIO metrics 109
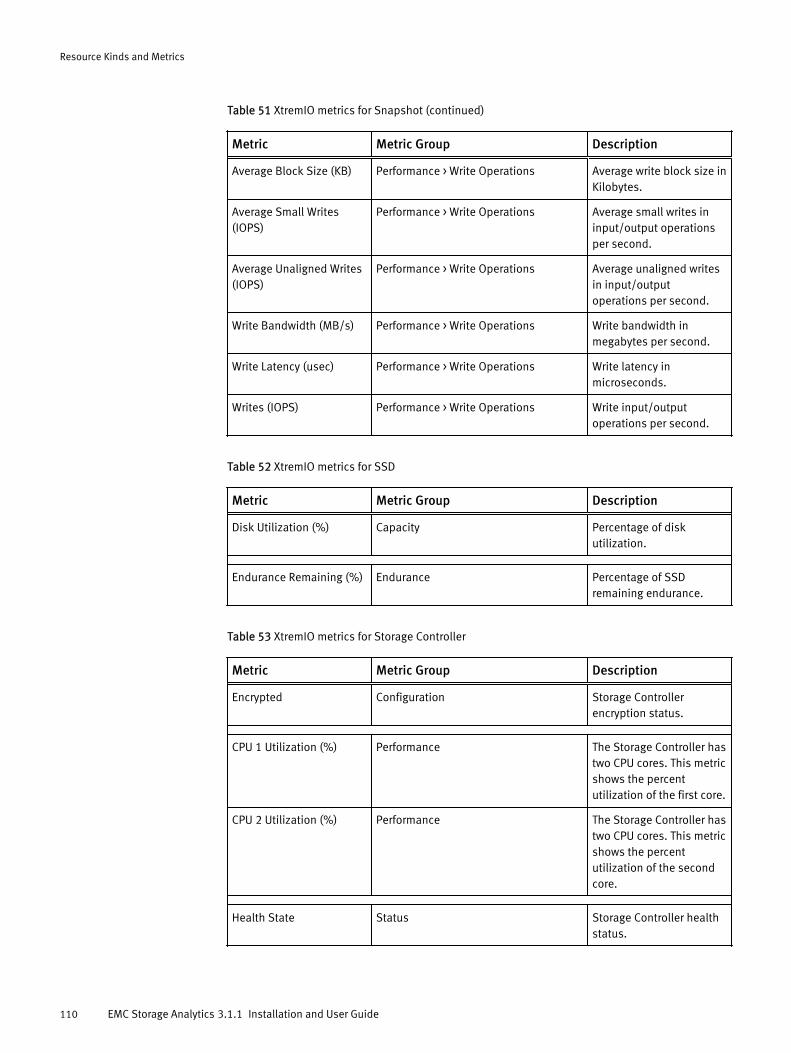
Table 51 XtremIO metrics for Snapshot (continued)
Metric Metric Group Description
Average Block Size (KB) Performance > Write Operations Average write block size inKilobytes.
Average Small Writes(IOPS)
Performance > Write Operations Average small writes ininput/output operationsper second.
Average Unaligned Writes(IOPS)
Performance > Write Operations Average unaligned writesin input/outputoperations per second.
Write Bandwidth (MB/s) Performance > Write Operations Write bandwidth inmegabytes per second.
Write Latency (usec) Performance > Write Operations Write latency inmicroseconds.
Writes (IOPS) Performance > Write Operations Write input/outputoperations per second.
Table 52 XtremIO metrics for SSD
Metric Metric Group Description
Disk Utilization (%) Capacity Percentage of diskutilization.
Endurance Remaining (%) Endurance Percentage of SSDremaining endurance.
Table 53 XtremIO metrics for Storage Controller
Metric Metric Group Description
Encrypted Configuration Storage Controllerencryption status.
CPU 1 Utilization (%) Performance The Storage Controller hastwo CPU cores. This metricshows the percentutilization of the first core.
CPU 2 Utilization (%) Performance The Storage Controller hastwo CPU cores. This metricshows the percentutilization of the secondcore.
Health State Status Storage Controller healthstatus.
Resource Kinds and Metrics
110 EMC Storage Analytics 3.1.1 Installation and User Guide
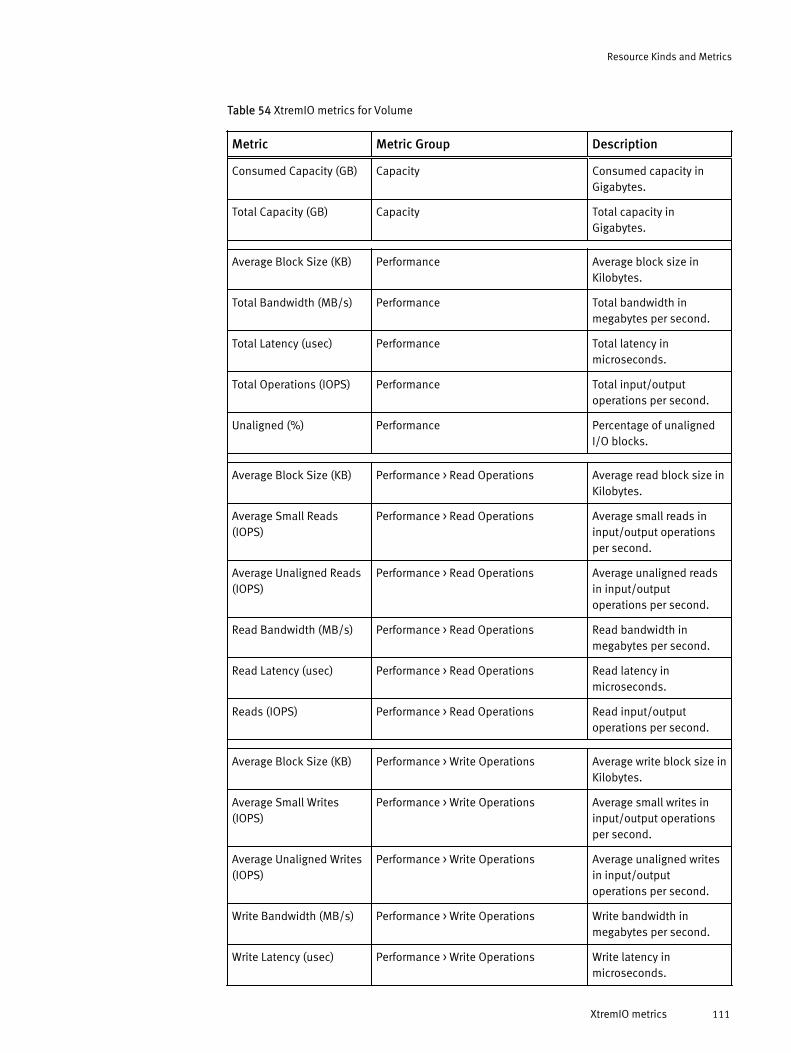
Table 54 XtremIO metrics for Volume
Metric Metric Group Description
Consumed Capacity (GB) Capacity Consumed capacity inGigabytes.
Total Capacity (GB) Capacity Total capacity inGigabytes.
Average Block Size (KB) Performance Average block size inKilobytes.
Total Bandwidth (MB/s) Performance Total bandwidth inmegabytes per second.
Total Latency (usec) Performance Total latency inmicroseconds.
Total Operations (IOPS) Performance Total input/outputoperations per second.
Unaligned (%) Performance Percentage of unalignedI/O blocks.
Average Block Size (KB) Performance > Read Operations Average read block size inKilobytes.
Average Small Reads(IOPS)
Performance > Read Operations Average small reads ininput/output operationsper second.
Average Unaligned Reads(IOPS)
Performance > Read Operations Average unaligned readsin input/outputoperations per second.
Read Bandwidth (MB/s) Performance > Read Operations Read bandwidth inmegabytes per second.
Read Latency (usec) Performance > Read Operations Read latency inmicroseconds.
Reads (IOPS) Performance > Read Operations Read input/outputoperations per second.
Average Block Size (KB) Performance > Write Operations Average write block size inKilobytes.
Average Small Writes(IOPS)
Performance > Write Operations Average small writes ininput/output operationsper second.
Average Unaligned Writes(IOPS)
Performance > Write Operations Average unaligned writesin input/outputoperations per second.
Write Bandwidth (MB/s) Performance > Write Operations Write bandwidth inmegabytes per second.
Write Latency (usec) Performance > Write Operations Write latency inmicroseconds.
Resource Kinds and Metrics
XtremIO metrics 111
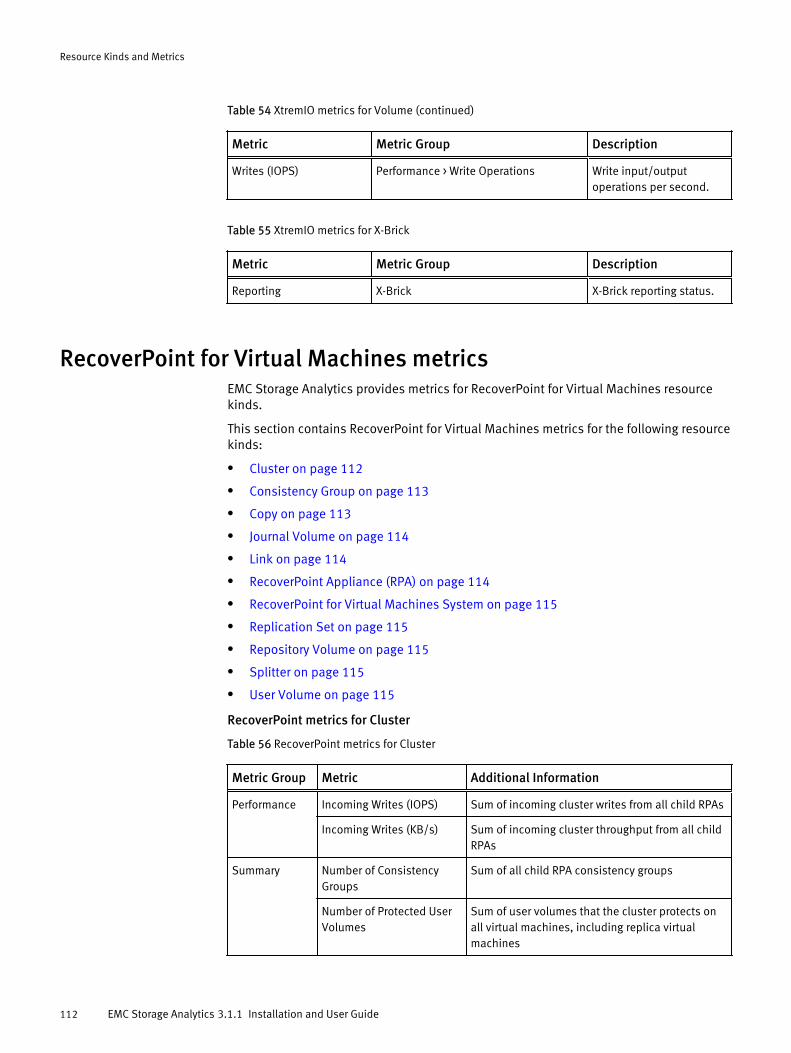
Table 54 XtremIO metrics for Volume (continued)
Metric Metric Group Description
Writes (IOPS) Performance > Write Operations Write input/outputoperations per second.
Table 55 XtremIO metrics for X-Brick
Metric Metric Group Description
Reporting X-Brick X-Brick reporting status.
RecoverPoint for Virtual Machines metricsEMC Storage Analytics provides metrics for RecoverPoint for Virtual Machines resourcekinds.
This section contains RecoverPoint for Virtual Machines metrics for the following resourcekinds:
l Cluster on page 112
l Consistency Group on page 113
l Copy on page 113
l Journal Volume on page 114
l Link on page 114
l RecoverPoint Appliance (RPA) on page 114
l RecoverPoint for Virtual Machines System on page 115
l Replication Set on page 115
l Repository Volume on page 115
l Splitter on page 115
l User Volume on page 115
RecoverPoint metrics for Cluster
Table 56 RecoverPoint metrics for Cluster
Metric Group Metric Additional Information
Performance Incoming Writes (IOPS) Sum of incoming cluster writes from all child RPAs
Incoming Writes (KB/s) Sum of incoming cluster throughput from all childRPAs
Summary Number of ConsistencyGroups
Sum of all child RPA consistency groups
Number of Protected UserVolumes
Sum of user volumes that the cluster protects onall virtual machines, including replica virtualmachines
Resource Kinds and Metrics
112 EMC Storage Analytics 3.1.1 Installation and User Guide
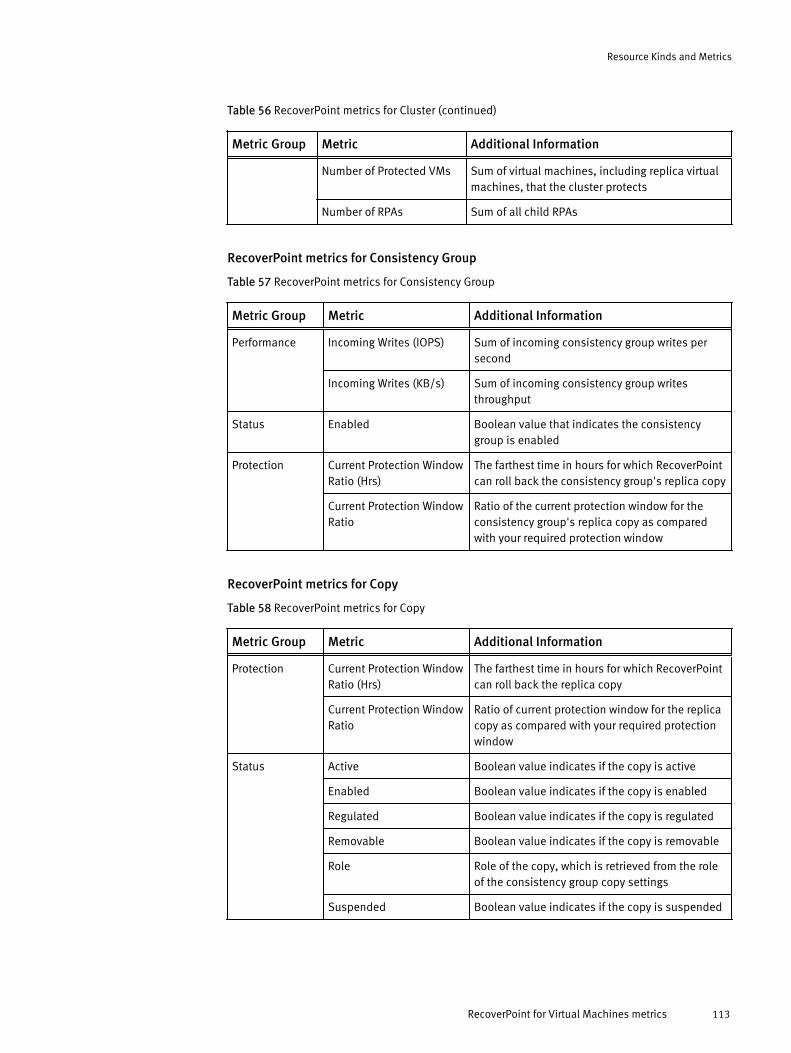
Table 56 RecoverPoint metrics for Cluster (continued)
Metric Group Metric Additional Information
Number of Protected VMs Sum of virtual machines, including replica virtualmachines, that the cluster protects
Number of RPAs Sum of all child RPAs
RecoverPoint metrics for Consistency Group
Table 57 RecoverPoint metrics for Consistency Group
Metric Group Metric Additional Information
Performance Incoming Writes (IOPS) Sum of incoming consistency group writes persecond
Incoming Writes (KB/s) Sum of incoming consistency group writesthroughput
Status Enabled Boolean value that indicates the consistencygroup is enabled
Protection Current Protection WindowRatio (Hrs)
The farthest time in hours for which RecoverPointcan roll back the consistency group's replica copy
Current Protection WindowRatio
Ratio of the current protection window for theconsistency group's replica copy as comparedwith your required protection window
RecoverPoint metrics for Copy
Table 58 RecoverPoint metrics for Copy
Metric Group Metric Additional Information
Protection Current Protection WindowRatio (Hrs)
The farthest time in hours for which RecoverPointcan roll back the replica copy
Current Protection WindowRatio
Ratio of current protection window for the replicacopy as compared with your required protectionwindow
Status Active Boolean value indicates if the copy is active
Enabled Boolean value indicates if the copy is enabled
Regulated Boolean value indicates if the copy is regulated
Removable Boolean value indicates if the copy is removable
Role Role of the copy, which is retrieved from the roleof the consistency group copy settings
Suspended Boolean value indicates if the copy is suspended
Resource Kinds and Metrics
RecoverPoint for Virtual Machines metrics 113
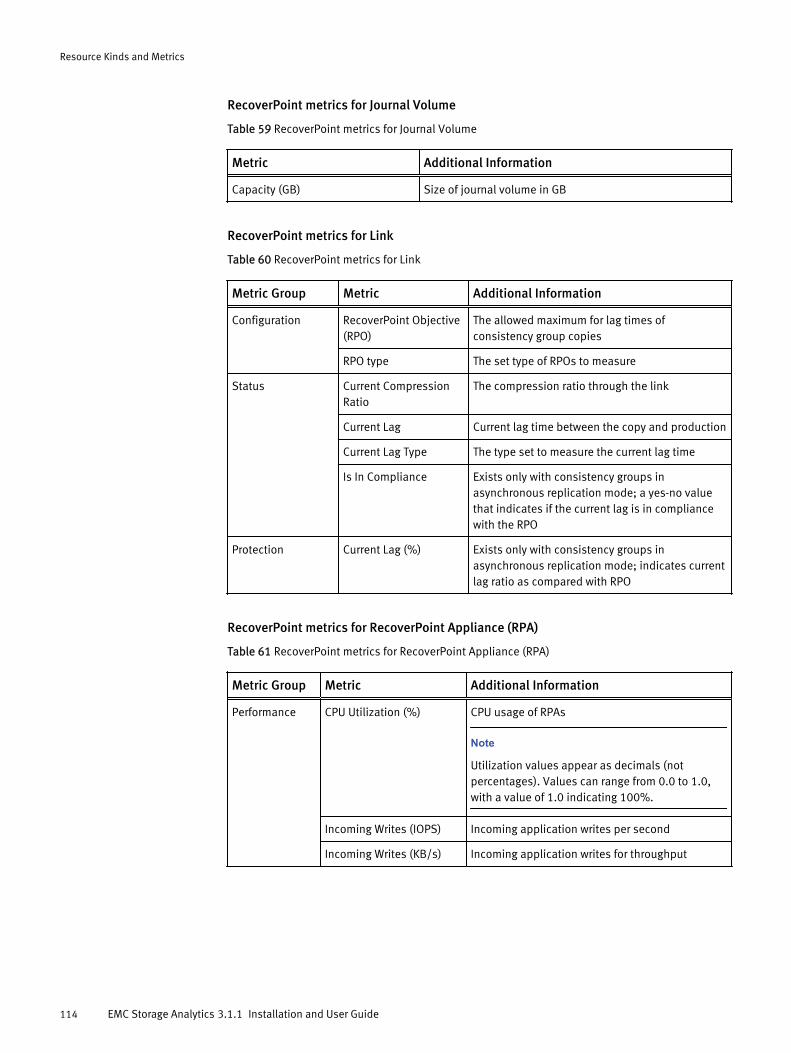
RecoverPoint metrics for Journal Volume
Table 59 RecoverPoint metrics for Journal Volume
Metric Additional Information
Capacity (GB) Size of journal volume in GB
RecoverPoint metrics for Link
Table 60 RecoverPoint metrics for Link
Metric Group Metric Additional Information
Configuration RecoverPoint Objective(RPO)
The allowed maximum for lag times ofconsistency group copies
RPO type The set type of RPOs to measure
Status Current CompressionRatio
The compression ratio through the link
Current Lag Current lag time between the copy and production
Current Lag Type The type set to measure the current lag time
Is In Compliance Exists only with consistency groups inasynchronous replication mode; a yes-no valuethat indicates if the current lag is in compliancewith the RPO
Protection Current Lag (%) Exists only with consistency groups inasynchronous replication mode; indicates currentlag ratio as compared with RPO
RecoverPoint metrics for RecoverPoint Appliance (RPA)
Table 61 RecoverPoint metrics for RecoverPoint Appliance (RPA)
Metric Group Metric Additional Information
Performance CPU Utilization (%) CPU usage of RPAs
Note
Utilization values appear as decimals (notpercentages). Values can range from 0.0 to 1.0,with a value of 1.0 indicating 100%.
Incoming Writes (IOPS) Incoming application writes per second
Incoming Writes (KB/s) Incoming application writes for throughput
Resource Kinds and Metrics
114 EMC Storage Analytics 3.1.1 Installation and User Guide
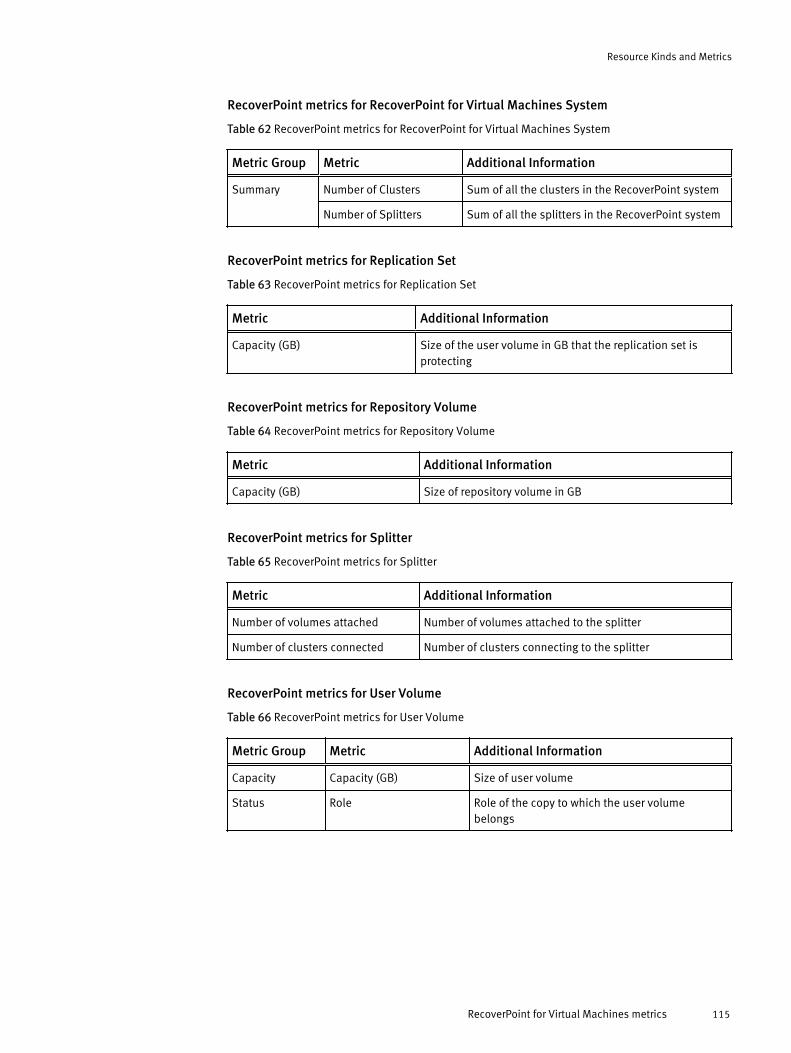
RecoverPoint metrics for RecoverPoint for Virtual Machines System
Table 62 RecoverPoint metrics for RecoverPoint for Virtual Machines System
Metric Group Metric Additional Information
Summary Number of Clusters Sum of all the clusters in the RecoverPoint system
Number of Splitters Sum of all the splitters in the RecoverPoint system
RecoverPoint metrics for Replication Set
Table 63 RecoverPoint metrics for Replication Set
Metric Additional Information
Capacity (GB) Size of the user volume in GB that the replication set isprotecting
RecoverPoint metrics for Repository Volume
Table 64 RecoverPoint metrics for Repository Volume
Metric Additional Information
Capacity (GB) Size of repository volume in GB
RecoverPoint metrics for Splitter
Table 65 RecoverPoint metrics for Splitter
Metric Additional Information
Number of volumes attached Number of volumes attached to the splitter
Number of clusters connected Number of clusters connecting to the splitter
RecoverPoint metrics for User Volume
Table 66 RecoverPoint metrics for User Volume
Metric Group Metric Additional Information
Capacity Capacity (GB) Size of user volume
Status Role Role of the copy to which the user volumebelongs
Resource Kinds and Metrics
RecoverPoint for Virtual Machines metrics 115

Resource Kinds and Metrics
116 EMC Storage Analytics 3.1.1 Installation and User Guide
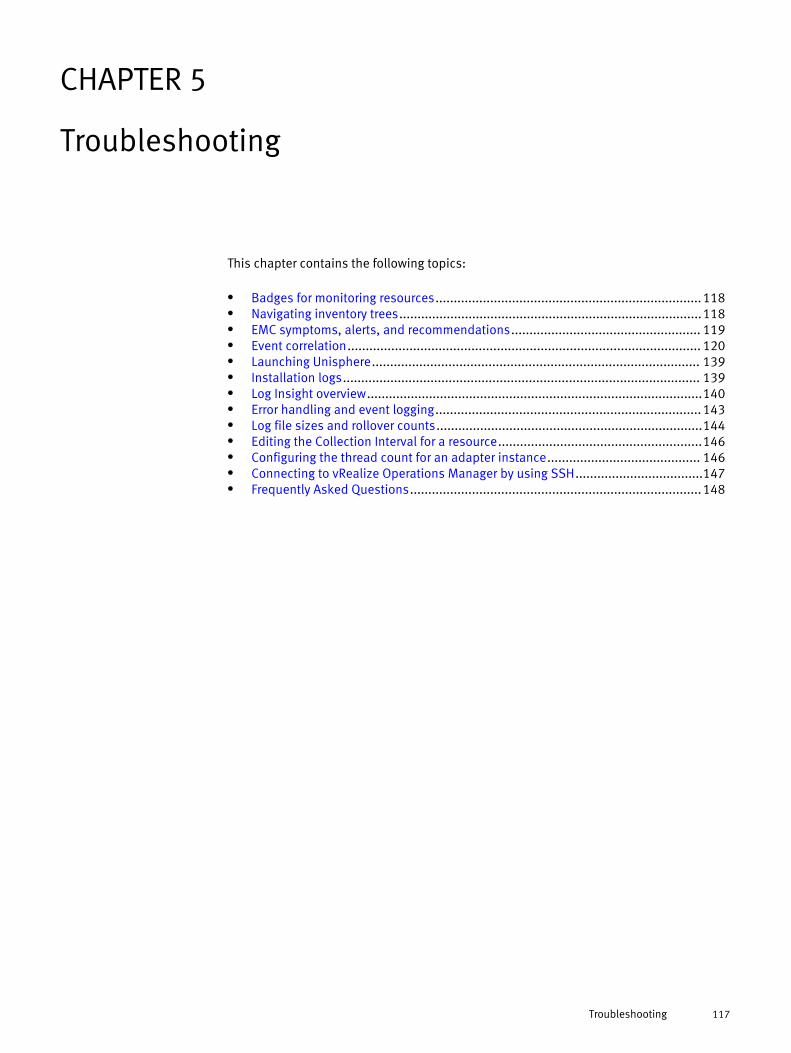
CHAPTER 5
Troubleshooting
This chapter contains the following topics:
l Badges for monitoring resources.........................................................................118l Navigating inventory trees...................................................................................118l EMC symptoms, alerts, and recommendations.................................................... 119l Event correlation................................................................................................. 120l Launching Unisphere.......................................................................................... 139l Installation logs.................................................................................................. 139l Log Insight overview............................................................................................140l Error handling and event logging......................................................................... 143l Log file sizes and rollover counts.........................................................................144l Editing the Collection Interval for a resource........................................................146l Configuring the thread count for an adapter instance.......................................... 146l Connecting to vRealize Operations Manager by using SSH...................................147l Frequently Asked Questions................................................................................148
Troubleshooting 117
Badges for monitoring resourcesThis topic describes the use of vRealize Operations Manager badges to monitor EMCStorage Analytics resources.
vRealize Operations Manager enables you to analyze capacity, workload, and stress ofsupported resource objects. vRealize Operations Manager badges are available for theseEMC products: VNX Block, VNX File, VNXe, and VMAX.
The badges include:
WorkloadThe Workload badge defines the current workload of a monitored resource. Itdisplays a breakdown of the workload based on supported metrics.
StressThe Stress badge is similar to the Workload badge but defines the workload over aperiod of time. The Stress badge displays one-hour time slices over the period of aweek. The color of each slice reflects the stress status of the resource.
CapacityThe Capacity badge displays the percentage of a resource that is currently consumedand the remaining capacity for the resource.
Note
Depending on the resource and supported metrics, full capacity is sometimesdefined as 100% (for example, Busy %). Full capacity can also be defined by themaximum observed value (for example, Total Operations IO/s).
Time RemainingThis badge is calculated from the Capacity badge and estimates when the resourcewill reach full capacity.
The badges are based on a default policy that is defined in vRealize Operations Managerfor each resource kind.
Navigating inventory treesThis topic describes how to navigate vRealize Operations Manager inventory trees forEMC resource objects.
Navigating inventory trees in vRealize Operations Manager can help you to troubleshootproblems you encounter with EMC resources.
Note
vRealize Operations Manager inventory trees are available for these EMC products: VNXBlock, VNX File, and VNXe.
Procedure
1. Log into vRealize Operations Manager.
2. Open the Environment Overview.
3. Locate Inventory Trees.
4. Click the tree name to view its nodes. Click > to expand the list to view objects underthe selected node.
Troubleshooting
118 EMC Storage Analytics 3.1.1 Installation and User Guide
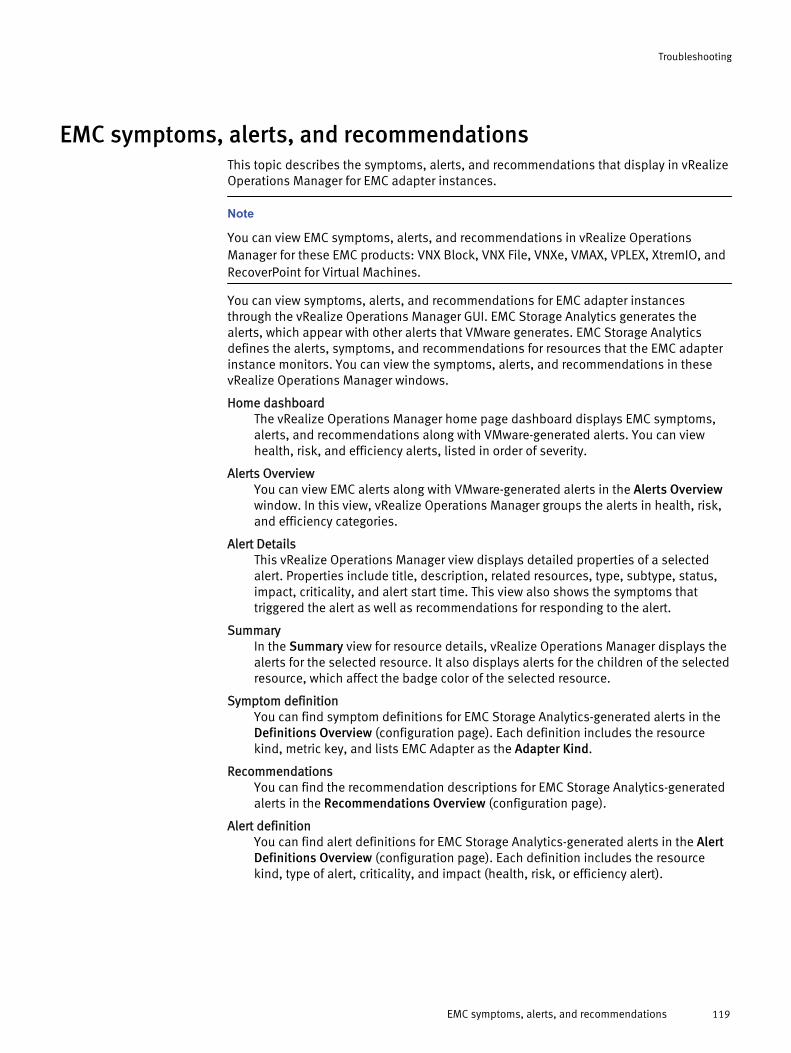
EMC symptoms, alerts, and recommendationsThis topic describes the symptoms, alerts, and recommendations that display in vRealizeOperations Manager for EMC adapter instances.
Note
You can view EMC symptoms, alerts, and recommendations in vRealize OperationsManager for these EMC products: VNX Block, VNX File, VNXe, VMAX, VPLEX, XtremIO, andRecoverPoint for Virtual Machines.
You can view symptoms, alerts, and recommendations for EMC adapter instancesthrough the vRealize Operations Manager GUI. EMC Storage Analytics generates thealerts, which appear with other alerts that VMware generates. EMC Storage Analyticsdefines the alerts, symptoms, and recommendations for resources that the EMC adapterinstance monitors. You can view the symptoms, alerts, and recommendations in thesevRealize Operations Manager windows.
Home dashboardThe vRealize Operations Manager home page dashboard displays EMC symptoms,alerts, and recommendations along with VMware-generated alerts. You can viewhealth, risk, and efficiency alerts, listed in order of severity.
Alerts OverviewYou can view EMC alerts along with VMware-generated alerts in the Alerts Overviewwindow. In this view, vRealize Operations Manager groups the alerts in health, risk,and efficiency categories.
Alert DetailsThis vRealize Operations Manager view displays detailed properties of a selectedalert. Properties include title, description, related resources, type, subtype, status,impact, criticality, and alert start time. This view also shows the symptoms thattriggered the alert as well as recommendations for responding to the alert.
SummaryIn the Summary view for resource details, vRealize Operations Manager displays thealerts for the selected resource. It also displays alerts for the children of the selectedresource, which affect the badge color of the selected resource.
Symptom definitionYou can find symptom definitions for EMC Storage Analytics-generated alerts in theDefinitions Overview (configuration page). Each definition includes the resourcekind, metric key, and lists EMC Adapter as the Adapter Kind.
RecommendationsYou can find the recommendation descriptions for EMC Storage Analytics-generatedalerts in the Recommendations Overview (configuration page).
Alert definitionYou can find alert definitions for EMC Storage Analytics-generated alerts in the AlertDefinitions Overview (configuration page). Each definition includes the resourcekind, type of alert, criticality, and impact (health, risk, or efficiency alert).
Troubleshooting
EMC symptoms, alerts, and recommendations 119
Event correlationEvent correlation enables users to correlate alerts with the resources that generate them.
Event correlation is available for:
l VNX Block
l VNX File
EMC adapter instances registered with the vRealize Operations Manager monitor eventson select resources. These events appear as alerts in vRealize Operations Manager. Theevents are associated with the resources that generate them and aid the user introubleshooting problems that may occur.
vRealize Operations Manager manages the life cycle of an alert and will cancel an activealert based on its rules. For example, vRealize Operations Manager may cancel an alert ifEMC Storage Analytics no longer reports it.
vRealize Operations Manager-generated events influence the health score calculation forselect resources. For example, in the RESOURCE:DETAILS pane for a selected resource,vRealize Operations Manager-generated events that contribute to the health score appearas alerts.
vRealize Operations Manager only generates events and associates them with theresources that triggered them. vRealize Operations Manager determines how the alertsappear and how they affect the health scores of the related resources.
Note
When a resource is removed, vRealize Operations Manager automatically removesexisting alerts associated with the resource, and the alerts no longer appear in the userinterface.
Viewing all alertsThis procedure shows you how to view a list of all the alerts in the vRealize OperationsManager system.
Procedure
1. Log into the vRealize Operations Manager user interface.
2. From the vRealize Operations Manager menu, select ALERTS > ALERTS OVERVIEW.
A list of alerts appears in the ALERTS OVERVIEW window.
3. (Optional) To refine your search, use the tools in the menu bar. For example, select astart and end date or enter a search string.
4. (Optional) To view a summary of information about a specific alert, select the alertand double-click it.
The ALERT SUMMARY window appears and provides reason, impact, and root causeinformation for the alert.
Troubleshooting
120 EMC Storage Analytics 3.1.1 Installation and User Guide
Finding resource alertsAn alert generated by EMC Storage Analytics is associated with a resource. Thisprocedure shows you how to find an alert for a specific resource.
Procedure
1. Log into the vRealize Operations Manager user interface.
2. Select the resource from one of the dashboard views.
The number that appears on the alert icon represents the number of alerts for thisresource.
3. Click the Show Alerts icon on the menu bar to view the list of alerts for the resource.
Alert information for the resource appears in the popup window.
Locating alerts that affect the health score for a resourceThis procedure shows how to locate an alert that affects the health score of a resource.
Different types of alerts can contribute to the health score of a resource, but a resourcewith an abnormal health score might not have triggered the alert. For example, the alertmight be triggered by a parent resource. To locate an alert that affects the health score ofa resource:
Procedure
1. Log into the vRealize Operations Manager user interface.
2. View the RESOURCE DETAIL window for a resource that shows an abnormal healthscore.
Events that contributed to the resource health score appear in the ROOT CAUSERANKING pane.
3. Click an event to view the event details and investigate the underlying cause.
List of alerts and notificationsEMC Storage Analytics generates the listed events when the resources are queried.
This section provides the following information:
l VMAX alerts on page 121
l VNX Block alerts on page 123
l VNX Block notifications on page 127
l VNX File alerts on page 129
l VNX File notifications on page 132
l VNXe alerts on page 137
VMAX alertsThe Wait Cycle is 1 for all these VMAX alerts.
Troubleshooting
Finding resource alerts 121
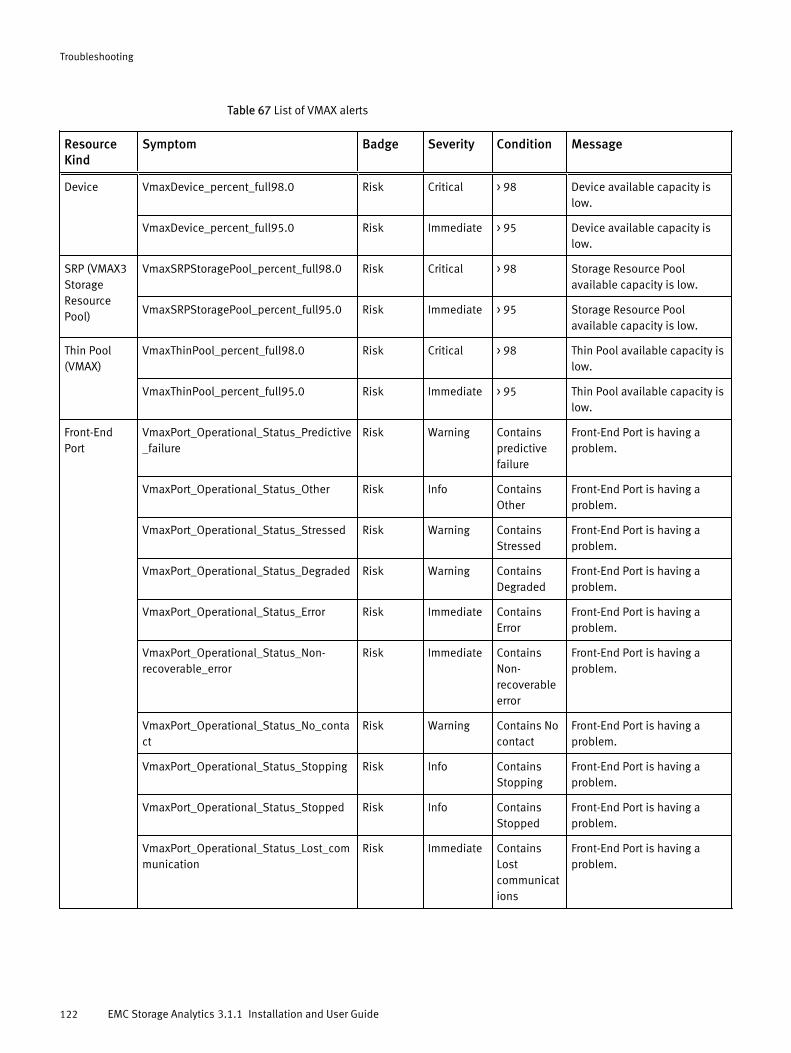
Table 67 List of VMAX alerts
ResourceKind
Symptom Badge Severity Condition Message
Device VmaxDevice_percent_full98.0 Risk Critical > 98 Device available capacity islow.
VmaxDevice_percent_full95.0 Risk Immediate > 95 Device available capacity islow.
SRP (VMAX3StorageResourcePool)
VmaxSRPStoragePool_percent_full98.0 Risk Critical > 98 Storage Resource Poolavailable capacity is low.
VmaxSRPStoragePool_percent_full95.0 Risk Immediate > 95 Storage Resource Poolavailable capacity is low.
Thin Pool(VMAX)
VmaxThinPool_percent_full98.0 Risk Critical > 98 Thin Pool available capacity islow.
VmaxThinPool_percent_full95.0 Risk Immediate > 95 Thin Pool available capacity islow.
Front-EndPort
VmaxPort_Operational_Status_Predictive_failure
Risk Warning Containspredictivefailure
Front-End Port is having aproblem.
VmaxPort_Operational_Status_Other Risk Info ContainsOther
Front-End Port is having aproblem.
VmaxPort_Operational_Status_Stressed Risk Warning ContainsStressed
Front-End Port is having aproblem.
VmaxPort_Operational_Status_Degraded Risk Warning ContainsDegraded
Front-End Port is having aproblem.
VmaxPort_Operational_Status_Error Risk Immediate ContainsError
Front-End Port is having aproblem.
VmaxPort_Operational_Status_Non-recoverable_error
Risk Immediate ContainsNon-recoverableerror
Front-End Port is having aproblem.
VmaxPort_Operational_Status_No_contact
Risk Warning Contains Nocontact
Front-End Port is having aproblem.
VmaxPort_Operational_Status_Stopping Risk Info ContainsStopping
Front-End Port is having aproblem.
VmaxPort_Operational_Status_Stopped Risk Info ContainsStopped
Front-End Port is having aproblem.
VmaxPort_Operational_Status_Lost_communication
Risk Immediate ContainsLostcommunications
Front-End Port is having aproblem.
Troubleshooting
122 EMC Storage Analytics 3.1.1 Installation and User Guide
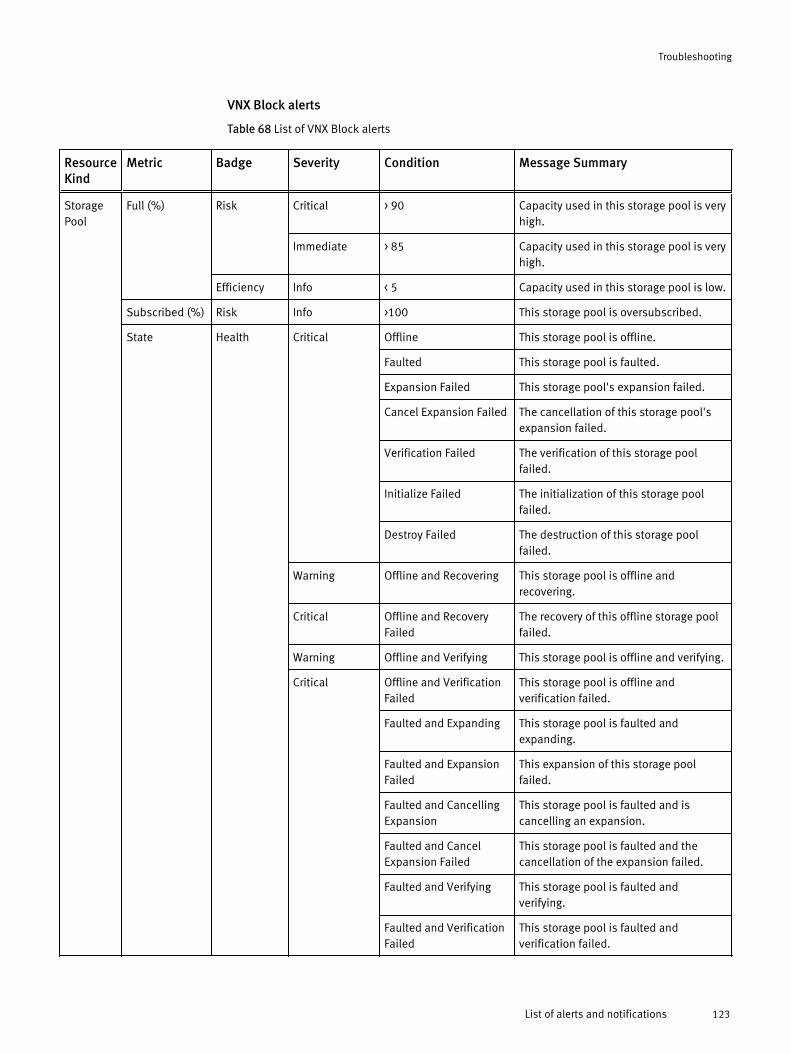
VNX Block alerts
Table 68 List of VNX Block alerts
ResourceKind
Metric Badge Severity Condition Message Summary
StoragePool
Full (%) Risk Critical > 90 Capacity used in this storage pool is veryhigh.
Immediate > 85 Capacity used in this storage pool is veryhigh.
Efficiency Info < 5 Capacity used in this storage pool is low.
Subscribed (%) Risk Info >100 This storage pool is oversubscribed.
State Health Critical Offline This storage pool is offline.
Faulted This storage pool is faulted.
Expansion Failed This storage pool's expansion failed.
Cancel Expansion Failed The cancellation of this storage pool'sexpansion failed.
Verification Failed The verification of this storage poolfailed.
Initialize Failed The initialization of this storage poolfailed.
Destroy Failed The destruction of this storage poolfailed.
Warning Offline and Recovering This storage pool is offline andrecovering.
Critical Offline and RecoveryFailed
The recovery of this offline storage poolfailed.
Warning Offline and Verifying This storage pool is offline and verifying.
Critical Offline and VerificationFailed
This storage pool is offline andverification failed.
Faulted and Expanding This storage pool is faulted andexpanding.
Faulted and ExpansionFailed
This expansion of this storage poolfailed.
Faulted and CancellingExpansion
This storage pool is faulted and iscancelling an expansion.
Faulted and CancelExpansion Failed
This storage pool is faulted and thecancellation of the expansion failed.
Faulted and Verifying This storage pool is faulted andverifying.
Faulted and VerificationFailed
This storage pool is faulted andverification failed.
Troubleshooting
List of alerts and notifications 123
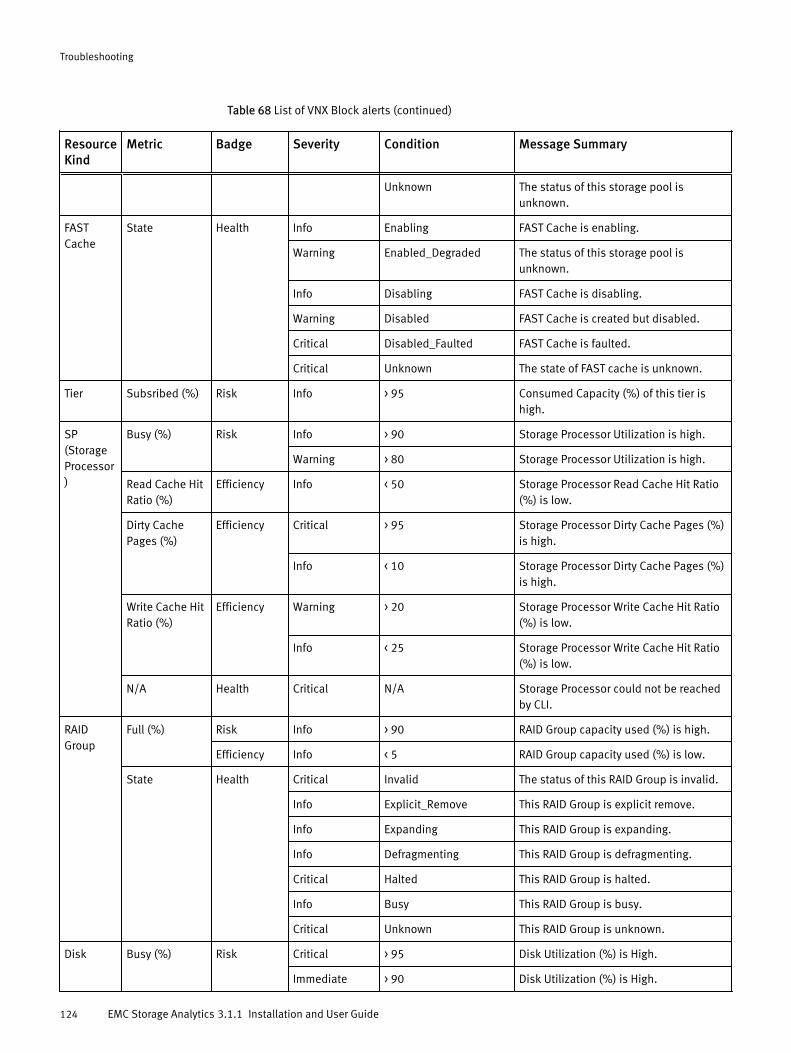
Table 68 List of VNX Block alerts (continued)
ResourceKind
Metric Badge Severity Condition Message Summary
Unknown The status of this storage pool isunknown.
FASTCache
State Health Info Enabling FAST Cache is enabling.
Warning Enabled_Degraded The status of this storage pool isunknown.
Info Disabling FAST Cache is disabling.
Warning Disabled FAST Cache is created but disabled.
Critical Disabled_Faulted FAST Cache is faulted.
Critical Unknown The state of FAST cache is unknown.
Tier Subsribed (%) Risk Info > 95 Consumed Capacity (%) of this tier ishigh.
SP(StorageProcessor)
Busy (%) Risk Info > 90 Storage Processor Utilization is high.
Warning > 80 Storage Processor Utilization is high.
Read Cache HitRatio (%)
Efficiency Info < 50 Storage Processor Read Cache Hit Ratio(%) is low.
Dirty CachePages (%)
Efficiency Critical > 95 Storage Processor Dirty Cache Pages (%)is high.
Info < 10 Storage Processor Dirty Cache Pages (%)is high.
Write Cache HitRatio (%)
Efficiency Warning > 20 Storage Processor Write Cache Hit Ratio(%) is low.
Info < 25 Storage Processor Write Cache Hit Ratio(%) is low.
N/A Health Critical N/A Storage Processor could not be reachedby CLI.
RAIDGroup
Full (%) Risk Info > 90 RAID Group capacity used (%) is high.
Efficiency Info < 5 RAID Group capacity used (%) is low.
State Health Critical Invalid The status of this RAID Group is invalid.
Info Explicit_Remove This RAID Group is explicit remove.
Info Expanding This RAID Group is expanding.
Info Defragmenting This RAID Group is defragmenting.
Critical Halted This RAID Group is halted.
Info Busy This RAID Group is busy.
Critical Unknown This RAID Group is unknown.
Disk Busy (%) Risk Critical > 95 Disk Utilization (%) is High.
Immediate > 90 Disk Utilization (%) is High.
Troubleshooting
124 EMC Storage Analytics 3.1.1 Installation and User Guide
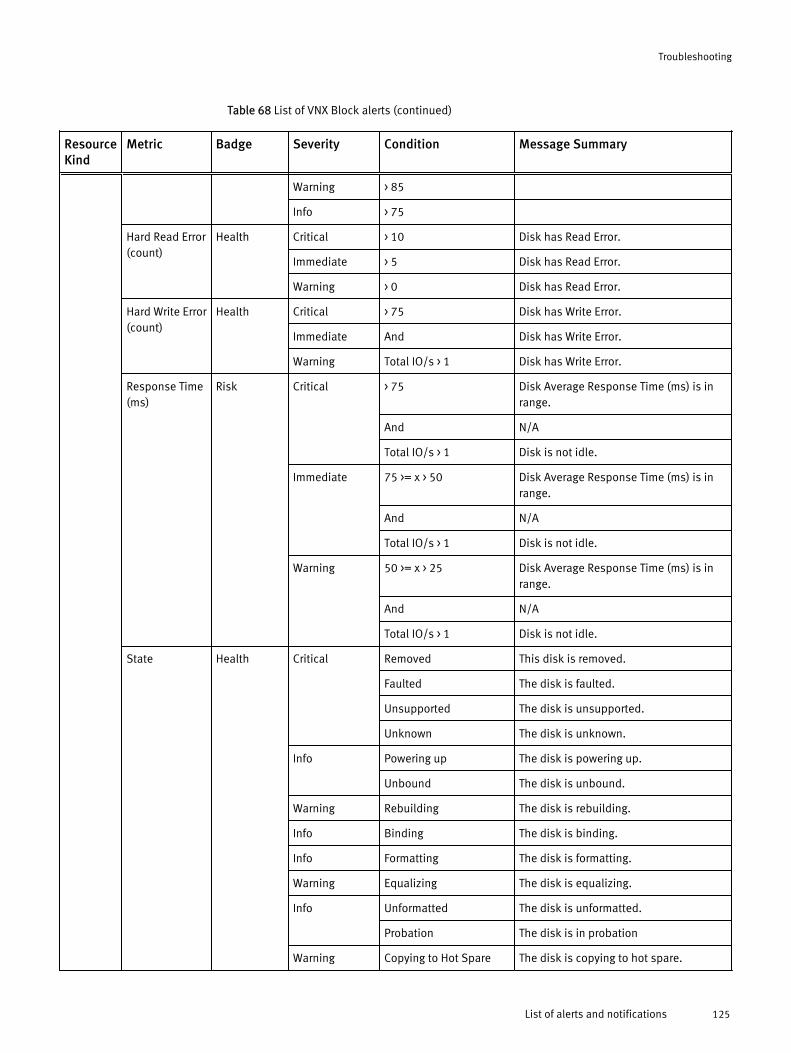
Table 68 List of VNX Block alerts (continued)
ResourceKind
Metric Badge Severity Condition Message Summary
Warning > 85
Info > 75
Hard Read Error(count)
Health Critical > 10 Disk has Read Error.
Immediate > 5 Disk has Read Error.
Warning > 0 Disk has Read Error.
Hard Write Error(count)
Health Critical > 75 Disk has Write Error.
Immediate And Disk has Write Error.
Warning Total IO/s > 1 Disk has Write Error.
Response Time(ms)
Risk Critical > 75 Disk Average Response Time (ms) is inrange.
And N/A
Total IO/s > 1 Disk is not idle.
Immediate 75 >= x > 50 Disk Average Response Time (ms) is inrange.
And N/A
Total IO/s > 1 Disk is not idle.
Warning 50 >= x > 25 Disk Average Response Time (ms) is inrange.
And N/A
Total IO/s > 1 Disk is not idle.
State Health Critical Removed This disk is removed.
Faulted The disk is faulted.
Unsupported The disk is unsupported.
Unknown The disk is unknown.
Info Powering up The disk is powering up.
Unbound The disk is unbound.
Warning Rebuilding The disk is rebuilding.
Info Binding The disk is binding.
Info Formatting The disk is formatting.
Warning Equalizing The disk is equalizing.
Info Unformatted The disk is unformatted.
Probation The disk is in probation
Warning Copying to Hot Spare The disk is copying to hot spare.
Troubleshooting
List of alerts and notifications 125
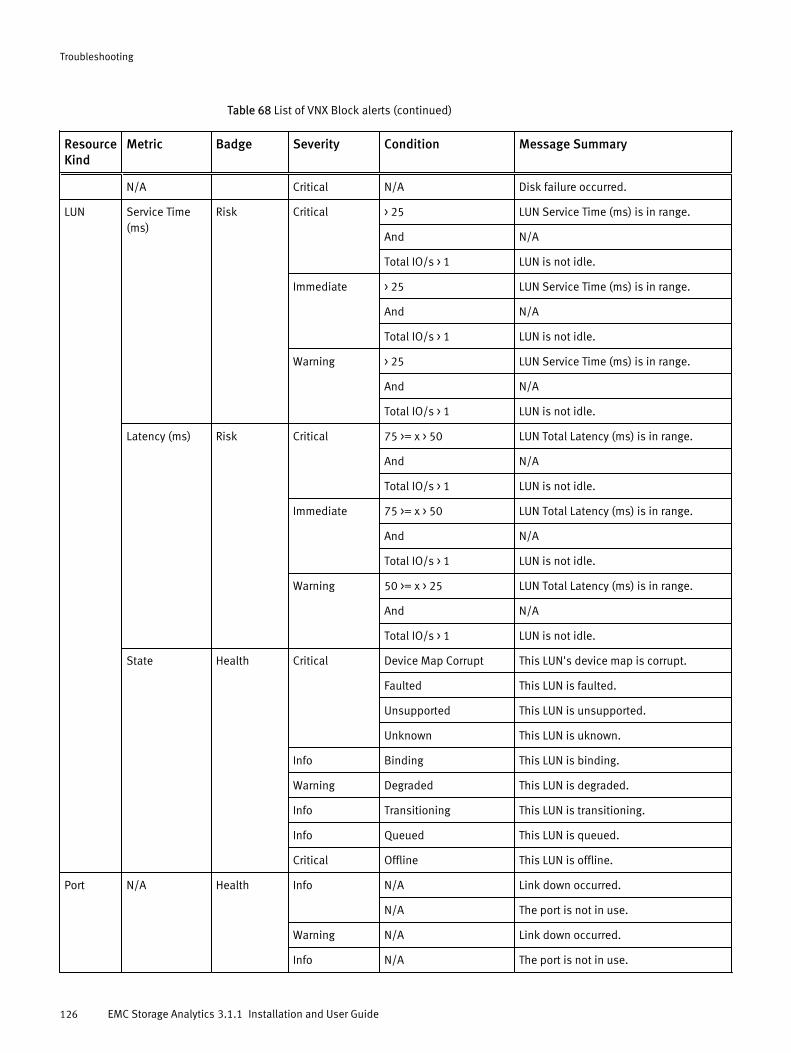
Table 68 List of VNX Block alerts (continued)
ResourceKind
Metric Badge Severity Condition Message Summary
N/A Critical N/A Disk failure occurred.
LUN Service Time(ms)
Risk Critical > 25 LUN Service Time (ms) is in range.
And N/A
Total IO/s > 1 LUN is not idle.
Immediate > 25 LUN Service Time (ms) is in range.
And N/A
Total IO/s > 1 LUN is not idle.
Warning > 25 LUN Service Time (ms) is in range.
And N/A
Total IO/s > 1 LUN is not idle.
Latency (ms) Risk Critical 75 >= x > 50 LUN Total Latency (ms) is in range.
And N/A
Total IO/s > 1 LUN is not idle.
Immediate 75 >= x > 50 LUN Total Latency (ms) is in range.
And N/A
Total IO/s > 1 LUN is not idle.
Warning 50 >= x > 25 LUN Total Latency (ms) is in range.
And N/A
Total IO/s > 1 LUN is not idle.
State Health Critical Device Map Corrupt This LUN's device map is corrupt.
Faulted This LUN is faulted.
Unsupported This LUN is unsupported.
Unknown This LUN is uknown.
Info Binding This LUN is binding.
Warning Degraded This LUN is degraded.
Info Transitioning This LUN is transitioning.
Info Queued This LUN is queued.
Critical Offline This LUN is offline.
Port N/A Health Info N/A Link down occurred.
N/A The port is not in use.
Warning N/A Link down occurred.
Info N/A The port is not in use.
Troubleshooting
126 EMC Storage Analytics 3.1.1 Installation and User Guide
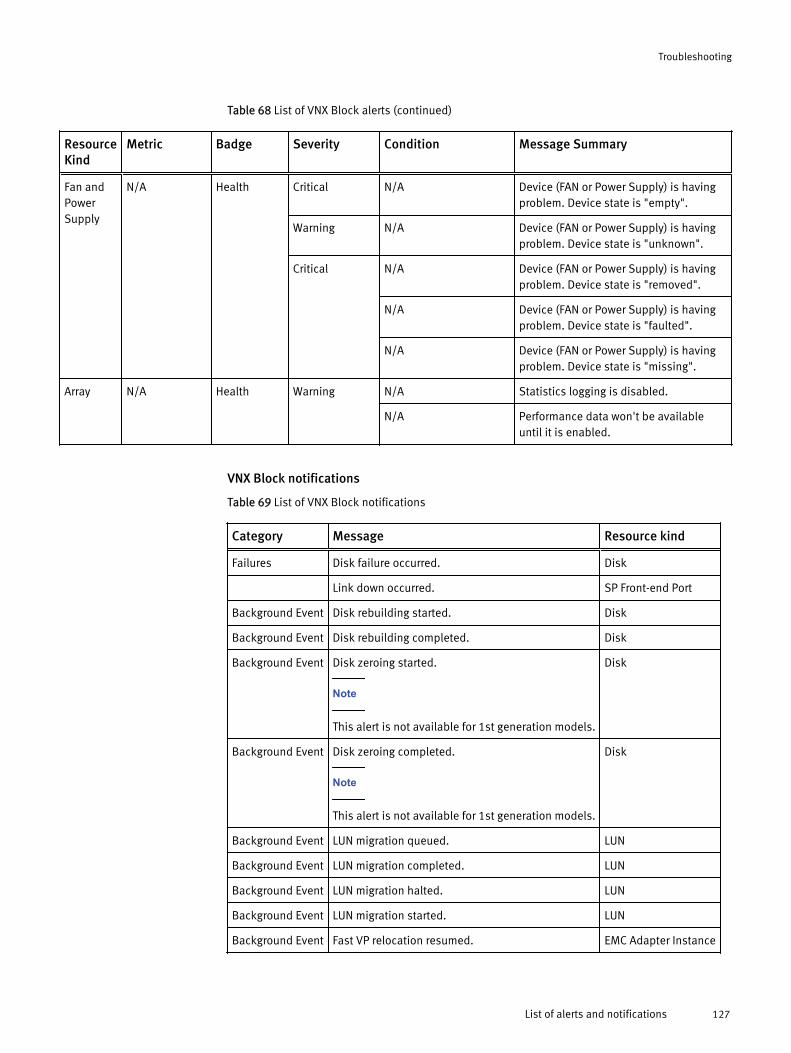
Table 68 List of VNX Block alerts (continued)
ResourceKind
Metric Badge Severity Condition Message Summary
Fan andPowerSupply
N/A Health Critical N/A Device (FAN or Power Supply) is havingproblem. Device state is "empty".
Warning N/A Device (FAN or Power Supply) is havingproblem. Device state is "unknown".
Critical N/A Device (FAN or Power Supply) is havingproblem. Device state is "removed".
N/A Device (FAN or Power Supply) is havingproblem. Device state is "faulted".
N/A Device (FAN or Power Supply) is havingproblem. Device state is "missing".
Array N/A Health Warning N/A Statistics logging is disabled.
N/A Performance data won't be availableuntil it is enabled.
VNX Block notifications
Table 69 List of VNX Block notifications
Category Message Resource kind
Failures Disk failure occurred. Disk
Link down occurred. SP Front-end Port
Background Event Disk rebuilding started. Disk
Background Event Disk rebuilding completed. Disk
Background Event Disk zeroing started.
Note
This alert is not available for 1st generation models.
Disk
Background Event Disk zeroing completed.
Note
This alert is not available for 1st generation models.
Disk
Background Event LUN migration queued. LUN
Background Event LUN migration completed. LUN
Background Event LUN migration halted. LUN
Background Event LUN migration started. LUN
Background Event Fast VP relocation resumed. EMC Adapter Instance
Troubleshooting
List of alerts and notifications 127
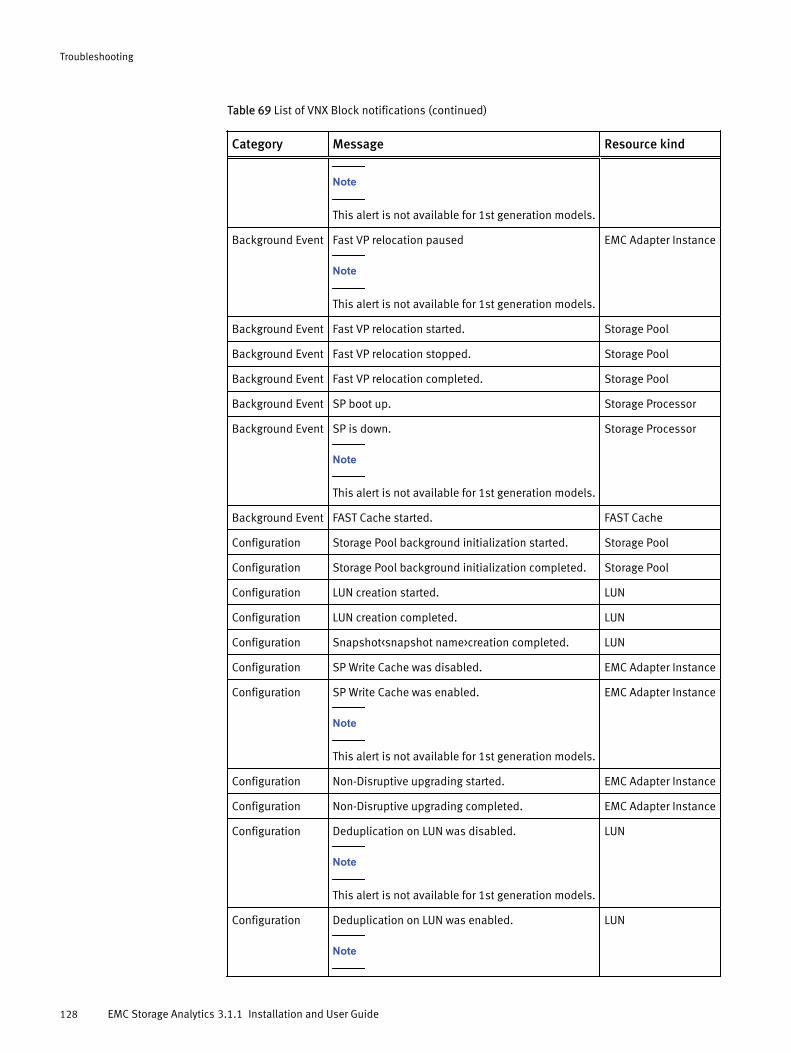
Table 69 List of VNX Block notifications (continued)
Category Message Resource kind
Note
This alert is not available for 1st generation models.
Background Event Fast VP relocation paused
Note
This alert is not available for 1st generation models.
EMC Adapter Instance
Background Event Fast VP relocation started. Storage Pool
Background Event Fast VP relocation stopped. Storage Pool
Background Event Fast VP relocation completed. Storage Pool
Background Event SP boot up. Storage Processor
Background Event SP is down.
Note
This alert is not available for 1st generation models.
Storage Processor
Background Event FAST Cache started. FAST Cache
Configuration Storage Pool background initialization started. Storage Pool
Configuration Storage Pool background initialization completed. Storage Pool
Configuration LUN creation started. LUN
Configuration LUN creation completed. LUN
Configuration Snapshot<snapshot name>creation completed. LUN
Configuration SP Write Cache was disabled. EMC Adapter Instance
Configuration SP Write Cache was enabled.
Note
This alert is not available for 1st generation models.
EMC Adapter Instance
Configuration Non-Disruptive upgrading started. EMC Adapter Instance
Configuration Non-Disruptive upgrading completed. EMC Adapter Instance
Configuration Deduplication on LUN was disabled.
Note
This alert is not available for 1st generation models.
LUN
Configuration Deduplication on LUN was enabled.
Note
LUN
Troubleshooting
128 EMC Storage Analytics 3.1.1 Installation and User Guide
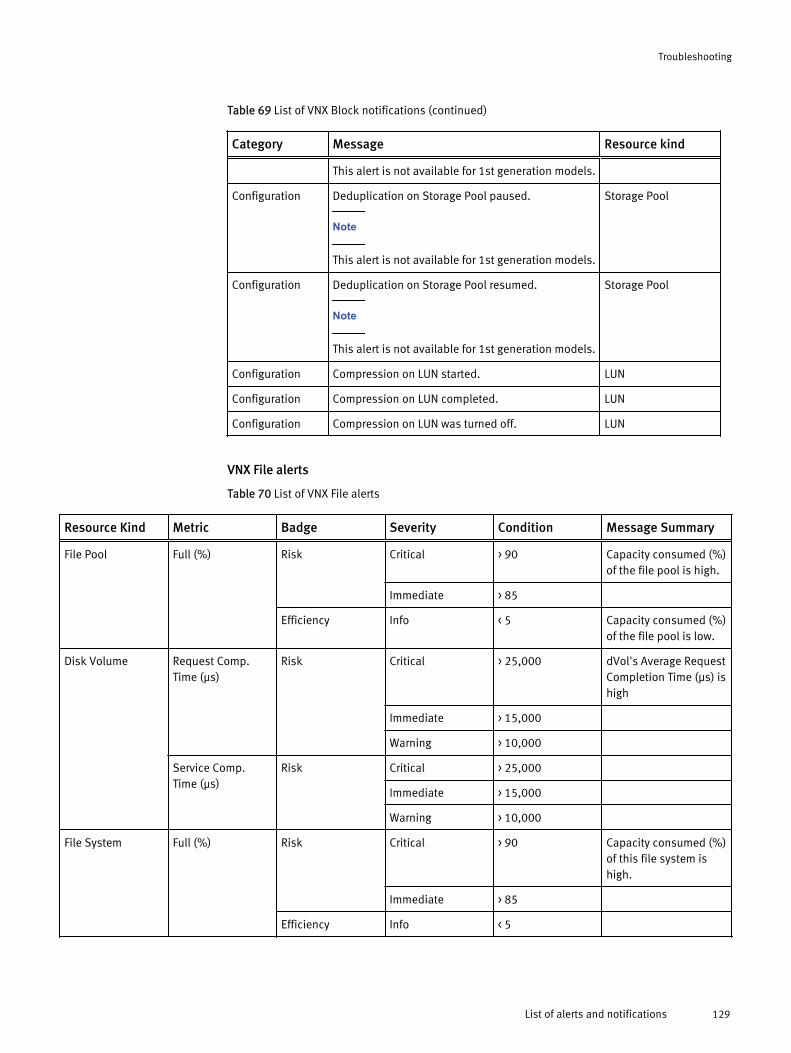
Table 69 List of VNX Block notifications (continued)
Category Message Resource kind
This alert is not available for 1st generation models.
Configuration Deduplication on Storage Pool paused.
Note
This alert is not available for 1st generation models.
Storage Pool
Configuration Deduplication on Storage Pool resumed.
Note
This alert is not available for 1st generation models.
Storage Pool
Configuration Compression on LUN started. LUN
Configuration Compression on LUN completed. LUN
Configuration Compression on LUN was turned off. LUN
VNX File alerts
Table 70 List of VNX File alerts
Resource Kind Metric Badge Severity Condition Message Summary
File Pool Full (%) Risk Critical > 90 Capacity consumed (%)of the file pool is high.
Immediate > 85
Efficiency Info < 5 Capacity consumed (%)of the file pool is low.
Disk Volume Request Comp.Time (µs)
Risk Critical > 25,000 dVol's Average RequestCompletion Time (µs) ishigh
Immediate > 15,000
Warning > 10,000
Service Comp.Time (µs)
Risk Critical > 25,000
Immediate > 15,000
Warning > 10,000
File System Full (%) Risk Critical > 90 Capacity consumed (%)of this file system ishigh.
Immediate > 85
Efficiency Info < 5
Troubleshooting
List of alerts and notifications 129
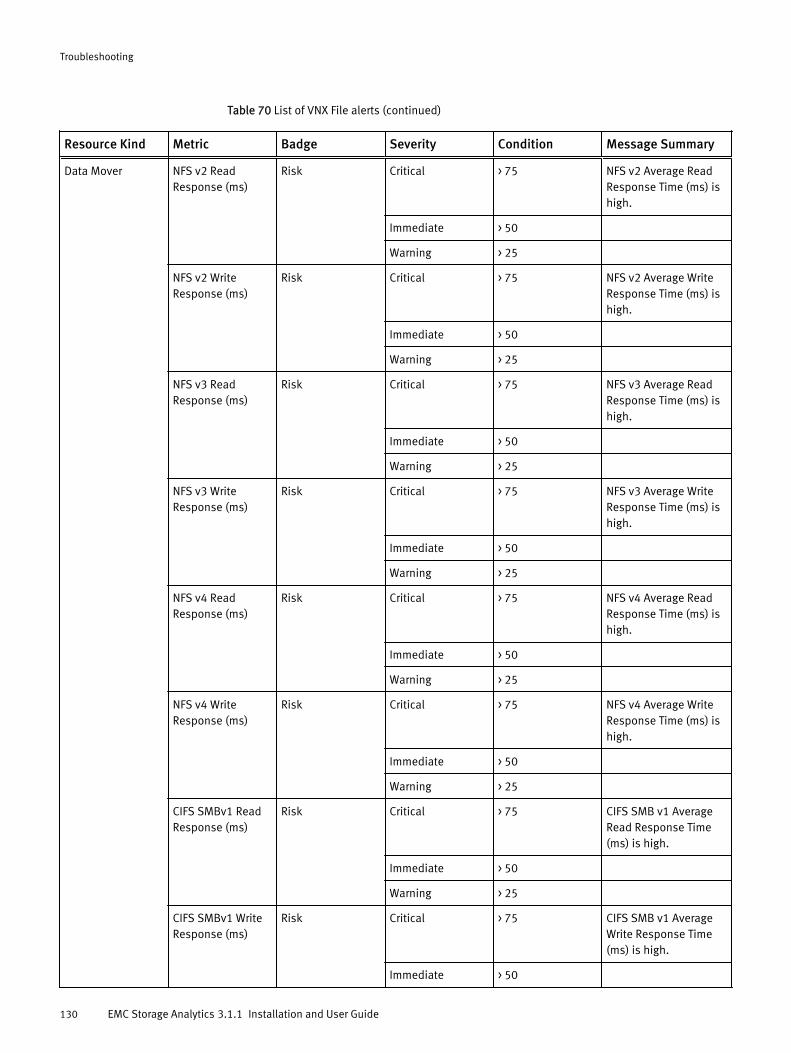
Table 70 List of VNX File alerts (continued)
Resource Kind Metric Badge Severity Condition Message Summary
Data Mover NFS v2 ReadResponse (ms)
Risk Critical > 75 NFS v2 Average ReadResponse Time (ms) ishigh.
Immediate > 50
Warning > 25
NFS v2 WriteResponse (ms)
Risk Critical > 75 NFS v2 Average WriteResponse Time (ms) ishigh.
Immediate > 50
Warning > 25
NFS v3 ReadResponse (ms)
Risk Critical > 75 NFS v3 Average ReadResponse Time (ms) ishigh.
Immediate > 50
Warning > 25
NFS v3 WriteResponse (ms)
Risk Critical > 75 NFS v3 Average WriteResponse Time (ms) ishigh.
Immediate > 50
Warning > 25
NFS v4 ReadResponse (ms)
Risk Critical > 75 NFS v4 Average ReadResponse Time (ms) ishigh.
Immediate > 50
Warning > 25
NFS v4 WriteResponse (ms)
Risk Critical > 75 NFS v4 Average WriteResponse Time (ms) ishigh.
Immediate > 50
Warning > 25
CIFS SMBv1 ReadResponse (ms)
Risk Critical > 75 CIFS SMB v1 AverageRead Response Time(ms) is high.
Immediate > 50
Warning > 25
CIFS SMBv1 WriteResponse (ms)
Risk Critical > 75 CIFS SMB v1 AverageWrite Response Time(ms) is high.
Immediate > 50
Troubleshooting
130 EMC Storage Analytics 3.1.1 Installation and User Guide
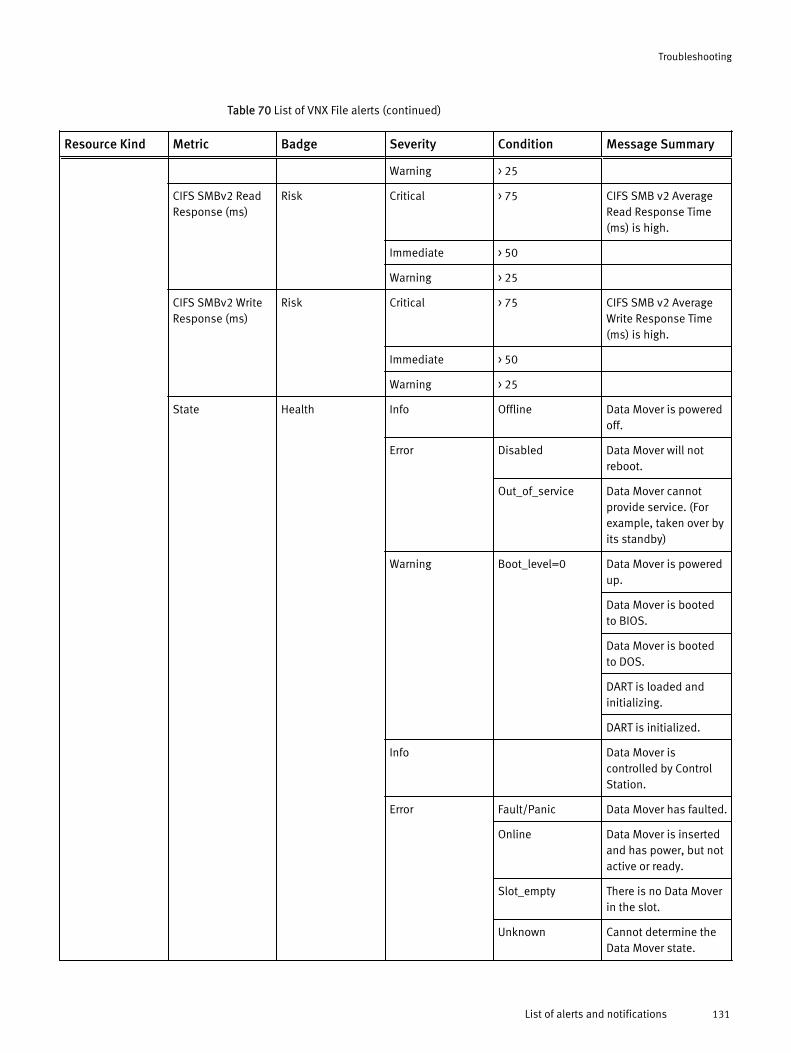
Table 70 List of VNX File alerts (continued)
Resource Kind Metric Badge Severity Condition Message Summary
Warning > 25
CIFS SMBv2 ReadResponse (ms)
Risk Critical > 75 CIFS SMB v2 AverageRead Response Time(ms) is high.
Immediate > 50
Warning > 25
CIFS SMBv2 WriteResponse (ms)
Risk Critical > 75 CIFS SMB v2 AverageWrite Response Time(ms) is high.
Immediate > 50
Warning > 25
State Health Info Offline Data Mover is poweredoff.
Error Disabled Data Mover will notreboot.
Out_of_service Data Mover cannotprovide service. (Forexample, taken over byits standby)
Warning Boot_level=0 Data Mover is poweredup.
Data Mover is bootedto BIOS.
Data Mover is bootedto DOS.
DART is loaded andinitializing.
DART is initialized.
Info Data Mover iscontrolled by ControlStation.
Error Fault/Panic Data Mover has faulted.
Online Data Mover is insertedand has power, but notactive or ready.
Slot_empty There is no Data Moverin the slot.
Unknown Cannot determine theData Mover state.
Troubleshooting
List of alerts and notifications 131
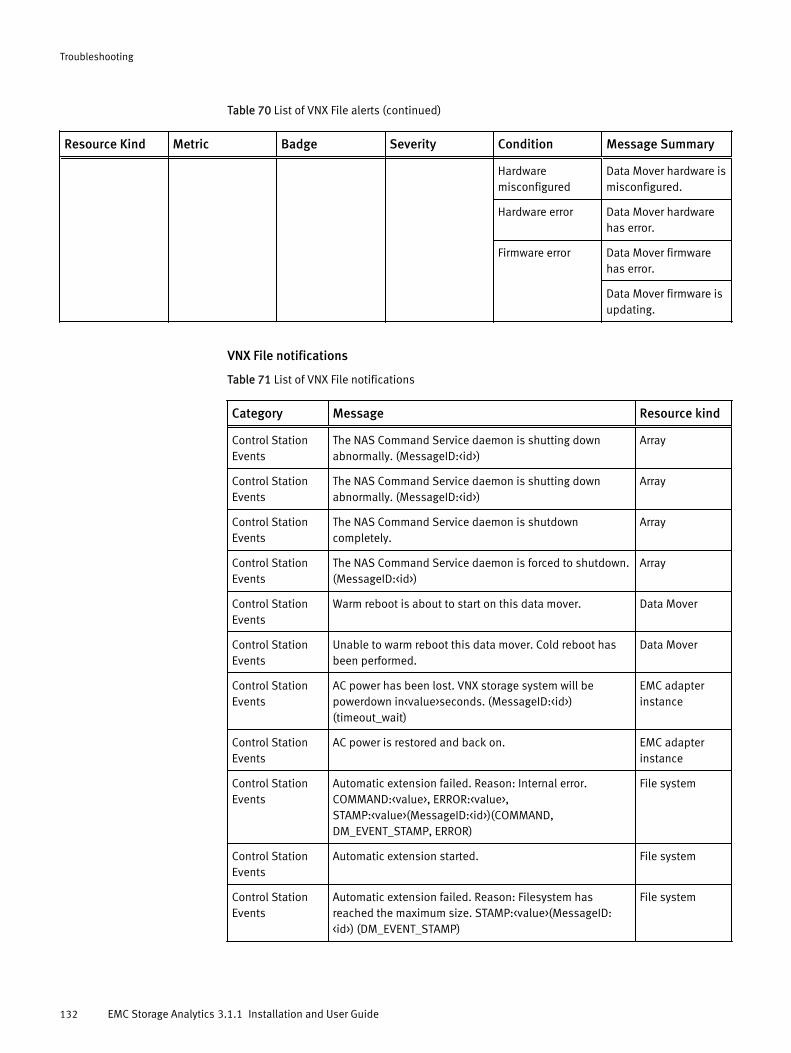
Table 70 List of VNX File alerts (continued)
Resource Kind Metric Badge Severity Condition Message Summary
Hardwaremisconfigured
Data Mover hardware ismisconfigured.
Hardware error Data Mover hardwarehas error.
Firmware error Data Mover firmwarehas error.
Data Mover firmware isupdating.
VNX File notifications
Table 71 List of VNX File notifications
Category Message Resource kind
Control StationEvents
The NAS Command Service daemon is shutting downabnormally. (MessageID:<id>)
Array
Control StationEvents
The NAS Command Service daemon is shutting downabnormally. (MessageID:<id>)
Array
Control StationEvents
The NAS Command Service daemon is shutdowncompletely.
Array
Control StationEvents
The NAS Command Service daemon is forced to shutdown.(MessageID:<id>)
Array
Control StationEvents
Warm reboot is about to start on this data mover. Data Mover
Control StationEvents
Unable to warm reboot this data mover. Cold reboot hasbeen performed.
Data Mover
Control StationEvents
AC power has been lost. VNX storage system will bepowerdown in<value>seconds. (MessageID:<id>)(timeout_wait)
EMC adapterinstance
Control StationEvents
AC power is restored and back on. EMC adapterinstance
Control StationEvents
Automatic extension failed. Reason: Internal error.COMMAND:<value>, ERROR:<value>,STAMP:<value>(MessageID:<id>)(COMMAND,DM_EVENT_STAMP, ERROR)
File system
Control StationEvents
Automatic extension started. File system
Control StationEvents
Automatic extension failed. Reason: Filesystem hasreached the maximum size. STAMP:<value>(MessageID:<id>) (DM_EVENT_STAMP)
File system
Troubleshooting
132 EMC Storage Analytics 3.1.1 Installation and User Guide
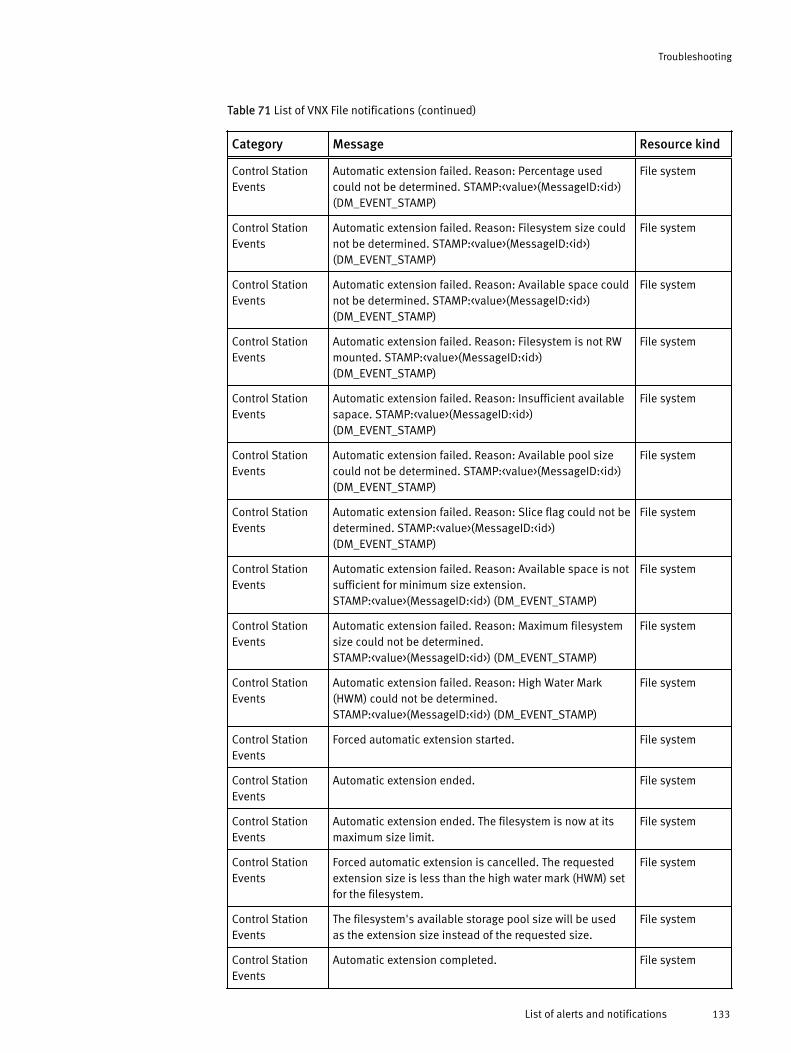
Table 71 List of VNX File notifications (continued)
Category Message Resource kind
Control StationEvents
Automatic extension failed. Reason: Percentage usedcould not be determined. STAMP:<value>(MessageID:<id>)(DM_EVENT_STAMP)
File system
Control StationEvents
Automatic extension failed. Reason: Filesystem size couldnot be determined. STAMP:<value>(MessageID:<id>)(DM_EVENT_STAMP)
File system
Control StationEvents
Automatic extension failed. Reason: Available space couldnot be determined. STAMP:<value>(MessageID:<id>)(DM_EVENT_STAMP)
File system
Control StationEvents
Automatic extension failed. Reason: Filesystem is not RWmounted. STAMP:<value>(MessageID:<id>)(DM_EVENT_STAMP)
File system
Control StationEvents
Automatic extension failed. Reason: Insufficient availablesapace. STAMP:<value>(MessageID:<id>)(DM_EVENT_STAMP)
File system
Control StationEvents
Automatic extension failed. Reason: Available pool sizecould not be determined. STAMP:<value>(MessageID:<id>)(DM_EVENT_STAMP)
File system
Control StationEvents
Automatic extension failed. Reason: Slice flag could not bedetermined. STAMP:<value>(MessageID:<id>)(DM_EVENT_STAMP)
File system
Control StationEvents
Automatic extension failed. Reason: Available space is notsufficient for minimum size extension.STAMP:<value>(MessageID:<id>) (DM_EVENT_STAMP)
File system
Control StationEvents
Automatic extension failed. Reason: Maximum filesystemsize could not be determined.STAMP:<value>(MessageID:<id>) (DM_EVENT_STAMP)
File system
Control StationEvents
Automatic extension failed. Reason: High Water Mark(HWM) could not be determined.STAMP:<value>(MessageID:<id>) (DM_EVENT_STAMP)
File system
Control StationEvents
Forced automatic extension started. File system
Control StationEvents
Automatic extension ended. File system
Control StationEvents
Automatic extension ended. The filesystem is now at itsmaximum size limit.
File system
Control StationEvents
Forced automatic extension is cancelled. The requestedextension size is less than the high water mark (HWM) setfor the filesystem.
File system
Control StationEvents
The filesystem's available storage pool size will be usedas the extension size instead of the requested size.
File system
Control StationEvents
Automatic extension completed. File system
Troubleshooting
List of alerts and notifications 133
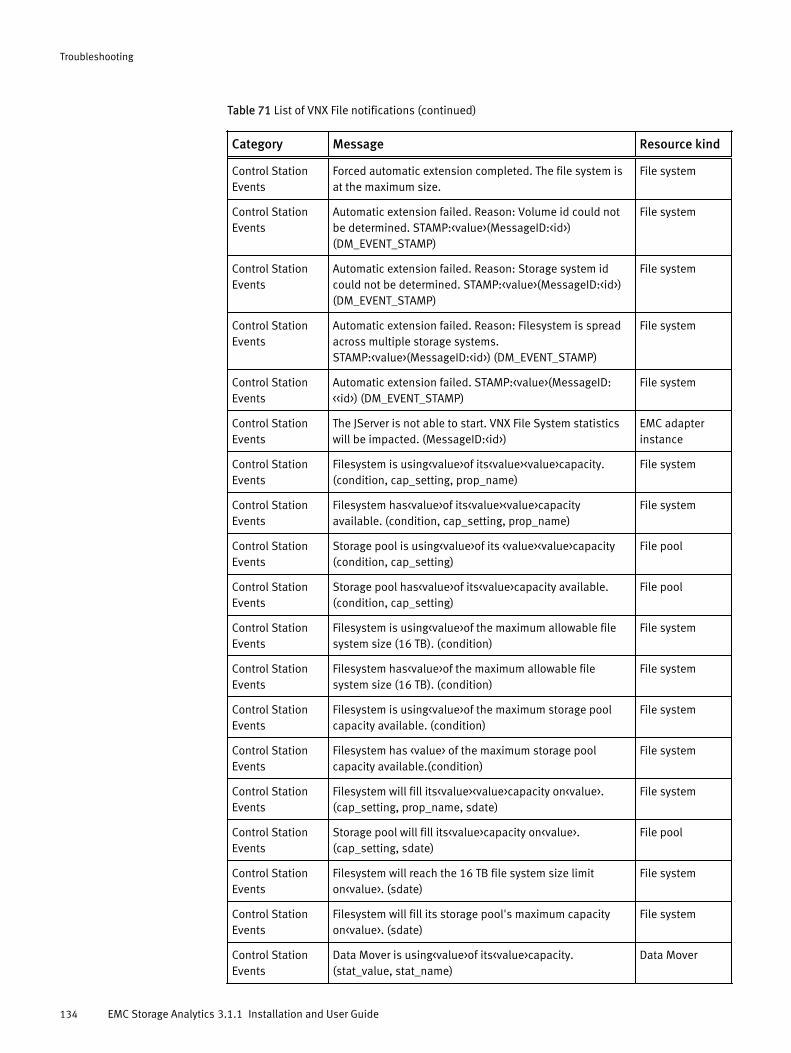
Table 71 List of VNX File notifications (continued)
Category Message Resource kind
Control StationEvents
Forced automatic extension completed. The file system isat the maximum size.
File system
Control StationEvents
Automatic extension failed. Reason: Volume id could notbe determined. STAMP:<value>(MessageID:<id>)(DM_EVENT_STAMP)
File system
Control StationEvents
Automatic extension failed. Reason: Storage system idcould not be determined. STAMP:<value>(MessageID:<id>)(DM_EVENT_STAMP)
File system
Control StationEvents
Automatic extension failed. Reason: Filesystem is spreadacross multiple storage systems.STAMP:<value>(MessageID:<id>) (DM_EVENT_STAMP)
File system
Control StationEvents
Automatic extension failed. STAMP:<value>(MessageID:<<id>) (DM_EVENT_STAMP)
File system
Control StationEvents
The JServer is not able to start. VNX File System statisticswill be impacted. (MessageID:<id>)
EMC adapterinstance
Control StationEvents
Filesystem is using<value>of its<value><value>capacity.(condition, cap_setting, prop_name)
File system
Control StationEvents
Filesystem has<value>of its<value><value>capacityavailable. (condition, cap_setting, prop_name)
File system
Control StationEvents
Storage pool is using<value>of its <value><value>capacity(condition, cap_setting)
File pool
Control StationEvents
Storage pool has<value>of its<value>capacity available.(condition, cap_setting)
File pool
Control StationEvents
Filesystem is using<value>of the maximum allowable filesystem size (16 TB). (condition)
File system
Control StationEvents
Filesystem has<value>of the maximum allowable filesystem size (16 TB). (condition)
File system
Control StationEvents
Filesystem is using<value>of the maximum storage poolcapacity available. (condition)
File system
Control StationEvents
Filesystem has <value> of the maximum storage poolcapacity available.(condition)
File system
Control StationEvents
Filesystem will fill its<value><value>capacity on<value>.(cap_setting, prop_name, sdate)
File system
Control StationEvents
Storage pool will fill its<value>capacity on<value>.(cap_setting, sdate)
File pool
Control StationEvents
Filesystem will reach the 16 TB file system size limiton<value>. (sdate)
File system
Control StationEvents
Filesystem will fill its storage pool's maximum capacityon<value>. (sdate)
File system
Control StationEvents
Data Mover is using<value>of its<value>capacity.(stat_value, stat_name)
Data Mover
Troubleshooting
134 EMC Storage Analytics 3.1.1 Installation and User Guide
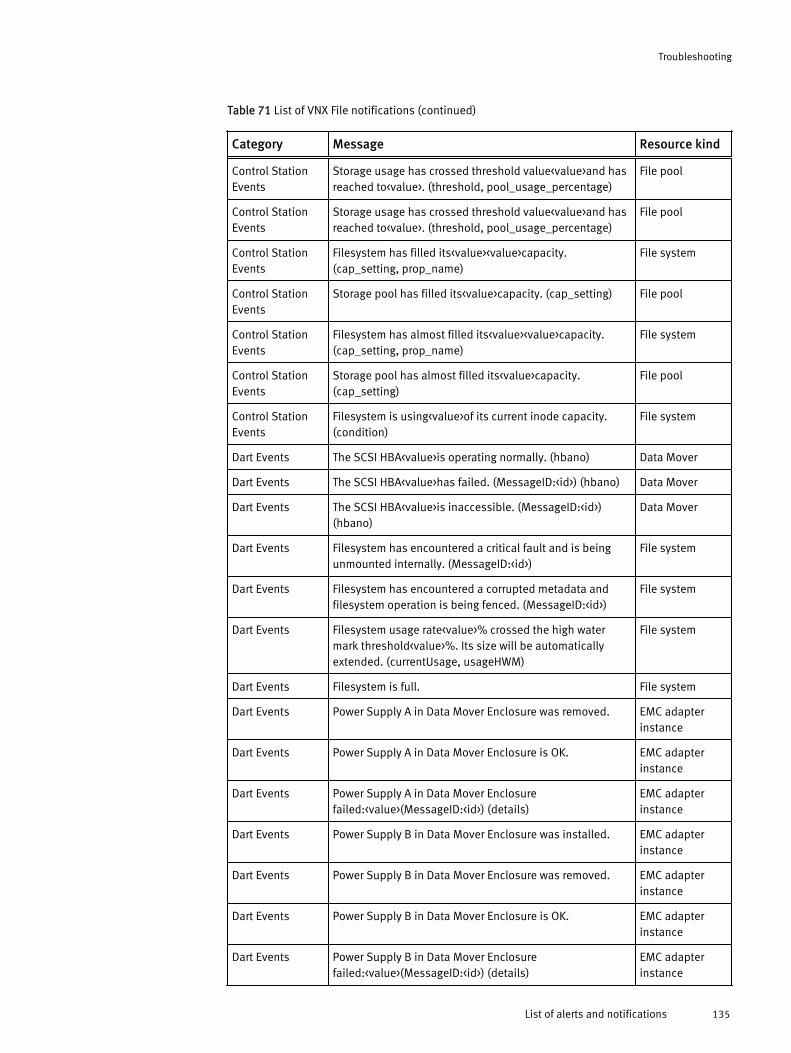
Table 71 List of VNX File notifications (continued)
Category Message Resource kind
Control StationEvents
Storage usage has crossed threshold value<value>and hasreached to<value>. (threshold, pool_usage_percentage)
File pool
Control StationEvents
Storage usage has crossed threshold value<value>and hasreached to<value>. (threshold, pool_usage_percentage)
File pool
Control StationEvents
Filesystem has filled its<value><value>capacity.(cap_setting, prop_name)
File system
Control StationEvents
Storage pool has filled its<value>capacity. (cap_setting) File pool
Control StationEvents
Filesystem has almost filled its<value><value>capacity.(cap_setting, prop_name)
File system
Control StationEvents
Storage pool has almost filled its<value>capacity.(cap_setting)
File pool
Control StationEvents
Filesystem is using<value>of its current inode capacity.(condition)
File system
Dart Events The SCSI HBA<value>is operating normally. (hbano) Data Mover
Dart Events The SCSI HBA<value>has failed. (MessageID:<id>) (hbano) Data Mover
Dart Events The SCSI HBA<value>is inaccessible. (MessageID:<id>)(hbano)
Data Mover
Dart Events Filesystem has encountered a critical fault and is beingunmounted internally. (MessageID:<id>)
File system
Dart Events Filesystem has encountered a corrupted metadata andfilesystem operation is being fenced. (MessageID:<id>)
File system
Dart Events Filesystem usage rate<value>% crossed the high watermark threshold<value>%. Its size will be automaticallyextended. (currentUsage, usageHWM)
File system
Dart Events Filesystem is full. File system
Dart Events Power Supply A in Data Mover Enclosure was removed. EMC adapterinstance
Dart Events Power Supply A in Data Mover Enclosure is OK. EMC adapterinstance
Dart Events Power Supply A in Data Mover Enclosurefailed:<value>(MessageID:<id>) (details)
EMC adapterinstance
Dart Events Power Supply B in Data Mover Enclosure was installed. EMC adapterinstance
Dart Events Power Supply B in Data Mover Enclosure was removed. EMC adapterinstance
Dart Events Power Supply B in Data Mover Enclosure is OK. EMC adapterinstance
Dart Events Power Supply B in Data Mover Enclosurefailed:<value>(MessageID:<id>) (details)
EMC adapterinstance
Troubleshooting
List of alerts and notifications 135
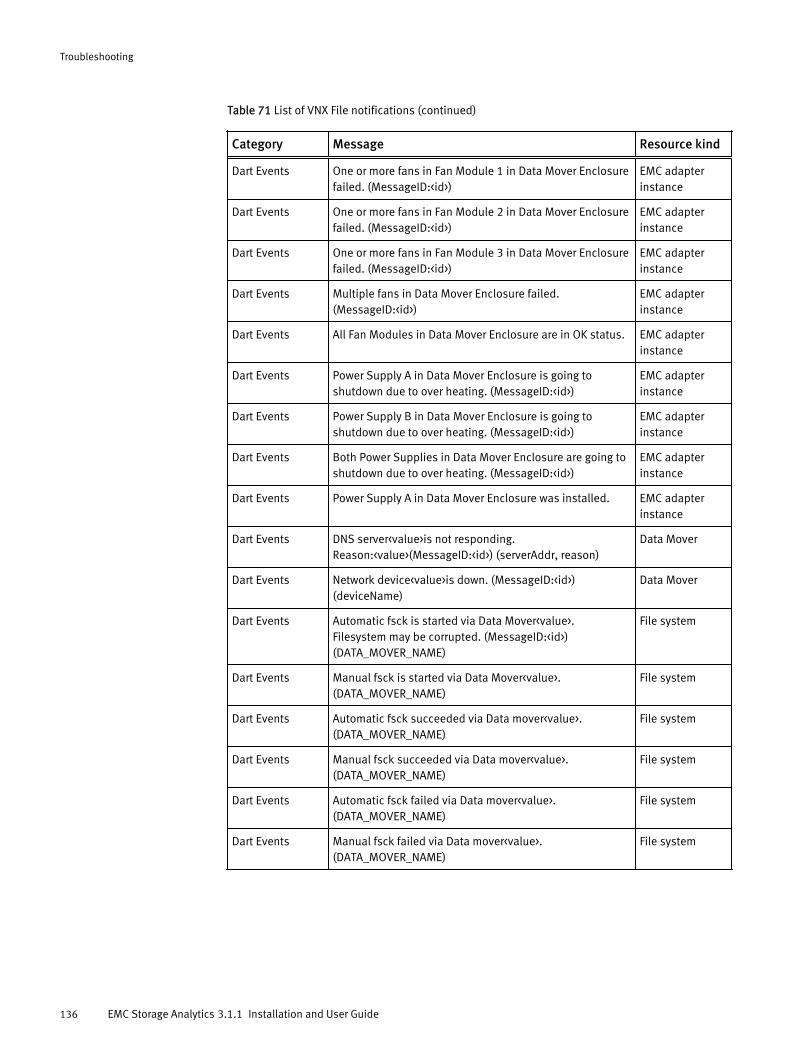
Table 71 List of VNX File notifications (continued)
Category Message Resource kind
Dart Events One or more fans in Fan Module 1 in Data Mover Enclosurefailed. (MessageID:<id>)
EMC adapterinstance
Dart Events One or more fans in Fan Module 2 in Data Mover Enclosurefailed. (MessageID:<id>)
EMC adapterinstance
Dart Events One or more fans in Fan Module 3 in Data Mover Enclosurefailed. (MessageID:<id>)
EMC adapterinstance
Dart Events Multiple fans in Data Mover Enclosure failed.(MessageID:<id>)
EMC adapterinstance
Dart Events All Fan Modules in Data Mover Enclosure are in OK status. EMC adapterinstance
Dart Events Power Supply A in Data Mover Enclosure is going toshutdown due to over heating. (MessageID:<id>)
EMC adapterinstance
Dart Events Power Supply B in Data Mover Enclosure is going toshutdown due to over heating. (MessageID:<id>)
EMC adapterinstance
Dart Events Both Power Supplies in Data Mover Enclosure are going toshutdown due to over heating. (MessageID:<id>)
EMC adapterinstance
Dart Events Power Supply A in Data Mover Enclosure was installed. EMC adapterinstance
Dart Events DNS server<value>is not responding.Reason:<value>(MessageID:<id>) (serverAddr, reason)
Data Mover
Dart Events Network device<value>is down. (MessageID:<id>)(deviceName)
Data Mover
Dart Events Automatic fsck is started via Data Mover<value>.Filesystem may be corrupted. (MessageID:<id>)(DATA_MOVER_NAME)
File system
Dart Events Manual fsck is started via Data Mover<value>.(DATA_MOVER_NAME)
File system
Dart Events Automatic fsck succeeded via Data mover<value>.(DATA_MOVER_NAME)
File system
Dart Events Manual fsck succeeded via Data mover<value>.(DATA_MOVER_NAME)
File system
Dart Events Automatic fsck failed via Data mover<value>.(DATA_MOVER_NAME)
File system
Dart Events Manual fsck failed via Data mover<value>.(DATA_MOVER_NAME)
File system
Troubleshooting
136 EMC Storage Analytics 3.1.1 Installation and User Guide
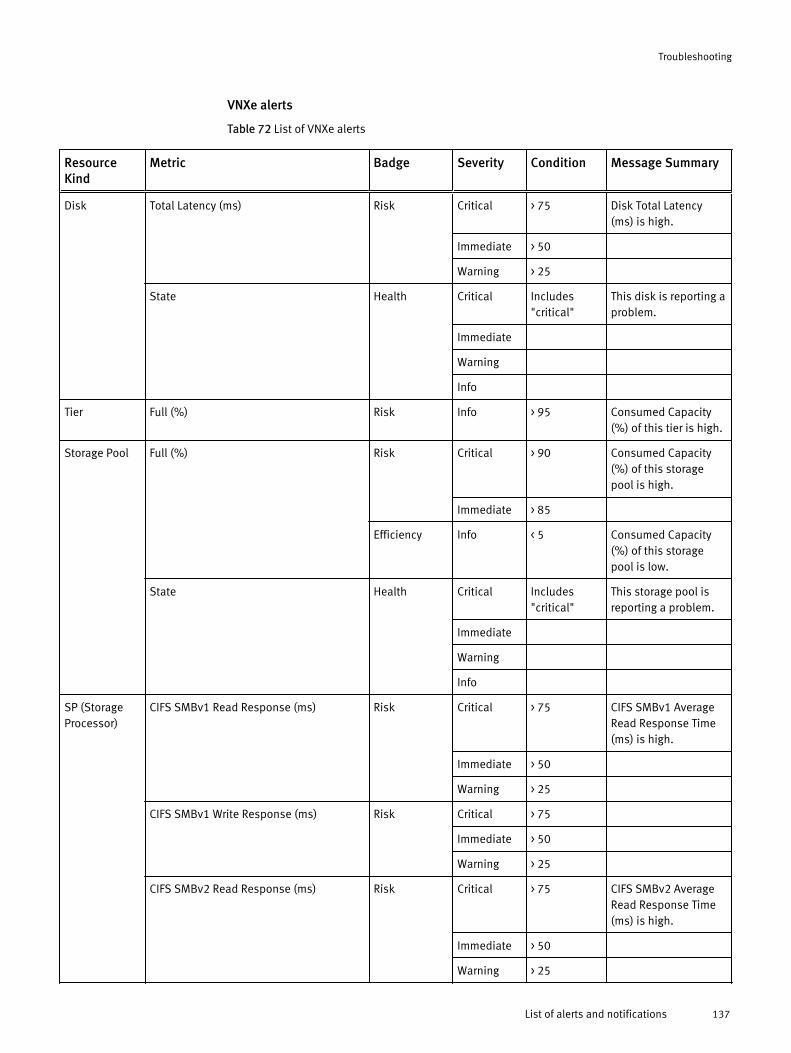
VNXe alerts
Table 72 List of VNXe alerts
ResourceKind
Metric Badge Severity Condition Message Summary
Disk Total Latency (ms) Risk Critical > 75 Disk Total Latency(ms) is high.
Immediate > 50
Warning > 25
State Health Critical Includes"critical"
This disk is reporting aproblem.
Immediate
Warning
Info
Tier Full (%) Risk Info > 95 Consumed Capacity(%) of this tier is high.
Storage Pool Full (%) Risk Critical > 90 Consumed Capacity(%) of this storagepool is high.
Immediate > 85
Efficiency Info < 5 Consumed Capacity(%) of this storagepool is low.
State Health Critical Includes"critical"
This storage pool isreporting a problem.
Immediate
Warning
Info
SP (StorageProcessor)
CIFS SMBv1 Read Response (ms) Risk Critical > 75 CIFS SMBv1 AverageRead Response Time(ms) is high.
Immediate > 50
Warning > 25
CIFS SMBv1 Write Response (ms) Risk Critical > 75
Immediate > 50
Warning > 25
CIFS SMBv2 Read Response (ms) Risk Critical > 75 CIFS SMBv2 AverageRead Response Time(ms) is high.
Immediate > 50
Warning > 25
Troubleshooting
List of alerts and notifications 137
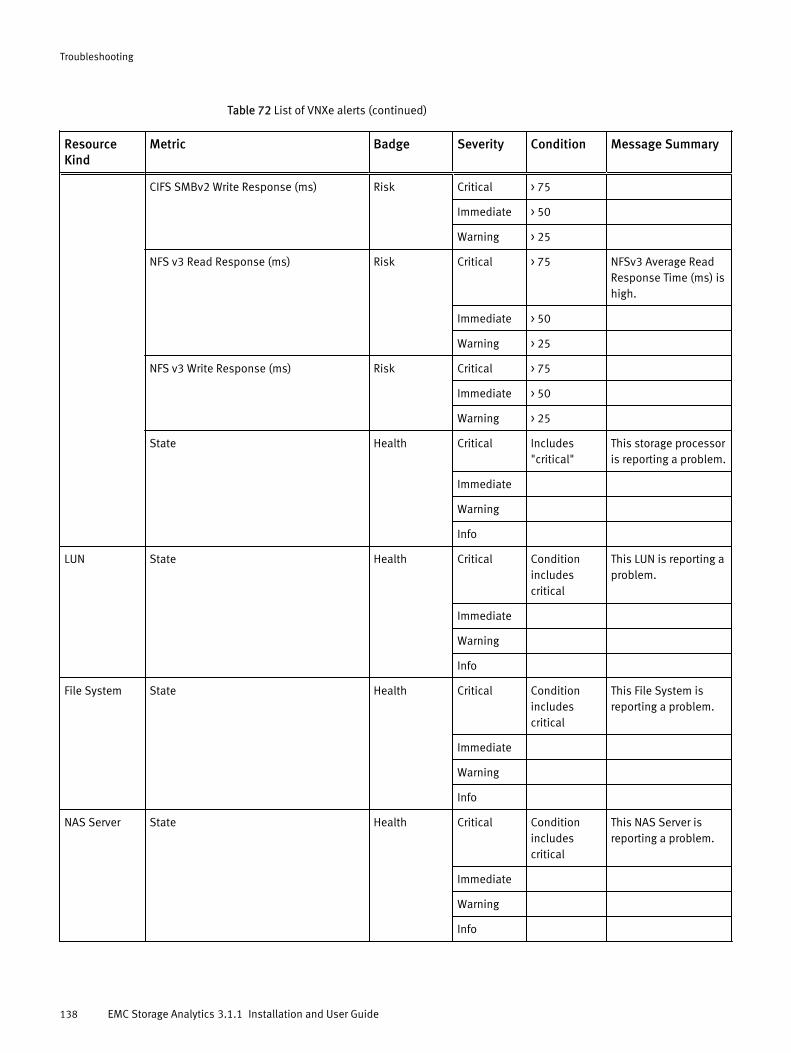
Table 72 List of VNXe alerts (continued)
ResourceKind
Metric Badge Severity Condition Message Summary
CIFS SMBv2 Write Response (ms) Risk Critical > 75
Immediate > 50
Warning > 25
NFS v3 Read Response (ms) Risk Critical > 75 NFSv3 Average ReadResponse Time (ms) ishigh.
Immediate > 50
Warning > 25
NFS v3 Write Response (ms) Risk Critical > 75
Immediate > 50
Warning > 25
State Health Critical Includes"critical"
This storage processoris reporting a problem.
Immediate
Warning
Info
LUN State Health Critical Conditionincludescritical
This LUN is reporting aproblem.
Immediate
Warning
Info
File System State Health Critical Conditionincludescritical
This File System isreporting a problem.
Immediate
Warning
Info
NAS Server State Health Critical Conditionincludescritical
This NAS Server isreporting a problem.
Immediate
Warning
Info
Troubleshooting
138 EMC Storage Analytics 3.1.1 Installation and User Guide
Launching UnisphereEMC Storage Analytics provides metrics that enable you to assess the health ofmonitored resources. If the resource metrics indicate that you need to troubleshoot thoseresources, EMC Storage Analytics provides a way to launch Unisphere on the array.
The capability to launch Unisphere on the array is available for:
l VNX Block
l VNX File
l VNXe
To launch Unisphere on the array, select the resource and click the Link and Launch icon.The Link and Launch icon is available on most widgets (hovering over an icon displays atooltip that describes its function).
Note
This feature requires a fresh installation of the EMC Adapter (not an upgrade) and vCenterOperations Manager 5.8.0 or later. You must select the object to launch Unisphere.Unisphere launch capability does not exist for VMAX or VPLEX objects.
Installation logsThis topic lists the log files to which errors in the EMC Storage Analytics installation arewritten.
Errors in the EMC Storage Analytics installation are written to log files in the followingdirectory in vRealize Operations Manager:
/var/log/emcLog files in this directory follow the naming convention:install-2012-12-11-10:54:19.log.
Use a text editor to view the installation log files.
Troubleshooting
Launching Unisphere 139
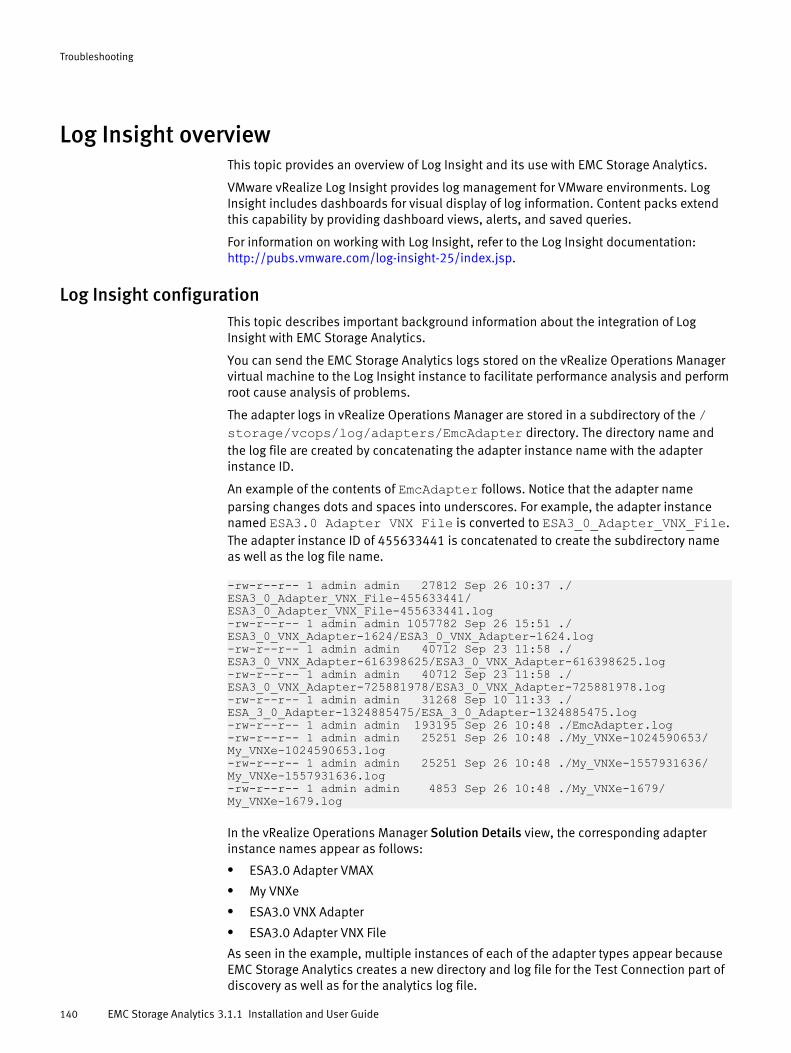
Log Insight overviewThis topic provides an overview of Log Insight and its use with EMC Storage Analytics.
VMware vRealize Log Insight provides log management for VMware environments. LogInsight includes dashboards for visual display of log information. Content packs extendthis capability by providing dashboard views, alerts, and saved queries.
For information on working with Log Insight, refer to the Log Insight documentation: http://pubs.vmware.com/log-insight-25/index.jsp.
Log Insight configurationThis topic describes important background information about the integration of LogInsight with EMC Storage Analytics.
You can send the EMC Storage Analytics logs stored on the vRealize Operations Managervirtual machine to the Log Insight instance to facilitate performance analysis and performroot cause analysis of problems.
The adapter logs in vRealize Operations Manager are stored in a subdirectory of the /storage/vcops/log/adapters/EmcAdapter directory. The directory name andthe log file are created by concatenating the adapter instance name with the adapterinstance ID.
An example of the contents of EmcAdapter follows. Notice that the adapter nameparsing changes dots and spaces into underscores. For example, the adapter instancenamed ESA3.0 Adapter VNX File is converted to ESA3_0_Adapter_VNX_File.The adapter instance ID of 455633441 is concatenated to create the subdirectory nameas well as the log file name.
-rw-r--r-- 1 admin admin 27812 Sep 26 10:37 ./ESA3_0_Adapter_VNX_File-455633441/ESA3_0_Adapter_VNX_File-455633441.log-rw-r--r-- 1 admin admin 1057782 Sep 26 15:51 ./ESA3_0_VNX_Adapter-1624/ESA3_0_VNX_Adapter-1624.log-rw-r--r-- 1 admin admin 40712 Sep 23 11:58 ./ESA3_0_VNX_Adapter-616398625/ESA3_0_VNX_Adapter-616398625.log-rw-r--r-- 1 admin admin 40712 Sep 23 11:58 ./ESA3_0_VNX_Adapter-725881978/ESA3_0_VNX_Adapter-725881978.log-rw-r--r-- 1 admin admin 31268 Sep 10 11:33 ./ESA_3_0_Adapter-1324885475/ESA_3_0_Adapter-1324885475.log-rw-r--r-- 1 admin admin 193195 Sep 26 10:48 ./EmcAdapter.log-rw-r--r-- 1 admin admin 25251 Sep 26 10:48 ./My_VNXe-1024590653/My_VNXe-1024590653.log-rw-r--r-- 1 admin admin 25251 Sep 26 10:48 ./My_VNXe-1557931636/My_VNXe-1557931636.log-rw-r--r-- 1 admin admin 4853 Sep 26 10:48 ./My_VNXe-1679/My_VNXe-1679.log
In the vRealize Operations Manager Solution Details view, the corresponding adapterinstance names appear as follows:
l ESA3.0 Adapter VMAXl My VNXel ESA3.0 VNX Adapterl ESA3.0 Adapter VNX File
As seen in the example, multiple instances of each of the adapter types appear becauseEMC Storage Analytics creates a new directory and log file for the Test Connection part ofdiscovery as well as for the analytics log file.
Troubleshooting
140 EMC Storage Analytics 3.1.1 Installation and User Guide
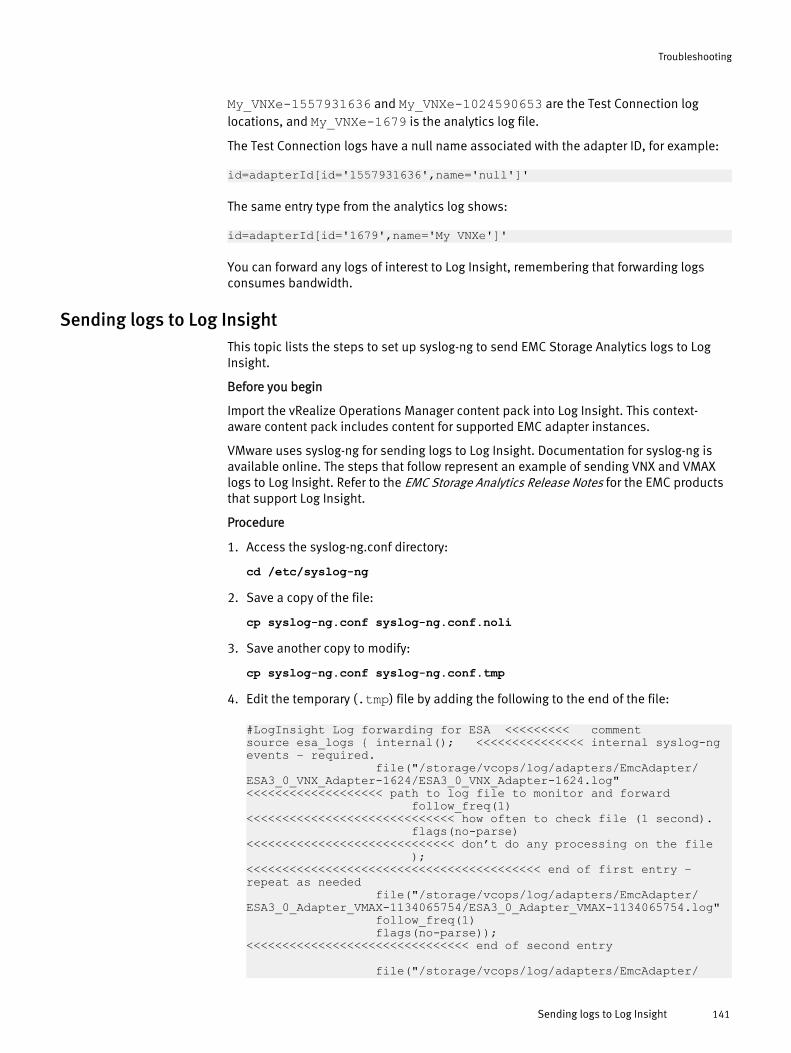
My_VNXe-1557931636 and My_VNXe-1024590653 are the Test Connection loglocations, and My_VNXe-1679 is the analytics log file.
The Test Connection logs have a null name associated with the adapter ID, for example:
id=adapterId[id='1557931636',name='null']'
The same entry type from the analytics log shows:
id=adapterId[id='1679',name='My VNXe']'
You can forward any logs of interest to Log Insight, remembering that forwarding logsconsumes bandwidth.
Sending logs to Log InsightThis topic lists the steps to set up syslog-ng to send EMC Storage Analytics logs to LogInsight.
Before you begin
Import the vRealize Operations Manager content pack into Log Insight. This context-aware content pack includes content for supported EMC adapter instances.
VMware uses syslog-ng for sending logs to Log Insight. Documentation for syslog-ng isavailable online. The steps that follow represent an example of sending VNX and VMAXlogs to Log Insight. Refer to the EMC Storage Analytics Release Notes for the EMC productsthat support Log Insight.
Procedure
1. Access the syslog-ng.conf directory:
cd /etc/syslog-ng
2. Save a copy of the file:
cp syslog-ng.conf syslog-ng.conf.noli
3. Save another copy to modify:
cp syslog-ng.conf syslog-ng.conf.tmp
4. Edit the temporary (.tmp) file by adding the following to the end of the file:
#LogInsight Log forwarding for ESA <<<<<<<<< commentsource esa_logs { internal(); <<<<<<<<<<<<<<< internal syslog-ng events – required. file("/storage/vcops/log/adapters/EmcAdapter/ESA3_0_VNX_Adapter-1624/ESA3_0_VNX_Adapter-1624.log" <<<<<<<<<<<<<<<<<<< path to log file to monitor and forward follow_freq(1) <<<<<<<<<<<<<<<<<<<<<<<<<<<<< how often to check file (1 second). flags(no-parse) <<<<<<<<<<<<<<<<<<<<<<<<<<<<< don’t do any processing on the file ); <<<<<<<<<<<<<<<<<<<<<<<<<<<<<<<<<<<<<<<<< end of first entry – repeat as needed file("/storage/vcops/log/adapters/EmcAdapter/ESA3_0_Adapter_VMAX-1134065754/ESA3_0_Adapter_VMAX-1134065754.log" follow_freq(1) flags(no-parse)); <<<<<<<<<<<<<<<<<<<<<<<<<<<<<<< end of second entry
file("/storage/vcops/log/adapters/EmcAdapter/
Troubleshooting
Sending logs to Log Insight 141
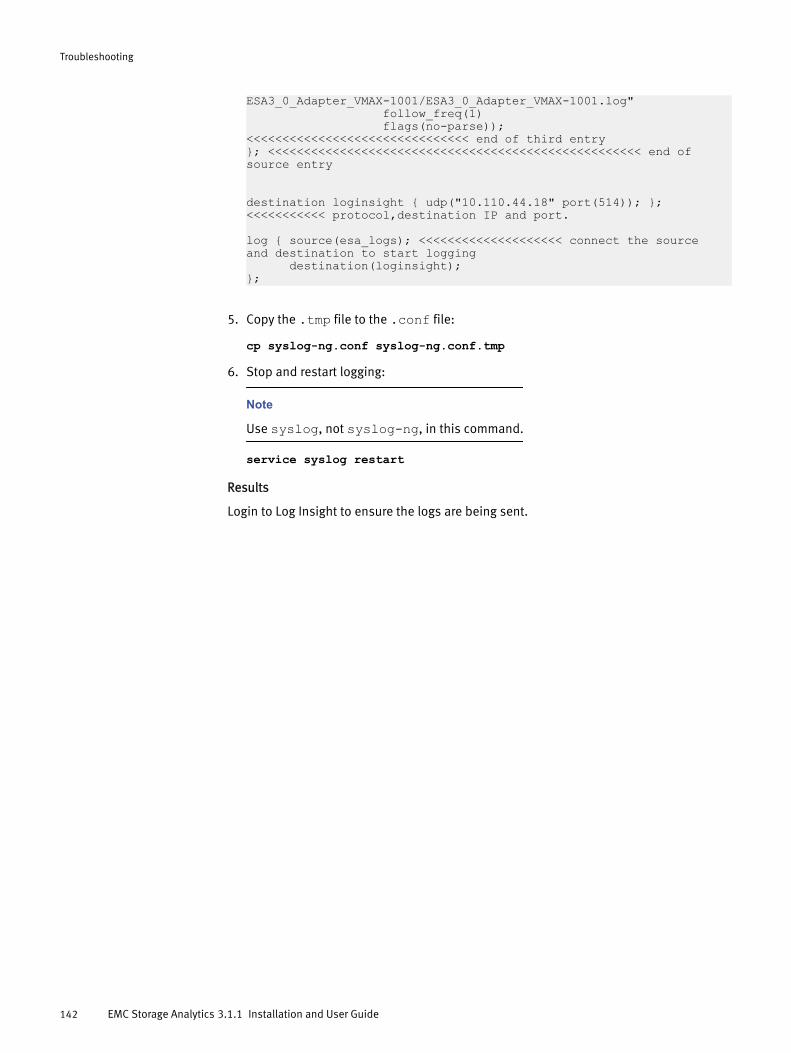
ESA3_0_Adapter_VMAX-1001/ESA3_0_Adapter_VMAX-1001.log" follow_freq(1) flags(no-parse)); <<<<<<<<<<<<<<<<<<<<<<<<<<<<<<< end of third entry}; <<<<<<<<<<<<<<<<<<<<<<<<<<<<<<<<<<<<<<<<<<<<<<<<<<<< end of source entry
destination loginsight { udp("10.110.44.18" port(514)); }; <<<<<<<<<<< protocol,destination IP and port.
log { source(esa_logs); <<<<<<<<<<<<<<<<<<<< connect the source and destination to start logging destination(loginsight);};
5. Copy the .tmp file to the .conf file:
cp syslog-ng.conf syslog-ng.conf.tmp
6. Stop and restart logging:
Note
Use syslog, not syslog-ng, in this command.
service syslog restart
Results
Login to Log Insight to ensure the logs are being sent.
Troubleshooting
142 EMC Storage Analytics 3.1.1 Installation and User Guide
Error handling and event loggingErrors in the EMC Storage Analytics operation are written to log files available throughvRealize Operations Manager.
Error logs are available in the /data/vcops/log directory. This directory contains thevRealize Operations Manager logs.
Adapter logs (including adapters other than the EMC Adapter) are in /data/vcops/log/adapters.
View logs relating to EMC Storage Analytics operation in the vRealize Operations ManagerGUI. Create and download a support bundle used for troubleshooting.
Viewing error logsEMC Storage Analytics enables you to view error log files for each adapter instance.
Procedure
1. Start the vRealize Operations Manager custom user interface and log in asadministrator.
For example in a web browser, type: http://<vROPs_ip_address>/vcops-web-ent2. Select Admin > Support. Select the Logs tab.
3. Expand the vCenter Operations Collector folder, then the adapter folder,then the EmcAdapter folder. Log files appear under the EmcAdapter folder.Double-click a log entry in the log tree.
Entries appear in the Log Content pane.
Creating and downloading a support bundleProcedure
1. On the Logs tab, click the Create Support Bundle icon.
The bundle encapsulates all necessary logs.
2. Select the bundle name and click the Download Bundle icon.
Troubleshooting
Error handling and event logging 143
Log file sizes and rollover countsThis topic describes the default log file size and rollover count for EMC adapter instances.
Logs for each EMC Adapter instance are in folders under /data/vcops/log/adapters/EmcAdapter, one folder for each adapter instance. For example, if youhave five EMC Adapter instances, a directory (folder) appears for each of them.
Log files in this directory follow this naming convention:
<EMC_adapter_name>-<adapter_instance_ID>.log.<rollover_count>For example: VNX_File-131.log.9The log filename begins with the name of the EMC Adapter instance. Filenames beginningwith EmcAdapter are common to all connectors.
The number that follows the EMC Adapter instance name is the adapter instance ID,which corresponds to a VMware internal ID.
The last number in the filename indicates the rollover increment. When the default log filesize is reached, the system starts a new log file with a new increment. The lowest-numbered increment represents the most recent log. Each rollover is 10 MB (defaultvalue, recommended). Ten rollovers (default value) are allowed; the system deletes theoldest log files.
Finding adapter instance IDsThis describes how to find the ID for an EMC adapter instance.
Procedure
1. In vRealize Operations Manager, select Administration > Environment > Adapter Types >EMC Adapter.
2. In the Internal ID column, you can view the IDs for adapter instances.
Configuring log file sizes and rollover countsThis topic describes how to change the default values for all adapter instances or for aspecific adapter instance.
Before you begin
CAUTION
EMC recommends that you not increase the 10 MB default value for the log file size.Increasing this value makes the log file more difficult to load and process as it grows insize. If more retention is necessary, increase the rollover count instead.
Procedure
1. On the vRealize Operations Manager virtual machine, find and edit theadaptor.properties file:
/usr/lib/vmware-vcops/user/plugins/inbound/emc-vcops-adapter/conf/adapter.properties
2. Locate these EMC adapter instance properties:
com.emc.vcops.adapter.log.size=10MBcom.emc.vcops.adapter.log.count=10
Troubleshooting
144 EMC Storage Analytics 3.1.1 Installation and User Guide
3. To change the properties for all EMC adapter instances, edit only the log size or logcount values. For example:
com.emc.vcops.adapter.log.size=12MBcom.emc.vcops.adapter.log.count=15
4. To change the properties for a specific EMC adapter instance, insert the EMC adapterinstance ID as shown in this example:
com.emc.vcops.adapter.356.log.size=8MBcom.emc.vcops.adapter.356.log.count=15
Activating configuration changesThis topic describes how to activate changes you made to the log file size or rollovercount for an EMC adapter instance.
Procedure
1. In vRealize Operations Manager, select Environment > Environment Overview.
2. In the navigation pane, expand Adapter Kinds, then select EMC Adapter.
3. In the List tab, select a resource from the list and click the Edit Resource icon.
The Resource Management window for the EMC adapter opens.
4. Click the OK button. No other changes are required.
This step activates the changes you made to the log file size or rollover count for theEMC adapter instance.
Verifying configuration changesThis topic describes how to verify the changes you made to the log file size or rollovercounts of an EMC adapter instance.
Procedure
1. Log into vRealize Operations Manager.
2. Change directories to /data/vcops/log/adapters/EmcAdapter.
3. Verify the changes you made to the size of the log files or the number of saved rolloverbackups.
If you changed:
l Only the default properties for log file size and rollover count, all adapter instancelogs will reflect the changes
l Properties for a specific adapter instance, only the logs for that adapter instancewill reflect the changes
l Log file size or rollover count to higher values, you will not notice the resultingchanges until those thresholds are crossed
Troubleshooting
Activating configuration changes 145
Editing the Collection Interval for a resourceFrom the vRealize Operations Manager user interface, you can edit the Collection Intervalfor a resource.
The interval time is five minutes by default. Changing this time will affect the frequency ofcollection times for metrics, but the EMC Adapter will only recognize the change if theresource is the EMC Adapter instance. This is normal vRealize Operations Managerbehavior.
Note
For VNXe, the maximum collection interval is five minutes.
Instructions on configuring Resource Management settings are provided in the vRealizeOperations Manager online help.
Configuring the thread count for an adapter instanceThis topic describes two ways to configure the thread count for an adapter instance.
Only administrative personnel should perform this procedure. Use this procedure tochange the thread count for best performance. If the thread count is not specified inadapter.properties, thread count = vCPU count +2. The maximum allowed threadcount is 20.
Procedure
1. Access the adapter.properties file. You can find this file at:
/usr/vmware-vcops/user/plugins/inbound/emc-vcops-adapter/conf/adapter.properties
2. Open and edit the thread count property for all adapter instances or for a specificadapter instance.
l If you want to edit the thread count property for all adapter instances, change thecom.emc.vcops.adapter.threadcount property.
l If you want to edit the thread count property for a specific adapter instance, insertthe adapter instance ID after adapter, for example:com.emc.vcops.adapter.7472.threadcount, and change the propertyvalue.
Note
To find an adapter instance ID, refer to Finding adapter instance IDs on page 144.
3. To activate the property change, restart the adapter instance in the vRealizeOperations Manager.
Troubleshooting
146 EMC Storage Analytics 3.1.1 Installation and User Guide
Connecting to vRealize Operations Manager by using SSHThis topic describes how to use SSH to login to vRealize Operations Manager as root.
Procedure
1. Open the VM console for the vRealize Operations Manager.
2. Press Alt-F1 to open the command prompt.
3. Enter root for the login and leave the password field blank.
You are prompted for a password.
4. Set the root password.
You will be logged in.
5. Use this command to enable SSH:
service sshd start
You will be able to successfully login as root by using SSH.
Troubleshooting
Connecting to vRealize Operations Manager by using SSH 147
Frequently Asked QuestionsHow many nodes are supported per vRealize Operations Manager cluster?vRealize Operations Manager clusters consist of a master node and data nodes. A total ofeight nodes are supported. The master node (required) and up to seven data nodes.
How many resources and metrics are supported per node in vRealize OperationsManager?
l Small Node - 4vCPU, 16GB Memory - Supports 2,000 objects and 1,000,000 metrics
l Medium Node - 8vCPU, 32GB Memory - Supports 6,000 objects and 3,000,000metrics
l Large Node - 16vCPU, 64GB Memory - Supports 10,000 objects and 5,000,000metrics
How does a trial license work?A 90-day trial license is provided for each platform that EMC Storage Analytics supports.The 90-day trial license provides the same features as a permanent license, but after 90days, the adapter stops collecting data. You can add a permanent license at any timeduring or after the trial period.
How do health scores work?Health scores measure how normal a resource is and grades it on a scale of 0-100. Ahealth score of 100 indicates normal behavior while a lower health score indicates thatthe resource is acting abnormally. The resource may not be in an unhealthy state butthere is an abnormality. Health scores are calculated by a proprietary algorithm whichaccount for several factors including thresholds and historical statistics. vRealizeOperations Manager may take up to 30 days to gather enough information to determinewhat is considered normal in your environment. Until then, you may not see any changesin your health scores.
I deleted a resource. Why does it still appear in the vRealize Operations Manager?vRealize Operations Manager will not delete any resources automatically because itretains historical statistics and topology information that may be important to the user.The resource enters an unknown state (blue). To remove the resource, delete it on theEnvironment Overview page.
What does the blue question mark in the health score indicate?The blue question mark indicates that vRealize Operations Manager was unable to pollthat resource. It will retry during the next polling interval.
What does it mean when a resource has a health score of 0?This indicates that the resource is either down or not available.
Why are my EMC Adapter instances marked down after upgrading to the latest version ofthe EMC Adapter?EMC Adapter instances require a license to operate. Edit your EMC Adapter instances toadd license keys obtained from EMC. Select Environment Overview > Configuration >Adapter Instances.
I have multiple EMC Adapter instances for my storage systems, and I have added licensekeys for each of them. Why are they still marked down?License keys are specific to the model for which the license was purchased. Verify thatyou are using the correct license key for the adapter instance. After adding a license, clickthe Test button to test the configuration and validate the license key. If you saved theconfiguration without performing a test and the license is invalid, the adapter instance
Troubleshooting
148 EMC Storage Analytics 3.1.1 Installation and User Guide

will be marked Resource down. To verify that a valid license exists, select EnvironmentOverview. The list that appears shows the license status.
How is the detailed view of vCenter resources affected in EMC Storage Analytics?Any changes in the disk system affects the health of vCenter resources such as virtualmachines, but EMC Storage Analytics does not show changes in other subsystems.Metrics for other subsystems will either show No Data or ?.
Can I see relationships between my vCenter and EMC storage resources?Yes. Relationships between resources are not affected and you can see a top to bottomview of the virtual and storage infrastructures if the two are connected.
How do I uninstall EMC Storage Analytics?No uninstall utility exists. However, to remove EMC Storage Analytics objects, removeadapter instances for which the Adapter Kind is EMC Adapter (Environment >
Configuration > Adapter Instances). Then delete objects in the Environment Overview forwhich the Data Source is EMC (Environment > Environment Overview).
If I test a connection and it fails, how do I know which field is wrong?Unfortunately, the only field that produces a unique message when it is wrong is thelicense number field. If any other field is wrong, the user is informed the connection wasnot successful. To resolve the issue, verify all the other fields are correct. Remove anywhite spaces after the end of the values.
Can I modify or delete a dashboard?Yes, the environment can be customized to suit the needs of the user. Rename thedashboard so that it is not overwritten during an upgrade.
Why do some of the boxes appear white in the Overview dashboard?While the metrics are being gathered for an adapter instance, some of the heat maps inthe dashboard may be white. This is normal. Another reason the boxes may appear whiteis that the adapter itself or an individual resource has been deleted, but the resourcesremain until they are removed from the Environment Overview page.
Which arrays does EMC Storage Analytics support?A complete list of the supported models for EMC storage arrays is available in the EMCStorage Analytics Release Notes.
Will EMC Storage Analytics continue to collect VNX statistics if the primary SP or CS goesdown?Storage Analytics will continue to collect statistics through the secondary StorageProcessor if the primary Storage Processor goes down. EMC Storage Analytics willautomatically collect metrics from the secondary Control Station in the event of a ControlStation failover. Note that the credentials on the secondary Control Station must matchthe credentials on the primary Control Station.
Does the Unisphere Analyzer for VNX need to be running to collect metrics?No. VNX Block metrics are gathered through naviseccli commands and VNX File metricsare gathered through CLI commands. However, statistics logging must be enabled oneach storage processor (SP) on VNX Block, and statistics logging will have a performanceimpact on the array. No additional services are required for VNX File.
How does the FAST Cache heat map work?The FAST Cache heatmaps are based on the FAST Cache read and write hit ratios. Thisheat map will turn red if these ratios are low because that indicates that FAST Cache isnot being utilized efficiently. These heat maps will turn green when FAST Cache isservicing a high percentage of I/O.
Troubleshooting
Frequently Asked Questions 149
I purchased a license for the model of the VNX array that I plan to monitor. When Iconfigure the adapter instance for VNX File, why does an "invalid license" error messageappear?Control Station may not be reporting the correct model or the array. Log into ControlStation and check the array model with the command: /nas/sbin/model. Verify that thearray model returned matches the model on the Right to Use certificate.
After a Control Station failover, why is the VNX File adapter instance marked down andwhy does metric collection stop?The failover may have been successful, but the new Control Station may not be reportingthe correct model of the array. This results in a failure to validate the license and all datacollection stops. Log into Control Station and check the array model with thecommand: /nas/sbin/model. If the model returned does not match the actual model ofthe array, Primus case emc261291 in the EMC Knowledgebase provides possiblesolutions.
The disk utilization metric is not visible for my VNX Block array. Why not?The disk utilization metric is not supported on VNX arrays running a VNX Block OE earlierthan Release 32. Upgrade to VNX Block OE Release 32 or later to see this metric invRealize Operations Manager.
I am unable to successfully configure an EMC Adapter instance for VNX File when using auser with read-only privileges. Why does this happen?A user with administrative privileges is required while configuring an EMC Adapterinstance for VNX File arrays running an OE earlier than 7.1.56.2. Upgrade to VNX File OE7.1.56.2 or later to be able to configure an adapter instance using a user with read-onlyprivileges.
The user LUNs on my VNX Block vault drives are not reporting performance metrics. Whynot?Performance metrics are not supported for user LUNs on vault drives. Place user LUNs ondrives other than vault drives.
Why is my VMAX array showing as red rather than blue (unknown) just after adding it?If the array is red, the SMI-S may be down or there may be an incorrect parameter in theadapter configuration. Return to the adapter instance configuration and test theconfigured instance. If it fails, verify all fields are correct. Determine if the SMI-S server isrunning and can recognize the VMAX array that you are configuring. If the license anduser credentials are correct but connection issues remain, see the EMC Storage AnalyticsRelease Notes.
All my configured VMAX adapter instances changed to red. Why?This usually happens when the EMC SMI-S Provider is unavailable or there is a clocksynchronization problem. This might be network-related or application-related. The EMCSMI-S Provider may have reached the connection limit if the network IP is available. Lookfor errors in the cimom.log file on the SMI-S box similar to:
26-Mar-2013 05:47:59.817 -900-E- WebServer: The webserver hits its connection limit, closing connection.
Follow the steps in the SMI-S Provider Release Notes to increase the count.
A message next to the array will indicate a clock synchronization problem if a problemexists.
Troubleshooting
150 EMC Storage Analytics 3.1.1 Installation and User Guide
I received the following error when I attempted to modify the VNX Overview dashboardalthough I have only VMAX arrays. Is this a problem?
Error occurred
An error occurred on the page; please contact support.Error Message: org.hibernate.exception.SQLGrammerException: could not execute query
No, this is a generic error that VMware produces when you attempt to modify acomponent you do not have.
Troubleshooting
Frequently Asked Questions 151

Troubleshooting
152 EMC Storage Analytics 3.1.1 Installation and User Guide