emea capital markets · 2019-01-02 · bloomberg emea capital markets | fy 2018 bloomberg league...
TRANSCRIPT

EMEA CAPITAL MARKETS LEAGUE TABLES FY 2018
The Bloomberg Capital Markets Tables represent the top arrangers, bookrunners and advisors across a broad array of deal types including loans, bonds, equity and M&A transactions; according to Bloomberg standards.
LEAG<GO> for a full range of league tables
MA<GO> for a full range of merger & acquisition tables
NI LEAG CRL<GO> or http://www.bloomberg.com/ for a full range of market-specific league table publications
Due to the dynamic nature of the Professional Service product, league table rankings may vary between this release and data found on the Bloomberg Professional Service.
MANAGER RANKINGS
EMEA CAPITAL MARKETS
DATA SUBMISSIONS AND QUERIES
Americas
EMEA
Asia-Pacific
Contact Email Phone
FY 2018
© 2018 Bloomberg Finance L.P. All rights reserved.
Paul Bandong +1 609 279 5187 [email protected]
Dimitris Gogos +44 20 3525 8149 [email protected]
Xin Yu Chen +65 6212 1123 [email protected]
Bloomberg EMEACapitalMarkets|FY2018
BloombergLeagueTableReports Page1
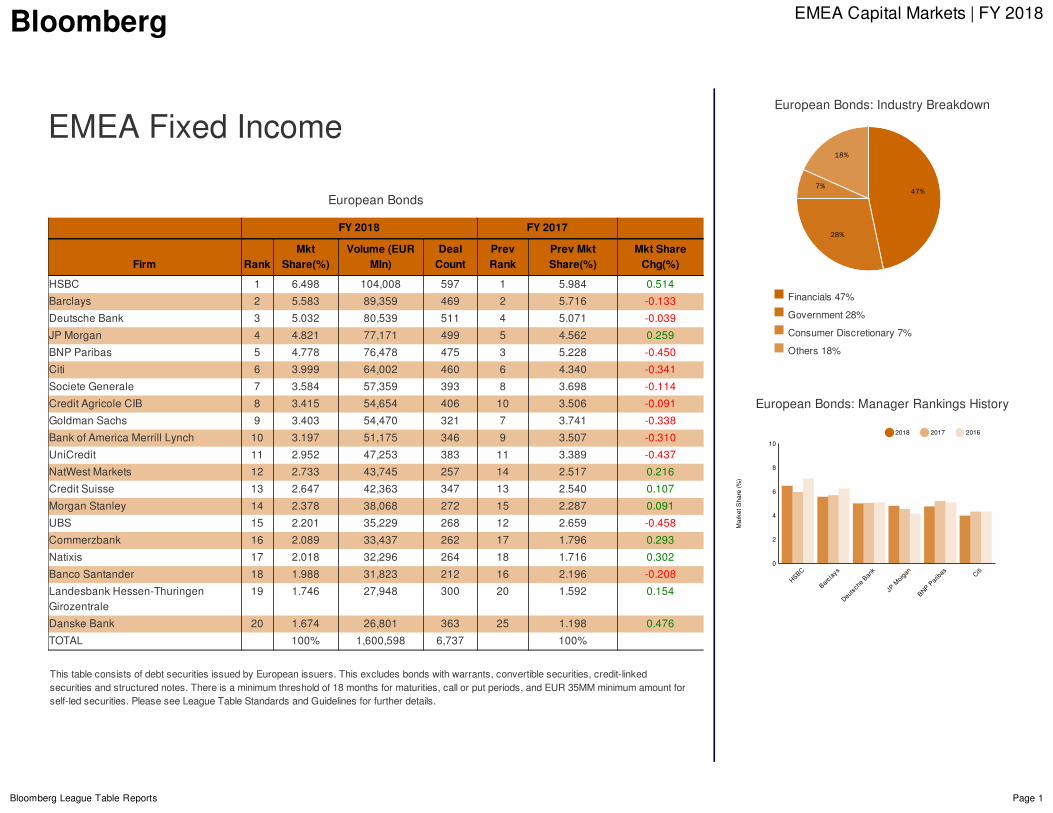
EMEAFixedIncome
EuropeanBonds
FY2018 FY2017
Firm RankMkt
Share(%)Volume(EUR
Mln)DealCount
PrevRank
PrevMktShare(%)
MktShareChg(%)
HSBC 1 6.498 104,008 597 1 5.984 0.514
Barclays 2 5.583 89,359 469 2 5.716 -0.133
DeutscheBank 3 5.032 80,539 511 4 5.071 -0.039
JPMorgan 4 4.821 77,171 499 5 4.562 0.259
BNPParibas 5 4.778 76,478 475 3 5.228 -0.450
Citi 6 3.999 64,002 460 6 4.340 -0.341
SocieteGenerale 7 3.584 57,359 393 8 3.698 -0.114
CreditAgricoleCIB 8 3.415 54,654 406 10 3.506 -0.091
GoldmanSachs 9 3.403 54,470 321 7 3.741 -0.338
BankofAmericaMerrillLynch 10 3.197 51,175 346 9 3.507 -0.310
UniCredit 11 2.952 47,253 383 11 3.389 -0.437
NatWestMarkets 12 2.733 43,745 257 14 2.517 0.216
CreditSuisse 13 2.647 42,363 347 13 2.540 0.107
MorganStanley 14 2.378 38,068 272 15 2.287 0.091
UBS 15 2.201 35,229 268 12 2.659 -0.458
Commerzbank 16 2.089 33,437 262 17 1.796 0.293
Natixis 17 2.018 32,296 264 18 1.716 0.302
BancoSantander 18 1.988 31,823 212 16 2.196 -0.208
LandesbankHessen-ThuringenGirozentrale
19 1.746 27,948 300 20 1.592 0.154
DanskeBank 20 1.674 26,801 363 25 1.198 0.476
TOTAL 100% 1,600,598 6,737 100%
ThistableconsistsofdebtsecuritiesissuedbyEuropeanissuers.Thisexcludesbondswithwarrants,convertiblesecurities,credit-linkedsecuritiesandstructurednotes.Thereisaminimumthresholdof18monthsformaturities,callorputperiods,andEUR35MMminimumamountforself-ledsecurities.PleaseseeLeagueTableStandardsandGuidelinesforfurtherdetails.
Financials47%
Government28%
ConsumerDiscretionary7%
Others18%
EuropeanBonds:ManagerRankingsHistory
EuropeanBonds:IndustryBreakdown
47%
28%
7%
18%
HSBC
Barclays
Deuts
cheB
ank
JPMorg
an
BNPParibas Ci
ti
2
4
6
8
Marke
tSha
re(%
)
0
10
2018 2017 2016
Bloomberg EMEACapitalMarkets|FY2018
BloombergLeagueTableReports Page2
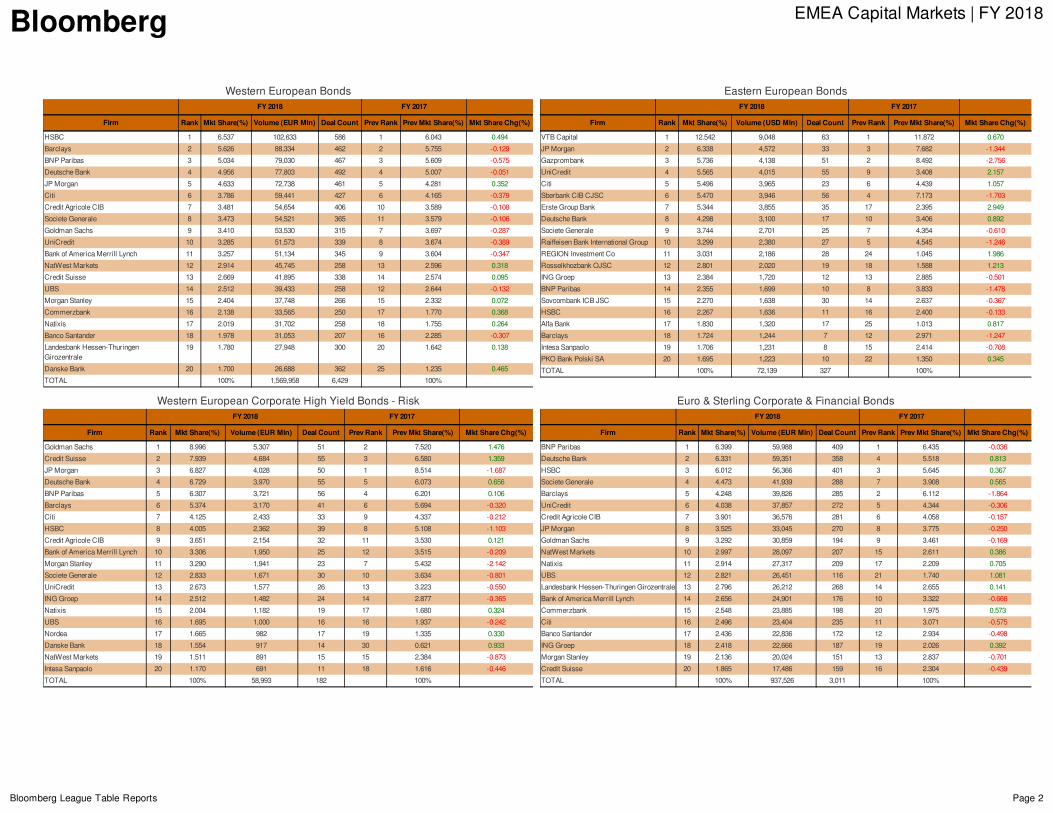
WesternEuropeanBondsFY2018 FY2017
Firm Rank MktShare(%) Volume(EURMln) DealCount PrevRank PrevMktShare(%) MktShareChg(%)
HSBC 1 6.537 102,633 586 1 6.043 0.494
Barclays 2 5.626 88,334 462 2 5.755 -0.129
BNPParibas 3 5.034 79,030 467 3 5.609 -0.575
DeutscheBank 4 4.956 77,803 492 4 5.007 -0.051
JPMorgan 5 4.633 72,738 461 5 4.281 0.352
Citi 6 3.786 59,441 427 6 4.165 -0.379
CreditAgricoleCIB 7 3.481 54,654 406 10 3.589 -0.108
SocieteGenerale 8 3.473 54,521 365 11 3.579 -0.106
GoldmanSachs 9 3.410 53,530 315 7 3.697 -0.287
UniCredit 10 3.285 51,573 339 8 3.674 -0.389
BankofAmericaMerrillLynch 11 3.257 51,134 345 9 3.604 -0.347
NatWestMarkets 12 2.914 45,745 258 13 2.596 0.318
CreditSuisse 13 2.669 41,895 338 14 2.574 0.095
UBS 14 2.512 39,433 258 12 2.644 -0.132
MorganStanley 15 2.404 37,748 266 15 2.332 0.072
Commerzbank 16 2.138 33,565 250 17 1.770 0.368
Natixis 17 2.019 31,702 258 18 1.755 0.264
BancoSantander 18 1.978 31,053 207 16 2.285 -0.307
LandesbankHessen-ThuringenGirozentrale
19 1.780 27,948 300 20 1.642 0.138
DanskeBank 20 1.700 26,688 362 25 1.235 0.465
TOTAL 100% 1,569,958 6,429 100%
EasternEuropeanBondsFY2018 FY2017
Firm Rank MktShare(%) Volume(USDMln) DealCount PrevRank PrevMktShare(%) MktShareChg(%)
VTBCapital 1 12.542 9,048 63 1 11.872 0.670
JPMorgan 2 6.338 4,572 33 3 7.682 -1.344
Gazprombank 3 5.736 4,138 51 2 8.492 -2.756
UniCredit 4 5.565 4,015 55 9 3.408 2.157
Citi 5 5.496 3,965 23 6 4.439 1.057
SberbankCIBCJSC 6 5.470 3,946 56 4 7.173 -1.703
ErsteGroupBank 7 5.344 3,855 35 17 2.395 2.949
DeutscheBank 8 4.298 3,100 17 10 3.406 0.892
SocieteGenerale 9 3.744 2,701 25 7 4.354 -0.610
RaiffeisenBankInternationalGroup 10 3.299 2,380 27 5 4.545 -1.246
REGIONInvestmentCo 11 3.031 2,186 28 24 1.045 1.986
RosselkhozbankOJSC 12 2.801 2,020 19 18 1.588 1.213
INGGroep 13 2.384 1,720 12 13 2.885 -0.501
BNPParibas 14 2.355 1,699 10 8 3.833 -1.478
SovcombankICBJSC 15 2.270 1,638 30 14 2.637 -0.367
HSBC 16 2.267 1,636 11 16 2.400 -0.133
AlfaBank 17 1.830 1,320 17 25 1.013 0.817
Barclays 18 1.724 1,244 7 12 2.971 -1.247
IntesaSanpaolo 19 1.706 1,231 8 15 2.414 -0.708
PKOBankPolskiSA 20 1.695 1,223 10 22 1.350 0.345
TOTAL 100% 72,139 327 100%
WesternEuropeanCorporateHighYieldBonds-RiskFY2018 FY2017
Firm Rank MktShare(%) Volume(EURMln) DealCount PrevRank PrevMktShare(%) MktShareChg(%)
GoldmanSachs 1 8.996 5,307 51 2 7.520 1.476
CreditSuisse 2 7.939 4,684 55 3 6.580 1.359
JPMorgan 3 6.827 4,028 50 1 8.514 -1.687
DeutscheBank 4 6.729 3,970 55 5 6.073 0.656
BNPParibas 5 6.307 3,721 56 4 6.201 0.106
Barclays 6 5.374 3,170 41 6 5.694 -0.320
Citi 7 4.125 2,433 33 9 4.337 -0.212
HSBC 8 4.005 2,362 39 8 5.108 -1.103
CreditAgricoleCIB 9 3.651 2,154 32 11 3.530 0.121
BankofAmericaMerrillLynch 10 3.306 1,950 25 12 3.515 -0.209
MorganStanley 11 3.290 1,941 23 7 5.432 -2.142
SocieteGenerale 12 2.833 1,671 30 10 3.634 -0.801
UniCredit 13 2.673 1,577 26 13 3.223 -0.550
INGGroep 14 2.512 1,482 24 14 2.877 -0.365
Natixis 15 2.004 1,182 19 17 1.680 0.324
UBS 16 1.695 1,000 16 16 1.937 -0.242
Nordea 17 1.665 982 17 19 1.335 0.330
DanskeBank 18 1.554 917 14 30 0.621 0.933
NatWestMarkets 19 1.511 891 15 15 2.384 -0.873
IntesaSanpaolo 20 1.170 691 11 18 1.616 -0.446
TOTAL 100% 58,993 182 100%
Euro&SterlingCorporate&FinancialBondsFY2018 FY2017
Firm Rank MktShare(%) Volume(EURMln) DealCount PrevRank PrevMktShare(%) MktShareChg(%)
BNPParibas 1 6.399 59,988 409 1 6.435 -0.036
DeutscheBank 2 6.331 59,351 358 4 5.518 0.813
HSBC 3 6.012 56,366 401 3 5.645 0.367
SocieteGenerale 4 4.473 41,939 288 7 3.908 0.565
Barclays 5 4.248 39,826 285 2 6.112 -1.864
UniCredit 6 4.038 37,857 272 5 4.344 -0.306
CreditAgricoleCIB 7 3.901 36,576 281 6 4.058 -0.157
JPMorgan 8 3.525 33,045 270 8 3.775 -0.250
GoldmanSachs 9 3.292 30,859 194 9 3.461 -0.169
NatWestMarkets 10 2.997 28,097 207 15 2.611 0.386
Natixis 11 2.914 27,317 209 17 2.209 0.705
UBS 12 2.821 26,451 116 21 1.740 1.081
LandesbankHessen-ThuringenGirozentrale 13 2.796 26,212 268 14 2.655 0.141
BankofAmericaMerrillLynch 14 2.656 24,901 176 10 3.322 -0.666
Commerzbank 15 2.548 23,885 198 20 1.975 0.573
Citi 16 2.496 23,404 235 11 3.071 -0.575
BancoSantander 17 2.436 22,836 172 12 2.934 -0.498
INGGroep 18 2.418 22,666 187 19 2.026 0.392
MorganStanley 19 2.136 20,024 151 13 2.837 -0.701
CreditSuisse 20 1.865 17,486 159 16 2.304 -0.439
TOTAL 100% 937,526 3,011 100%
Bloomberg EMEACapitalMarkets|FY2018
BloombergLeagueTableReports Page3
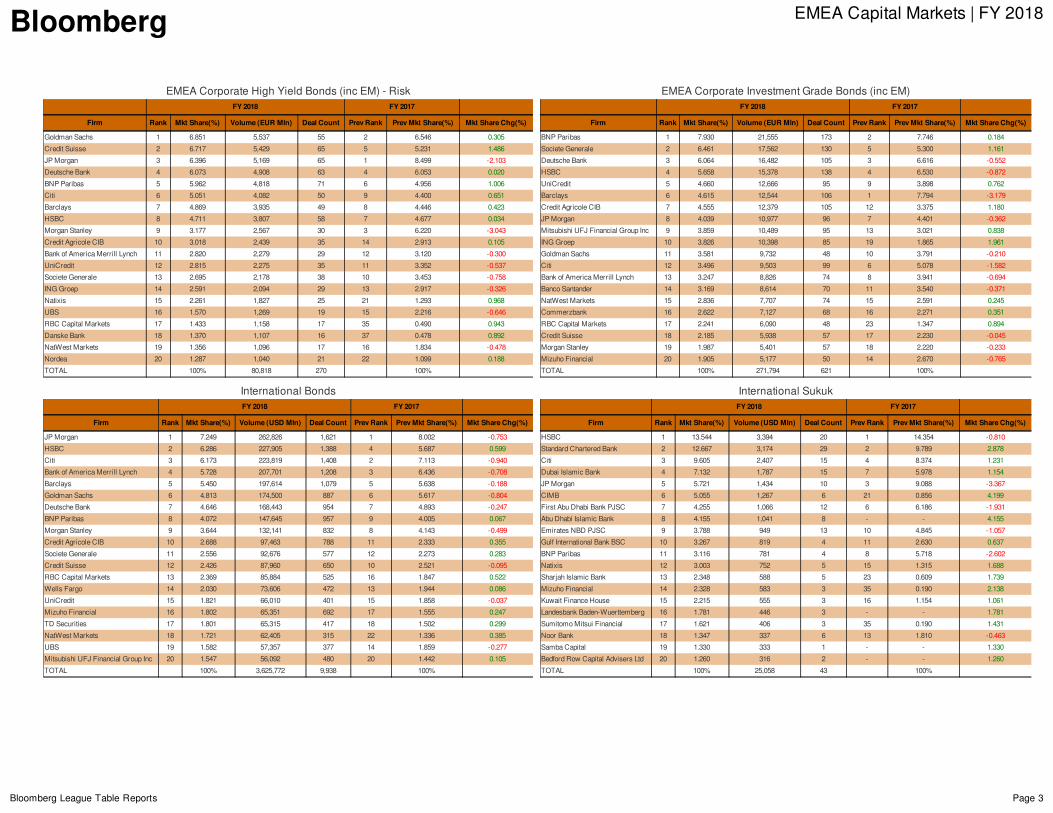
EMEACorporateHighYieldBonds(incEM)-RiskFY2018 FY2017
Firm Rank MktShare(%) Volume(EURMln) DealCount PrevRank PrevMktShare(%) MktShareChg(%)
GoldmanSachs 1 6.851 5,537 55 2 6.546 0.305
CreditSuisse 2 6.717 5,429 65 5 5.231 1.486
JPMorgan 3 6.396 5,169 65 1 8.499 -2.103
DeutscheBank 4 6.073 4,908 63 4 6.053 0.020
BNPParibas 5 5.962 4,818 71 6 4.956 1.006
Citi 6 5.051 4,082 50 9 4.400 0.651
Barclays 7 4.869 3,935 49 8 4.446 0.423
HSBC 8 4.711 3,807 58 7 4.677 0.034
MorganStanley 9 3.177 2,567 30 3 6.220 -3.043
CreditAgricoleCIB 10 3.018 2,439 35 14 2.913 0.105
BankofAmericaMerrillLynch 11 2.820 2,279 29 12 3.120 -0.300
UniCredit 12 2.815 2,275 35 11 3.352 -0.537
SocieteGenerale 13 2.695 2,178 38 10 3.453 -0.758
INGGroep 14 2.591 2,094 29 13 2.917 -0.326
Natixis 15 2.261 1,827 25 21 1.293 0.968
UBS 16 1.570 1,269 19 15 2.216 -0.646
RBCCapitalMarkets 17 1.433 1,158 17 35 0.490 0.943
DanskeBank 18 1.370 1,107 16 37 0.478 0.892
NatWestMarkets 19 1.356 1,096 17 16 1.834 -0.478
Nordea 20 1.287 1,040 21 22 1.099 0.188
TOTAL 100% 80,818 270 100%
EMEACorporateInvestmentGradeBonds(incEM)FY2018 FY2017
Firm Rank MktShare(%) Volume(EURMln) DealCount PrevRank PrevMktShare(%) MktShareChg(%)
BNPParibas 1 7.930 21,555 173 2 7.746 0.184
SocieteGenerale 2 6.461 17,562 130 5 5.300 1.161
DeutscheBank 3 6.064 16,482 105 3 6.616 -0.552
HSBC 4 5.658 15,378 138 4 6.530 -0.872
UniCredit 5 4.660 12,666 95 9 3.898 0.762
Barclays 6 4.615 12,544 106 1 7.794 -3.179
CreditAgricoleCIB 7 4.555 12,379 105 12 3.375 1.180
JPMorgan 8 4.039 10,977 96 7 4.401 -0.362
MitsubishiUFJFinancialGroupInc 9 3.859 10,489 95 13 3.021 0.838
INGGroep 10 3.826 10,398 85 19 1.865 1.961
GoldmanSachs 11 3.581 9,732 48 10 3.791 -0.210
Citi 12 3.496 9,503 99 6 5.078 -1.582
BankofAmericaMerrillLynch 13 3.247 8,826 74 8 3.941 -0.694
BancoSantander 14 3.169 8,614 70 11 3.540 -0.371
NatWestMarkets 15 2.836 7,707 74 15 2.591 0.245
Commerzbank 16 2.622 7,127 68 16 2.271 0.351
RBCCapitalMarkets 17 2.241 6,090 48 23 1.347 0.894
CreditSuisse 18 2.185 5,938 57 17 2.230 -0.045
MorganStanley 19 1.987 5,401 57 18 2.220 -0.233
MizuhoFinancial 20 1.905 5,177 50 14 2.670 -0.765
TOTAL 100% 271,794 621 100%
InternationalBondsFY2018 FY2017
Firm Rank MktShare(%) Volume(USDMln) DealCount PrevRank PrevMktShare(%) MktShareChg(%)
JPMorgan 1 7.249 262,826 1,621 1 8.002 -0.753
HSBC 2 6.286 227,905 1,388 4 5.687 0.599
Citi 3 6.173 223,819 1,408 2 7.113 -0.940
BankofAmericaMerrillLynch 4 5.728 207,701 1,208 3 6.436 -0.708
Barclays 5 5.450 197,614 1,079 5 5.638 -0.188
GoldmanSachs 6 4.813 174,500 887 6 5.617 -0.804
DeutscheBank 7 4.646 168,443 954 7 4.893 -0.247
BNPParibas 8 4.072 147,645 957 9 4.005 0.067
MorganStanley 9 3.644 132,141 832 8 4.143 -0.499
CreditAgricoleCIB 10 2.688 97,463 788 11 2.333 0.355
SocieteGenerale 11 2.556 92,676 577 12 2.273 0.283
CreditSuisse 12 2.426 87,960 650 10 2.521 -0.095
RBCCapitalMarkets 13 2.369 85,884 525 16 1.847 0.522
WellsFargo 14 2.030 73,606 472 13 1.944 0.086
UniCredit 15 1.821 66,010 401 15 1.858 -0.037
MizuhoFinancial 16 1.802 65,351 692 17 1.555 0.247
TDSecurities 17 1.801 65,315 417 18 1.502 0.299
NatWestMarkets 18 1.721 62,405 315 22 1.336 0.385
UBS 19 1.582 57,357 377 14 1.859 -0.277
MitsubishiUFJFinancialGroupInc 20 1.547 56,092 480 20 1.442 0.105
TOTAL 100% 3,625,772 9,938 100%
InternationalSukukFY2018 FY2017
Firm Rank MktShare(%) Volume(USDMln) DealCount PrevRank PrevMktShare(%) MktShareChg(%)
HSBC 1 13.544 3,394 20 1 14.354 -0.810
StandardCharteredBank 2 12.667 3,174 29 2 9.789 2.878
Citi 3 9.605 2,407 15 4 8.374 1.231
DubaiIslamicBank 4 7.132 1,787 15 7 5.978 1.154
JPMorgan 5 5.721 1,434 10 3 9.088 -3.367
CIMB 6 5.055 1,267 6 21 0.856 4.199
FirstAbuDhabiBankPJSC 7 4.255 1,066 12 6 6.186 -1.931
AbuDhabiIslamicBank 8 4.155 1,041 8 - - 4.155
EmiratesNBDPJSC 9 3.788 949 13 10 4.845 -1.057
GulfInternationalBankBSC 10 3.267 819 4 11 2.630 0.637
BNPParibas 11 3.116 781 4 8 5.718 -2.602
Natixis 12 3.003 752 5 15 1.315 1.688
SharjahIslamicBank 13 2.348 588 5 23 0.609 1.739
MizuhoFinancial 14 2.328 583 3 35 0.190 2.138
KuwaitFinanceHouse 15 2.215 555 3 16 1.154 1.061
LandesbankBaden-Wuerttemberg 16 1.781 446 3 - - 1.781
SumitomoMitsuiFinancial 17 1.621 406 3 35 0.190 1.431
NoorBank 18 1.347 337 6 13 1.810 -0.463
SambaCapital 19 1.330 333 1 - - 1.330
BedfordRowCapitalAdvisersLtd 20 1.260 316 2 - - 1.260
TOTAL 100% 25,058 43 100%
Bloomberg EMEACapitalMarkets|FY2018
BloombergLeagueTableReports Page4
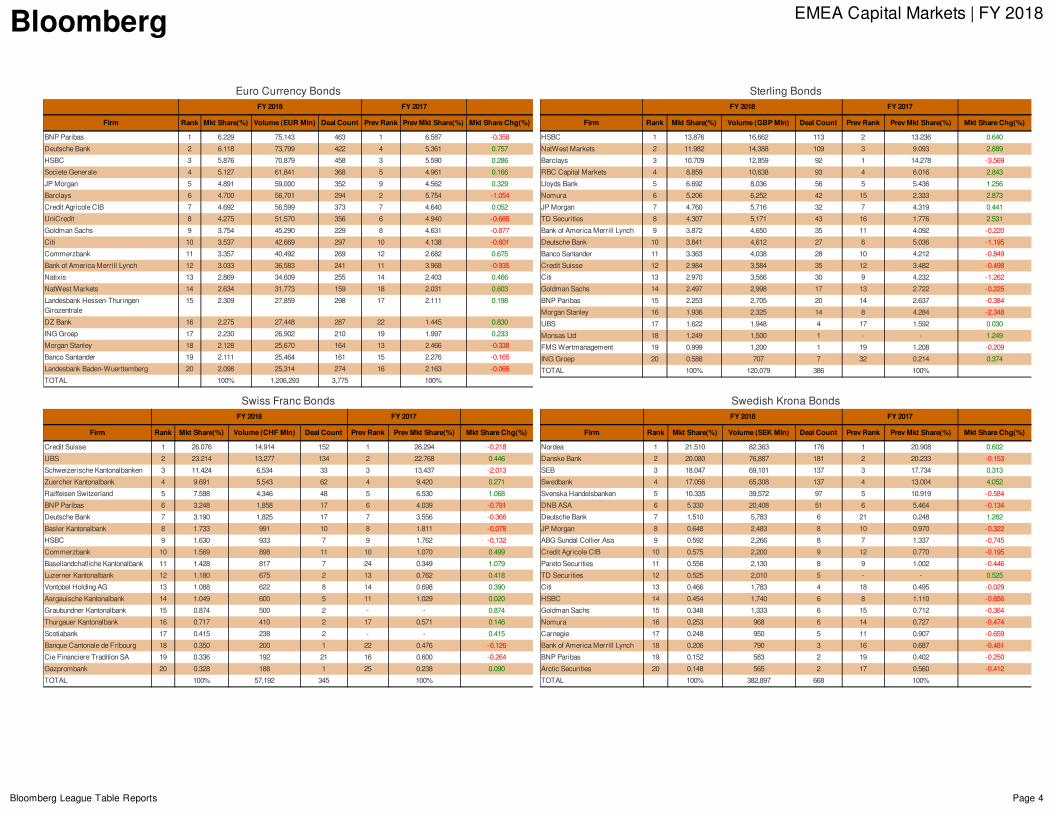
EuroCurrencyBondsFY2018 FY2017
Firm Rank MktShare(%) Volume(EURMln) DealCount PrevRank PrevMktShare(%) MktShareChg(%)
BNPParibas 1 6.229 75,143 463 1 6.587 -0.358
DeutscheBank 2 6.118 73,799 422 4 5.361 0.757
HSBC 3 5.876 70,879 458 3 5.590 0.286
SocieteGenerale 4 5.127 61,841 368 5 4.961 0.166
JPMorgan 5 4.891 59,000 352 9 4.562 0.329
Barclays 6 4.700 56,701 294 2 5.754 -1.054
CreditAgricoleCIB 7 4.692 56,599 373 7 4.640 0.052
UniCredit 8 4.275 51,570 356 6 4.940 -0.665
GoldmanSachs 9 3.754 45,290 229 8 4.631 -0.877
Citi 10 3.537 42,669 297 10 4.138 -0.601
Commerzbank 11 3.357 40,492 269 12 2.682 0.675
BankofAmericaMerrillLynch 12 3.033 36,583 241 11 3.968 -0.935
Natixis 13 2.869 34,609 255 14 2.403 0.466
NatWestMarkets 14 2.634 31,773 159 18 2.031 0.603
LandesbankHessen-ThuringenGirozentrale
15 2.309 27,859 298 17 2.111 0.198
DZBank 16 2.275 27,448 287 22 1.445 0.830
INGGroep 17 2.230 26,902 210 19 1.997 0.233
MorganStanley 18 2.128 25,670 164 13 2.466 -0.338
BancoSantander 19 2.111 25,464 161 15 2.276 -0.165
LandesbankBaden-Wuerttemberg 20 2.098 25,314 274 16 2.163 -0.065
TOTAL 100% 1,206,293 3,775 100%
SterlingBondsFY2018 FY2017
Firm Rank MktShare(%) Volume(GBPMln) DealCount PrevRank PrevMktShare(%) MktShareChg(%)
HSBC 1 13.876 16,662 113 2 13.236 0.640
NatWestMarkets 2 11.982 14,388 109 3 9.093 2.889
Barclays 3 10.709 12,859 92 1 14.278 -3.569
RBCCapitalMarkets 4 8.859 10,638 93 4 6.016 2.843
LloydsBank 5 6.692 8,036 56 5 5.436 1.256
Nomura 6 5.206 6,252 42 15 2.333 2.873
JPMorgan 7 4.760 5,716 32 7 4.319 0.441
TDSecurities 8 4.307 5,171 43 16 1.776 2.531
BankofAmericaMerrillLynch 9 3.872 4,650 35 11 4.092 -0.220
DeutscheBank 10 3.841 4,612 27 6 5.036 -1.195
BancoSantander 11 3.363 4,038 28 10 4.212 -0.849
CreditSuisse 12 2.984 3,584 35 12 3.482 -0.498
Citi 13 2.970 3,566 30 9 4.232 -1.262
GoldmanSachs 14 2.497 2,998 17 13 2.722 -0.225
BNPParibas 15 2.253 2,705 20 14 2.637 -0.384
MorganStanley 16 1.936 2,325 14 8 4.284 -2.348
UBS 17 1.622 1,948 4 17 1.592 0.030
MonsasLtd 18 1.249 1,500 1 - - 1.249
FMSWertmanagement 19 0.999 1,200 1 19 1.208 -0.209
INGGroep 20 0.588 707 7 32 0.214 0.374
TOTAL 100% 120,079 386 100%
SwissFrancBondsFY2018 FY2017
Firm Rank MktShare(%) Volume(CHFMln) DealCount PrevRank PrevMktShare(%) MktShareChg(%)
CreditSuisse 1 26.076 14,914 152 1 26.294 -0.218
UBS 2 23.214 13,277 134 2 22.768 0.446
SchweizerischeKantonalbanken 3 11.424 6,534 33 3 13.437 -2.013
ZuercherKantonalbank 4 9.691 5,543 62 4 9.420 0.271
RaiffeisenSwitzerland 5 7.598 4,346 48 5 6.530 1.068
BNPParibas 6 3.248 1,858 17 6 4.039 -0.791
DeutscheBank 7 3.190 1,825 17 7 3.556 -0.366
BaslerKantonalbank 8 1.733 991 10 8 1.811 -0.078
HSBC 9 1.630 933 7 9 1.762 -0.132
Commerzbank 10 1.569 898 11 10 1.070 0.499
BasellandchaflicheKantonalbank 11 1.428 817 7 24 0.349 1.079
LuzernerKantonalbank 12 1.180 675 2 13 0.762 0.418
VontobelHoldingAG 13 1.088 622 8 14 0.698 0.390
AargauischeKantonalbank 14 1.049 600 5 11 1.029 0.020
GraubundnerKantonalbank 15 0.874 500 2 - - 0.874
ThurgauerKantonalbank 16 0.717 410 2 17 0.571 0.146
Scotiabank 17 0.415 238 2 - - 0.415
BanqueCantonaledeFribourg 18 0.350 200 1 22 0.476 -0.126
CieFinanciereTraditionSA 19 0.336 192 21 16 0.600 -0.264
Gazprombank 20 0.328 188 1 25 0.238 0.090
TOTAL 100% 57,192 345 100%
SwedishKronaBondsFY2018 FY2017
Firm Rank MktShare(%) Volume(SEKMln) DealCount PrevRank PrevMktShare(%) MktShareChg(%)
Nordea 1 21.510 82,363 176 1 20.908 0.602
DanskeBank 2 20.080 76,887 181 2 20.233 -0.153
SEB 3 18.047 69,101 137 3 17.734 0.313
Swedbank 4 17.056 65,308 137 4 13.004 4.052
SvenskaHandelsbanken 5 10.335 39,572 97 5 10.919 -0.584
DNBASA 6 5.330 20,408 51 6 5.464 -0.134
DeutscheBank 7 1.510 5,783 6 21 0.248 1.262
JPMorgan 8 0.648 2,483 8 10 0.970 -0.322
ABGSundalCollierAsa 9 0.592 2,266 8 7 1.337 -0.745
CreditAgricoleCIB 10 0.575 2,200 9 12 0.770 -0.195
ParetoSecurities 11 0.556 2,130 8 9 1.002 -0.446
TDSecurities 12 0.525 2,010 5 - - 0.525
Citi 13 0.466 1,783 4 18 0.495 -0.029
HSBC 14 0.454 1,740 6 8 1.110 -0.656
GoldmanSachs 15 0.348 1,333 6 15 0.712 -0.364
Nomura 16 0.253 968 6 14 0.727 -0.474
Carnegie 17 0.248 950 5 11 0.907 -0.659
BankofAmericaMerrillLynch 18 0.206 790 3 16 0.687 -0.481
BNPParibas 19 0.152 583 2 19 0.402 -0.250
ArcticSecurities 20 0.148 565 2 17 0.560 -0.412
TOTAL 100% 382,897 668 100%
Bloomberg EMEACapitalMarkets|FY2018
BloombergLeagueTableReports Page5
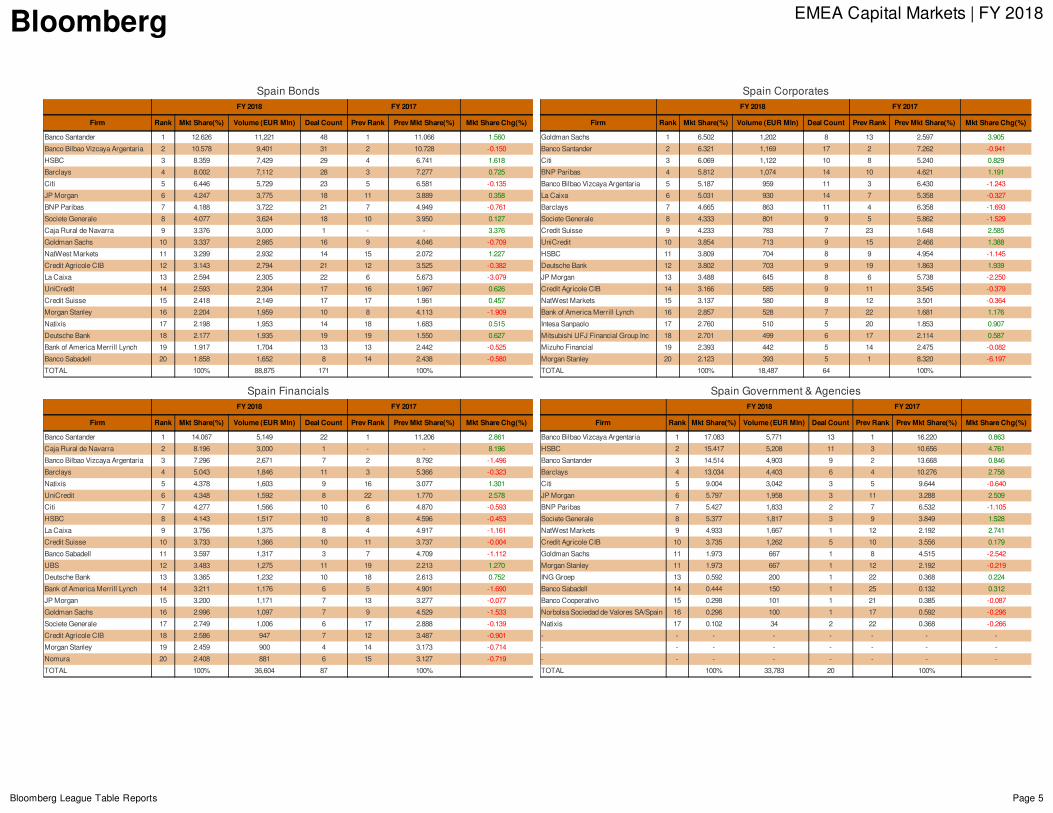
SpainBondsFY2018 FY2017
Firm Rank MktShare(%) Volume(EURMln) DealCount PrevRank PrevMktShare(%) MktShareChg(%)
BancoSantander 1 12.626 11,221 48 1 11.066 1.560
BancoBilbaoVizcayaArgentaria 2 10.578 9,401 31 2 10.728 -0.150
HSBC 3 8.359 7,429 29 4 6.741 1.618
Barclays 4 8.002 7,112 28 3 7.277 0.725
Citi 5 6.446 5,729 23 5 6.581 -0.135
JPMorgan 6 4.247 3,775 18 11 3.889 0.358
BNPParibas 7 4.188 3,722 21 7 4.949 -0.761
SocieteGenerale 8 4.077 3,624 18 10 3.950 0.127
CajaRuraldeNavarra 9 3.376 3,000 1 - - 3.376
GoldmanSachs 10 3.337 2,965 16 9 4.046 -0.709
NatWestMarkets 11 3.299 2,932 14 15 2.072 1.227
CreditAgricoleCIB 12 3.143 2,794 21 12 3.525 -0.382
LaCaixa 13 2.594 2,305 22 6 5.673 -3.079
UniCredit 14 2.593 2,304 17 16 1.967 0.626
CreditSuisse 15 2.418 2,149 17 17 1.961 0.457
MorganStanley 16 2.204 1,959 10 8 4.113 -1.909
Natixis 17 2.198 1,953 14 18 1.683 0.515
DeutscheBank 18 2.177 1,935 19 19 1.550 0.627
BankofAmericaMerrillLynch 19 1.917 1,704 13 13 2.442 -0.525
BancoSabadell 20 1.858 1,652 8 14 2.438 -0.580
TOTAL 100% 88,875 171 100%
SpainCorporatesFY2018 FY2017
Firm Rank MktShare(%) Volume(EURMln) DealCount PrevRank PrevMktShare(%) MktShareChg(%)
GoldmanSachs 1 6.502 1,202 8 13 2.597 3.905
BancoSantander 2 6.321 1,169 17 2 7.262 -0.941
Citi 3 6.069 1,122 10 8 5.240 0.829
BNPParibas 4 5.812 1,074 14 10 4.621 1.191
BancoBilbaoVizcayaArgentaria 5 5.187 959 11 3 6.430 -1.243
LaCaixa 6 5.031 930 14 7 5.358 -0.327
Barclays 7 4.665 863 11 4 6.358 -1.693
SocieteGenerale 8 4.333 801 9 5 5.862 -1.529
CreditSuisse 9 4.233 783 7 23 1.648 2.585
UniCredit 10 3.854 713 9 15 2.466 1.388
HSBC 11 3.809 704 8 9 4.954 -1.145
DeutscheBank 12 3.802 703 9 19 1.863 1.939
JPMorgan 13 3.488 645 8 6 5.738 -2.250
CreditAgricoleCIB 14 3.166 585 9 11 3.545 -0.379
NatWestMarkets 15 3.137 580 8 12 3.501 -0.364
BankofAmericaMerrillLynch 16 2.857 528 7 22 1.681 1.176
IntesaSanpaolo 17 2.760 510 5 20 1.853 0.907
MitsubishiUFJFinancialGroupInc 18 2.701 499 6 17 2.114 0.587
MizuhoFinancial 19 2.393 442 5 14 2.475 -0.082
MorganStanley 20 2.123 393 5 1 8.320 -6.197
TOTAL 100% 18,487 64 100%
SpainFinancialsFY2018 FY2017
Firm Rank MktShare(%) Volume(EURMln) DealCount PrevRank PrevMktShare(%) MktShareChg(%)
BancoSantander 1 14.067 5,149 22 1 11.206 2.861
CajaRuraldeNavarra 2 8.196 3,000 1 - - 8.196
BancoBilbaoVizcayaArgentaria 3 7.296 2,671 7 2 8.792 -1.496
Barclays 4 5.043 1,846 11 3 5.366 -0.323
Natixis 5 4.378 1,603 9 16 3.077 1.301
UniCredit 6 4.348 1,592 8 22 1.770 2.578
Citi 7 4.277 1,566 10 6 4.870 -0.593
HSBC 8 4.143 1,517 10 8 4.596 -0.453
LaCaixa 9 3.756 1,375 8 4 4.917 -1.161
CreditSuisse 10 3.733 1,366 10 11 3.737 -0.004
BancoSabadell 11 3.597 1,317 3 7 4.709 -1.112
UBS 12 3.483 1,275 11 19 2.213 1.270
DeutscheBank 13 3.365 1,232 10 18 2.613 0.752
BankofAmericaMerrillLynch 14 3.211 1,176 6 5 4.901 -1.690
JPMorgan 15 3.200 1,171 7 13 3.277 -0.077
GoldmanSachs 16 2.996 1,097 7 9 4.529 -1.533
SocieteGenerale 17 2.749 1,006 6 17 2.888 -0.139
CreditAgricoleCIB 18 2.586 947 7 12 3.487 -0.901
MorganStanley 19 2.459 900 4 14 3.173 -0.714
Nomura 20 2.408 881 6 15 3.127 -0.719
TOTAL 100% 36,604 87 100%
SpainGovernment&AgenciesFY2018 FY2017
Firm Rank MktShare(%) Volume(EURMln) DealCount PrevRank PrevMktShare(%) MktShareChg(%)
BancoBilbaoVizcayaArgentaria 1 17.083 5,771 13 1 16.220 0.863
HSBC 2 15.417 5,208 11 3 10.656 4.761
BancoSantander 3 14.514 4,903 9 2 13.668 0.846
Barclays 4 13.034 4,403 6 4 10.276 2.758
Citi 5 9.004 3,042 3 5 9.644 -0.640
JPMorgan 6 5.797 1,958 3 11 3.288 2.509
BNPParibas 7 5.427 1,833 2 7 6.532 -1.105
SocieteGenerale 8 5.377 1,817 3 9 3.849 1.528
NatWestMarkets 9 4.933 1,667 1 12 2.192 2.741
CreditAgricoleCIB 10 3.735 1,262 5 10 3.556 0.179
GoldmanSachs 11 1.973 667 1 8 4.515 -2.542
MorganStanley 11 1.973 667 1 12 2.192 -0.219
INGGroep 13 0.592 200 1 22 0.368 0.224
BancoSabadell 14 0.444 150 1 25 0.132 0.312
BancoCooperativo 15 0.298 101 1 21 0.385 -0.087
NorbolsaSociedaddeValoresSA/Spain 16 0.296 100 1 17 0.592 -0.296
Natixis 17 0.102 34 2 22 0.368 -0.266
- - - - - - - -
- - - - - - - -
- - - - - - - -
TOTAL 100% 33,783 20 100%
Bloomberg EMEACapitalMarkets|FY2018
BloombergLeagueTableReports Page6
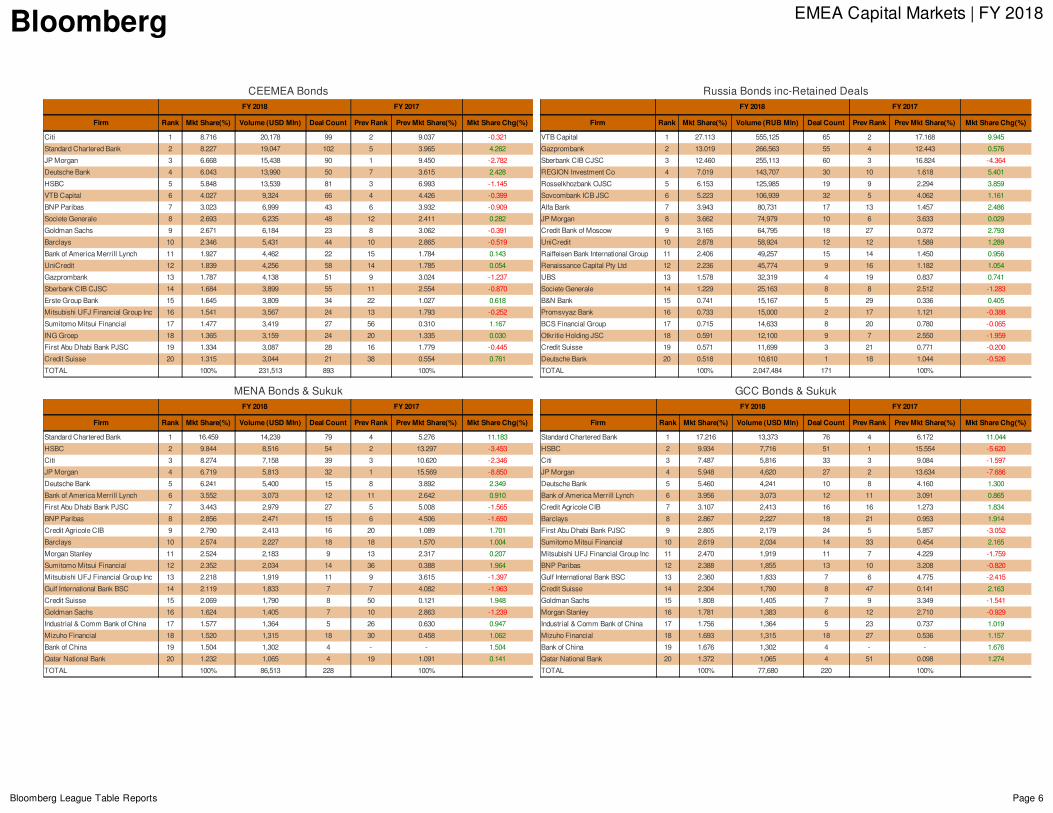
CEEMEABondsFY2018 FY2017
Firm Rank MktShare(%) Volume(USDMln) DealCount PrevRank PrevMktShare(%) MktShareChg(%)
Citi 1 8.716 20,178 99 2 9.037 -0.321
StandardCharteredBank 2 8.227 19,047 102 5 3.965 4.262
JPMorgan 3 6.668 15,438 90 1 9.450 -2.782
DeutscheBank 4 6.043 13,990 50 7 3.615 2.428
HSBC 5 5.848 13,539 81 3 6.993 -1.145
VTBCapital 6 4.027 9,324 66 4 4.426 -0.399
BNPParibas 7 3.023 6,999 43 6 3.932 -0.909
SocieteGenerale 8 2.693 6,235 48 12 2.411 0.282
GoldmanSachs 9 2.671 6,184 23 8 3.062 -0.391
Barclays 10 2.346 5,431 44 10 2.865 -0.519
BankofAmericaMerrillLynch 11 1.927 4,462 22 15 1.784 0.143
UniCredit 12 1.839 4,256 58 14 1.785 0.054
Gazprombank 13 1.787 4,138 51 9 3.024 -1.237
SberbankCIBCJSC 14 1.684 3,899 55 11 2.554 -0.870
ErsteGroupBank 15 1.645 3,809 34 22 1.027 0.618
MitsubishiUFJFinancialGroupInc 16 1.541 3,567 24 13 1.793 -0.252
SumitomoMitsuiFinancial 17 1.477 3,419 27 56 0.310 1.167
INGGroep 18 1.365 3,159 24 20 1.335 0.030
FirstAbuDhabiBankPJSC 19 1.334 3,087 28 16 1.779 -0.445
CreditSuisse 20 1.315 3,044 21 38 0.554 0.761
TOTAL 100% 231,513 893 100%
RussiaBondsinc-RetainedDealsFY2018 FY2017
Firm Rank MktShare(%) Volume(RUBMln) DealCount PrevRank PrevMktShare(%) MktShareChg(%)
VTBCapital 1 27.113 555,125 65 2 17.168 9.945
Gazprombank 2 13.019 266,563 55 4 12.443 0.576
SberbankCIBCJSC 3 12.460 255,113 60 3 16.824 -4.364
REGIONInvestmentCo 4 7.019 143,707 30 10 1.618 5.401
RosselkhozbankOJSC 5 6.153 125,985 19 9 2.294 3.859
SovcombankICBJSC 6 5.223 106,939 32 5 4.062 1.161
AlfaBank 7 3.943 80,731 17 13 1.457 2.486
JPMorgan 8 3.662 74,979 10 6 3.633 0.029
CreditBankofMoscow 9 3.165 64,795 18 27 0.372 2.793
UniCredit 10 2.878 58,924 12 12 1.589 1.289
RaiffeisenBankInternationalGroup 11 2.406 49,257 15 14 1.450 0.956
RenaissanceCapitalPtyLtd 12 2.236 45,774 9 16 1.182 1.054
UBS 13 1.578 32,319 4 19 0.837 0.741
SocieteGenerale 14 1.229 25,163 8 8 2.512 -1.283
B&NBank 15 0.741 15,167 5 29 0.336 0.405
PromsvyazBank 16 0.733 15,000 2 17 1.121 -0.388
BCSFinancialGroup 17 0.715 14,633 8 20 0.780 -0.065
OtkritieHoldingJSC 18 0.591 12,100 9 7 2.550 -1.959
CreditSuisse 19 0.571 11,699 3 21 0.771 -0.200
DeutscheBank 20 0.518 10,610 1 18 1.044 -0.526
TOTAL 100% 2,047,484 171 100%
MENABonds&SukukFY2018 FY2017
Firm Rank MktShare(%) Volume(USDMln) DealCount PrevRank PrevMktShare(%) MktShareChg(%)
StandardCharteredBank 1 16.459 14,239 79 4 5.276 11.183
HSBC 2 9.844 8,516 54 2 13.297 -3.453
Citi 3 8.274 7,158 39 3 10.620 -2.346
JPMorgan 4 6.719 5,813 32 1 15.569 -8.850
DeutscheBank 5 6.241 5,400 15 8 3.892 2.349
BankofAmericaMerrillLynch 6 3.552 3,073 12 11 2.642 0.910
FirstAbuDhabiBankPJSC 7 3.443 2,979 27 5 5.008 -1.565
BNPParibas 8 2.856 2,471 15 6 4.506 -1.650
CreditAgricoleCIB 9 2.790 2,413 16 20 1.089 1.701
Barclays 10 2.574 2,227 18 18 1.570 1.004
MorganStanley 11 2.524 2,183 9 13 2.317 0.207
SumitomoMitsuiFinancial 12 2.352 2,034 14 36 0.388 1.964
MitsubishiUFJFinancialGroupInc 13 2.218 1,919 11 9 3.615 -1.397
GulfInternationalBankBSC 14 2.119 1,833 7 7 4.082 -1.963
CreditSuisse 15 2.069 1,790 8 50 0.121 1.948
GoldmanSachs 16 1.624 1,405 7 10 2.863 -1.239
Industrial&CommBankofChina 17 1.577 1,364 5 26 0.630 0.947
MizuhoFinancial 18 1.520 1,315 18 30 0.458 1.062
BankofChina 19 1.504 1,302 4 - - 1.504
QatarNationalBank 20 1.232 1,065 4 19 1.091 0.141
TOTAL 100% 86,513 228 100%
GCCBonds&SukukFY2018 FY2017
Firm Rank MktShare(%) Volume(USDMln) DealCount PrevRank PrevMktShare(%) MktShareChg(%)
StandardCharteredBank 1 17.216 13,373 76 4 6.172 11.044
HSBC 2 9.934 7,716 51 1 15.554 -5.620
Citi 3 7.487 5,816 33 3 9.084 -1.597
JPMorgan 4 5.948 4,620 27 2 13.634 -7.686
DeutscheBank 5 5.460 4,241 10 8 4.160 1.300
BankofAmericaMerrillLynch 6 3.956 3,073 12 11 3.091 0.865
CreditAgricoleCIB 7 3.107 2,413 16 16 1.273 1.834
Barclays 8 2.867 2,227 18 21 0.953 1.914
FirstAbuDhabiBankPJSC 9 2.805 2,179 24 5 5.857 -3.052
SumitomoMitsuiFinancial 10 2.619 2,034 14 33 0.454 2.165
MitsubishiUFJFinancialGroupInc 11 2.470 1,919 11 7 4.229 -1.759
BNPParibas 12 2.388 1,855 13 10 3.208 -0.820
GulfInternationalBankBSC 13 2.360 1,833 7 6 4.775 -2.415
CreditSuisse 14 2.304 1,790 8 47 0.141 2.163
GoldmanSachs 15 1.808 1,405 7 9 3.349 -1.541
MorganStanley 16 1.781 1,383 6 12 2.710 -0.929
Industrial&CommBankofChina 17 1.756 1,364 5 23 0.737 1.019
MizuhoFinancial 18 1.693 1,315 18 27 0.536 1.157
BankofChina 19 1.676 1,302 4 - - 1.676
QatarNationalBank 20 1.372 1,065 4 51 0.098 1.274
TOTAL 100% 77,680 220 100%
Bloomberg EMEACapitalMarkets|FY2018
BloombergLeagueTableReports Page7
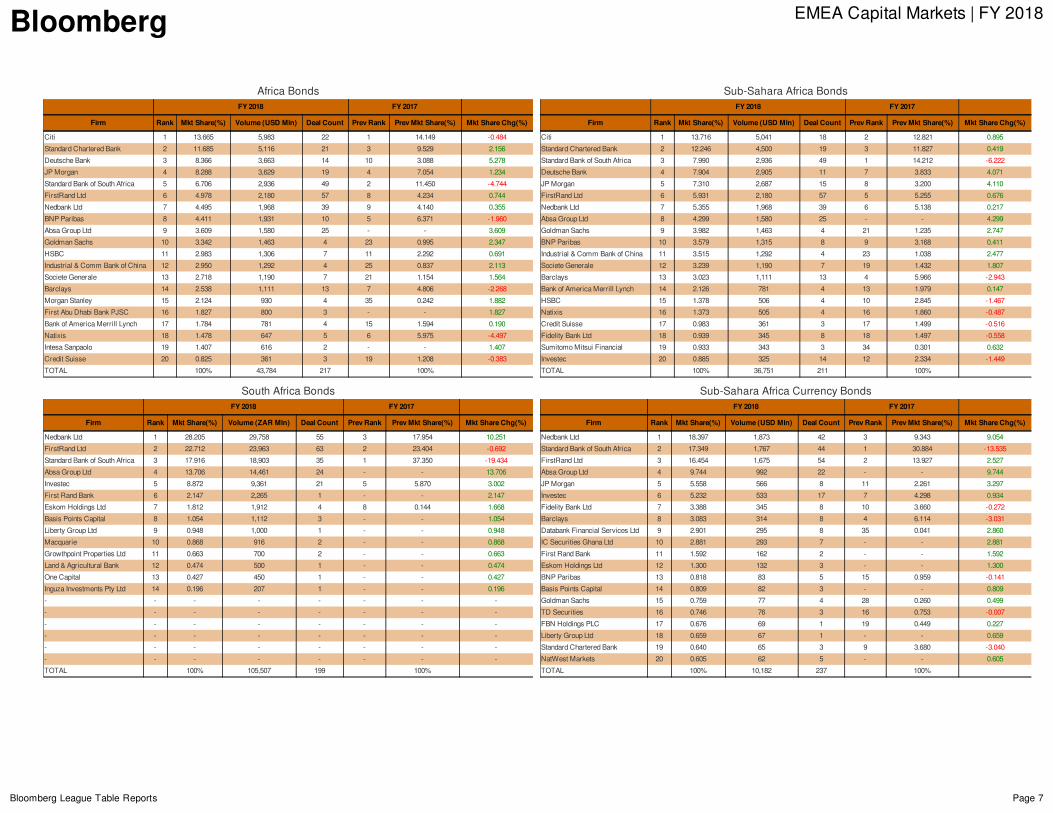
AfricaBondsFY2018 FY2017
Firm Rank MktShare(%) Volume(USDMln) DealCount PrevRank PrevMktShare(%) MktShareChg(%)
Citi 1 13.665 5,983 22 1 14.149 -0.484
StandardCharteredBank 2 11.685 5,116 21 3 9.529 2.156
DeutscheBank 3 8.366 3,663 14 10 3.088 5.278
JPMorgan 4 8.288 3,629 19 4 7.054 1.234
StandardBankofSouthAfrica 5 6.706 2,936 49 2 11.450 -4.744
FirstRandLtd 6 4.978 2,180 57 8 4.234 0.744
NedbankLtd 7 4.495 1,968 39 9 4.140 0.355
BNPParibas 8 4.411 1,931 10 5 6.371 -1.960
AbsaGroupLtd 9 3.609 1,580 25 - - 3.609
GoldmanSachs 10 3.342 1,463 4 23 0.995 2.347
HSBC 11 2.983 1,306 7 11 2.292 0.691
Industrial&CommBankofChina 12 2.950 1,292 4 25 0.837 2.113
SocieteGenerale 13 2.718 1,190 7 21 1.154 1.564
Barclays 14 2.538 1,111 13 7 4.806 -2.268
MorganStanley 15 2.124 930 4 35 0.242 1.882
FirstAbuDhabiBankPJSC 16 1.827 800 3 - - 1.827
BankofAmericaMerrillLynch 17 1.784 781 4 15 1.594 0.190
Natixis 18 1.478 647 5 6 5.975 -4.497
IntesaSanpaolo 19 1.407 616 2 - - 1.407
CreditSuisse 20 0.825 361 3 19 1.208 -0.383
TOTAL 100% 43,784 217 100%
Sub-SaharaAfricaBondsFY2018 FY2017
Firm Rank MktShare(%) Volume(USDMln) DealCount PrevRank PrevMktShare(%) MktShareChg(%)
Citi 1 13.716 5,041 18 2 12.821 0.895
StandardCharteredBank 2 12.246 4,500 19 3 11.827 0.419
StandardBankofSouthAfrica 3 7.990 2,936 49 1 14.212 -6.222
DeutscheBank 4 7.904 2,905 11 7 3.833 4.071
JPMorgan 5 7.310 2,687 15 8 3.200 4.110
FirstRandLtd 6 5.931 2,180 57 5 5.255 0.676
NedbankLtd 7 5.355 1,968 39 6 5.138 0.217
AbsaGroupLtd 8 4.299 1,580 25 - - 4.299
GoldmanSachs 9 3.982 1,463 4 21 1.235 2.747
BNPParibas 10 3.579 1,315 8 9 3.168 0.411
Industrial&CommBankofChina 11 3.515 1,292 4 23 1.038 2.477
SocieteGenerale 12 3.239 1,190 7 19 1.432 1.807
Barclays 13 3.023 1,111 13 4 5.966 -2.943
BankofAmericaMerrillLynch 14 2.126 781 4 13 1.979 0.147
HSBC 15 1.378 506 4 10 2.845 -1.467
Natixis 16 1.373 505 4 16 1.860 -0.487
CreditSuisse 17 0.983 361 3 17 1.499 -0.516
FidelityBankLtd 18 0.939 345 8 18 1.497 -0.558
SumitomoMitsuiFinancial 19 0.933 343 3 34 0.301 0.632
Investec 20 0.885 325 14 12 2.334 -1.449
TOTAL 100% 36,751 211 100%
SouthAfricaBondsFY2018 FY2017
Firm Rank MktShare(%) Volume(ZARMln) DealCount PrevRank PrevMktShare(%) MktShareChg(%)
NedbankLtd 1 28.205 29,758 55 3 17.954 10.251
FirstRandLtd 2 22.712 23,963 63 2 23.404 -0.692
StandardBankofSouthAfrica 3 17.916 18,903 35 1 37.350 -19.434
AbsaGroupLtd 4 13.706 14,461 24 - - 13.706
Investec 5 8.872 9,361 21 5 5.870 3.002
FirstRandBank 6 2.147 2,265 1 - - 2.147
EskomHoldingsLtd 7 1.812 1,912 4 8 0.144 1.668
BasisPointsCapital 8 1.054 1,112 3 - - 1.054
LibertyGroupLtd 9 0.948 1,000 1 - - 0.948
Macquarie 10 0.868 916 2 - - 0.868
GrowthpointPropertiesLtd 11 0.663 700 2 - - 0.663
Land&AgriculturalBank 12 0.474 500 1 - - 0.474
OneCapital 13 0.427 450 1 - - 0.427
InguzaInvestmentsPtyLtd 14 0.196 207 1 - - 0.196
- - - - - - - -
- - - - - - - -
- - - - - - - -
- - - - - - - -
- - - - - - - -
- - - - - - - -
TOTAL 100% 105,507 199 100%
Sub-SaharaAfricaCurrencyBondsFY2018 FY2017
Firm Rank MktShare(%) Volume(USDMln) DealCount PrevRank PrevMktShare(%) MktShareChg(%)
NedbankLtd 1 18.397 1,873 42 3 9.343 9.054
StandardBankofSouthAfrica 2 17.349 1,767 44 1 30.884 -13.535
FirstRandLtd 3 16.454 1,675 54 2 13.927 2.527
AbsaGroupLtd 4 9.744 992 22 - - 9.744
JPMorgan 5 5.558 566 8 11 2.261 3.297
Investec 6 5.232 533 17 7 4.298 0.934
FidelityBankLtd 7 3.388 345 8 10 3.660 -0.272
Barclays 8 3.083 314 8 4 6.114 -3.031
DatabankFinancialServicesLtd 9 2.901 295 8 35 0.041 2.860
ICSecuritiesGhanaLtd 10 2.881 293 7 - - 2.881
FirstRandBank 11 1.592 162 2 - - 1.592
EskomHoldingsLtd 12 1.300 132 3 - - 1.300
BNPParibas 13 0.818 83 5 15 0.959 -0.141
BasisPointsCapital 14 0.809 82 3 - - 0.809
GoldmanSachs 15 0.759 77 4 28 0.260 0.499
TDSecurities 16 0.746 76 3 16 0.753 -0.007
FBNHoldingsPLC 17 0.676 69 1 19 0.449 0.227
LibertyGroupLtd 18 0.659 67 1 - - 0.659
StandardCharteredBank 19 0.640 65 3 9 3.680 -3.040
NatWestMarkets 20 0.605 62 5 - - 0.605
TOTAL 100% 10,182 237 100%
Bloomberg EMEACapitalMarkets|FY2018
BloombergLeagueTableReports Page8
EMEAEquity
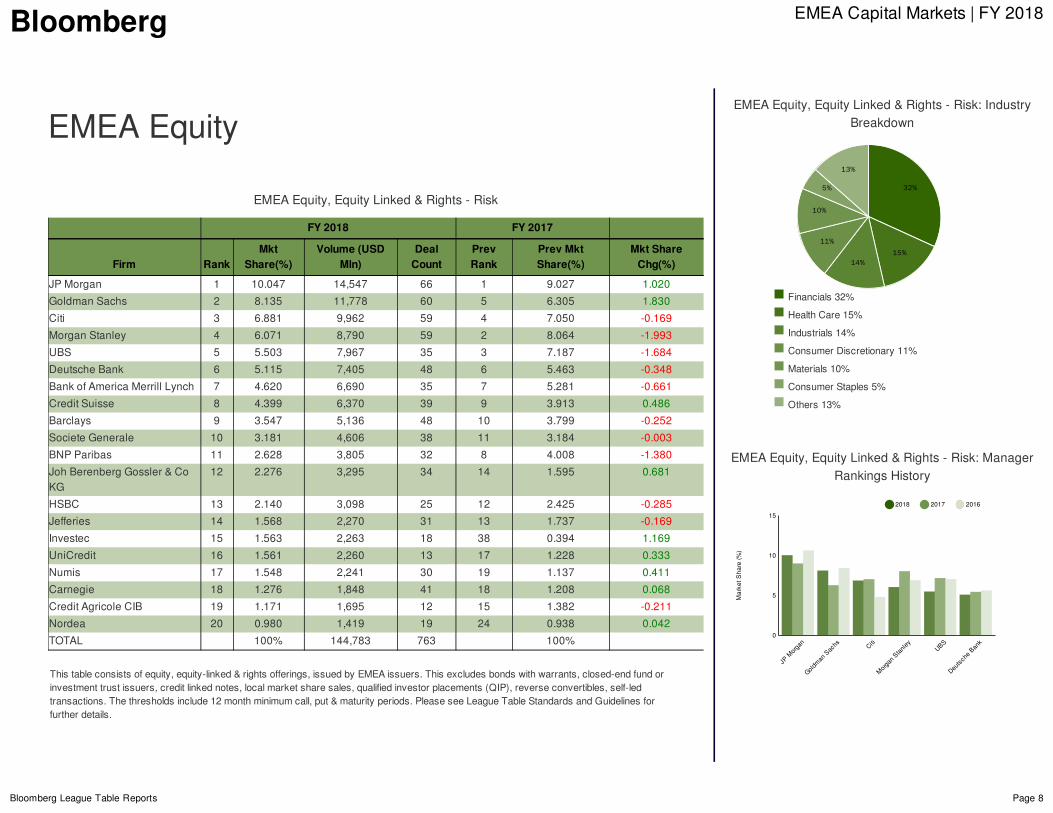
EMEAEquity,EquityLinked&Rights-Risk
FY2018 FY2017
Firm RankMkt
Share(%)Volume(USD
Mln)DealCount
PrevRank
PrevMktShare(%)
MktShareChg(%)
JPMorgan 1 10.047 14,547 66 1 9.027 1.020
GoldmanSachs 2 8.135 11,778 60 5 6.305 1.830
Citi 3 6.881 9,962 59 4 7.050 -0.169
MorganStanley 4 6.071 8,790 59 2 8.064 -1.993
UBS 5 5.503 7,967 35 3 7.187 -1.684
DeutscheBank 6 5.115 7,405 48 6 5.463 -0.348
BankofAmericaMerrillLynch 7 4.620 6,690 35 7 5.281 -0.661
CreditSuisse 8 4.399 6,370 39 9 3.913 0.486
Barclays 9 3.547 5,136 48 10 3.799 -0.252
SocieteGenerale 10 3.181 4,606 38 11 3.184 -0.003
BNPParibas 11 2.628 3,805 32 8 4.008 -1.380
JohBerenbergGossler&CoKG
12 2.276 3,295 34 14 1.595 0.681
HSBC 13 2.140 3,098 25 12 2.425 -0.285
Jefferies 14 1.568 2,270 31 13 1.737 -0.169
Investec 15 1.563 2,263 18 38 0.394 1.169
UniCredit 16 1.561 2,260 13 17 1.228 0.333
Numis 17 1.548 2,241 30 19 1.137 0.411
Carnegie 18 1.276 1,848 41 18 1.208 0.068
CreditAgricoleCIB 19 1.171 1,695 12 15 1.382 -0.211
Nordea 20 0.980 1,419 19 24 0.938 0.042
TOTAL 100% 144,783 763 100%
Thistableconsistsofequity,equity-linked&rightsofferings,issuedbyEMEAissuers.Thisexcludesbondswithwarrants,closed-endfundorinvestmenttrustissuers,creditlinkednotes,localmarketsharesales,qualifiedinvestorplacements(QIP),reverseconvertibles,self-ledtransactions.Thethresholdsinclude12monthminimumcall,put&maturityperiods.PleaseseeLeagueTableStandardsandGuidelinesforfurtherdetails.
Financials32%
HealthCare15%
Industrials14%
ConsumerDiscretionary11%
Materials10%
ConsumerStaples5%
Others13%
EMEAEquity,EquityLinked&Rights-Risk:ManagerRankingsHistory
EMEAEquity,EquityLinked&Rights-Risk:IndustryBreakdown
32%
15%14%
11%
10%
5%
13%
JPMorg
an
Goldm
anSachs Ci
ti
Morga
nStan
ley UBS
Deuts
cheB
ank
5
10
Marke
tSha
re(%
)
0
15
2018 2017 2016
Bloomberg EMEACapitalMarkets|FY2018
BloombergLeagueTableReports Page9
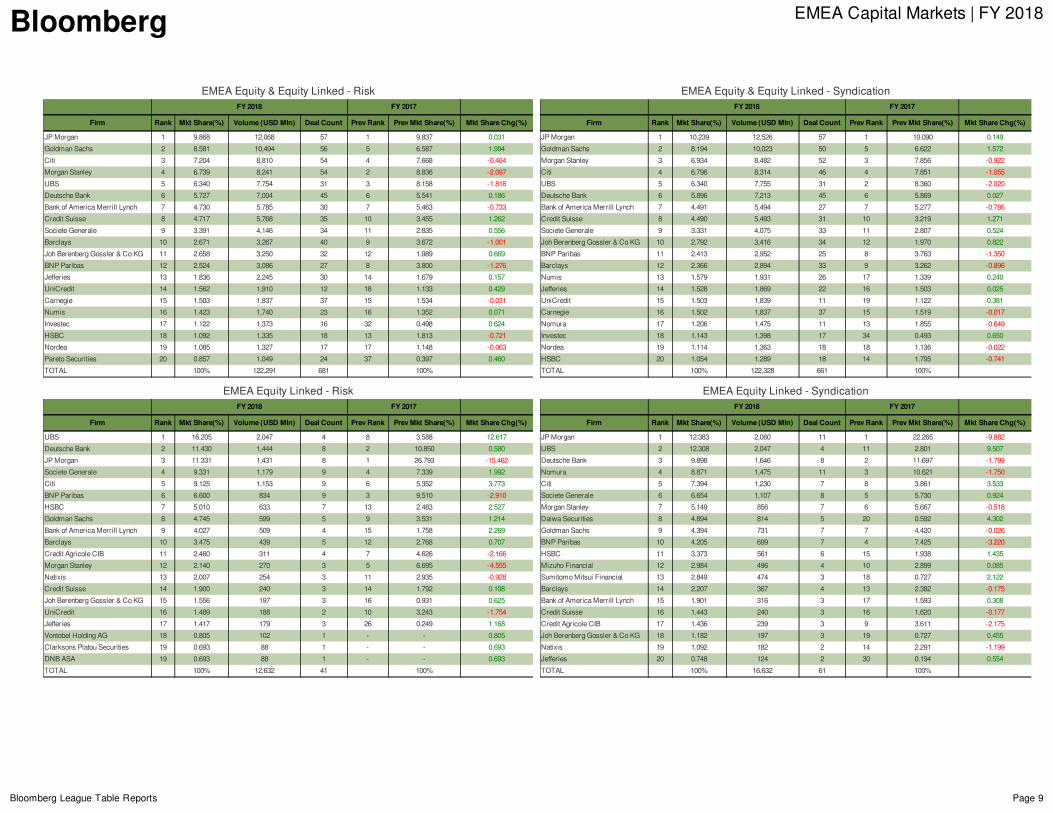
EMEAEquity&EquityLinked-RiskFY2018 FY2017
Firm Rank MktShare(%) Volume(USDMln) DealCount PrevRank PrevMktShare(%) MktShareChg(%)
JPMorgan 1 9.868 12,068 57 1 9.837 0.031
GoldmanSachs 2 8.581 10,494 56 5 6.587 1.994
Citi 3 7.204 8,810 54 4 7.668 -0.464
MorganStanley 4 6.739 8,241 54 2 8.836 -2.097
UBS 5 6.340 7,754 31 3 8.158 -1.818
DeutscheBank 6 5.727 7,004 45 6 5.541 0.186
BankofAmericaMerrillLynch 7 4.730 5,785 30 7 5.463 -0.733
CreditSuisse 8 4.717 5,768 35 10 3.455 1.262
SocieteGenerale 9 3.391 4,146 34 11 2.835 0.556
Barclays 10 2.671 3,267 40 9 3.672 -1.001
JohBerenbergGossler&CoKG 11 2.658 3,250 32 12 1.989 0.669
BNPParibas 12 2.524 3,086 27 8 3.800 -1.276
Jefferies 13 1.836 2,245 30 14 1.679 0.157
UniCredit 14 1.562 1,910 12 18 1.133 0.429
Carnegie 15 1.503 1,837 37 15 1.534 -0.031
Numis 16 1.423 1,740 23 16 1.352 0.071
Investec 17 1.122 1,373 16 32 0.498 0.624
HSBC 18 1.092 1,335 18 13 1.813 -0.721
Nordea 19 1.085 1,327 17 17 1.148 -0.063
ParetoSecurities 20 0.857 1,049 24 37 0.397 0.460
TOTAL 100% 122,291 681 100%
EMEAEquity&EquityLinked-SyndicationFY2018 FY2017
Firm Rank MktShare(%) Volume(USDMln) DealCount PrevRank PrevMktShare(%) MktShareChg(%)
JPMorgan 1 10.239 12,526 57 1 10.090 0.149
GoldmanSachs 2 8.194 10,023 50 5 6.622 1.572
MorganStanley 3 6.934 8,482 52 3 7.856 -0.922
Citi 4 6.796 8,314 46 4 7.851 -1.055
UBS 5 6.340 7,755 31 2 8.360 -2.020
DeutscheBank 6 5.896 7,213 45 6 5.869 0.027
BankofAmericaMerrillLynch 7 4.491 5,494 27 7 5.277 -0.786
CreditSuisse 8 4.490 5,493 31 10 3.219 1.271
SocieteGenerale 9 3.331 4,075 33 11 2.807 0.524
JohBerenbergGossler&CoKG 10 2.792 3,416 34 12 1.970 0.822
BNPParibas 11 2.413 2,952 25 8 3.763 -1.350
Barclays 12 2.366 2,894 33 9 3.262 -0.896
Numis 13 1.579 1,931 26 17 1.339 0.240
Jefferies 14 1.528 1,869 22 16 1.503 0.025
UniCredit 15 1.503 1,839 11 19 1.122 0.381
Carnegie 16 1.502 1,837 37 15 1.519 -0.017
Nomura 17 1.206 1,475 11 13 1.855 -0.649
Investec 18 1.143 1,398 17 34 0.493 0.650
Nordea 19 1.114 1,363 18 18 1.136 -0.022
HSBC 20 1.054 1,289 18 14 1.795 -0.741
TOTAL 100% 122,328 661 100%
EMEAEquityLinked-RiskFY2018 FY2017
Firm Rank MktShare(%) Volume(USDMln) DealCount PrevRank PrevMktShare(%) MktShareChg(%)
UBS 1 16.205 2,047 4 8 3.588 12.617
DeutscheBank 2 11.430 1,444 8 2 10.850 0.580
JPMorgan 3 11.331 1,431 8 1 26.793 -15.462
SocieteGenerale 4 9.331 1,179 9 4 7.339 1.992
Citi 5 9.125 1,153 9 6 5.352 3.773
BNPParibas 6 6.600 834 9 3 9.510 -2.910
HSBC 7 5.010 633 7 13 2.483 2.527
GoldmanSachs 8 4.745 599 5 9 3.531 1.214
BankofAmericaMerrillLynch 9 4.027 509 4 15 1.758 2.269
Barclays 10 3.475 439 5 12 2.768 0.707
CreditAgricoleCIB 11 2.460 311 4 7 4.626 -2.166
MorganStanley 12 2.140 270 3 5 6.695 -4.555
Natixis 13 2.007 254 3 11 2.935 -0.928
CreditSuisse 14 1.900 240 3 14 1.792 0.108
JohBerenbergGossler&CoKG 15 1.556 197 3 16 0.931 0.625
UniCredit 16 1.489 188 2 10 3.243 -1.754
Jefferies 17 1.417 179 3 26 0.249 1.168
VontobelHoldingAG 18 0.805 102 1 - - 0.805
ClarksonsPlatouSecurities 19 0.693 88 1 - - 0.693
DNBASA 19 0.693 88 1 - - 0.693
TOTAL 100% 12,632 41 100%
EMEAEquityLinked-SyndicationFY2018 FY2017
Firm Rank MktShare(%) Volume(USDMln) DealCount PrevRank PrevMktShare(%) MktShareChg(%)
JPMorgan 1 12.383 2,060 11 1 22.265 -9.882
UBS 2 12.308 2,047 4 11 2.801 9.507
DeutscheBank 3 9.898 1,646 8 2 11.697 -1.799
Nomura 4 8.871 1,475 11 3 10.621 -1.750
Citi 5 7.394 1,230 7 8 3.861 3.533
SocieteGenerale 6 6.654 1,107 8 5 5.730 0.924
MorganStanley 7 5.149 856 7 6 5.667 -0.518
DaiwaSecurities 8 4.894 814 5 20 0.592 4.302
GoldmanSachs 9 4.394 731 7 7 4.420 -0.026
BNPParibas 10 4.205 699 7 4 7.425 -3.220
HSBC 11 3.373 561 6 15 1.938 1.435
MizuhoFinancial 12 2.984 496 4 10 2.899 0.085
SumitomoMitsuiFinancial 13 2.849 474 3 18 0.727 2.122
Barclays 14 2.207 367 4 13 2.382 -0.175
BankofAmericaMerrillLynch 15 1.901 316 3 17 1.593 0.308
CreditSuisse 16 1.443 240 3 16 1.620 -0.177
CreditAgricoleCIB 17 1.436 239 3 9 3.611 -2.175
JohBerenbergGossler&CoKG 18 1.182 197 3 19 0.727 0.455
Natixis 19 1.092 182 2 14 2.291 -1.199
Jefferies 20 0.748 124 2 30 0.194 0.554
TOTAL 100% 16,632 61 100%
Bloomberg EMEACapitalMarkets|FY2018
BloombergLeagueTableReports Page10
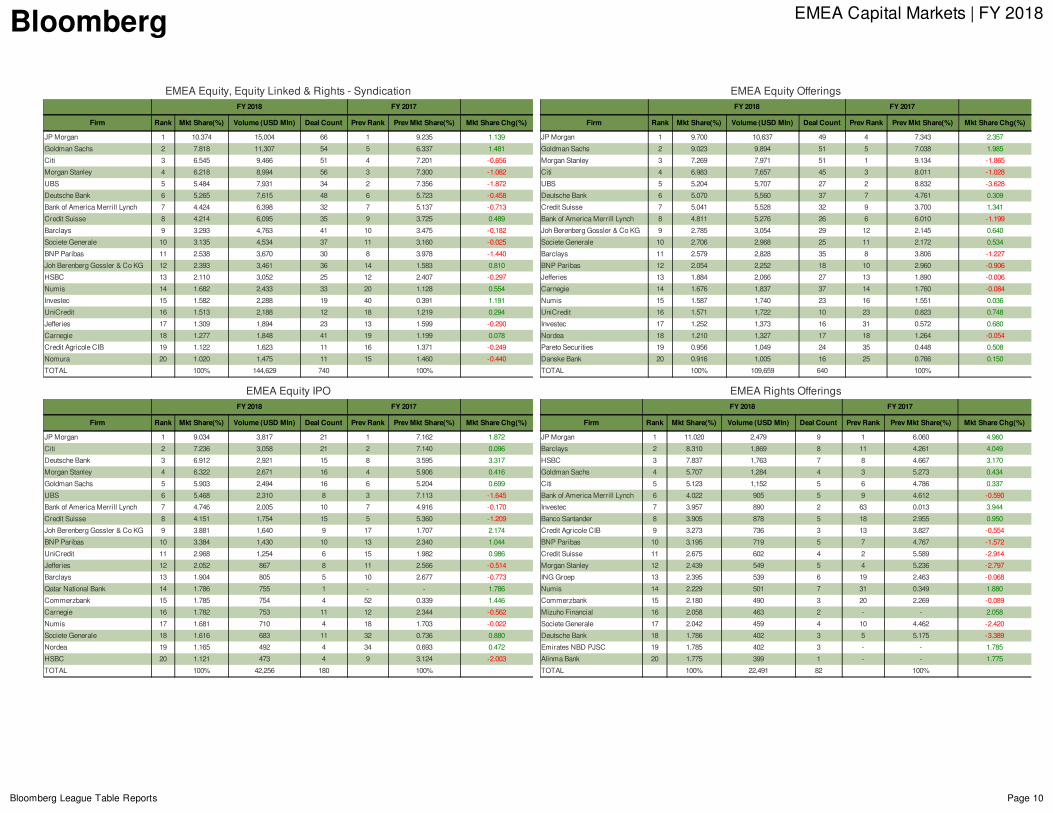
EMEAEquity,EquityLinked&Rights-SyndicationFY2018 FY2017
Firm Rank MktShare(%) Volume(USDMln) DealCount PrevRank PrevMktShare(%) MktShareChg(%)
JPMorgan 1 10.374 15,004 66 1 9.235 1.139
GoldmanSachs 2 7.818 11,307 54 5 6.337 1.481
Citi 3 6.545 9,466 51 4 7.201 -0.656
MorganStanley 4 6.218 8,994 56 3 7.300 -1.082
UBS 5 5.484 7,931 34 2 7.356 -1.872
DeutscheBank 6 5.265 7,615 48 6 5.723 -0.458
BankofAmericaMerrillLynch 7 4.424 6,398 32 7 5.137 -0.713
CreditSuisse 8 4.214 6,095 35 9 3.725 0.489
Barclays 9 3.293 4,763 41 10 3.475 -0.182
SocieteGenerale 10 3.135 4,534 37 11 3.160 -0.025
BNPParibas 11 2.538 3,670 30 8 3.978 -1.440
JohBerenbergGossler&CoKG 12 2.393 3,461 36 14 1.583 0.810
HSBC 13 2.110 3,052 25 12 2.407 -0.297
Numis 14 1.682 2,433 33 20 1.128 0.554
Investec 15 1.582 2,288 19 40 0.391 1.191
UniCredit 16 1.513 2,188 12 18 1.219 0.294
Jefferies 17 1.309 1,894 23 13 1.599 -0.290
Carnegie 18 1.277 1,848 41 19 1.199 0.078
CreditAgricoleCIB 19 1.122 1,623 11 16 1.371 -0.249
Nomura 20 1.020 1,475 11 15 1.460 -0.440
TOTAL 100% 144,629 740 100%
EMEAEquityOfferingsFY2018 FY2017
Firm Rank MktShare(%) Volume(USDMln) DealCount PrevRank PrevMktShare(%) MktShareChg(%)
JPMorgan 1 9.700 10,637 49 4 7.343 2.357
GoldmanSachs 2 9.023 9,894 51 5 7.038 1.985
MorganStanley 3 7.269 7,971 51 1 9.134 -1.865
Citi 4 6.983 7,657 45 3 8.011 -1.028
UBS 5 5.204 5,707 27 2 8.832 -3.628
DeutscheBank 6 5.070 5,560 37 7 4.761 0.309
CreditSuisse 7 5.041 5,528 32 9 3.700 1.341
BankofAmericaMerrillLynch 8 4.811 5,276 26 6 6.010 -1.199
JohBerenbergGossler&CoKG 9 2.785 3,054 29 12 2.145 0.640
SocieteGenerale 10 2.706 2,968 25 11 2.172 0.534
Barclays 11 2.579 2,828 35 8 3.806 -1.227
BNPParibas 12 2.054 2,252 18 10 2.960 -0.906
Jefferies 13 1.884 2,066 27 13 1.890 -0.006
Carnegie 14 1.676 1,837 37 14 1.760 -0.084
Numis 15 1.587 1,740 23 16 1.551 0.036
UniCredit 16 1.571 1,722 10 23 0.823 0.748
Investec 17 1.252 1,373 16 31 0.572 0.680
Nordea 18 1.210 1,327 17 18 1.264 -0.054
ParetoSecurities 19 0.956 1,049 24 35 0.448 0.508
DanskeBank 20 0.916 1,005 16 25 0.766 0.150
TOTAL 100% 109,659 640 100%
EMEAEquityIPOFY2018 FY2017
Firm Rank MktShare(%) Volume(USDMln) DealCount PrevRank PrevMktShare(%) MktShareChg(%)
JPMorgan 1 9.034 3,817 21 1 7.162 1.872
Citi 2 7.236 3,058 21 2 7.140 0.096
DeutscheBank 3 6.912 2,921 15 8 3.595 3.317
MorganStanley 4 6.322 2,671 16 4 5.906 0.416
GoldmanSachs 5 5.903 2,494 16 6 5.204 0.699
UBS 6 5.468 2,310 8 3 7.113 -1.645
BankofAmericaMerrillLynch 7 4.746 2,005 10 7 4.916 -0.170
CreditSuisse 8 4.151 1,754 15 5 5.360 -1.209
JohBerenbergGossler&CoKG 9 3.881 1,640 9 17 1.707 2.174
BNPParibas 10 3.384 1,430 10 13 2.340 1.044
UniCredit 11 2.968 1,254 6 15 1.982 0.986
Jefferies 12 2.052 867 8 11 2.566 -0.514
Barclays 13 1.904 805 5 10 2.677 -0.773
QatarNationalBank 14 1.786 755 1 - - 1.786
Commerzbank 15 1.785 754 4 52 0.339 1.446
Carnegie 16 1.782 753 11 12 2.344 -0.562
Numis 17 1.681 710 4 18 1.703 -0.022
SocieteGenerale 18 1.616 683 11 32 0.736 0.880
Nordea 19 1.165 492 4 34 0.693 0.472
HSBC 20 1.121 473 4 9 3.124 -2.003
TOTAL 100% 42,256 180 100%
EMEARightsOfferingsFY2018 FY2017
Firm Rank MktShare(%) Volume(USDMln) DealCount PrevRank PrevMktShare(%) MktShareChg(%)
JPMorgan 1 11.020 2,479 9 1 6.060 4.960
Barclays 2 8.310 1,869 8 11 4.261 4.049
HSBC 3 7.837 1,763 7 8 4.667 3.170
GoldmanSachs 4 5.707 1,284 4 3 5.273 0.434
Citi 5 5.123 1,152 5 6 4.786 0.337
BankofAmericaMerrillLynch 6 4.022 905 5 9 4.612 -0.590
Investec 7 3.957 890 2 63 0.013 3.944
BancoSantander 8 3.905 878 5 18 2.955 0.950
CreditAgricoleCIB 9 3.273 736 3 13 3.827 -0.554
BNPParibas 10 3.195 719 5 7 4.767 -1.572
CreditSuisse 11 2.675 602 4 2 5.589 -2.914
MorganStanley 12 2.439 549 5 4 5.236 -2.797
INGGroep 13 2.395 539 6 19 2.463 -0.068
Numis 14 2.229 501 7 31 0.349 1.880
Commerzbank 15 2.180 490 3 20 2.269 -0.089
MizuhoFinancial 16 2.058 463 2 - - 2.058
SocieteGenerale 17 2.042 459 4 10 4.462 -2.420
DeutscheBank 18 1.786 402 3 5 5.175 -3.389
EmiratesNBDPJSC 19 1.785 402 3 - - 1.785
AlinmaBank 20 1.775 399 1 - - 1.775
TOTAL 100% 22,491 82 100%
Bloomberg EMEACapitalMarkets|FY2018
BloombergLeagueTableReports Page11
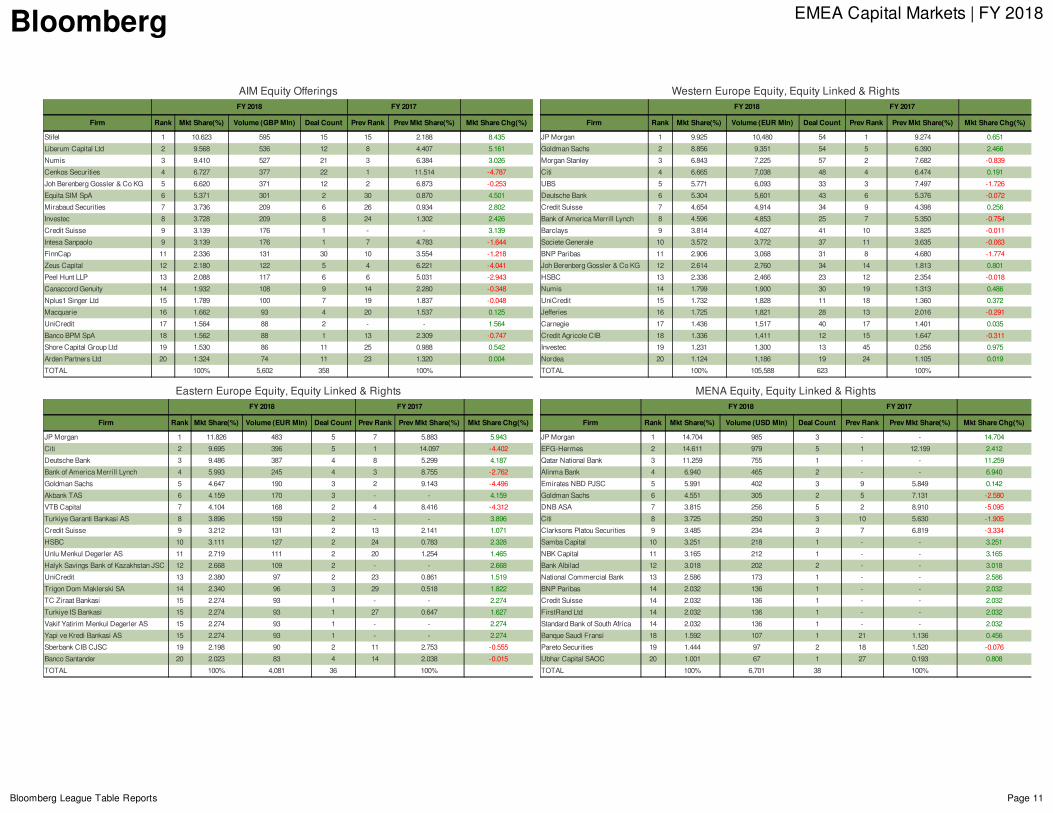
AIMEquityOfferingsFY2018 FY2017
Firm Rank MktShare(%) Volume(GBPMln) DealCount PrevRank PrevMktShare(%) MktShareChg(%)
Stifel 1 10.623 595 15 15 2.188 8.435
LiberumCapitalLtd 2 9.568 536 12 8 4.407 5.161
Numis 3 9.410 527 21 3 6.384 3.026
CenkosSecurities 4 6.727 377 22 1 11.514 -4.787
JohBerenbergGossler&CoKG 5 6.620 371 12 2 6.873 -0.253
EquitaSIMSpA 6 5.371 301 2 30 0.870 4.501
MirabaudSecurities 7 3.736 209 6 26 0.934 2.802
Investec 8 3.728 209 8 24 1.302 2.426
CreditSuisse 9 3.139 176 1 - - 3.139
IntesaSanpaolo 9 3.139 176 1 7 4.783 -1.644
FinnCap 11 2.336 131 30 10 3.554 -1.218
ZeusCapital 12 2.180 122 5 4 6.221 -4.041
PeelHuntLLP 13 2.088 117 6 6 5.031 -2.943
CanaccordGenuity 14 1.932 108 9 14 2.280 -0.348
Nplus1SingerLtd 15 1.789 100 7 19 1.837 -0.048
Macquarie 16 1.662 93 4 20 1.537 0.125
UniCredit 17 1.564 88 2 - - 1.564
BancoBPMSpA 18 1.562 88 1 13 2.309 -0.747
ShoreCapitalGroupLtd 19 1.530 86 11 25 0.988 0.542
ArdenPartnersLtd 20 1.324 74 11 23 1.320 0.004
TOTAL 100% 5,602 358 100%
WesternEuropeEquity,EquityLinked&RightsFY2018 FY2017
Firm Rank MktShare(%) Volume(EURMln) DealCount PrevRank PrevMktShare(%) MktShareChg(%)
JPMorgan 1 9.925 10,480 54 1 9.274 0.651
GoldmanSachs 2 8.856 9,351 54 5 6.390 2.466
MorganStanley 3 6.843 7,225 57 2 7.682 -0.839
Citi 4 6.665 7,038 48 4 6.474 0.191
UBS 5 5.771 6,093 33 3 7.497 -1.726
DeutscheBank 6 5.304 5,601 43 6 5.376 -0.072
CreditSuisse 7 4.654 4,914 34 9 4.398 0.256
BankofAmericaMerrillLynch 8 4.596 4,853 25 7 5.350 -0.754
Barclays 9 3.814 4,027 41 10 3.825 -0.011
SocieteGenerale 10 3.572 3,772 37 11 3.635 -0.063
BNPParibas 11 2.906 3,068 31 8 4.680 -1.774
JohBerenbergGossler&CoKG 12 2.614 2,760 34 14 1.813 0.801
HSBC 13 2.336 2,466 23 12 2.354 -0.018
Numis 14 1.799 1,900 30 19 1.313 0.486
UniCredit 15 1.732 1,828 11 18 1.360 0.372
Jefferies 16 1.725 1,821 28 13 2.016 -0.291
Carnegie 17 1.436 1,517 40 17 1.401 0.035
CreditAgricoleCIB 18 1.336 1,411 12 15 1.647 -0.311
Investec 19 1.231 1,300 13 45 0.256 0.975
Nordea 20 1.124 1,186 19 24 1.105 0.019
TOTAL 100% 105,588 623 100%
EasternEuropeEquity,EquityLinked&RightsFY2018 FY2017
Firm Rank MktShare(%) Volume(EURMln) DealCount PrevRank PrevMktShare(%) MktShareChg(%)
JPMorgan 1 11.826 483 5 7 5.883 5.943
Citi 2 9.695 396 5 1 14.097 -4.402
DeutscheBank 3 9.486 387 4 8 5.299 4.187
BankofAmericaMerrillLynch 4 5.993 245 4 3 8.755 -2.762
GoldmanSachs 5 4.647 190 3 2 9.143 -4.496
AkbankTAS 6 4.159 170 3 - - 4.159
VTBCapital 7 4.104 168 2 4 8.416 -4.312
TurkiyeGarantiBankasiAS 8 3.896 159 2 - - 3.896
CreditSuisse 9 3.212 131 2 13 2.141 1.071
HSBC 10 3.111 127 2 24 0.783 2.328
UnluMenkulDegerlerAS 11 2.719 111 2 20 1.254 1.465
HalykSavingsBankofKazakhstanJSC 12 2.668 109 2 - - 2.668
UniCredit 13 2.380 97 2 23 0.861 1.519
TrigonDomMaklerskiSA 14 2.340 96 3 29 0.518 1.822
TCZiraatBankasi 15 2.274 93 1 - - 2.274
TurkiyeISBankasi 15 2.274 93 1 27 0.647 1.627
VakifYatirimMenkulDegerlerAS 15 2.274 93 1 - - 2.274
YapiveKrediBankasiAS 15 2.274 93 1 - - 2.274
SberbankCIBCJSC 19 2.198 90 2 11 2.753 -0.555
BancoSantander 20 2.023 83 4 14 2.038 -0.015
TOTAL 100% 4,081 36 100%
MENAEquity,EquityLinked&RightsFY2018 FY2017
Firm Rank MktShare(%) Volume(USDMln) DealCount PrevRank PrevMktShare(%) MktShareChg(%)
JPMorgan 1 14.704 985 3 - - 14.704
EFG-Hermes 2 14.611 979 5 1 12.199 2.412
QatarNationalBank 3 11.259 755 1 - - 11.259
AlinmaBank 4 6.940 465 2 - - 6.940
EmiratesNBDPJSC 5 5.991 402 3 9 5.849 0.142
GoldmanSachs 6 4.551 305 2 5 7.131 -2.580
DNBASA 7 3.815 256 5 2 8.910 -5.095
Citi 8 3.725 250 3 10 5.630 -1.905
ClarksonsPlatouSecurities 9 3.485 234 3 7 6.819 -3.334
SambaCapital 10 3.251 218 1 - - 3.251
NBKCapital 11 3.165 212 1 - - 3.165
BankAlbilad 12 3.018 202 2 - - 3.018
NationalCommercialBank 13 2.586 173 1 - - 2.586
BNPParibas 14 2.032 136 1 - - 2.032
CreditSuisse 14 2.032 136 1 - - 2.032
FirstRandLtd 14 2.032 136 1 - - 2.032
StandardBankofSouthAfrica 14 2.032 136 1 - - 2.032
BanqueSaudiFransi 18 1.592 107 1 21 1.136 0.456
ParetoSecurities 19 1.444 97 2 18 1.520 -0.076
UbharCapitalSAOC 20 1.001 67 1 27 0.193 0.808
TOTAL 100% 6,701 38 100%
Bloomberg EMEACapitalMarkets|FY2018
BloombergLeagueTableReports Page12
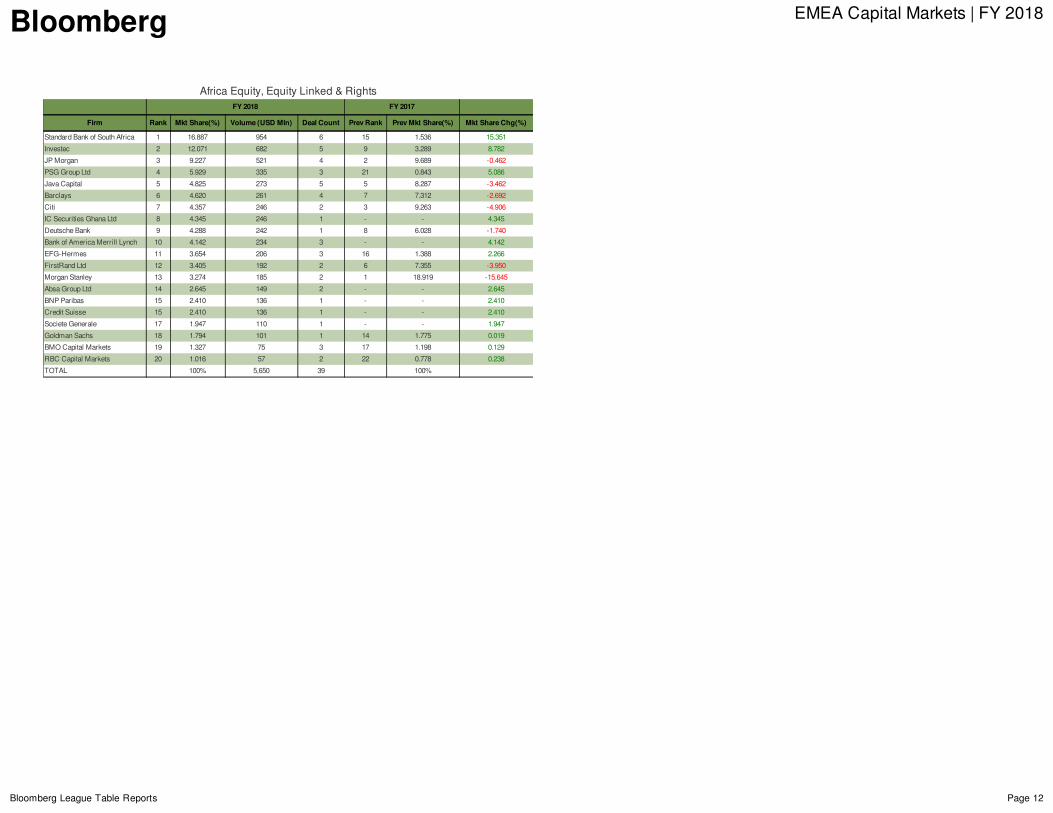
AfricaEquity,EquityLinked&RightsFY2018 FY2017
Firm Rank MktShare(%) Volume(USDMln) DealCount PrevRank PrevMktShare(%) MktShareChg(%)
StandardBankofSouthAfrica 1 16.887 954 6 15 1.536 15.351
Investec 2 12.071 682 5 9 3.289 8.782
JPMorgan 3 9.227 521 4 2 9.689 -0.462
PSGGroupLtd 4 5.929 335 3 21 0.843 5.086
JavaCapital 5 4.825 273 5 5 8.287 -3.462
Barclays 6 4.620 261 4 7 7.312 -2.692
Citi 7 4.357 246 2 3 9.263 -4.906
ICSecuritiesGhanaLtd 8 4.345 246 1 - - 4.345
DeutscheBank 9 4.288 242 1 8 6.028 -1.740
BankofAmericaMerrillLynch 10 4.142 234 3 - - 4.142
EFG-Hermes 11 3.654 206 3 16 1.388 2.266
FirstRandLtd 12 3.405 192 2 6 7.355 -3.950
MorganStanley 13 3.274 185 2 1 18.919 -15.645
AbsaGroupLtd 14 2.645 149 2 - - 2.645
BNPParibas 15 2.410 136 1 - - 2.410
CreditSuisse 15 2.410 136 1 - - 2.410
SocieteGenerale 17 1.947 110 1 - - 1.947
GoldmanSachs 18 1.794 101 1 14 1.775 0.019
BMOCapitalMarkets 19 1.327 75 3 17 1.198 0.129
RBCCapitalMarkets 20 1.016 57 2 22 0.778 0.238
TOTAL 100% 5,650 39 100%
Bloomberg EMEACapitalMarkets|FY2018
BloombergLeagueTableReports Page13
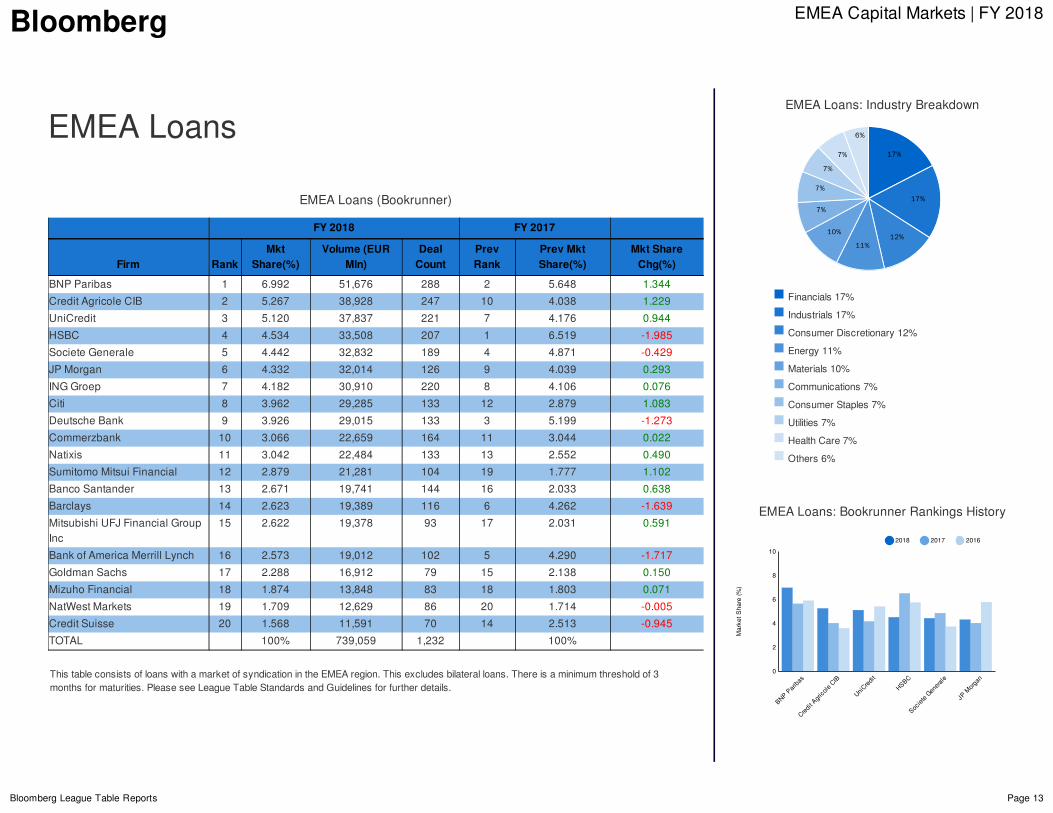
EMEALoans
EMEALoans(Bookrunner)
FY2018 FY2017
Firm RankMkt
Share(%)Volume(EUR
Mln)DealCount
PrevRank
PrevMktShare(%)
MktShareChg(%)
BNPParibas 1 6.992 51,676 288 2 5.648 1.344
CreditAgricoleCIB 2 5.267 38,928 247 10 4.038 1.229
UniCredit 3 5.120 37,837 221 7 4.176 0.944
HSBC 4 4.534 33,508 207 1 6.519 -1.985
SocieteGenerale 5 4.442 32,832 189 4 4.871 -0.429
JPMorgan 6 4.332 32,014 126 9 4.039 0.293
INGGroep 7 4.182 30,910 220 8 4.106 0.076
Citi 8 3.962 29,285 133 12 2.879 1.083
DeutscheBank 9 3.926 29,015 133 3 5.199 -1.273
Commerzbank 10 3.066 22,659 164 11 3.044 0.022
Natixis 11 3.042 22,484 133 13 2.552 0.490
SumitomoMitsuiFinancial 12 2.879 21,281 104 19 1.777 1.102
BancoSantander 13 2.671 19,741 144 16 2.033 0.638
Barclays 14 2.623 19,389 116 6 4.262 -1.639
MitsubishiUFJFinancialGroupInc
15 2.622 19,378 93 17 2.031 0.591
BankofAmericaMerrillLynch 16 2.573 19,012 102 5 4.290 -1.717
GoldmanSachs 17 2.288 16,912 79 15 2.138 0.150
MizuhoFinancial 18 1.874 13,848 83 18 1.803 0.071
NatWestMarkets 19 1.709 12,629 86 20 1.714 -0.005
CreditSuisse 20 1.568 11,591 70 14 2.513 -0.945
TOTAL 100% 739,059 1,232 100%
ThistableconsistsofloanswithamarketofsyndicationintheEMEAregion.Thisexcludesbilateralloans.Thereisaminimumthresholdof3monthsformaturities.PleaseseeLeagueTableStandardsandGuidelinesforfurtherdetails.
Financials17%
Industrials17%
ConsumerDiscretionary12%
Energy11%
Materials10%
Communications7%
ConsumerStaples7%
Utilities7%
HealthCare7%
Others6%
EMEALoans:BookrunnerRankingsHistory
EMEALoans:IndustryBreakdown
17%
17%
12%11%
10%
7%
7%
7%
7%
6%
BNPParibas
CreditA
gricoleCIB
UniCred
it
HSBC
Socie
teGenerale
JPMorg
an
2
4
6
8
Marke
tSha
re(%
)
0
10
2018 2017 2016
Bloomberg EMEACapitalMarkets|FY2018
BloombergLeagueTableReports Page14
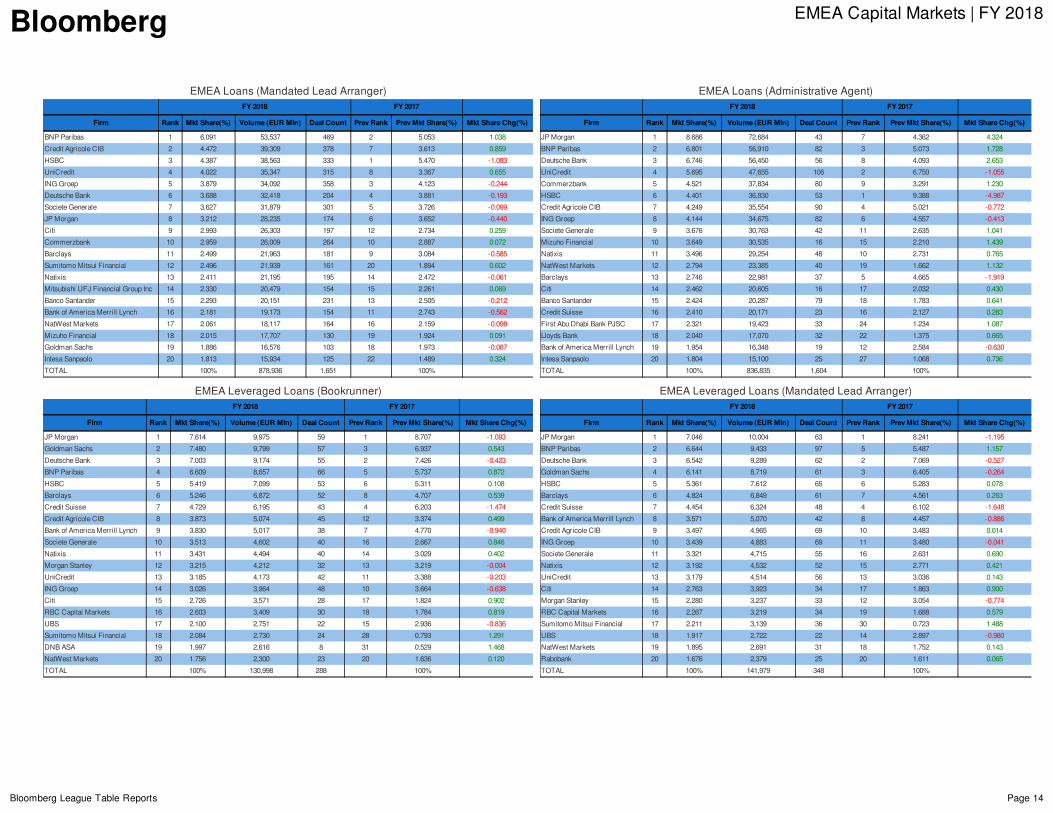
EMEALoans(MandatedLeadArranger)FY2018 FY2017
Firm Rank MktShare(%) Volume(EURMln) DealCount PrevRank PrevMktShare(%) MktShareChg(%)
BNPParibas 1 6.091 53,537 469 2 5.053 1.038
CreditAgricoleCIB 2 4.472 39,309 378 7 3.613 0.859
HSBC 3 4.387 38,563 333 1 5.470 -1.083
UniCredit 4 4.022 35,347 315 8 3.367 0.655
INGGroep 5 3.879 34,092 358 3 4.123 -0.244
DeutscheBank 6 3.688 32,418 204 4 3.881 -0.193
SocieteGenerale 7 3.627 31,879 301 5 3.726 -0.099
JPMorgan 8 3.212 28,235 174 6 3.652 -0.440
Citi 9 2.993 26,303 197 12 2.734 0.259
Commerzbank 10 2.959 26,009 264 10 2.887 0.072
Barclays 11 2.499 21,963 181 9 3.084 -0.585
SumitomoMitsuiFinancial 12 2.496 21,939 161 20 1.894 0.602
Natixis 13 2.411 21,195 195 14 2.472 -0.061
MitsubishiUFJFinancialGroupInc 14 2.330 20,479 154 15 2.261 0.069
BancoSantander 15 2.293 20,151 231 13 2.505 -0.212
BankofAmericaMerrillLynch 16 2.181 19,173 154 11 2.743 -0.562
NatWestMarkets 17 2.061 18,117 164 16 2.159 -0.098
MizuhoFinancial 18 2.015 17,707 130 19 1.924 0.091
GoldmanSachs 19 1.886 16,576 103 18 1.973 -0.087
IntesaSanpaolo 20 1.813 15,934 125 22 1.489 0.324
TOTAL 100% 878,936 1,651 100%
EMEALoans(AdministrativeAgent)FY2018 FY2017
Firm Rank MktShare(%) Volume(EURMln) DealCount PrevRank PrevMktShare(%) MktShareChg(%)
JPMorgan 1 8.686 72,684 43 7 4.362 4.324
BNPParibas 2 6.801 56,910 82 3 5.073 1.728
DeutscheBank 3 6.746 56,450 56 8 4.093 2.653
UniCredit 4 5.695 47,655 106 2 6.750 -1.055
Commerzbank 5 4.521 37,834 80 9 3.291 1.230
HSBC 6 4.401 36,830 53 1 9.388 -4.987
CreditAgricoleCIB 7 4.249 35,554 90 4 5.021 -0.772
INGGroep 8 4.144 34,675 82 6 4.557 -0.413
SocieteGenerale 9 3.676 30,763 42 11 2.635 1.041
MizuhoFinancial 10 3.649 30,535 16 15 2.210 1.439
Natixis 11 3.496 29,254 48 10 2.731 0.765
NatWestMarkets 12 2.794 23,385 40 19 1.662 1.132
Barclays 13 2.746 22,981 37 5 4.665 -1.919
Citi 14 2.462 20,605 16 17 2.032 0.430
BancoSantander 15 2.424 20,287 79 18 1.783 0.641
CreditSuisse 16 2.410 20,171 23 16 2.127 0.283
FirstAbuDhabiBankPJSC 17 2.321 19,423 33 24 1.234 1.087
LloydsBank 18 2.040 17,070 32 22 1.375 0.665
BankofAmericaMerrillLynch 19 1.954 16,348 19 12 2.584 -0.630
IntesaSanpaolo 20 1.804 15,100 25 27 1.068 0.736
TOTAL 100% 836,835 1,604 100%
EMEALeveragedLoans(Bookrunner)FY2018 FY2017
Firm Rank MktShare(%) Volume(EURMln) DealCount PrevRank PrevMktShare(%) MktShareChg(%)
JPMorgan 1 7.614 9,975 59 1 8.707 -1.093
GoldmanSachs 2 7.480 9,799 57 3 6.937 0.543
DeutscheBank 3 7.003 9,174 55 2 7.426 -0.423
BNPParibas 4 6.609 8,657 66 5 5.737 0.872
HSBC 5 5.419 7,099 53 6 5.311 0.108
Barclays 6 5.246 6,872 52 8 4.707 0.539
CreditSuisse 7 4.729 6,195 43 4 6.203 -1.474
CreditAgricoleCIB 8 3.873 5,074 45 12 3.374 0.499
BankofAmericaMerrillLynch 9 3.830 5,017 38 7 4.770 -0.940
SocieteGenerale 10 3.513 4,602 40 16 2.667 0.846
Natixis 11 3.431 4,494 40 14 3.029 0.402
MorganStanley 12 3.215 4,212 32 13 3.219 -0.004
UniCredit 13 3.185 4,173 42 11 3.388 -0.203
INGGroep 14 3.026 3,964 48 10 3.664 -0.638
Citi 15 2.726 3,571 28 17 1.824 0.902
RBCCapitalMarkets 16 2.603 3,409 30 18 1.784 0.819
UBS 17 2.100 2,751 22 15 2.936 -0.836
SumitomoMitsuiFinancial 18 2.084 2,730 24 28 0.793 1.291
DNBASA 19 1.997 2,616 8 31 0.529 1.468
NatWestMarkets 20 1.756 2,300 23 20 1.636 0.120
TOTAL 100% 130,998 288 100%
EMEALeveragedLoans(MandatedLeadArranger)FY2018 FY2017
Firm Rank MktShare(%) Volume(EURMln) DealCount PrevRank PrevMktShare(%) MktShareChg(%)
JPMorgan 1 7.046 10,004 63 1 8.241 -1.195
BNPParibas 2 6.644 9,433 97 5 5.487 1.157
DeutscheBank 3 6.542 9,289 62 2 7.069 -0.527
GoldmanSachs 4 6.141 8,719 61 3 6.405 -0.264
HSBC 5 5.361 7,612 65 6 5.283 0.078
Barclays 6 4.824 6,849 61 7 4.561 0.263
CreditSuisse 7 4.454 6,324 48 4 6.102 -1.648
BankofAmericaMerrillLynch 8 3.571 5,070 42 8 4.457 -0.886
CreditAgricoleCIB 9 3.497 4,965 69 10 3.483 0.014
INGGroep 10 3.439 4,883 69 11 3.480 -0.041
SocieteGenerale 11 3.321 4,715 55 16 2.631 0.690
Natixis 12 3.192 4,532 52 15 2.771 0.421
UniCredit 13 3.179 4,514 56 13 3.036 0.143
Citi 14 2.763 3,923 34 17 1.863 0.900
MorganStanley 15 2.280 3,237 33 12 3.054 -0.774
RBCCapitalMarkets 16 2.267 3,219 34 19 1.688 0.579
SumitomoMitsuiFinancial 17 2.211 3,139 36 30 0.723 1.488
UBS 18 1.917 2,722 22 14 2.897 -0.980
NatWestMarkets 19 1.895 2,691 31 18 1.752 0.143
Rabobank 20 1.676 2,379 25 20 1.611 0.065
TOTAL 100% 141,979 348 100%
Bloomberg EMEACapitalMarkets|FY2018
BloombergLeagueTableReports Page15
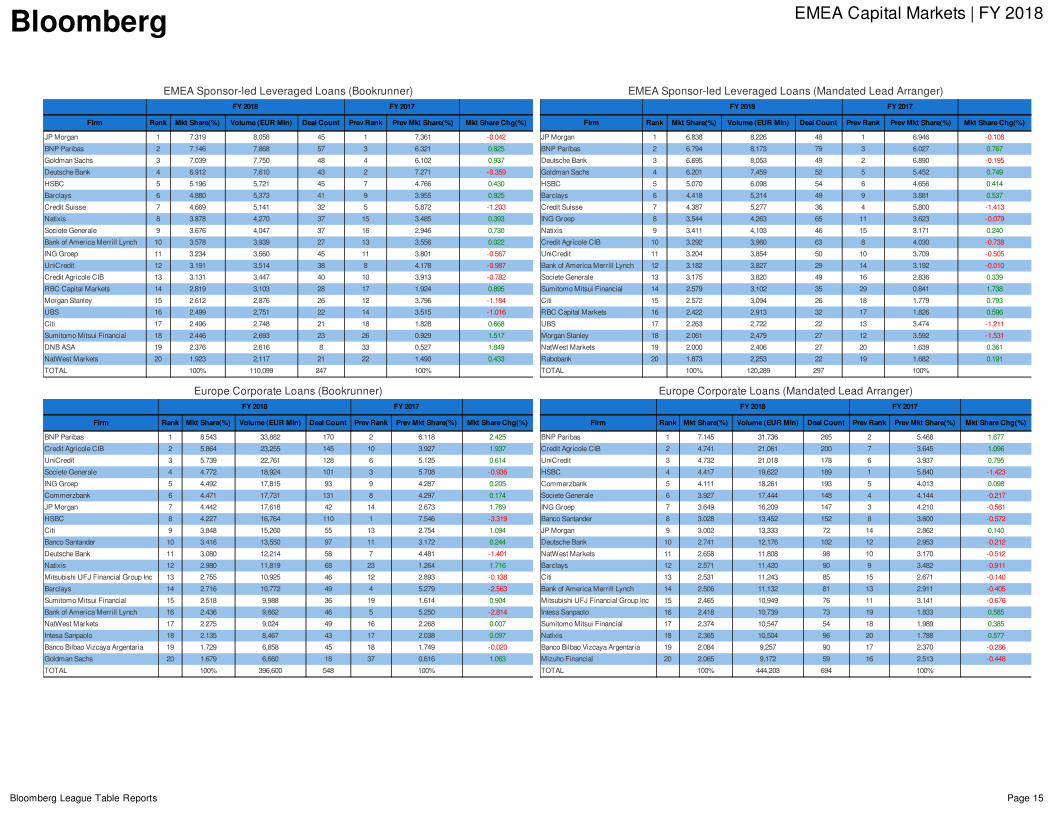
EMEASponsor-ledLeveragedLoans(Bookrunner)FY2018 FY2017
Firm Rank MktShare(%) Volume(EURMln) DealCount PrevRank PrevMktShare(%) MktShareChg(%)
JPMorgan 1 7.319 8,058 45 1 7.361 -0.042
BNPParibas 2 7.146 7,868 57 3 6.321 0.825
GoldmanSachs 3 7.039 7,750 48 4 6.102 0.937
DeutscheBank 4 6.912 7,610 43 2 7.271 -0.359
HSBC 5 5.196 5,721 45 7 4.766 0.430
Barclays 6 4.880 5,373 41 9 3.955 0.925
CreditSuisse 7 4.669 5,141 32 5 5.872 -1.203
Natixis 8 3.878 4,270 37 15 3.485 0.393
SocieteGenerale 9 3.676 4,047 37 16 2.946 0.730
BankofAmericaMerrillLynch 10 3.578 3,939 27 13 3.556 0.022
INGGroep 11 3.234 3,560 45 11 3.801 -0.567
UniCredit 12 3.191 3,514 38 8 4.178 -0.987
CreditAgricoleCIB 13 3.131 3,447 40 10 3.913 -0.782
RBCCapitalMarkets 14 2.819 3,103 28 17 1.924 0.895
MorganStanley 15 2.612 2,876 26 12 3.796 -1.184
UBS 16 2.499 2,751 22 14 3.515 -1.016
Citi 17 2.496 2,748 21 18 1.828 0.668
SumitomoMitsuiFinancial 18 2.446 2,693 23 26 0.929 1.517
DNBASA 19 2.376 2,616 8 33 0.527 1.849
NatWestMarkets 20 1.923 2,117 21 22 1.490 0.433
TOTAL 100% 110,099 247 100%
EMEASponsor-ledLeveragedLoans(MandatedLeadArranger)FY2018 FY2017
Firm Rank MktShare(%) Volume(EURMln) DealCount PrevRank PrevMktShare(%) MktShareChg(%)
JPMorgan 1 6.838 8,226 48 1 6.946 -0.108
BNPParibas 2 6.794 8,173 79 3 6.027 0.767
DeutscheBank 3 6.695 8,053 49 2 6.890 -0.195
GoldmanSachs 4 6.201 7,459 52 5 5.452 0.749
HSBC 5 5.070 6,098 54 6 4.656 0.414
Barclays 6 4.418 5,314 49 9 3.881 0.537
CreditSuisse 7 4.387 5,277 36 4 5.800 -1.413
INGGroep 8 3.544 4,263 65 11 3.623 -0.079
Natixis 9 3.411 4,103 46 15 3.171 0.240
CreditAgricoleCIB 10 3.292 3,960 63 8 4.030 -0.738
UniCredit 11 3.204 3,854 50 10 3.709 -0.505
BankofAmericaMerrillLynch 12 3.182 3,827 29 14 3.192 -0.010
SocieteGenerale 13 3.175 3,820 49 16 2.836 0.339
SumitomoMitsuiFinancial 14 2.579 3,102 35 29 0.841 1.738
Citi 15 2.572 3,094 26 18 1.779 0.793
RBCCapitalMarkets 16 2.422 2,913 32 17 1.826 0.596
UBS 17 2.263 2,722 22 13 3.474 -1.211
MorganStanley 18 2.061 2,479 27 12 3.592 -1.531
NatWestMarkets 19 2.000 2,406 27 20 1.639 0.361
Rabobank 20 1.873 2,253 22 19 1.682 0.191
TOTAL 100% 120,289 297 100%
EuropeCorporateLoans(Bookrunner)FY2018 FY2017
Firm Rank MktShare(%) Volume(EURMln) DealCount PrevRank PrevMktShare(%) MktShareChg(%)
BNPParibas 1 8.543 33,882 170 2 6.118 2.425
CreditAgricoleCIB 2 5.864 23,255 145 10 3.927 1.937
UniCredit 3 5.739 22,761 128 6 5.125 0.614
SocieteGenerale 4 4.772 18,924 101 3 5.708 -0.936
INGGroep 5 4.492 17,815 93 9 4.287 0.205
Commerzbank 6 4.471 17,731 131 8 4.297 0.174
JPMorgan 7 4.442 17,618 42 14 2.673 1.769
HSBC 8 4.227 16,764 110 1 7.546 -3.319
Citi 9 3.848 15,260 55 13 2.754 1.094
BancoSantander 10 3.416 13,550 97 11 3.172 0.244
DeutscheBank 11 3.080 12,214 58 7 4.481 -1.401
Natixis 12 2.980 11,819 68 23 1.264 1.716
MitsubishiUFJFinancialGroupInc 13 2.755 10,925 46 12 2.893 -0.138
Barclays 14 2.716 10,772 49 4 5.279 -2.563
SumitomoMitsuiFinancial 15 2.518 9,988 36 19 1.614 0.904
BankofAmericaMerrillLynch 16 2.436 9,662 46 5 5.250 -2.814
NatWestMarkets 17 2.275 9,024 49 16 2.268 0.007
IntesaSanpaolo 18 2.135 8,467 43 17 2.038 0.097
BancoBilbaoVizcayaArgentaria 19 1.729 6,858 45 18 1.749 -0.020
GoldmanSachs 20 1.679 6,660 18 37 0.616 1.063
TOTAL 100% 396,600 548 100%
EuropeCorporateLoans(MandatedLeadArranger)FY2018 FY2017
Firm Rank MktShare(%) Volume(EURMln) DealCount PrevRank PrevMktShare(%) MktShareChg(%)
BNPParibas 1 7.145 31,736 265 2 5.468 1.677
CreditAgricoleCIB 2 4.741 21,061 200 7 3.645 1.096
UniCredit 3 4.732 21,018 178 6 3.937 0.795
HSBC 4 4.417 19,622 189 1 5.840 -1.423
Commerzbank 5 4.111 18,261 193 5 4.013 0.098
SocieteGenerale 6 3.927 17,444 148 4 4.144 -0.217
INGGroep 7 3.649 16,209 147 3 4.210 -0.561
BancoSantander 8 3.028 13,452 152 8 3.600 -0.572
JPMorgan 9 3.002 13,333 72 14 2.862 0.140
DeutscheBank 10 2.741 12,176 102 12 2.953 -0.212
NatWestMarkets 11 2.658 11,808 98 10 3.170 -0.512
Barclays 12 2.571 11,420 90 9 3.482 -0.911
Citi 13 2.531 11,243 85 15 2.671 -0.140
BankofAmericaMerrillLynch 14 2.506 11,132 81 13 2.911 -0.405
MitsubishiUFJFinancialGroupInc 15 2.465 10,949 76 11 3.141 -0.676
IntesaSanpaolo 16 2.418 10,739 73 19 1.833 0.585
SumitomoMitsuiFinancial 17 2.374 10,547 54 18 1.989 0.385
Natixis 18 2.365 10,504 96 20 1.788 0.577
BancoBilbaoVizcayaArgentaria 19 2.084 9,257 90 17 2.370 -0.286
MizuhoFinancial 20 2.065 9,172 59 16 2.513 -0.448
TOTAL 100% 444,203 694 100%
Bloomberg EMEACapitalMarkets|FY2018
BloombergLeagueTableReports Page16
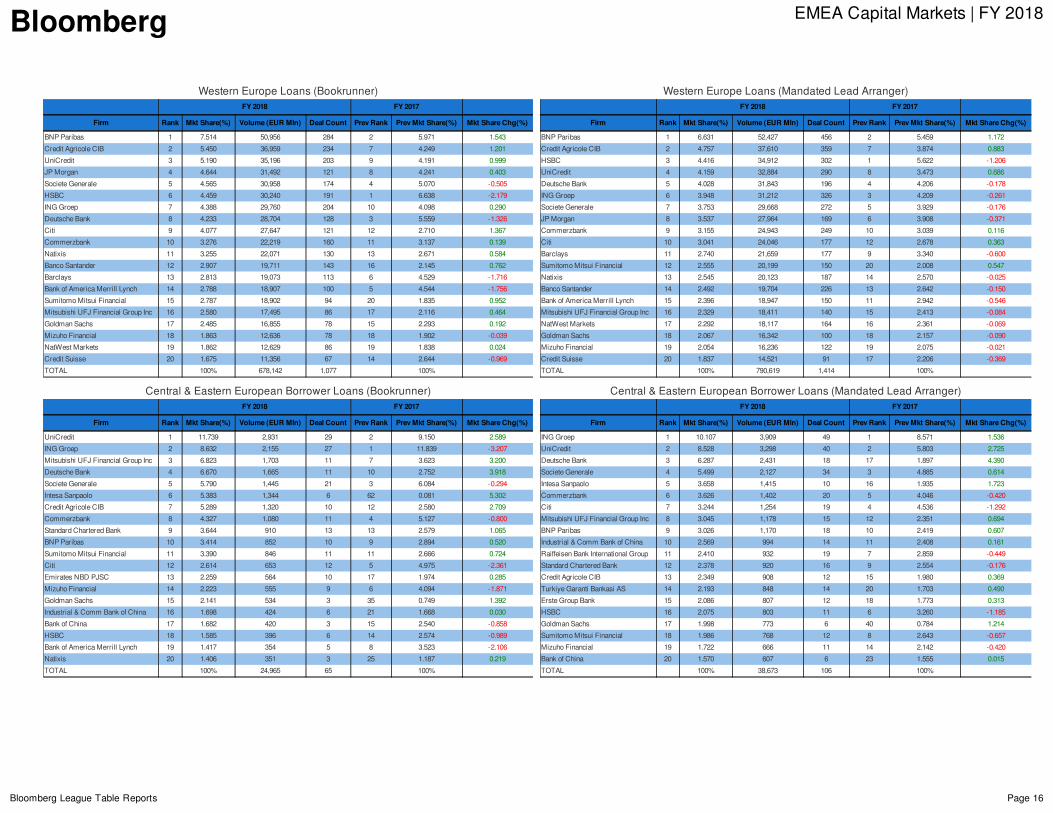
WesternEuropeLoans(Bookrunner)FY2018 FY2017
Firm Rank MktShare(%) Volume(EURMln) DealCount PrevRank PrevMktShare(%) MktShareChg(%)
BNPParibas 1 7.514 50,956 284 2 5.971 1.543
CreditAgricoleCIB 2 5.450 36,959 234 7 4.249 1.201
UniCredit 3 5.190 35,196 203 9 4.191 0.999
JPMorgan 4 4.644 31,492 121 8 4.241 0.403
SocieteGenerale 5 4.565 30,958 174 4 5.070 -0.505
HSBC 6 4.459 30,240 191 1 6.638 -2.179
INGGroep 7 4.388 29,760 204 10 4.098 0.290
DeutscheBank 8 4.233 28,704 128 3 5.559 -1.326
Citi 9 4.077 27,647 121 12 2.710 1.367
Commerzbank 10 3.276 22,219 160 11 3.137 0.139
Natixis 11 3.255 22,071 130 13 2.671 0.584
BancoSantander 12 2.907 19,711 143 16 2.145 0.762
Barclays 13 2.813 19,073 113 6 4.529 -1.716
BankofAmericaMerrillLynch 14 2.788 18,907 100 5 4.544 -1.756
SumitomoMitsuiFinancial 15 2.787 18,902 94 20 1.835 0.952
MitsubishiUFJFinancialGroupInc 16 2.580 17,495 86 17 2.116 0.464
GoldmanSachs 17 2.485 16,855 78 15 2.293 0.192
MizuhoFinancial 18 1.863 12,636 78 18 1.902 -0.039
NatWestMarkets 19 1.862 12,629 86 19 1.838 0.024
CreditSuisse 20 1.675 11,356 67 14 2.644 -0.969
TOTAL 100% 678,142 1,077 100%
WesternEuropeLoans(MandatedLeadArranger)FY2018 FY2017
Firm Rank MktShare(%) Volume(EURMln) DealCount PrevRank PrevMktShare(%) MktShareChg(%)
BNPParibas 1 6.631 52,427 456 2 5.459 1.172
CreditAgricoleCIB 2 4.757 37,610 359 7 3.874 0.883
HSBC 3 4.416 34,912 302 1 5.622 -1.206
UniCredit 4 4.159 32,884 290 8 3.473 0.686
DeutscheBank 5 4.028 31,843 196 4 4.206 -0.178
INGGroep 6 3.948 31,212 326 3 4.209 -0.261
SocieteGenerale 7 3.753 29,668 272 5 3.929 -0.176
JPMorgan 8 3.537 27,964 169 6 3.908 -0.371
Commerzbank 9 3.155 24,943 249 10 3.039 0.116
Citi 10 3.041 24,046 177 12 2.678 0.363
Barclays 11 2.740 21,659 177 9 3.340 -0.600
SumitomoMitsuiFinancial 12 2.555 20,199 150 20 2.008 0.547
Natixis 13 2.545 20,123 187 14 2.570 -0.025
BancoSantander 14 2.492 19,704 226 13 2.642 -0.150
BankofAmericaMerrillLynch 15 2.396 18,947 150 11 2.942 -0.546
MitsubishiUFJFinancialGroupInc 16 2.329 18,411 140 15 2.413 -0.084
NatWestMarkets 17 2.292 18,117 164 16 2.361 -0.069
GoldmanSachs 18 2.067 16,342 100 18 2.157 -0.090
MizuhoFinancial 19 2.054 16,236 122 19 2.075 -0.021
CreditSuisse 20 1.837 14,521 91 17 2.206 -0.369
TOTAL 100% 790,619 1,414 100%
Central&EasternEuropeanBorrowerLoans(Bookrunner)FY2018 FY2017
Firm Rank MktShare(%) Volume(EURMln) DealCount PrevRank PrevMktShare(%) MktShareChg(%)
UniCredit 1 11.739 2,931 29 2 9.150 2.589
INGGroep 2 8.632 2,155 27 1 11.839 -3.207
MitsubishiUFJFinancialGroupInc 3 6.823 1,703 11 7 3.623 3.200
DeutscheBank 4 6.670 1,665 11 10 2.752 3.918
SocieteGenerale 5 5.790 1,445 21 3 6.084 -0.294
IntesaSanpaolo 6 5.383 1,344 6 62 0.081 5.302
CreditAgricoleCIB 7 5.289 1,320 10 12 2.580 2.709
Commerzbank 8 4.327 1,080 11 4 5.127 -0.800
StandardCharteredBank 9 3.644 910 13 13 2.579 1.065
BNPParibas 10 3.414 852 10 9 2.894 0.520
SumitomoMitsuiFinancial 11 3.390 846 11 11 2.666 0.724
Citi 12 2.614 653 12 5 4.975 -2.361
EmiratesNBDPJSC 13 2.259 564 10 17 1.974 0.285
MizuhoFinancial 14 2.223 555 9 6 4.094 -1.871
GoldmanSachs 15 2.141 534 3 35 0.749 1.392
Industrial&CommBankofChina 16 1.698 424 6 21 1.668 0.030
BankofChina 17 1.682 420 3 15 2.540 -0.858
HSBC 18 1.585 396 6 14 2.574 -0.989
BankofAmericaMerrillLynch 19 1.417 354 5 8 3.523 -2.106
Natixis 20 1.406 351 3 25 1.187 0.219
TOTAL 100% 24,965 65 100%
Central&EasternEuropeanBorrowerLoans(MandatedLeadArranger)FY2018 FY2017
Firm Rank MktShare(%) Volume(EURMln) DealCount PrevRank PrevMktShare(%) MktShareChg(%)
INGGroep 1 10.107 3,909 49 1 8.571 1.536
UniCredit 2 8.528 3,298 40 2 5.803 2.725
DeutscheBank 3 6.287 2,431 18 17 1.897 4.390
SocieteGenerale 4 5.499 2,127 34 3 4.885 0.614
IntesaSanpaolo 5 3.658 1,415 10 16 1.935 1.723
Commerzbank 6 3.626 1,402 20 5 4.046 -0.420
Citi 7 3.244 1,254 19 4 4.536 -1.292
MitsubishiUFJFinancialGroupInc 8 3.045 1,178 15 12 2.351 0.694
BNPParibas 9 3.026 1,170 18 10 2.419 0.607
Industrial&CommBankofChina 10 2.569 994 14 11 2.408 0.161
RaiffeisenBankInternationalGroup 11 2.410 932 19 7 2.859 -0.449
StandardCharteredBank 12 2.378 920 16 9 2.554 -0.176
CreditAgricoleCIB 13 2.349 908 12 15 1.980 0.369
TurkiyeGarantiBankasiAS 14 2.193 848 14 20 1.703 0.490
ErsteGroupBank 15 2.086 807 12 18 1.773 0.313
HSBC 16 2.075 803 11 6 3.260 -1.185
GoldmanSachs 17 1.998 773 6 40 0.784 1.214
SumitomoMitsuiFinancial 18 1.986 768 12 8 2.643 -0.657
MizuhoFinancial 19 1.722 666 11 14 2.142 -0.420
BankofChina 20 1.570 607 6 23 1.555 0.015
TOTAL 100% 38,673 106 100%
Bloomberg EMEACapitalMarkets|FY2018
BloombergLeagueTableReports Page17
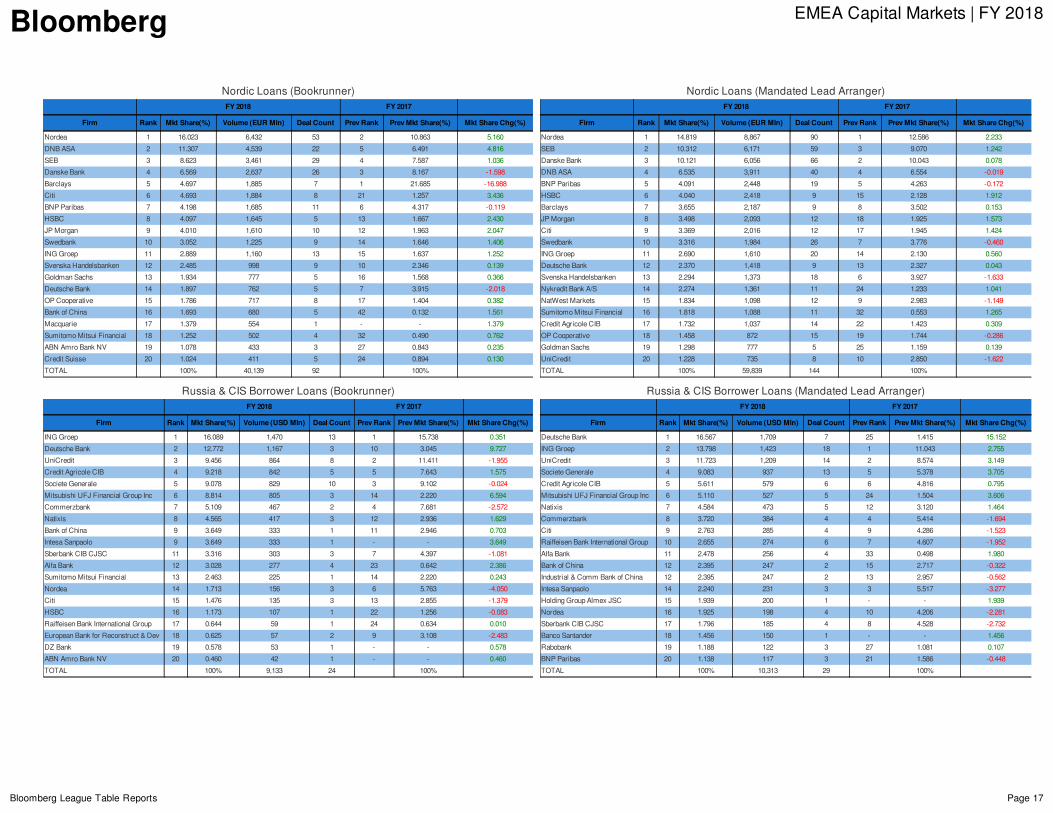
NordicLoans(Bookrunner)FY2018 FY2017
Firm Rank MktShare(%) Volume(EURMln) DealCount PrevRank PrevMktShare(%) MktShareChg(%)
Nordea 1 16.023 6,432 53 2 10.863 5.160
DNBASA 2 11.307 4,539 22 5 6.491 4.816
SEB 3 8.623 3,461 29 4 7.587 1.036
DanskeBank 4 6.569 2,637 26 3 8.167 -1.598
Barclays 5 4.697 1,885 7 1 21.685 -16.988
Citi 6 4.693 1,884 8 21 1.257 3.436
BNPParibas 7 4.198 1,685 11 6 4.317 -0.119
HSBC 8 4.097 1,645 5 13 1.667 2.430
JPMorgan 9 4.010 1,610 10 12 1.963 2.047
Swedbank 10 3.052 1,225 9 14 1.646 1.406
INGGroep 11 2.889 1,160 13 15 1.637 1.252
SvenskaHandelsbanken 12 2.485 998 9 10 2.346 0.139
GoldmanSachs 13 1.934 777 5 16 1.568 0.366
DeutscheBank 14 1.897 762 5 7 3.915 -2.018
OPCooperative 15 1.786 717 8 17 1.404 0.382
BankofChina 16 1.693 680 5 42 0.132 1.561
Macquarie 17 1.379 554 1 - - 1.379
SumitomoMitsuiFinancial 18 1.252 502 4 32 0.490 0.762
ABNAmroBankNV 19 1.078 433 3 27 0.843 0.235
CreditSuisse 20 1.024 411 5 24 0.894 0.130
TOTAL 100% 40,139 92 100%
NordicLoans(MandatedLeadArranger)FY2018 FY2017
Firm Rank MktShare(%) Volume(EURMln) DealCount PrevRank PrevMktShare(%) MktShareChg(%)
Nordea 1 14.819 8,867 90 1 12.586 2.233
SEB 2 10.312 6,171 59 3 9.070 1.242
DanskeBank 3 10.121 6,056 66 2 10.043 0.078
DNBASA 4 6.535 3,911 40 4 6.554 -0.019
BNPParibas 5 4.091 2,448 19 5 4.263 -0.172
HSBC 6 4.040 2,418 9 15 2.128 1.912
Barclays 7 3.655 2,187 9 8 3.502 0.153
JPMorgan 8 3.498 2,093 12 18 1.925 1.573
Citi 9 3.369 2,016 12 17 1.945 1.424
Swedbank 10 3.316 1,984 26 7 3.776 -0.460
INGGroep 11 2.690 1,610 20 14 2.130 0.560
DeutscheBank 12 2.370 1,418 9 13 2.327 0.043
SvenskaHandelsbanken 13 2.294 1,373 18 6 3.927 -1.633
NykreditBankA/S 14 2.274 1,361 11 24 1.233 1.041
NatWestMarkets 15 1.834 1,098 12 9 2.983 -1.149
SumitomoMitsuiFinancial 16 1.818 1,088 11 32 0.553 1.265
CreditAgricoleCIB 17 1.732 1,037 14 22 1.423 0.309
OPCooperative 18 1.458 872 15 19 1.744 -0.286
GoldmanSachs 19 1.298 777 5 25 1.159 0.139
UniCredit 20 1.228 735 8 10 2.850 -1.622
TOTAL 100% 59,839 144 100%
Russia&CISBorrowerLoans(Bookrunner)FY2018 FY2017
Firm Rank MktShare(%) Volume(USDMln) DealCount PrevRank PrevMktShare(%) MktShareChg(%)
INGGroep 1 16.089 1,470 13 1 15.738 0.351
DeutscheBank 2 12.772 1,167 3 10 3.045 9.727
UniCredit 3 9.456 864 8 2 11.411 -1.955
CreditAgricoleCIB 4 9.218 842 5 5 7.643 1.575
SocieteGenerale 5 9.078 829 10 3 9.102 -0.024
MitsubishiUFJFinancialGroupInc 6 8.814 805 3 14 2.220 6.594
Commerzbank 7 5.109 467 2 4 7.681 -2.572
Natixis 8 4.565 417 3 12 2.936 1.629
BankofChina 9 3.649 333 1 11 2.946 0.703
IntesaSanpaolo 9 3.649 333 1 - - 3.649
SberbankCIBCJSC 11 3.316 303 3 7 4.397 -1.081
AlfaBank 12 3.028 277 4 23 0.642 2.386
SumitomoMitsuiFinancial 13 2.463 225 1 14 2.220 0.243
Nordea 14 1.713 156 3 6 5.763 -4.050
Citi 15 1.476 135 3 13 2.855 -1.379
HSBC 16 1.173 107 1 22 1.256 -0.083
RaiffeisenBankInternationalGroup 17 0.644 59 1 24 0.634 0.010
EuropeanBankforReconstruct&Dev 18 0.625 57 2 9 3.108 -2.483
DZBank 19 0.578 53 1 - - 0.578
ABNAmroBankNV 20 0.460 42 1 - - 0.460
TOTAL 100% 9,133 24 100%
Russia&CISBorrowerLoans(MandatedLeadArranger)FY2018 FY2017
Firm Rank MktShare(%) Volume(USDMln) DealCount PrevRank PrevMktShare(%) MktShareChg(%)
DeutscheBank 1 16.567 1,709 7 25 1.415 15.152
INGGroep 2 13.798 1,423 18 1 11.043 2.755
UniCredit 3 11.723 1,209 14 2 8.574 3.149
SocieteGenerale 4 9.083 937 13 5 5.378 3.705
CreditAgricoleCIB 5 5.611 579 6 6 4.816 0.795
MitsubishiUFJFinancialGroupInc 6 5.110 527 5 24 1.504 3.606
Natixis 7 4.584 473 5 12 3.120 1.464
Commerzbank 8 3.720 384 4 4 5.414 -1.694
Citi 9 2.763 285 4 9 4.286 -1.523
RaiffeisenBankInternationalGroup 10 2.655 274 6 7 4.607 -1.952
AlfaBank 11 2.478 256 4 33 0.498 1.980
BankofChina 12 2.395 247 2 15 2.717 -0.322
Industrial&CommBankofChina 12 2.395 247 2 13 2.957 -0.562
IntesaSanpaolo 14 2.240 231 3 3 5.517 -3.277
HoldingGroupAlmexJSC 15 1.939 200 1 - - 1.939
Nordea 16 1.925 198 4 10 4.206 -2.281
SberbankCIBCJSC 17 1.796 185 4 8 4.528 -2.732
BancoSantander 18 1.456 150 1 - - 1.456
Rabobank 19 1.188 122 3 27 1.081 0.107
BNPParibas 20 1.138 117 3 21 1.586 -0.448
TOTAL 100% 10,313 29 100%
Bloomberg EMEACapitalMarkets|FY2018
BloombergLeagueTableReports Page18
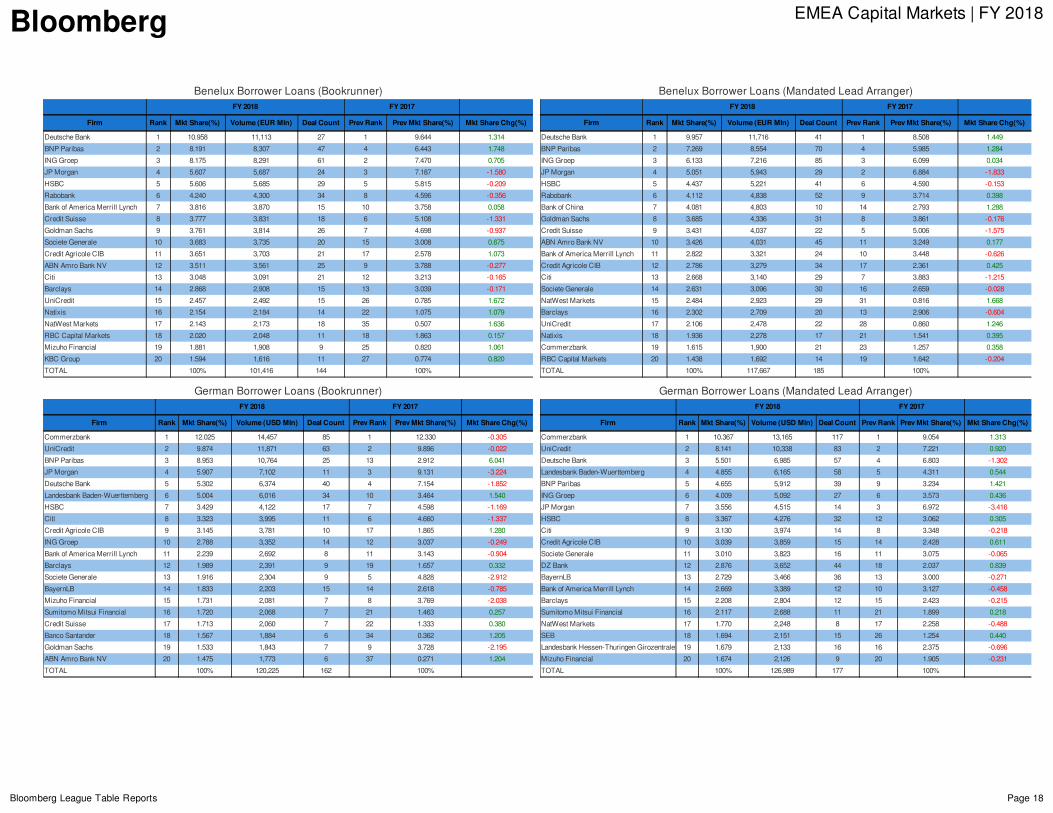
BeneluxBorrowerLoans(Bookrunner)FY2018 FY2017
Firm Rank MktShare(%) Volume(EURMln) DealCount PrevRank PrevMktShare(%) MktShareChg(%)
DeutscheBank 1 10.958 11,113 27 1 9.644 1.314
BNPParibas 2 8.191 8,307 47 4 6.443 1.748
INGGroep 3 8.175 8,291 61 2 7.470 0.705
JPMorgan 4 5.607 5,687 24 3 7.187 -1.580
HSBC 5 5.606 5,685 29 5 5.815 -0.209
Rabobank 6 4.240 4,300 34 8 4.596 -0.356
BankofAmericaMerrillLynch 7 3.816 3,870 15 10 3.758 0.058
CreditSuisse 8 3.777 3,831 18 6 5.108 -1.331
GoldmanSachs 9 3.761 3,814 26 7 4.698 -0.937
SocieteGenerale 10 3.683 3,735 20 15 3.008 0.675
CreditAgricoleCIB 11 3.651 3,703 21 17 2.578 1.073
ABNAmroBankNV 12 3.511 3,561 25 9 3.788 -0.277
Citi 13 3.048 3,091 21 12 3.213 -0.165
Barclays 14 2.868 2,908 15 13 3.039 -0.171
UniCredit 15 2.457 2,492 15 26 0.785 1.672
Natixis 16 2.154 2,184 14 22 1.075 1.079
NatWestMarkets 17 2.143 2,173 18 35 0.507 1.636
RBCCapitalMarkets 18 2.020 2,048 11 18 1.863 0.157
MizuhoFinancial 19 1.881 1,908 9 25 0.820 1.061
KBCGroup 20 1.594 1,616 11 27 0.774 0.820
TOTAL 100% 101,416 144 100%
BeneluxBorrowerLoans(MandatedLeadArranger)FY2018 FY2017
Firm Rank MktShare(%) Volume(EURMln) DealCount PrevRank PrevMktShare(%) MktShareChg(%)
DeutscheBank 1 9.957 11,716 41 1 8.508 1.449
BNPParibas 2 7.269 8,554 70 4 5.985 1.284
INGGroep 3 6.133 7,216 85 3 6.099 0.034
JPMorgan 4 5.051 5,943 29 2 6.884 -1.833
HSBC 5 4.437 5,221 41 6 4.590 -0.153
Rabobank 6 4.112 4,838 52 9 3.714 0.398
BankofChina 7 4.081 4,803 10 14 2.793 1.288
GoldmanSachs 8 3.685 4,336 31 8 3.861 -0.176
CreditSuisse 9 3.431 4,037 22 5 5.006 -1.575
ABNAmroBankNV 10 3.426 4,031 45 11 3.249 0.177
BankofAmericaMerrillLynch 11 2.822 3,321 24 10 3.448 -0.626
CreditAgricoleCIB 12 2.786 3,279 34 17 2.361 0.425
Citi 13 2.668 3,140 29 7 3.883 -1.215
SocieteGenerale 14 2.631 3,096 30 16 2.659 -0.028
NatWestMarkets 15 2.484 2,923 29 31 0.816 1.668
Barclays 16 2.302 2,709 20 13 2.906 -0.604
UniCredit 17 2.106 2,478 22 28 0.860 1.246
Natixis 18 1.936 2,278 17 21 1.541 0.395
Commerzbank 19 1.615 1,900 21 23 1.257 0.358
RBCCapitalMarkets 20 1.438 1,692 14 19 1.642 -0.204
TOTAL 100% 117,667 185 100%
GermanBorrowerLoans(Bookrunner)FY2018 FY2017
Firm Rank MktShare(%) Volume(USDMln) DealCount PrevRank PrevMktShare(%) MktShareChg(%)
Commerzbank 1 12.025 14,457 85 1 12.330 -0.305
UniCredit 2 9.874 11,871 63 2 9.896 -0.022
BNPParibas 3 8.953 10,764 25 13 2.912 6.041
JPMorgan 4 5.907 7,102 11 3 9.131 -3.224
DeutscheBank 5 5.302 6,374 40 4 7.154 -1.852
LandesbankBaden-Wuerttemberg 6 5.004 6,016 34 10 3.464 1.540
HSBC 7 3.429 4,122 17 7 4.598 -1.169
Citi 8 3.323 3,995 11 6 4.660 -1.337
CreditAgricoleCIB 9 3.145 3,781 10 17 1.865 1.280
INGGroep 10 2.788 3,352 14 12 3.037 -0.249
BankofAmericaMerrillLynch 11 2.239 2,692 8 11 3.143 -0.904
Barclays 12 1.989 2,391 9 19 1.657 0.332
SocieteGenerale 13 1.916 2,304 9 5 4.828 -2.912
BayernLB 14 1.833 2,203 15 14 2.618 -0.785
MizuhoFinancial 15 1.731 2,081 7 8 3.769 -2.038
SumitomoMitsuiFinancial 16 1.720 2,068 7 21 1.463 0.257
CreditSuisse 17 1.713 2,060 7 22 1.333 0.380
BancoSantander 18 1.567 1,884 6 34 0.362 1.205
GoldmanSachs 19 1.533 1,843 7 9 3.728 -2.195
ABNAmroBankNV 20 1.475 1,773 6 37 0.271 1.204
TOTAL 100% 120,225 162 100%
GermanBorrowerLoans(MandatedLeadArranger)FY2018 FY2017
Firm Rank MktShare(%) Volume(USDMln) DealCount PrevRank PrevMktShare(%) MktShareChg(%)
Commerzbank 1 10.367 13,165 117 1 9.054 1.313
UniCredit 2 8.141 10,338 83 2 7.221 0.920
DeutscheBank 3 5.501 6,985 57 4 6.803 -1.302
LandesbankBaden-Wuerttemberg 4 4.855 6,165 58 5 4.311 0.544
BNPParibas 5 4.655 5,912 39 9 3.234 1.421
INGGroep 6 4.009 5,092 27 6 3.573 0.436
JPMorgan 7 3.556 4,515 14 3 6.972 -3.416
HSBC 8 3.367 4,276 32 12 3.062 0.305
Citi 9 3.130 3,974 14 8 3.348 -0.218
CreditAgricoleCIB 10 3.039 3,859 15 14 2.428 0.611
SocieteGenerale 11 3.010 3,823 16 11 3.075 -0.065
DZBank 12 2.876 3,652 44 18 2.037 0.839
BayernLB 13 2.729 3,466 36 13 3.000 -0.271
BankofAmericaMerrillLynch 14 2.669 3,389 12 10 3.127 -0.458
Barclays 15 2.208 2,804 12 15 2.423 -0.215
SumitomoMitsuiFinancial 16 2.117 2,688 11 21 1.899 0.218
NatWestMarkets 17 1.770 2,248 8 17 2.258 -0.488
SEB 18 1.694 2,151 15 26 1.254 0.440
LandesbankHessen-ThuringenGirozentrale 19 1.679 2,133 16 16 2.375 -0.696
MizuhoFinancial 20 1.674 2,126 9 20 1.905 -0.231
TOTAL 100% 126,989 177 100%
Bloomberg EMEACapitalMarkets|FY2018
BloombergLeagueTableReports Page19
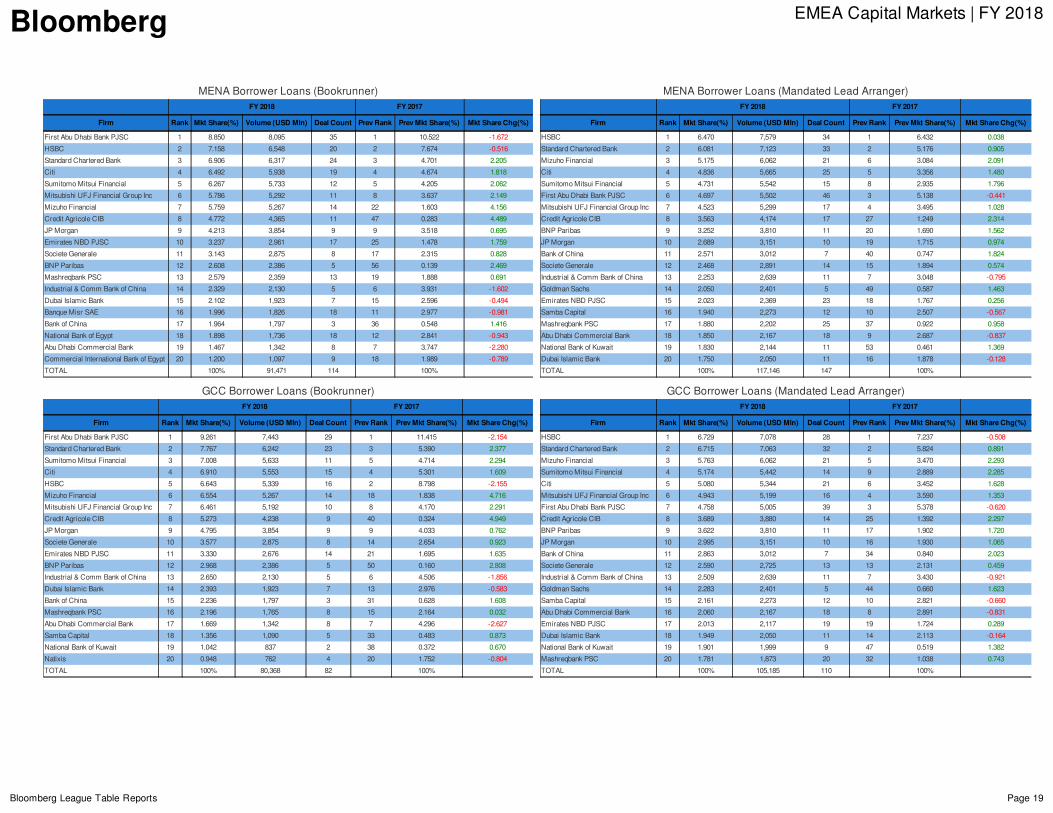
MENABorrowerLoans(Bookrunner)FY2018 FY2017
Firm Rank MktShare(%) Volume(USDMln) DealCount PrevRank PrevMktShare(%) MktShareChg(%)
FirstAbuDhabiBankPJSC 1 8.850 8,095 35 1 10.522 -1.672
HSBC 2 7.158 6,548 20 2 7.674 -0.516
StandardCharteredBank 3 6.906 6,317 24 3 4.701 2.205
Citi 4 6.492 5,938 19 4 4.674 1.818
SumitomoMitsuiFinancial 5 6.267 5,733 12 5 4.205 2.062
MitsubishiUFJFinancialGroupInc 6 5.786 5,292 11 8 3.637 2.149
MizuhoFinancial 7 5.759 5,267 14 22 1.603 4.156
CreditAgricoleCIB 8 4.772 4,365 11 47 0.283 4.489
JPMorgan 9 4.213 3,854 9 9 3.518 0.695
EmiratesNBDPJSC 10 3.237 2,961 17 25 1.478 1.759
SocieteGenerale 11 3.143 2,875 8 17 2.315 0.828
BNPParibas 12 2.608 2,386 5 56 0.139 2.469
MashreqbankPSC 13 2.579 2,359 13 19 1.888 0.691
Industrial&CommBankofChina 14 2.329 2,130 5 6 3.931 -1.602
DubaiIslamicBank 15 2.102 1,923 7 15 2.596 -0.494
BanqueMisrSAE 16 1.996 1,826 18 11 2.977 -0.981
BankofChina 17 1.964 1,797 3 36 0.548 1.416
NationalBankofEgypt 18 1.898 1,736 18 12 2.841 -0.943
AbuDhabiCommercialBank 19 1.467 1,342 8 7 3.747 -2.280
CommercialInternationalBankofEgypt 20 1.200 1,097 9 18 1.989 -0.789
TOTAL 100% 91,471 114 100%
MENABorrowerLoans(MandatedLeadArranger)FY2018 FY2017
Firm Rank MktShare(%) Volume(USDMln) DealCount PrevRank PrevMktShare(%) MktShareChg(%)
HSBC 1 6.470 7,579 34 1 6.432 0.038
StandardCharteredBank 2 6.081 7,123 33 2 5.176 0.905
MizuhoFinancial 3 5.175 6,062 21 6 3.084 2.091
Citi 4 4.836 5,665 25 5 3.356 1.480
SumitomoMitsuiFinancial 5 4.731 5,542 15 8 2.935 1.796
FirstAbuDhabiBankPJSC 6 4.697 5,502 46 3 5.138 -0.441
MitsubishiUFJFinancialGroupInc 7 4.523 5,299 17 4 3.495 1.028
CreditAgricoleCIB 8 3.563 4,174 17 27 1.249 2.314
BNPParibas 9 3.252 3,810 11 20 1.690 1.562
JPMorgan 10 2.689 3,151 10 19 1.715 0.974
BankofChina 11 2.571 3,012 7 40 0.747 1.824
SocieteGenerale 12 2.468 2,891 14 15 1.894 0.574
Industrial&CommBankofChina 13 2.253 2,639 11 7 3.048 -0.795
GoldmanSachs 14 2.050 2,401 5 49 0.587 1.463
EmiratesNBDPJSC 15 2.023 2,369 23 18 1.767 0.256
SambaCapital 16 1.940 2,273 12 10 2.507 -0.567
MashreqbankPSC 17 1.880 2,202 25 37 0.922 0.958
AbuDhabiCommercialBank 18 1.850 2,167 18 9 2.687 -0.837
NationalBankofKuwait 19 1.830 2,144 11 53 0.461 1.369
DubaiIslamicBank 20 1.750 2,050 11 16 1.878 -0.128
TOTAL 100% 117,146 147 100%
GCCBorrowerLoans(Bookrunner)FY2018 FY2017
Firm Rank MktShare(%) Volume(USDMln) DealCount PrevRank PrevMktShare(%) MktShareChg(%)
FirstAbuDhabiBankPJSC 1 9.261 7,443 29 1 11.415 -2.154
StandardCharteredBank 2 7.767 6,242 23 3 5.390 2.377
SumitomoMitsuiFinancial 3 7.008 5,633 11 5 4.714 2.294
Citi 4 6.910 5,553 15 4 5.301 1.609
HSBC 5 6.643 5,339 16 2 8.798 -2.155
MizuhoFinancial 6 6.554 5,267 14 18 1.838 4.716
MitsubishiUFJFinancialGroupInc 7 6.461 5,192 10 8 4.170 2.291
CreditAgricoleCIB 8 5.273 4,238 9 40 0.324 4.949
JPMorgan 9 4.795 3,854 9 9 4.033 0.762
SocieteGenerale 10 3.577 2,875 8 14 2.654 0.923
EmiratesNBDPJSC 11 3.330 2,676 14 21 1.695 1.635
BNPParibas 12 2.968 2,386 5 50 0.160 2.808
Industrial&CommBankofChina 13 2.650 2,130 5 6 4.506 -1.856
DubaiIslamicBank 14 2.393 1,923 7 13 2.976 -0.583
BankofChina 15 2.236 1,797 3 31 0.628 1.608
MashreqbankPSC 16 2.196 1,765 8 15 2.164 0.032
AbuDhabiCommercialBank 17 1.669 1,342 8 7 4.296 -2.627
SambaCapital 18 1.356 1,090 5 33 0.483 0.873
NationalBankofKuwait 19 1.042 837 2 38 0.372 0.670
Natixis 20 0.948 762 4 20 1.752 -0.804
TOTAL 100% 80,368 82 100%
GCCBorrowerLoans(MandatedLeadArranger)FY2018 FY2017
Firm Rank MktShare(%) Volume(USDMln) DealCount PrevRank PrevMktShare(%) MktShareChg(%)
HSBC 1 6.729 7,078 28 1 7.237 -0.508
StandardCharteredBank 2 6.715 7,063 32 2 5.824 0.891
MizuhoFinancial 3 5.763 6,062 21 5 3.470 2.293
SumitomoMitsuiFinancial 4 5.174 5,442 14 9 2.889 2.285
Citi 5 5.080 5,344 21 6 3.452 1.628
MitsubishiUFJFinancialGroupInc 6 4.943 5,199 16 4 3.590 1.353
FirstAbuDhabiBankPJSC 7 4.758 5,005 39 3 5.378 -0.620
CreditAgricoleCIB 8 3.689 3,880 14 25 1.392 2.297
BNPParibas 9 3.622 3,810 11 17 1.902 1.720
JPMorgan 10 2.995 3,151 10 16 1.930 1.065
BankofChina 11 2.863 3,012 7 34 0.840 2.023
SocieteGenerale 12 2.590 2,725 13 13 2.131 0.459
Industrial&CommBankofChina 13 2.509 2,639 11 7 3.430 -0.921
GoldmanSachs 14 2.283 2,401 5 44 0.660 1.623
SambaCapital 15 2.161 2,273 12 10 2.821 -0.660
AbuDhabiCommercialBank 16 2.060 2,167 18 8 2.891 -0.831
EmiratesNBDPJSC 17 2.013 2,117 19 19 1.724 0.289
DubaiIslamicBank 18 1.949 2,050 11 14 2.113 -0.164
NationalBankofKuwait 19 1.901 1,999 9 47 0.519 1.382
MashreqbankPSC 20 1.781 1,873 20 32 1.038 0.743
TOTAL 100% 105,185 110 100%
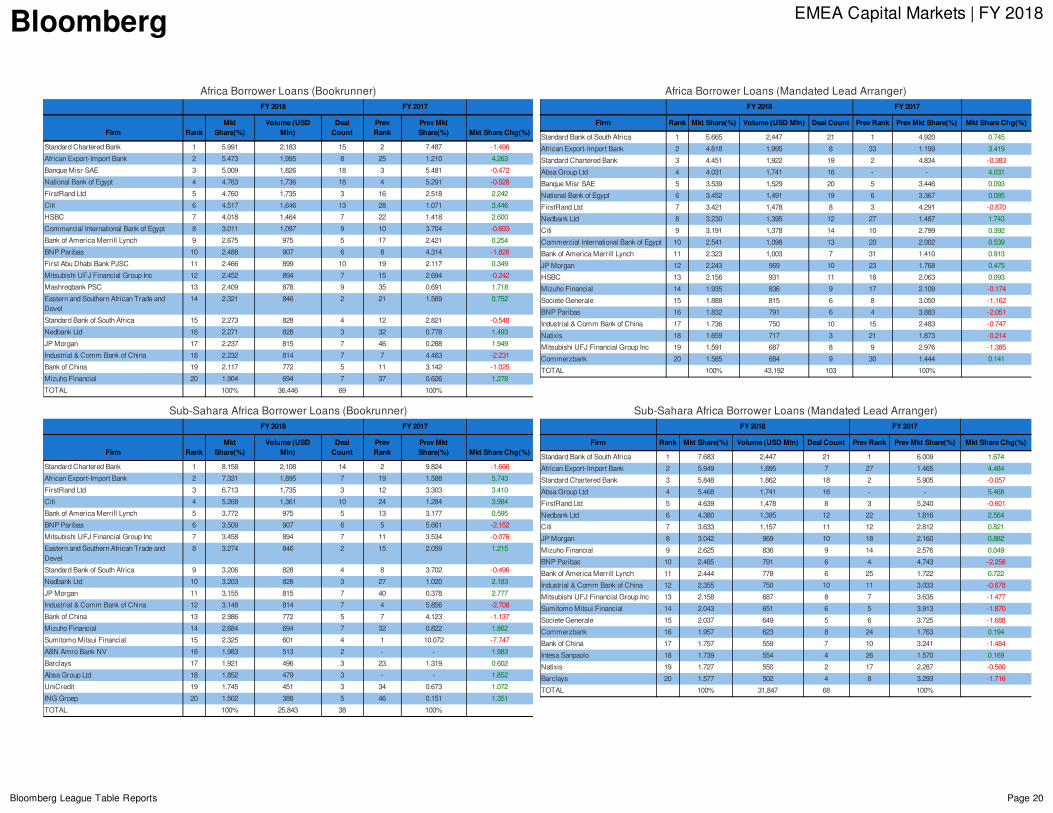
Bloomberg EMEACapitalMarkets|FY2018
BloombergLeagueTableReports Page20
AfricaBorrowerLoans(Bookrunner)FY2018 FY2017
Firm RankMkt
Share(%)Volume(USD
Mln)DealCount
PrevRank
PrevMktShare(%) MktShareChg(%)
StandardCharteredBank 1 5.991 2,183 15 2 7.487 -1.496
AfricanExport-ImportBank 2 5.473 1,995 8 25 1.210 4.263
BanqueMisrSAE 3 5.009 1,826 18 3 5.481 -0.472
NationalBankofEgypt 4 4.763 1,736 18 4 5.291 -0.528
FirstRandLtd 5 4.760 1,735 3 16 2.518 2.242
Citi 6 4.517 1,646 13 28 1.071 3.446
HSBC 7 4.018 1,464 7 22 1.418 2.600
CommercialInternationalBankofEgypt 8 3.011 1,097 9 10 3.704 -0.693
BankofAmericaMerrillLynch 9 2.675 975 5 17 2.421 0.254
BNPParibas 10 2.488 907 6 8 4.314 -1.826
FirstAbuDhabiBankPJSC 11 2.466 899 10 19 2.117 0.349
MitsubishiUFJFinancialGroupInc 12 2.452 894 7 15 2.694 -0.242
MashreqbankPSC 13 2.409 878 9 35 0.691 1.718
EasternandSouthernAfricanTradeandDevel
14 2.321 846 2 21 1.569 0.752
StandardBankofSouthAfrica 15 2.273 828 4 12 2.821 -0.548
NedbankLtd 16 2.271 828 3 32 0.778 1.493
JPMorgan 17 2.237 815 7 46 0.288 1.949
Industrial&CommBankofChina 18 2.232 814 7 7 4.463 -2.231
BankofChina 19 2.117 772 5 11 3.142 -1.025
MizuhoFinancial 20 1.904 694 7 37 0.626 1.278
TOTAL 100% 36,446 69 100%
AfricaBorrowerLoans(MandatedLeadArranger)FY2018 FY2017
Firm Rank MktShare(%) Volume(USDMln) DealCount PrevRank PrevMktShare(%) MktShareChg(%)
StandardBankofSouthAfrica 1 5.665 2,447 21 1 4.920 0.745
AfricanExport-ImportBank 2 4.618 1,995 8 33 1.199 3.419
StandardCharteredBank 3 4.451 1,922 19 2 4.834 -0.383
AbsaGroupLtd 4 4.031 1,741 16 - - 4.031
BanqueMisrSAE 5 3.539 1,529 20 5 3.446 0.093
NationalBankofEgypt 6 3.452 1,491 19 6 3.367 0.085
FirstRandLtd 7 3.421 1,478 8 3 4.291 -0.870
NedbankLtd 8 3.230 1,395 12 27 1.487 1.743
Citi 9 3.191 1,378 14 10 2.799 0.392
CommercialInternationalBankofEgypt 10 2.541 1,098 13 20 2.002 0.539
BankofAmericaMerrillLynch 11 2.323 1,003 7 31 1.410 0.913
JPMorgan 12 2.243 969 10 23 1.768 0.475
HSBC 13 2.156 931 11 18 2.063 0.093
MizuhoFinancial 14 1.935 836 9 17 2.109 -0.174
SocieteGenerale 15 1.888 815 6 8 3.050 -1.162
BNPParibas 16 1.832 791 6 4 3.883 -2.051
Industrial&CommBankofChina 17 1.736 750 10 15 2.483 -0.747
Natixis 18 1.659 717 3 21 1.873 -0.214
MitsubishiUFJFinancialGroupInc 19 1.591 687 8 9 2.976 -1.385
Commerzbank 20 1.585 684 9 30 1.444 0.141
TOTAL 100% 43,192 103 100%
Sub-SaharaAfricaBorrowerLoans(Bookrunner)FY2018 FY2017
Firm RankMkt
Share(%)Volume(USD
Mln)DealCount
PrevRank
PrevMktShare(%) MktShareChg(%)
StandardCharteredBank 1 8.158 2,108 14 2 9.824 -1.666
AfricanExport-ImportBank 2 7.331 1,895 7 19 1.588 5.743
FirstRandLtd 3 6.713 1,735 3 12 3.303 3.410
Citi 4 5.268 1,361 10 24 1.284 3.984
BankofAmericaMerrillLynch 5 3.772 975 5 13 3.177 0.595
BNPParibas 6 3.509 907 6 5 5.661 -2.152
MitsubishiUFJFinancialGroupInc 7 3.458 894 7 11 3.534 -0.076
EasternandSouthernAfricanTradeandDevel
8 3.274 846 2 15 2.059 1.215
StandardBankofSouthAfrica 9 3.206 828 4 8 3.702 -0.496
NedbankLtd 10 3.203 828 3 27 1.020 2.183
JPMorgan 11 3.155 815 7 40 0.378 2.777
Industrial&CommBankofChina 12 3.148 814 7 4 5.856 -2.708
BankofChina 13 2.986 772 5 7 4.123 -1.137
MizuhoFinancial 14 2.684 694 7 32 0.822 1.862
SumitomoMitsuiFinancial 15 2.325 601 4 1 10.072 -7.747
ABNAmroBankNV 16 1.983 513 2 - - 1.983
Barclays 17 1.921 496 3 23 1.319 0.602
AbsaGroupLtd 18 1.852 479 3 - - 1.852
UniCredit 19 1.745 451 3 34 0.673 1.072
INGGroep 20 1.502 388 5 46 0.151 1.351
TOTAL 100% 25,843 38 100%
Sub-SaharaAfricaBorrowerLoans(MandatedLeadArranger)FY2018 FY2017
Firm Rank MktShare(%) Volume(USDMln) DealCount PrevRank PrevMktShare(%) MktShareChg(%)
StandardBankofSouthAfrica 1 7.683 2,447 21 1 6.009 1.674
AfricanExport-ImportBank 2 5.949 1,895 7 27 1.465 4.484
StandardCharteredBank 3 5.848 1,862 18 2 5.905 -0.057
AbsaGroupLtd 4 5.468 1,741 16 - - 5.468
FirstRandLtd 5 4.639 1,478 8 3 5.240 -0.601
NedbankLtd 6 4.380 1,395 12 22 1.816 2.564
Citi 7 3.633 1,157 11 12 2.812 0.821
JPMorgan 8 3.042 969 10 18 2.160 0.882
MizuhoFinancial 9 2.625 836 9 14 2.576 0.049
BNPParibas 10 2.485 791 6 4 4.743 -2.258
BankofAmericaMerrillLynch 11 2.444 778 6 25 1.722 0.722
Industrial&CommBankofChina 12 2.355 750 10 11 3.033 -0.678
MitsubishiUFJFinancialGroupInc 13 2.158 687 8 7 3.635 -1.477
SumitomoMitsuiFinancial 14 2.043 651 6 5 3.913 -1.870
SocieteGenerale 15 2.037 649 5 6 3.725 -1.688
Commerzbank 16 1.957 623 8 24 1.763 0.194
BankofChina 17 1.757 559 7 10 3.241 -1.484
IntesaSanpaolo 18 1.739 554 4 26 1.570 0.169
Natixis 19 1.727 550 2 17 2.287 -0.560
Barclays 20 1.577 502 4 8 3.293 -1.716
TOTAL 100% 31,847 68 100%
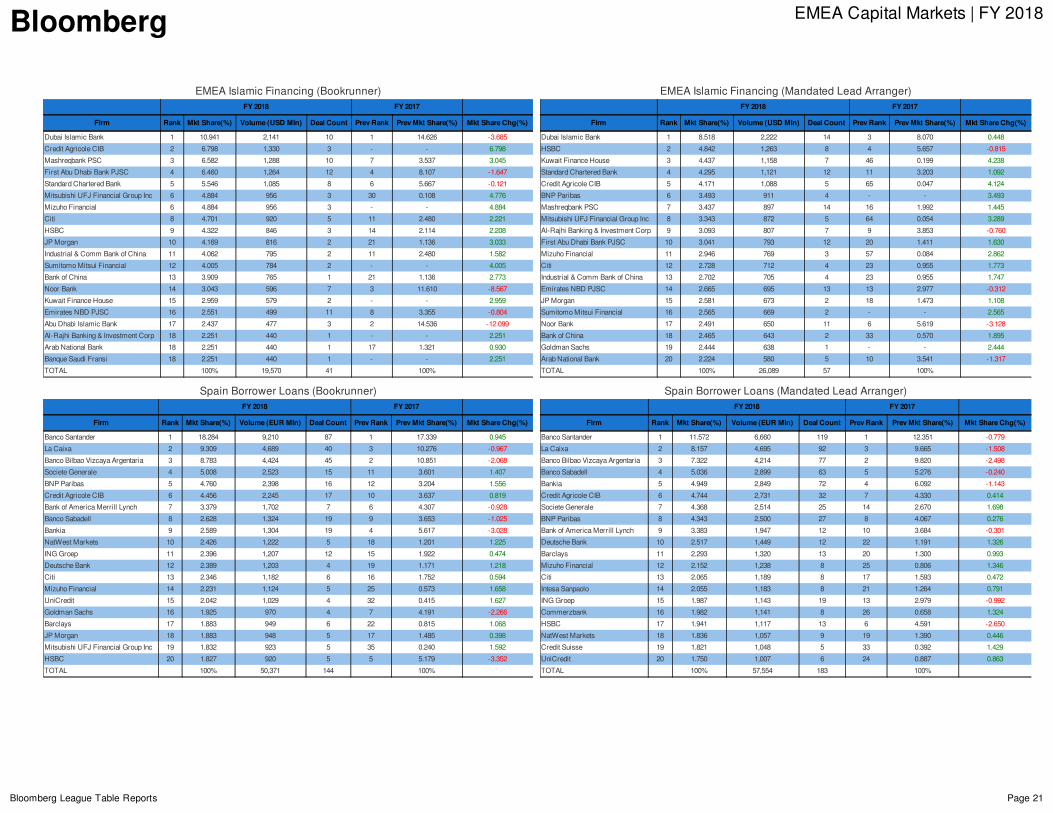
Bloomberg EMEACapitalMarkets|FY2018
BloombergLeagueTableReports Page21
EMEAIslamicFinancing(Bookrunner)FY2018 FY2017
Firm Rank MktShare(%) Volume(USDMln) DealCount PrevRank PrevMktShare(%) MktShareChg(%)
DubaiIslamicBank 1 10.941 2,141 10 1 14.626 -3.685
CreditAgricoleCIB 2 6.798 1,330 3 - - 6.798
MashreqbankPSC 3 6.582 1,288 10 7 3.537 3.045
FirstAbuDhabiBankPJSC 4 6.460 1,264 12 4 8.107 -1.647
StandardCharteredBank 5 5.546 1,085 8 6 5.667 -0.121
MitsubishiUFJFinancialGroupInc 6 4.884 956 3 30 0.108 4.776
MizuhoFinancial 6 4.884 956 3 - - 4.884
Citi 8 4.701 920 5 11 2.480 2.221
HSBC 9 4.322 846 3 14 2.114 2.208
JPMorgan 10 4.169 816 2 21 1.136 3.033
Industrial&CommBankofChina 11 4.062 795 2 11 2.480 1.582
SumitomoMitsuiFinancial 12 4.005 784 2 - - 4.005
BankofChina 13 3.909 765 1 21 1.136 2.773
NoorBank 14 3.043 596 7 3 11.610 -8.567
KuwaitFinanceHouse 15 2.959 579 2 - - 2.959
EmiratesNBDPJSC 16 2.551 499 11 8 3.355 -0.804
AbuDhabiIslamicBank 17 2.437 477 3 2 14.536 -12.099
Al-RajhiBanking&InvestmentCorp 18 2.251 440 1 - - 2.251
ArabNationalBank 18 2.251 440 1 17 1.321 0.930
BanqueSaudiFransi 18 2.251 440 1 - - 2.251
TOTAL 100% 19,570 41 100%
EMEAIslamicFinancing(MandatedLeadArranger)FY2018 FY2017
Firm Rank MktShare(%) Volume(USDMln) DealCount PrevRank PrevMktShare(%) MktShareChg(%)
DubaiIslamicBank 1 8.518 2,222 14 3 8.070 0.448
HSBC 2 4.842 1,263 8 4 5.657 -0.815
KuwaitFinanceHouse 3 4.437 1,158 7 46 0.199 4.238
StandardCharteredBank 4 4.295 1,121 12 11 3.203 1.092
CreditAgricoleCIB 5 4.171 1,088 5 65 0.047 4.124
BNPParibas 6 3.493 911 4 - - 3.493
MashreqbankPSC 7 3.437 897 14 16 1.992 1.445
MitsubishiUFJFinancialGroupInc 8 3.343 872 5 64 0.054 3.289
Al-RajhiBanking&InvestmentCorp 9 3.093 807 7 9 3.853 -0.760
FirstAbuDhabiBankPJSC 10 3.041 793 12 20 1.411 1.630
MizuhoFinancial 11 2.946 769 3 57 0.084 2.862
Citi 12 2.728 712 4 23 0.955 1.773
Industrial&CommBankofChina 13 2.702 705 4 23 0.955 1.747
EmiratesNBDPJSC 14 2.665 695 13 13 2.977 -0.312
JPMorgan 15 2.581 673 2 18 1.473 1.108
SumitomoMitsuiFinancial 16 2.565 669 2 - - 2.565
NoorBank 17 2.491 650 11 6 5.619 -3.128
BankofChina 18 2.465 643 2 33 0.570 1.895
GoldmanSachs 19 2.444 638 1 - - 2.444
ArabNationalBank 20 2.224 580 5 10 3.541 -1.317
TOTAL 100% 26,089 57 100%
SpainBorrowerLoans(Bookrunner)FY2018 FY2017
Firm Rank MktShare(%) Volume(EURMln) DealCount PrevRank PrevMktShare(%) MktShareChg(%)
BancoSantander 1 18.284 9,210 87 1 17.339 0.945
LaCaixa 2 9.309 4,689 40 3 10.276 -0.967
BancoBilbaoVizcayaArgentaria 3 8.783 4,424 45 2 10.851 -2.068
SocieteGenerale 4 5.008 2,523 15 11 3.601 1.407
BNPParibas 5 4.760 2,398 16 12 3.204 1.556
CreditAgricoleCIB 6 4.456 2,245 17 10 3.637 0.819
BankofAmericaMerrillLynch 7 3.379 1,702 7 6 4.307 -0.928
BancoSabadell 8 2.628 1,324 19 9 3.653 -1.025
Bankia 9 2.589 1,304 19 4 5.617 -3.028
NatWestMarkets 10 2.426 1,222 5 18 1.201 1.225
INGGroep 11 2.396 1,207 12 15 1.922 0.474
DeutscheBank 12 2.389 1,203 4 19 1.171 1.218
Citi 13 2.346 1,182 6 16 1.752 0.594
MizuhoFinancial 14 2.231 1,124 5 25 0.573 1.658
UniCredit 15 2.042 1,029 4 32 0.415 1.627
GoldmanSachs 16 1.925 970 4 7 4.191 -2.266
Barclays 17 1.883 949 6 22 0.815 1.068
JPMorgan 18 1.883 948 5 17 1.485 0.398
MitsubishiUFJFinancialGroupInc 19 1.832 923 5 35 0.240 1.592
HSBC 20 1.827 920 5 5 5.179 -3.352
TOTAL 100% 50,371 144 100%
SpainBorrowerLoans(MandatedLeadArranger)FY2018 FY2017
Firm Rank MktShare(%) Volume(EURMln) DealCount PrevRank PrevMktShare(%) MktShareChg(%)
BancoSantander 1 11.572 6,660 119 1 12.351 -0.779
LaCaixa 2 8.157 4,695 92 3 9.665 -1.508
BancoBilbaoVizcayaArgentaria 3 7.322 4,214 77 2 9.820 -2.498
BancoSabadell 4 5.036 2,899 63 5 5.276 -0.240
Bankia 5 4.949 2,849 72 4 6.092 -1.143
CreditAgricoleCIB 6 4.744 2,731 32 7 4.330 0.414
SocieteGenerale 7 4.368 2,514 25 14 2.670 1.698
BNPParibas 8 4.343 2,500 27 8 4.067 0.276
BankofAmericaMerrillLynch 9 3.383 1,947 12 10 3.684 -0.301
DeutscheBank 10 2.517 1,449 12 22 1.191 1.326
Barclays 11 2.293 1,320 13 20 1.300 0.993
MizuhoFinancial 12 2.152 1,238 8 25 0.806 1.346
Citi 13 2.065 1,189 8 17 1.593 0.472
IntesaSanpaolo 14 2.055 1,183 8 21 1.264 0.791
INGGroep 15 1.987 1,143 19 13 2.979 -0.992
Commerzbank 16 1.982 1,141 8 26 0.658 1.324
HSBC 17 1.941 1,117 13 6 4.591 -2.650
NatWestMarkets 18 1.836 1,057 9 19 1.390 0.446
CreditSuisse 19 1.821 1,048 5 33 0.392 1.429
UniCredit 20 1.750 1,007 6 24 0.887 0.863
TOTAL 100% 57,554 183 100%
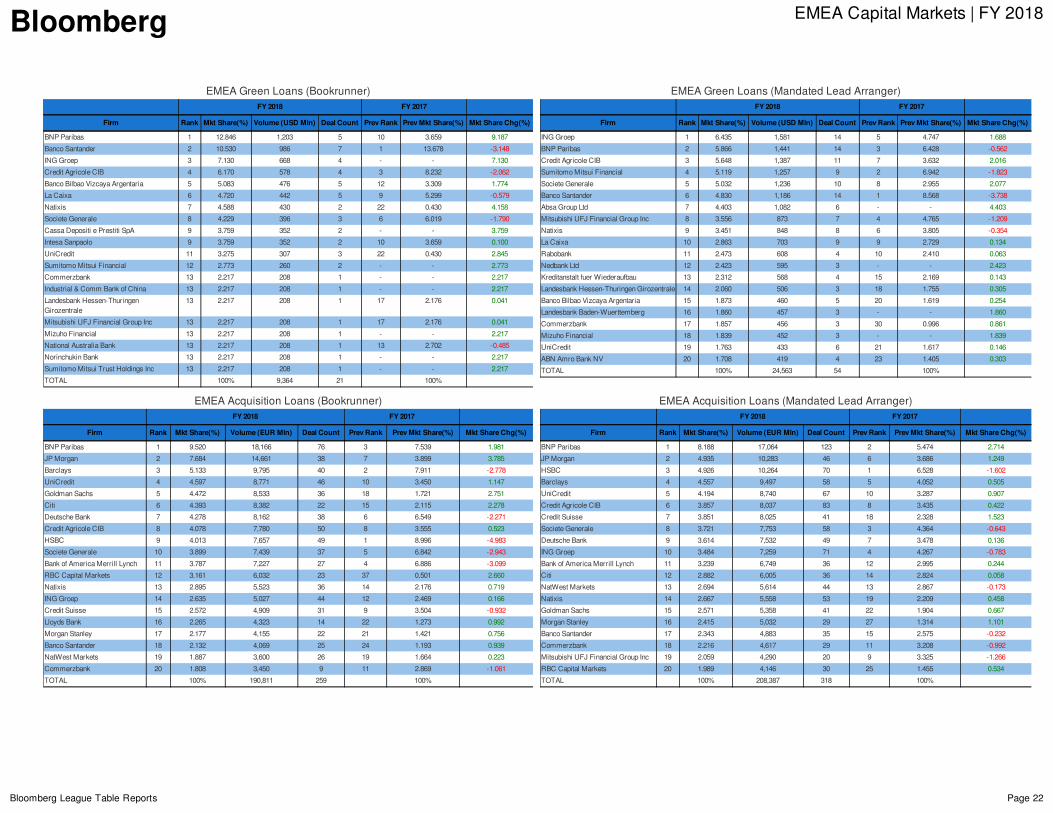
Bloomberg EMEACapitalMarkets|FY2018
BloombergLeagueTableReports Page22
EMEAGreenLoans(Bookrunner)FY2018 FY2017
Firm Rank MktShare(%) Volume(USDMln) DealCount PrevRank PrevMktShare(%) MktShareChg(%)
BNPParibas 1 12.846 1,203 5 10 3.659 9.187
BancoSantander 2 10.530 986 7 1 13.678 -3.148
INGGroep 3 7.130 668 4 - - 7.130
CreditAgricoleCIB 4 6.170 578 4 3 8.232 -2.062
BancoBilbaoVizcayaArgentaria 5 5.083 476 5 12 3.309 1.774
LaCaixa 6 4.720 442 5 9 5.299 -0.579
Natixis 7 4.588 430 2 22 0.430 4.158
SocieteGenerale 8 4.229 396 3 6 6.019 -1.790
CassaDepositiePrestitiSpA 9 3.759 352 2 - - 3.759
IntesaSanpaolo 9 3.759 352 2 10 3.659 0.100
UniCredit 11 3.275 307 3 22 0.430 2.845
SumitomoMitsuiFinancial 12 2.773 260 2 - - 2.773
Commerzbank 13 2.217 208 1 - - 2.217
Industrial&CommBankofChina 13 2.217 208 1 - - 2.217
LandesbankHessen-ThuringenGirozentrale
13 2.217 208 1 17 2.176 0.041
MitsubishiUFJFinancialGroupInc 13 2.217 208 1 17 2.176 0.041
MizuhoFinancial 13 2.217 208 1 - - 2.217
NationalAustraliaBank 13 2.217 208 1 13 2.702 -0.485
NorinchukinBank 13 2.217 208 1 - - 2.217
SumitomoMitsuiTrustHoldingsInc 13 2.217 208 1 - - 2.217
TOTAL 100% 9,364 21 100%
EMEAGreenLoans(MandatedLeadArranger)FY2018 FY2017
Firm Rank MktShare(%) Volume(USDMln) DealCount PrevRank PrevMktShare(%) MktShareChg(%)
INGGroep 1 6.435 1,581 14 5 4.747 1.688
BNPParibas 2 5.866 1,441 14 3 6.428 -0.562
CreditAgricoleCIB 3 5.648 1,387 11 7 3.632 2.016
SumitomoMitsuiFinancial 4 5.119 1,257 9 2 6.942 -1.823
SocieteGenerale 5 5.032 1,236 10 8 2.955 2.077
BancoSantander 6 4.830 1,186 14 1 8.568 -3.738
AbsaGroupLtd 7 4.403 1,082 6 - - 4.403
MitsubishiUFJFinancialGroupInc 8 3.556 873 7 4 4.765 -1.209
Natixis 9 3.451 848 8 6 3.805 -0.354
LaCaixa 10 2.863 703 9 9 2.729 0.134
Rabobank 11 2.473 608 4 10 2.410 0.063
NedbankLtd 12 2.423 595 3 - - 2.423
KreditanstaltfuerWiederaufbau 13 2.312 568 4 15 2.169 0.143
LandesbankHessen-ThuringenGirozentrale 14 2.060 506 3 18 1.755 0.305
BancoBilbaoVizcayaArgentaria 15 1.873 460 5 20 1.619 0.254
LandesbankBaden-Wuerttemberg 16 1.860 457 3 - - 1.860
Commerzbank 17 1.857 456 3 30 0.996 0.861
MizuhoFinancial 18 1.839 452 3 - - 1.839
UniCredit 19 1.763 433 6 21 1.617 0.146
ABNAmroBankNV 20 1.708 419 4 23 1.405 0.303
TOTAL 100% 24,563 54 100%
EMEAAcquisitionLoans(Bookrunner)FY2018 FY2017
Firm Rank MktShare(%) Volume(EURMln) DealCount PrevRank PrevMktShare(%) MktShareChg(%)
BNPParibas 1 9.520 18,166 76 3 7.539 1.981
JPMorgan 2 7.684 14,661 38 7 3.899 3.785
Barclays 3 5.133 9,795 40 2 7.911 -2.778
UniCredit 4 4.597 8,771 46 10 3.450 1.147
GoldmanSachs 5 4.472 8,533 36 18 1.721 2.751
Citi 6 4.393 8,382 22 15 2.115 2.278
DeutscheBank 7 4.278 8,162 38 6 6.549 -2.271
CreditAgricoleCIB 8 4.078 7,780 50 8 3.555 0.523
HSBC 9 4.013 7,657 49 1 8.996 -4.983
SocieteGenerale 10 3.899 7,439 37 5 6.842 -2.943
BankofAmericaMerrillLynch 11 3.787 7,227 27 4 6.886 -3.099
RBCCapitalMarkets 12 3.161 6,032 23 37 0.501 2.660
Natixis 13 2.895 5,523 36 14 2.176 0.719
INGGroep 14 2.635 5,027 44 12 2.469 0.166
CreditSuisse 15 2.572 4,909 31 9 3.504 -0.932
LloydsBank 16 2.265 4,323 14 22 1.273 0.992
MorganStanley 17 2.177 4,155 22 21 1.421 0.756
BancoSantander 18 2.132 4,069 25 24 1.193 0.939
NatWestMarkets 19 1.887 3,600 26 19 1.664 0.223
Commerzbank 20 1.808 3,450 9 11 2.869 -1.061
TOTAL 100% 190,811 259 100%
EMEAAcquisitionLoans(MandatedLeadArranger)FY2018 FY2017
Firm Rank MktShare(%) Volume(EURMln) DealCount PrevRank PrevMktShare(%) MktShareChg(%)
BNPParibas 1 8.188 17,064 123 2 5.474 2.714
JPMorgan 2 4.935 10,283 46 6 3.686 1.249
HSBC 3 4.926 10,264 70 1 6.528 -1.602
Barclays 4 4.557 9,497 58 5 4.052 0.505
UniCredit 5 4.194 8,740 67 10 3.287 0.907
CreditAgricoleCIB 6 3.857 8,037 83 8 3.435 0.422
CreditSuisse 7 3.851 8,025 41 18 2.328 1.523
SocieteGenerale 8 3.721 7,753 58 3 4.364 -0.643
DeutscheBank 9 3.614 7,532 49 7 3.478 0.136
INGGroep 10 3.484 7,259 71 4 4.267 -0.783
BankofAmericaMerrillLynch 11 3.239 6,749 36 12 2.995 0.244
Citi 12 2.882 6,005 36 14 2.824 0.058
NatWestMarkets 13 2.694 5,614 44 13 2.867 -0.173
Natixis 14 2.667 5,558 53 19 2.209 0.458
GoldmanSachs 15 2.571 5,358 41 22 1.904 0.667
MorganStanley 16 2.415 5,032 29 27 1.314 1.101
BancoSantander 17 2.343 4,883 35 15 2.575 -0.232
Commerzbank 18 2.216 4,617 29 11 3.208 -0.992
MitsubishiUFJFinancialGroupInc 19 2.059 4,290 20 9 3.325 -1.266
RBCCapitalMarkets 20 1.989 4,146 30 25 1.455 0.534
TOTAL 100% 208,387 318 100%
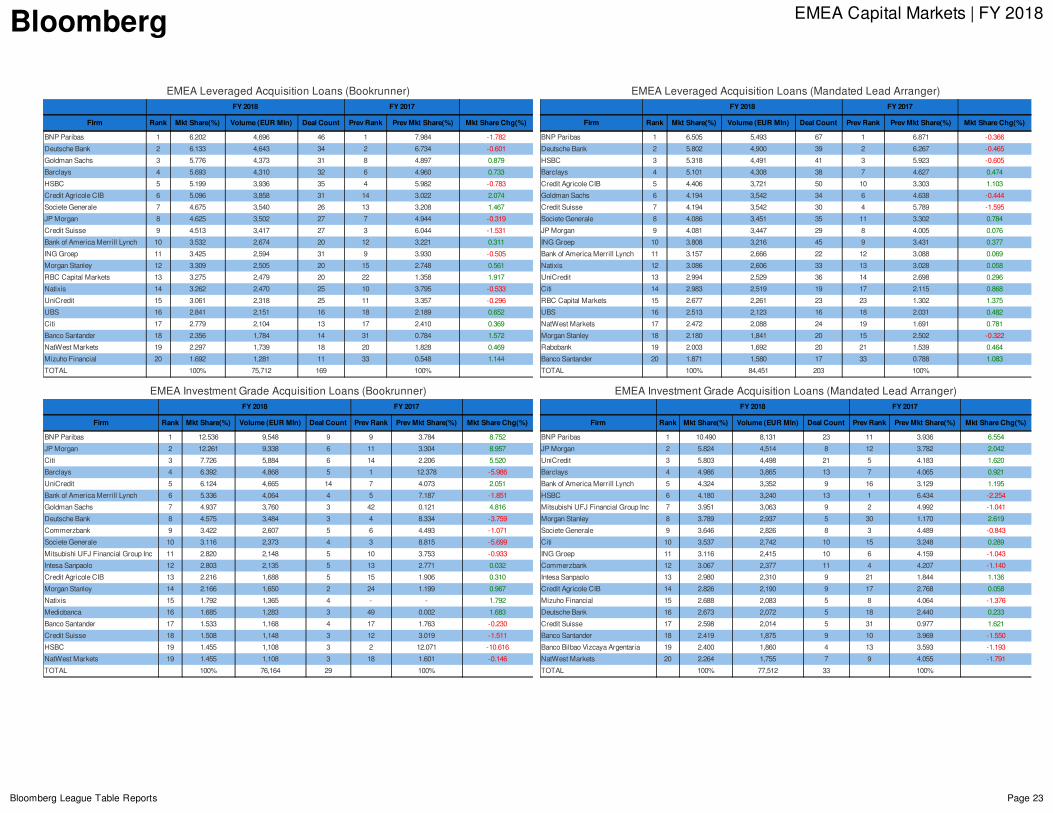
Bloomberg EMEACapitalMarkets|FY2018
BloombergLeagueTableReports Page23
EMEALeveragedAcquisitionLoans(Bookrunner)FY2018 FY2017
Firm Rank MktShare(%) Volume(EURMln) DealCount PrevRank PrevMktShare(%) MktShareChg(%)
BNPParibas 1 6.202 4,696 46 1 7.984 -1.782
DeutscheBank 2 6.133 4,643 34 2 6.734 -0.601
GoldmanSachs 3 5.776 4,373 31 8 4.897 0.879
Barclays 4 5.693 4,310 32 6 4.960 0.733
HSBC 5 5.199 3,936 35 4 5.982 -0.783
CreditAgricoleCIB 6 5.096 3,858 31 14 3.022 2.074
SocieteGenerale 7 4.675 3,540 26 13 3.208 1.467
JPMorgan 8 4.625 3,502 27 7 4.944 -0.319
CreditSuisse 9 4.513 3,417 27 3 6.044 -1.531
BankofAmericaMerrillLynch 10 3.532 2,674 20 12 3.221 0.311
INGGroep 11 3.425 2,594 31 9 3.930 -0.505
MorganStanley 12 3.309 2,505 20 15 2.748 0.561
RBCCapitalMarkets 13 3.275 2,479 20 22 1.358 1.917
Natixis 14 3.262 2,470 25 10 3.795 -0.533
UniCredit 15 3.061 2,318 25 11 3.357 -0.296
UBS 16 2.841 2,151 16 18 2.189 0.652
Citi 17 2.779 2,104 13 17 2.410 0.369
BancoSantander 18 2.356 1,784 14 31 0.784 1.572
NatWestMarkets 19 2.297 1,739 18 20 1.828 0.469
MizuhoFinancial 20 1.692 1,281 11 33 0.548 1.144
TOTAL 100% 75,712 169 100%
EMEALeveragedAcquisitionLoans(MandatedLeadArranger)FY2018 FY2017
Firm Rank MktShare(%) Volume(EURMln) DealCount PrevRank PrevMktShare(%) MktShareChg(%)
BNPParibas 1 6.505 5,493 67 1 6.871 -0.366
DeutscheBank 2 5.802 4,900 39 2 6.267 -0.465
HSBC 3 5.318 4,491 41 3 5.923 -0.605
Barclays 4 5.101 4,308 38 7 4.627 0.474
CreditAgricoleCIB 5 4.406 3,721 50 10 3.303 1.103
GoldmanSachs 6 4.194 3,542 34 6 4.638 -0.444
CreditSuisse 7 4.194 3,542 30 4 5.789 -1.595
SocieteGenerale 8 4.086 3,451 35 11 3.302 0.784
JPMorgan 9 4.081 3,447 29 8 4.005 0.076
INGGroep 10 3.808 3,216 45 9 3.431 0.377
BankofAmericaMerrillLynch 11 3.157 2,666 22 12 3.088 0.069
Natixis 12 3.086 2,606 33 13 3.028 0.058
UniCredit 13 2.994 2,529 36 14 2.698 0.296
Citi 14 2.983 2,519 19 17 2.115 0.868
RBCCapitalMarkets 15 2.677 2,261 23 23 1.302 1.375
UBS 16 2.513 2,123 16 18 2.031 0.482
NatWestMarkets 17 2.472 2,088 24 19 1.691 0.781
MorganStanley 18 2.180 1,841 20 15 2.502 -0.322
Rabobank 19 2.003 1,692 20 21 1.539 0.464
BancoSantander 20 1.871 1,580 17 33 0.788 1.083
TOTAL 100% 84,451 203 100%
EMEAInvestmentGradeAcquisitionLoans(Bookrunner)FY2018 FY2017
Firm Rank MktShare(%) Volume(EURMln) DealCount PrevRank PrevMktShare(%) MktShareChg(%)
BNPParibas 1 12.536 9,548 9 9 3.784 8.752
JPMorgan 2 12.261 9,338 6 11 3.304 8.957
Citi 3 7.726 5,884 6 14 2.206 5.520
Barclays 4 6.392 4,868 5 1 12.378 -5.986
UniCredit 5 6.124 4,665 14 7 4.073 2.051
BankofAmericaMerrillLynch 6 5.336 4,064 4 5 7.187 -1.851
GoldmanSachs 7 4.937 3,760 3 42 0.121 4.816
DeutscheBank 8 4.575 3,484 3 4 8.334 -3.759
Commerzbank 9 3.422 2,607 5 6 4.493 -1.071
SocieteGenerale 10 3.116 2,373 4 3 8.815 -5.699
MitsubishiUFJFinancialGroupInc 11 2.820 2,148 5 10 3.753 -0.933
IntesaSanpaolo 12 2.803 2,135 5 13 2.771 0.032
CreditAgricoleCIB 13 2.216 1,688 5 15 1.906 0.310
MorganStanley 14 2.166 1,650 2 24 1.199 0.967
Natixis 15 1.792 1,365 4 - - 1.792
Mediobanca 16 1.685 1,283 3 49 0.002 1.683
BancoSantander 17 1.533 1,168 4 17 1.763 -0.230
CreditSuisse 18 1.508 1,148 3 12 3.019 -1.511
HSBC 19 1.455 1,108 3 2 12.071 -10.616
NatWestMarkets 19 1.455 1,108 3 18 1.601 -0.146
TOTAL 100% 76,164 29 100%
EMEAInvestmentGradeAcquisitionLoans(MandatedLeadArranger)FY2018 FY2017
Firm Rank MktShare(%) Volume(EURMln) DealCount PrevRank PrevMktShare(%) MktShareChg(%)
BNPParibas 1 10.490 8,131 23 11 3.936 6.554
JPMorgan 2 5.824 4,514 8 12 3.782 2.042
UniCredit 3 5.803 4,498 21 5 4.183 1.620
Barclays 4 4.986 3,865 13 7 4.065 0.921
BankofAmericaMerrillLynch 5 4.324 3,352 9 16 3.129 1.195
HSBC 6 4.180 3,240 13 1 6.434 -2.254
MitsubishiUFJFinancialGroupInc 7 3.951 3,063 9 2 4.992 -1.041
MorganStanley 8 3.789 2,937 5 30 1.170 2.619
SocieteGenerale 9 3.646 2,826 8 3 4.489 -0.843
Citi 10 3.537 2,742 10 15 3.248 0.289
INGGroep 11 3.116 2,415 10 6 4.159 -1.043
Commerzbank 12 3.067 2,377 11 4 4.207 -1.140
IntesaSanpaolo 13 2.980 2,310 9 21 1.844 1.136
CreditAgricoleCIB 14 2.826 2,190 9 17 2.768 0.058
MizuhoFinancial 15 2.688 2,083 5 8 4.064 -1.376
DeutscheBank 16 2.673 2,072 5 18 2.440 0.233
CreditSuisse 17 2.598 2,014 5 31 0.977 1.621
BancoSantander 18 2.419 1,875 9 10 3.969 -1.550
BancoBilbaoVizcayaArgentaria 19 2.400 1,860 4 13 3.593 -1.193
NatWestMarkets 20 2.264 1,755 7 9 4.055 -1.791
TOTAL 100% 77,512 33 100%
Bloomberg – League Tables Criteria
Bloomberg L.P. reserves the right of final decision concerning league eligibility and requires adequate documentation for the same. Bloomberg L.P. and its suppliers believe the information herein was obtained from reliable sources, but they do not guarantee its accuracy. Neither the information nor the opinion expressed constitutes a solicitation of the purchase or sale of securities or commodities. Due to the dynamic nature of the Professional Service product, League Table rankings may vary between the quarterly/year-end publications and data found on the Bloomberg Professional Service.
General Guidelines
Credit is based on the total amount of the offering sold to the public. Full credit is awarded to the sole bookrunning manager or split equally among joint bookrunning managers; unless full, explicit breakdown of bookrunning is provided by an involved party. Regional and local tables are identifiedbased on factors such as currency, market of issuer and/or country of risk/incorporation.
Fixed Income
All transactions must have a maturity/call/put option of minimum 18 months. Make-whole call and provisional call/put are exempted from this rule. Note: Criteria may vary for some local and/or regional tables. USD denominated 144A/REG S issues are credited 100% to the 144A tranche and 0% to the REG S tranche. Non-USD denominated 144A/REG S issues are credited 100% to the REG S tranche and 0% to the 144A tranche. Self-led transactions are included. New money portions of exchange offers are eligible for credit.
Exclusions: Accredited investor tranches, asset-backed issues, auction note agencies, collateralized bond obligations, collateralized loan obligations, commercial paper, municipal bonds, mortgage-backed issues, remarketed issues, repackaged bonds, government borrowing scheme retained bonds, variable principal redemption issues, variable interest equity-linked issues, and credit linked notes, selling group agency issues, strips, units, warrants, self-led under USD 50 million. Note: Criteria may vary for some local and/or regional tables.
Equities-Linked
Equity-linked transactions: Convertible bonds, convertible preferred stock and exchangeable bonds. Only issues that mature and are callable/puttable in 12 months or longer are included. Make-whole call, provisional call and provisional put are exempted from this rule. Convertible bondswith attached warrants are included. These are defined as synthetic convertibles with the combination of a fixed income instrument and warrants which can be converted into shares. The embedded warrant can be detachable or non-detachable but the bond and the warrant must be sold as a unit, i.e. there cannot be separate book building for the warrant and the bond.
Exclusions: Redemption-linked instruments, reverse convertibles or similar instruments, synthetics convertibles, issues convertible into participation in an underlying fund or investment trust, pre-IPO convertible instruments, certain lower hierarchy titles, i.e. Jr Bookrunner.
Equities
Equity market transactions: Initial public offerings, additional offerings of common stocks, units, and depositary receipts (ADRs, GDRs, etc) and rights offerings.
Exclusions: Non-underwritten/best efforts, privately placed transactions, funds, self-led, preferred offerings, pre-negotiated offerings, certain lower hierarchy titles, i.e. Jr Bookrunner. Note: Criteria may vary for some local and/or regional tables.
Bloomberg – League Tables Criteria
Bloomberg L.P. reserves the right of final decision concerning league eligibility and requires adequate documentation for the same. Bloomberg L.P. and its suppliers believe the information herein was obtained from reliable sources, but they do not guarantee its accuracy. Neither the information nor the opinion expressed constitutes a solicitation of the purchase or sale of securities or commodities. Due to the dynamic nature of the Professional Service product, League Table rankings may vary between the quarterly/year-end publications and data found on the Bloomberg Professional Service.
Loans
Includes executed syndicated loans transactions. Full credit is awarded to the banks satisfying the highest of the titles. Full credit is awarded to the sole bookrunning manager or split equally among joint bookrunning managers. Credit is allocated to amended or amended and restated transactions, where each modification is 100% at the lender’s option and not as a result of events already built into the original credit agreement. Credit is awarded for the following structural changes only: maturity extensions of three months or more, incremental basis for increased in deal size, reduction in pricing, full release of security.
Exclusions: Bilateral transactions, transactions with a maturity of less than three months, loans withdrawn prior to signing, amended orrestated securitizations, receivable and guarantee facilities.
US Municipals
Standard published tables will award deal credit based on true economic credit as reported by the issuer or the bookrunner. In absence ofreported economic credit, 100% will be assigned to the bookrunner.
Dollar value of credit will be assigned based on the percentage allocation reported for economic credit (or designated by the user in a custom table) and applied against the total par value of the bonds issued. Zero coupon bonds (CABS) or intermediate appreciation bonds (convertible CABs) will be included at the market value (accreted value) on the interest accrual date.
All debt issued by municipal issuers will be eligible for league credit. Taxable and tax-exempt debt is eligible for league credit unless a table includes specific tax type criteria. “Tax-exempt” is defined as federally tax-exempt and includes bonds subject to AMT and bonds designated as Bank Qualified.
Each table is provided in three formats. “Economic Credit” displays rankings based on true economic credit allocations of applicable deals. “Left Lead” assigns 100% credit to the bookrunner and 0% to all other syndicate participants. “Deal Count” displays rankings based on deal quantity rather than aggregate economic credit amounts. A “deal” refers to the aggregate series within an issuance led by a particular underwriter or syndicate. For example: a $50 million issuance is split into three series- a $10 million Series A, a $20 million Series B, and a $20 million Series C. Bank 1 is the underwriter of Series A & B, while Bank 2 is the underwriter of Series C. Bank 1 would have one “deal” worth $30 million, and Bank 2 would have one “deal” worth $20 million.
Exclusions: Derivatives, private placements, variable rate preferred securities, municipal commercial paper, and remarketings are excluded from municipal league table eligibility.
The full version of Bloomberg’s League table Standards & Guidelines can be accessed and subscribed to on the Reports tab on
LEAG<GO>.