emerald k k579773 554
TRANSCRIPT

KybernetesA system dynamics model of the nutritional stages of the Colombian populationJose D Meisel Olga L. Sarmiento Camilo Olaya Juan A Valdivia Roberto Zarama
Article information:To cite this document:Jose D Meisel Olga L. Sarmiento Camilo Olaya Juan A Valdivia Roberto Zarama , (2016),"A systemdynamics model of the nutritional stages of the Colombian population", Kybernetes, Vol. 45 Iss 4 pp.554 - 570Permanent link to this document:http://dx.doi.org/10.1108/K-01-2015-0010
Downloaded on: 11 August 2016, At: 12:50 (PT)References: this document contains references to 57 other documents.To copy this document: [email protected] fulltext of this document has been downloaded 73 times since 2016*
Users who downloaded this article also downloaded:(2016),"An approach for green supplier selection in the automobile manufacturing industry",Kybernetes, Vol. 45 Iss 4 pp. 571-588 http://dx.doi.org/10.1108/K-01-2015-0034(2016),"Evaluation of critical factors for the regional innovation system within the HsinChu science-based park", Kybernetes, Vol. 45 Iss 4 pp. 699-716 http://dx.doi.org/10.1108/K-02-2015-0059(2016),"Posture labeling based gesture classification for Turkish sign language using depth values",Kybernetes, Vol. 45 Iss 4 pp. 604-621 http://dx.doi.org/10.1108/K-04-2015-0107
Access to this document was granted through an Emerald subscription provided by emerald-srm:528416 []
For AuthorsIf you would like to write for this, or any other Emerald publication, then please use our Emeraldfor Authors service information about how to choose which publication to write for and submissionguidelines are available for all. Please visit www.emeraldinsight.com/authors for more information.
About Emerald www.emeraldinsight.comEmerald is a global publisher linking research and practice to the benefit of society. The companymanages a portfolio of more than 290 journals and over 2,350 books and book series volumes, aswell as providing an extensive range of online products and additional customer resources andservices.
Emerald is both COUNTER 4 and TRANSFER compliant. The organization is a partner of theCommittee on Publication Ethics (COPE) and also works with Portico and the LOCKSS initiative fordigital archive preservation.
*Related content and download information correct at time of download.
Dow
nloa
ded
by U
nive
rsid
ad d
e C
hile
At 1
2:50
11
Aug
ust 2
016
(PT
)

A system dynamics model of thenutritional stages of theColombian population
Jose D. MeiselDepartment of Industrial Engineering, Faculty of Engineering,
Universidad de los Andes, Bogotá, Colombia;CeiBA Complex Systems Research Center, Bogotá, Colombia and
Facultad de Ingeniería, Universidad de Ibagué,Ibagué, Colombia
Olga L. SarmientoDepartment of Public Health, School of Medicine, Universidad de los Andes,
Bogotá, Colombia and CeiBA Complex Systems Research Center,Bogotá, ColombiaCamilo Olaya
Department of Industrial Engineering, Faculty of Engineering,Universidad de los Andes, Bogotá, Colombia and
CeiBA Complex Systems Research Center, Bogotá, ColombiaJuan A. Valdivia
Departamento de Física, Facultad de Ciencias, Universidad de Chile, Santiago,Chile and Centro para el Desarrollo de la Nanociencia y la Nanotecnología,
CEDENNA, Santiago, Chile, andRoberto Zarama
Department of Industrial Engineering, Faculty of Engineering,Universidad de los Andes, Bogotá, Colombia and
CeiBA Complex Systems Research Center, Bogotá, Colombia
AbstractPurpose – Overweight, obesity, and physical inactivity have in recent years become an importantpublic health problem worldwide. Investigations that study obesity using a systemic approach in low-and middle-income countries (LMICs) are limited. Therefore, the purpose of this paper is to study thenutritional stages dynamics within the Colombian urban population.Design/methodology/approach – The authors used a population-level systems dynamics (SD)model that captures the transitions of population by body mass index (BMI) categories. The authorsproposed a heuristic to estimate the transference rates (TRs) between BMI categories using data fromthe Colombian Demographic and Health Survey 2005 and 2010.Findings – The Colombian urban population is moving to overweight and obese categories. The TRsfrom not overweight to overweight and from overweight to obese (0.0076 and 0.0054, respectively) arehigher than the TRs from obese to overweight and from overweight to not-overweight (1.025× 10e−7
KybernetesVol. 45 No. 4, 2016pp. 554-570©EmeraldGroup Publishing Limited0368-492XDOI 10.1108/K-01-2015-0010
The current issue and full text archive of this journal is available on Emerald Insight at:www.emeraldinsight.com/0368-492X.htm
The study was funded by the Center for Interdisciplinary Studies in Basic and AppliedComplexity (CeiBA), Bogotá, Colombia; and Colciencias. CeiBA funded the doctoral student andthe publication of the article; the “Programa nacional de formación doctoral Francisco Jose deCaldas” from Colciencias,” (Convocatorias 511-2010) funded the work of Jose David Meisel.J. A. Valdivia thanks Fondecyt grant 1110135.
554
K45,4
Dow
nloa
ded
by U
nive
rsid
ad d
e C
hile
At 1
2:50
11
Aug
ust 2
016
(PT
)

and 3.47× 10e−7, respectively). The simulation results show that the prevalences of overweight andobesity will increase by 6.2 and 7.5 percent by 2015, and by 13.4 and 18.9 percent by 2030, respectively.Originality/value – Investigations that study obesity using a systemic approach in LMICs are limited.A SD model was proposed to examine changes in the population’s nutritional stages using populationaccumulation structures by BMI categories. The authors propose a heuristic to estimate the TRs ofindividuals between BMI categories. The proposed model can be used to study the effects of policyinterventions to prevent overweight and obesity. The authors analyze a few policy intervention strategies.Keywords Public health, Mathematical modelling, Obesity, System dynamics, Behaviour science,Nutritional stagesPaper type Research paper
1. IntroductionOverweight, obesity, and physical inactivity have in recent years become an importantpublic health problem worldwide (Ng et al., 2014; Swinburn et al., 2011). These arerisk factors associated with non-communicable diseases (NCDs) like diabetes, cancer,and cardiovascular diseases (Calle et al., 1999; Eriksson, 2007; Fontaine et al., 2003;Pate et al., 1995;Wilson et al., 2002). Between 2001 and 2004, these factors have gone fromseventh and eighth to among the top five leading risk factors of attributable death in theworld, with a higher mortality in low- and middle-income countries (LMICs) (WorldHealth Organization, 2008). Furthermore, the prevalence of overweight and obesity hasrisen in the last years with different dynamics across regions, countries, and sexes(Ng et al., 2014). According to Ng et al. (2014) the proportion of overweight or obese adultshas increased from 28.8 percent in 1980 to 36.9 percent in 2013 in men, and from29.8 to 38 percent in women worldwide. In the case of children and adolescents, between1980 and 2013, the prevalence of overweight and obesity has increased from 16.9 to23.8 percent in boys, and from 16.2 to 22.6 percent in girls in high-income countries(HICs). In the case of LMICs, the increased was from 8.1 to 12.9 percent in boys, andfrom 8.4 to 13.4 percent in girls (Ng et al., 2014). In fact, countries experiencingrapid-urbanization, globalization of food systems, and nutrition transition processes havecontributed to shift the global burden of NCDs from HICs to LMICs (Lopez et al., 2006).
In this respect, Latin American countries are also experiencing an increase in theprevalence of overweight and obesity (Ng et al., 2014). In the case of Colombia,according to (Ng et al., 2014) the prevalence of overweight and obesity combined hasincreased in 63 percent for men, 22 percent for women, 50 percent for boys, and17 percent for girls between 1980 and 2013. As a consequence, Latin Americancountries are suffering a shift in the burden of chronic diseases due to demographic andnutritional transitions, with significant changes in diet and lifestyle (Gaziano, 2005).The rate of mortality due to NCDs, mainly cardiovascular diseases and cancers, hasincreased during the last years (Cuevas et al., 2009). In Colombia, chronic diseases, inparticular cardiovascular diseases, are the main causes of morbidity and mortalityamong the male and female adult populations. According to the Colombian NationalDepartment of Statistics (Departamento Administrativo Nacional de Estadística(DANE)), 63 percent of adult mortality is due to chronic diseases (DepartamentoAdministrativo Nacional de Estadística, 2005).
The high prevalence of overweight, obesity, and physical inactivity has animportant effect on annual health-care costs of countries. They have effects on the costsof public health systems, the sustainability of retirement pension systems, andeconomic and social stability (Colditz, 1999; Gobierno Federal, 2010; Thorpe et al., 2004).For instance, Finkelstein et al. (2003) estimated that overweight and obesity-
555
SD model ofthe nutritional
stages
Dow
nloa
ded
by U
nive
rsid
ad d
e C
hile
At 1
2:50
11
Aug
ust 2
016
(PT
)
attributable medical spending accounted for 9.1 percent of total annual US medicalexpenditures in 1998. Other studies reported that obese and overweight individualshave higher annual health-care costs than normal-weight individuals (Thompson et al.,2001; Thorpe et al., 2004; Zarate et al., 2009).
In Latin America the health care costs associated with obesity, overweight, andphysical inactivity are significant. In Mexico, people who develop diseases related tooverweight and obesity live an average of 14.5 years in a sick state, and their lifeexpectancy is reduced by seven years. Furthermore, the estimated direct cost resultingfrom the medical care associated with diseases related to overweight and obesityincreased by 61 percent between 2000 and 2008. In 2008, that cost represented33.2 percent of the federal spending for health services. Additionally, the indirect costsof the lost productivity due premature death attributable to overweight and obesityhave increased from approximately US$0.95 billion in 2000 to US$2.4 billion in 2008(Gobierno Federal, 2010). Likewise, Zarate et al. (2009) showed that annual health carecosts for obese workers in a mining company in Chile were 17 percent higher than thoseof normal-weight workers, and they took 25 percent more days of sick leave per year.
Hence, the obesity and associated consequences have become a challenging publichealth problem due to the diversity of actors with different motivations (families,schools, retailers, industry, government agencies, the media, health-care providers, andcity planners, among others), who interact to produce a variety of outcomes at thedifferent levels and scales involved (genes, neurobiology, psychology, family structure,social context and social norms, environment, markets, and public policy) (Hammond,2009); and different complex factors (food and physical, cultural, or economicenvironment) with linkages and feedbacks between them that influence thedevelopment of obesity in individuals; that impact the success or failure of theprevention efforts (Huang et al., 2009; Karanfil et al., 2011). The previous features areclassic characteristics of a complex system in which a large number of internal andexternal elements affect the dynamics of the system in nonlinear and unexpectedmanners; therefore, it is natural to expect that the obesity and its associated featurescan be studied using a complex-system approach (Hammond, 2009).
Although different researchers have studied the obesity and its associated featuresusing statistical analysis (Dearth-Wesley et al., 2008; Dinsa et al., 2012; Martorell et al.,2000; McLaren, 2007; Monteiro et al., 2000, 2004a, b, 2007; Ng et al., 2014; Popkin et al.,2012; Swinburn et al., 2011; Wang and Lim, 2012), researches that study this problemusing complex system approaches are limited (Dangerfield and Zainal Abidin, 2010). Inparticular, the researches that have been studying the obesity dynamics and itsassociated features tend to adopt one of three different frameworks: system dynamics(SD) (Dangerfield and Zainal Abidin, 2010; Abdel-Hamid, 2003; Flatt, 2004; Homer et al.,2006; Dangerfield and Norhaslinda, 2011; Karanfil et al., 2011; Rahmandad, 2012;Rahmandad and Sabounchi, 2012; Karanfil, 2009; Sabounchi et al., 2014; Fallah-Fini et al.,2014), network analysis (Christakis and Fowler, 2007; De la Haye et al., 2010; Sawka et al.,2013), and agent-based modeling (ABM) (Auchincloss et al., 2011; Phillips, 1999).Particularly, at the population level, which is the interest of this research, Rahmandad andSabounchi (2011) built individual SD models for both childhood and adulthood to capturethe energy balance and weight change throughout the individuals’ lives and aggregatedthese individual models to population-level trends. Similarly, Homer et al. (2006) studiedchanging obesity trends on the entire US population, using four BMI categories inconjunction with the annual aging of population cohorts. However, investigations thatstudy the obesity dynamics using a systemic approach in LMICs are limited. Therefore,
556
K45,4
Dow
nloa
ded
by U
nive
rsid
ad d
e C
hile
At 1
2:50
11
Aug
ust 2
016
(PT
)

the purpose of this research is to study and model the nutritional stages dynamics,separated in body mass index (BMI) categories (e.g, not overweight, overweight, andobese), within the Colombian urban population using a SD model. In particular, wepropose a model that can be used to: study the dynamics of the prevalences of overweightand obesity over time; and estimate the transference rates (TRs) between BMI categories.
2. MethodsHence, to study the nutritional stages dynamics within the Colombian urban population,we propose a population-level SD model that captures the transitions of population byBMI categories. We then propose a heuristic to estimate the TRs between BMI categoriesusing data from the Colombian Demographic and Health Survey (Encuesta Nacional deDemografía y Salud (ENDS)) (Profamilia, 2005) and (Profamilia, 2010).
Model of the nutritional stages dynamics of populationThe model propose in this work seeks to understand the nutritional stages dynamics ofthe Colombian urban population. The model includes accumulation structures for threeBMI categories (not overweight, overweight, and obese). The population was classifiedinto each BMI category according to the 2006WHO child growth standards for childrenunder five (World Health Organization, 2006), 2006 WHO child growth referencesfor children 5-17 (De Onis et al., 2007), and WHO cutoff points for adults ⩾18 years(Author, 1998). For children and adolescents aged 0-17 years, the WHO system definesnot overweight as a BMI for age and sex z-score⩽ 1 standard deviation, overweight asa BMI for age and sex z-scoreW1 standard deviation and⩽ 2 standard deviations, andobese as a BMI for age and sex z-scoresW2 standard deviations. For adults, the WHOsystem defines not overweight as a BMIo25 kg/m2, overweight as a BMI⩾ 25 ando30 kg/m2, and obese as a BMI⩾ 30 kg/m2. The accumulation structures of populationalso includes births and deaths for each BMI category. We used nationallyrepresentative data from ENDS for individuals of urban areas aged 0-59 years tocalculate the distributions of BMI categories (Profamilia, 2005).
The mathematical form of the model is as follows:
dN tð Þdt
¼ BN tð Þþt4W tð Þ�t1N tð Þ�EN tð Þ 1�Sð Þ�EN tð ÞS (1)
dW tð Þdt
¼ BW tð Þþt1N tð Þþt3O tð Þ�W tð Þ t2þt4ð Þ�EW tð Þ 1�Sð Þ�EW tð ÞS (2)
dO tð Þdt
¼ BO tð Þþt2W tð Þ�t3O tð Þ�EO tð Þ 1�Sð Þ�EO tð ÞS (3)
where N(t), W(t), O(t) are the population of not-overweight, overweight, and obeseindividuals, respectively at time t (people); BN, BW, BO are the births for each BMIcategory (people per year); EN, EW, EO are the exit rates of individuals per year for eachBMI category at time t (people per year); and S is the survival fraction. We consider thepopulation up to a maximum age of 60 years, so that people reaching this age exit thesystem. The exit rate is the total number of individuals per year that mature to the nextage (60 ages) by BMI category and is divided into two flows: those who mature into thenext age S and those who die (1−S). The parameters τ1 and τ2 are the TRs, whichcorresponds to the fraction of individuals per year from the not overweight and the
557
SD model ofthe nutritional
stages
Dow
nloa
ded
by U
nive
rsid
ad d
e C
hile
At 1
2:50
11
Aug
ust 2
016
(PT
)
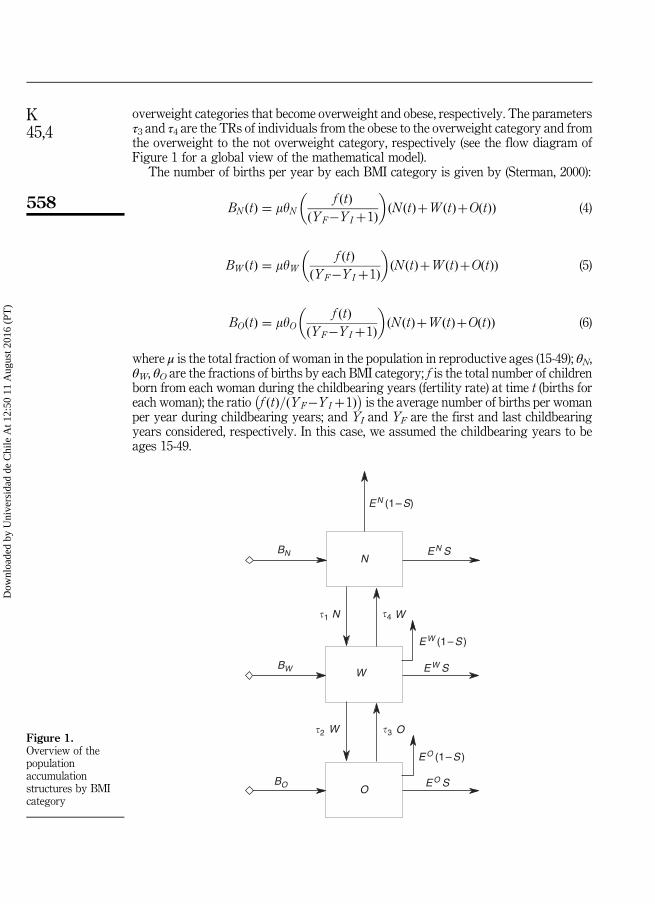
overweight categories that become overweight and obese, respectively. The parametersτ3 and τ4 are the TRs of individuals from the obese to the overweight category and fromthe overweight to the not overweight category, respectively (see the flow diagram ofFigure 1 for a global view of the mathematical model).
The number of births per year by each BMI category is given by (Sterman, 2000):
BN tð Þ ¼ myNf tð Þ
YF�YI þ1ð Þ
� �N tð ÞþW tð ÞþO tð Þð Þ (4)
BW tð Þ ¼ myWf tð Þ
YF�YI þ1ð Þ
� �N tð ÞþW tð ÞþO tð Þð Þ (5)
BO tð Þ ¼ myOf tð Þ
YF�YI þ1ð Þ
� �N tð ÞþW tð ÞþO tð Þð Þ (6)
where μ is the total fraction of woman in the population in reproductive ages (15-49); θN,θW, θO are the fractions of births by each BMI category; f is the total number of childrenborn from each woman during the childbearing years (fertility rate) at time t (births foreach woman); the ratio f ðtÞ=ðYF�YI þ1Þ� �
is the average number of births per womanper year during childbearing years; and YI and YF are the first and last childbearingyears considered, respectively. In this case, we assumed the childbearing years to beages 15-49.
EN (1–S)
EW (1–S )
EO (1–S )
EN S
EW S
EO S
BN
BW
BO
N
W
O
N�1 �4 W
�2 W �3 OFigure 1.Overview of thepopulationaccumulationstructures by BMIcategory
558
K45,4
Dow
nloa
ded
by U
nive
rsid
ad d
e C
hile
At 1
2:50
11
Aug
ust 2
016
(PT
)

The exit rates per year by each BMI category are modeled as (Sterman, 2000):
EN tð Þ ¼ DELAY1 BN tð Þþt4W tð Þ�t1N tð Þ;Yð Þ (7)
EW tð Þ ¼ DELAY1 BW tð Þþt1N tð Þþt3O tð Þ�W tð Þ t2þt4ð Þ;Yð Þ (8)
EO tð Þ ¼ DELAY1 BO tð Þþt2W tð Þ�t3O tð Þ;Yð Þ (9)
where DELAY1 function represents a first-order material delay using an exponentialdelay time of delay duration Y. In this case, the delay time was Y¼ 60 years consistentwith the 60 year size of the population in the accumulation structures. Finally, thesurvival fraction is given by (Sterman, 2000):
S ¼ exp RYð Þ (10)
In this formulation, R is the mortality rate per year. We assume that the mortality rateis the same for each BMI category.
Details of the source of the data for the model is described in Table I. We conducteddata processing in SAS, version 9.3 (SAS Institute Inc., Cary, NC, USA) andMathematica, version 9.0.1 (Wolfram research, Inc.). We conducted all simulations iniThink software, version 9.0.2 (ISEE systems, Inc.).
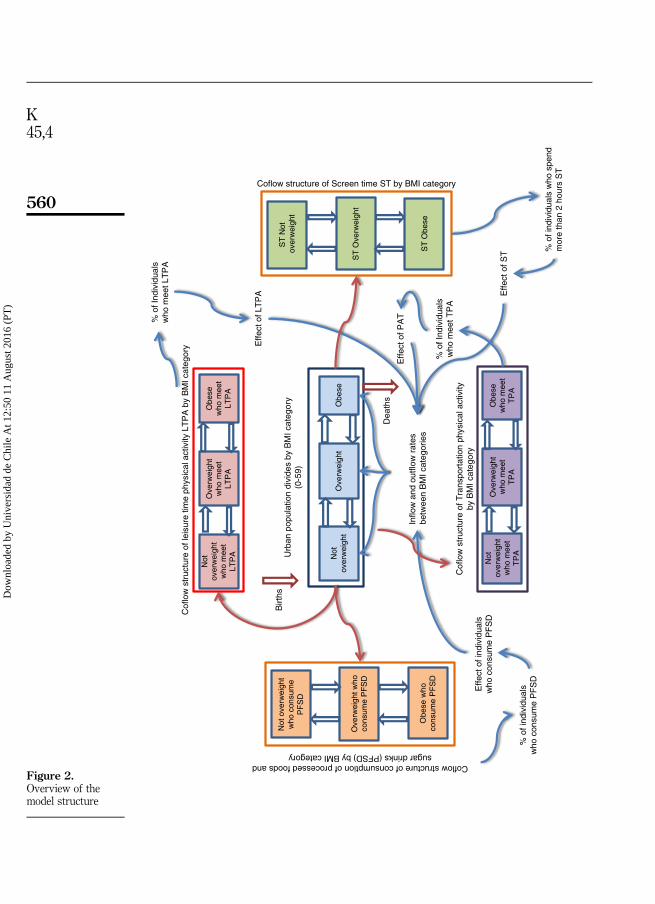
Additionally, we propose four attributes that can have an effect on the TRs betweenBMI categories: leisure time physical activity (LTPA), transportation physical activity(TPA), consumption of processed foods and sugar drinks (PFSD), and screen time (ST)(Figure 2, Table II). We chose these four attributes because, according to the literature
Item Data source
Prevalence rates by BMI categoryHeight-for-age z-score and BMI for age and sexz-score for children and adolescents 0-17
ENDS (2005-2010)
BMI category prevalence by age
Population compositionPopulation size aged 0-59 DANE. Estimations and population projections
1985-2020 (Departamento Administrativo Nacionalde Estadística (DANE), nd)
Mortality rate (0-59) DANE. Vital Statistics (2005) (DepartamentoAdministrativo Nacional de Estadística (DANE), nd)
Fertility rate World Data Bank. World Development Indicators.(2005-2012)Projections for 2013-2030. Forecast series using theHolt-Winters no seasonal method in EViews 5(Quantitative Micro Software, LLC)
Fraction of births by BMI category ENDS (2005)Notes: aENDS, Colombian Demographic and Health Survey; DANE, Colombian National Departmentof Statistics (for the Spanish acronym); WHO, World Health Organization; BMI, body mass index
Table I.Data sources used
in the modela
559
SD model ofthe nutritional
stages
Dow
nloa
ded
by U
nive
rsid
ad d
e C
hile
At 1
2:50
11
Aug
ust 2
016
(PT
)
Not
over
wei
ght
Ove
rwei
ght
Obe
se
Urb
an p
opul
atio
n di
vide
s by
BM
I cat
egor
y(0
-59)
Birt
hs
Dea
ths
Inflo
w a
nd o
utflo
w r
ates
betw
een
BM
I cat
egor
ies
Not
over
wei
ght
who
mee
tLT
PA
Ove
rwei
ght
who
mee
tLT
PA
Obe
sew
ho m
eet
LTP
A
Cof
low
str
uctu
re o
f lei
sure
tim
e ph
ysic
al a
ctiv
ity L
TP
A b
y B
MI c
ateg
ory
% o
f Ind
ivid
uals
who
mee
t LT
PA
Effe
ct o
f LT
PA
Not
over
wei
ght
who
mee
tT
PA
Ove
rwei
ght
who
mee
tT
PA
Obe
sew
ho m
eet
TP
A
Cof
low
str
uctu
re o
f Tra
nspo
rtat
ion
phys
ical
act
ivity
by B
MI c
ateg
ory
% o
f Ind
ivid
uals
who
mee
t TP
A
Effe
ct o
f PA
T
Not
ove
rwei
ght
who
con
sum
eP
FS
D
Ove
rwei
ght w
hoco
nsum
e P
FS
D
Coflow structure of consumption of processed foods andsugar drinks (PFSD) by BMI category
Effe
ct o
f ind
ivid
uals
who
con
sum
e P
FS
D
% o
f ind
ivid
uals
who
con
sum
e P
FS
D
Obe
se w
hoco
nsum
e P
FS
D
ST
Not
ov
erw
eigh
t
ST
Ove
rwei
ght
Coflow structure of Screen time ST by BMI category
ST
Obe
se
Effe
ct o
f ST %
of i
ndiv
idua
ls w
ho s
pend
mor
e th
an 2
hou
rs S
T
Figure 2.Overview of themodel structure
560
K45,4
Dow
nloa
ded
by U
nive
rsid
ad d
e C
hile
At 1
2:50
11
Aug
ust 2
016
(PT
)
review, these factors are important variables associated with obesity and thenutritional transition (Popkin, 2009; Popkin et al., 2012; Schmidhuber and Shetty, 2005).These attributes are modeled using coflow structures due to the importance of keepingtrack of them as the individuals travel through the system’s stock and flow structure(Sterman, 2000). The coflow for each attribute is a stocks and flows structure that exactlyreplicate the population accumulation structure to keep track of the attribute ofindividuals in each BMI category. The coflow structures used in this model are conserved(Sterman, 2000), i.e., the attribute stocks by BMI category can only change whenindividuals travel through the population accumulation structures by BMI categories.The average values of the coflow structures (attributes) have an effect on the TRsbetween the BMI categories. The average value of a coflow structure by each BMIcategory is the total attribute level divided by the total number of individuals in thecorresponding stock of the population accumulation structure. Here, there are differentfeedback structures between the population accumulation structures by BMI categoriesand the coflows by each attribute. For example, the coflow structure of LTPA attributetrack the number of individuals who meet the requirements of LTPA as persons movebetween the BMI categories. And the average values of the LTPA coflow structure(percentages of individuals who meet the requirements of LTPA) by BMI category havean effect on the TRs between BMI categories of the population accumulation structures(Figure 2). The conceptualization of the complete model is shown in Figure 2 (Table II).We do not take into account in the simulation the coflow structures of the fourattributes LTPA, TPA, PFSD, and ST, because in the ENDS and the National NutritionSurvey in Colombia (name Encuesta Nacional de la Situación Nutritional en Colombia(ENSIN)) (Instituto Colombiano de Bienestar Familiar (ICBF), 2005, 2010) theinformation of these attributes were not collected for all BMI categories and ages.Therefore, we do not have data to run the complete model.
Estimation of transferences rates between BMI categoriesTo calibrate the model, we estimated the TRs by BMI categories using 2005and 2010 data from the ENDS survey. We initialize the model by using the distributionof BMI categories from ENDS 2005. We propose a heuristic to calculate theTRs between BMI categories. The heuristic seeks to find the TRs that minimize the
Attribute/coflow Definition Data sources/literature
Leisure timephysical activity(LTPA)
Number of individuals who meet therequirements of leisure time physicalactivity (150 min/week)
ENSIN 2010WHO. Global recommendations onphysical activity for health. Geneva:World Health Organization; 2010
Transportationphysical activity(TPA)
Number of individuals who meet therequirements of physical activityassociated with transport (150 min/week)
Consumption ofprocessed foods andsugar drinks (PFSD)
Number of individuals who consumefrequently (three or more times for week)processed foods and sugar drinks
ENSIN 2010
Screen Time (TP) Number of individuals who spend morethan 2 of hours watching television,playing video games, or browsing theinternet
ENSIN 2010
Table II.Attributes used tomodel the coflow
structures byBMI category and
age group
561
SD model ofthe nutritional
stages
Dow
nloa
ded
by U
nive
rsid
ad d
e C
hile
At 1
2:50
11
Aug
ust 2
016
(PT
)

difference between the prevalence rates by BMI categories and the estimatedprevalences. To calculate the TRs by BMI category we built the following systemof equations:
P0 ¼ B:P (11)
where:
B ¼ A: A: A: A:Að Þð Þð Þ
A ¼a1�t1 t4 0
t1 a2�t2�t4 t30 t2 a3�t3
0B@
1CA; P
0 ¼pN100
pW100
pO100
0B@
1CA; P ¼
PN05
PW05
PO05
0B@
1CA
where PN05, PW05, PO05 are the prevalence rates by BMI category of the population aged 0-59in 2005; α1, α2, α3 are the retention rates for individuals by BMI category, which correspondsto the fraction of individuals who stay in the same BMI category between 2005 and 2010;τ1 and τ2, respectively, are the TRs of individuals from not overweight to overweight andfrom overweight to obese; τ3 and τ4, respectively, are the TRs of individuals from obeseto overweight and from overweight to not overweight; and p0N10; p
0W10; p
0O10 are the
estimated prevalence rates by BMI category of the population aged 5-64 in 2010, five yearslater. We suppose that the individuals aged 5-64 in 2010 are the same individuals aged 0-59in 2005. The system of Equations (11) is solved by minimizing the following equation:
Min SC ¼ PN10�p0N10
� �2þ PW10�p0W10
� �2þ PO10�p0O10� �2
; (12)
with the restrictions:
a1þt1 ¼ 1
a2þt2þt4 ¼ 1
a3þt3 ¼ 1 (13)
0pakp1; k ¼ 1; 2; 3ð Þ
0ptlp1; l ¼ 1; 2; 3; 4ð Þwhere PN10, PW10, PO10 are the prevalence rates by BMI category of the population aged5-64 in 2010 from ENDS. To minimize Equation (12) and calculate the TRs, we use theFindMinimum function in Mathematica 9, which searches for a local minimum in afunction for several variables and constraints.
3. ResultsNutritional stage dynamics of Colombian urban populationUsing the heuristic described previously and data from ENDS 2005 and 2010, weestimated the TRs between BMI categories. The results showed that the Colombianurban population is moving to overweight and obese categories. The TRs from not
562
K45,4
Dow
nloa
ded
by U
nive
rsid
ad d
e C
hile
At 1
2:50
11
Aug
ust 2
016
(PT
)

overweight to overweight and from overweight to obese was τ1¼ 0.0076 and τ2¼ 0.0054,respectively. Additionally, the estimated TRs show that Colombian population is notmoving to a healthy weight. The TRs from obese to overweight and from overweightto not-overweight are almost zero. The retention rates of individuals by BMI category(α1, α2, α3) were close to 1, and consistent with the restrictions mentioned above.
With the model just constructed, we use the estimated TRs to model the nutritionalstages dynamics of the population from 2005 to 2030. We take 2005 as the initialcondition. The result of the simulation show that the prevalences of overweight andobesity increase from 27.1 and 11.5 percent in 2005 to 30.7 and 13.6 percent by 2030,respectively (Figure 3). Figure 3 shows that simulated curves of BMI categories closelyreplicate the observed prevalences in 2010. The differences are mainly minimizingerrors and variations in the overall population.
Simulation of the effect of interventions on the nutritional stage dynamicsWe conduct simulations to show the potential of the proposed model for testing theeffectiveness of policy interventions related to overweight and obesity. In particular, wesimulate the effect of three interventions: first, the TR from overweight to notoverweight is changed from 3.47× 10e−7 to a value of 0.02 from 2011 to 2030; second,The TR from obese to overweight is changed from 1.025× 10e−7 to a value of 0.02 from2011 to 2030; and finally, the TRs from obese to overweight and from overweight to notoverweight are changed from 1.025× 10e−7 and 3.47× 10e−7, respectively, to a valueof 0.01 from 2011 to 2030. The results of scenario 1 show that the prevalence rates ofoverweight and obesity are reduced in 7.7 and 0.24 percent by 2015, and 23.2 and2.7 percent by 2030, respectively, compared with the base scenario (Figure 4(a)).The results of scenario 2 show that the prevalence rate of overweight is increased in3.29 percent by 2015 and 22.2 percent by 2030, respectively, while the prevalence rate ofobesity is reduced in 7.8 percent by 2015 and 26.5 percent by 2030, respectively,compared with the base scenario (Figure 4(b)). Finally, the results of scenario 3 showthat the prevalence rates of overweight and obesity are reduced in 2.26 and 4.13 percentby 2015, and 5.7 and 14.3 percent by 2030, respectively, compared with the basescenario (Figure 4(c)). In general, the results show that there is different effects on theprevalence of overweight and obesity over time, depending where we intervenethe system.
60
50
40
30
20
10
02005 2010 2015 2020
Year
Per
cent
age
Not overweight fraction
Obese fraction
Overweight fraction
Prevalences by BMI 2010
2025 2030
Figure 3.Estimated fractionsof the population
by BMI categoriesover time
563
SD model ofthe nutritional
stages
Dow
nloa
ded
by U
nive
rsid
ad d
e C
hile
At 1
2:50
11
Aug
ust 2
016
(PT
)

Pre
vale
nces
by
BM
I cat
egor
y E
ND
S 2
010
Not
ove
rwei
ght f
ract
ion
Ove
rwei
ght f
ract
ion
Obe
se fr
actio
n
60 50 40 30 20 10 0
60 50 40 30 20 10 0
60 50 40 30 20 10 020
0520
1020
1520
20
Year
Percentage
Percentage
Percentage
2025
2030
2005
2010
2015
2020
Year
2025
2030
2005
2010
2015
2020
Year
2025
2030
(a)
(b)
(c)
Notes: (
a) T
he T
R fr
om o
verw
eigh
t to
not o
verw
eigh
t is c
hang
ed fr
om 3
.47×
10e–
7 to
a v
alue
of 0
.02
from
201
1 to
203
0; (b
) the
TR fr
om o
bese
to o
verw
eigh
t is c
hang
ed fr
om 1
.025
×10
e–7
to a
val
ue o
f 0.0
2 fr
om 2
011
to 2
030;
(c) t
he T
Rs f
rom
obe
se to
over
wei
ght a
nd fr
om o
verw
eigh
t to
not o
verw
eigh
t are
cha
nged
from
1.0
25×
10e–
7 an
d 3.
47×
10e–
7, re
spec
tivel
y, to
a v
alue
of
0.01
from
201
1 to
203
0
Figure 4.Estimated fractionsof the populationby BMI categoriesover time forthree scenarios
564
K45,4
Dow
nloa
ded
by U
nive
rsid
ad d
e C
hile
At 1
2:50
11
Aug
ust 2
016
(PT
)
4. DiscussionObesity is a growing epidemic and, in recent years, has emerged as a one of themajor challenges in public health (Ng et al., 2014). In this context, the analysis ofthe nutritional stages dynamics at population level is crucial. From the systemicapproach, this study shows that Colombian urban population is moving tooverweight and obese categories. The TRs toward overweight and obese categoriesare higher than the TRs toward the not overweight category. In general, Colombianpopulation is not moving to a healthy weight. In fact, the simulation resultsshow that the prevalences of overweight and obesity will increase in 6.2 and7.5 percent by 2015, and 13.4 and 18.9 percent by 2030, respectively, if the estimatedTRs do not change.
These findings are consistent with the results found by Ng et al. (2014), who showedthat the proportion of overweight and obesity population in Colombia is on the rise. Infact, they estimated that the prevalence of overweight and obesity combined hasincreased in 20 percent for men, 6 percent for women, 16 percent for boys, and 0 percentfor girls between 2000 and 2013. Additionally, our results are consistent with theresults of the prevalences of overweight and obesity of the Colombian urban populationaged 0-59 reported in the ENDS and ENSIN surveys in 2010. According to these data,the prevalences of overweight and obesity has increased in 6 and 21.5 percent,respectively between 2005 and 2010 (Profamilia, 2005, 2010).
The proposed model offer a tool for researchers to model the obesity dynamics, acomplex public health issue. In fact, it employs accumulation structures (stock and flowrelationships) by three BMI category (not overweight, overweight, and obese) to studythe nutritional stages dynamics of a population. Accumulation structures allow thecharacterization of the system and provide the information to support the decisions andactions to be taken (Sterman, 2000). Additionally, the proposed model takes intoaccount the feedback structures that there are between population accumulationstructures by BMI categories and the coflows by each attribute. The model could beused to understand the effects of LTPA, TPA, PFSD, and ST on the nutritional stagesdynamics of a population. The complex behavior of a system normally arises over timefrom the interactions (feedbacks) among its components (Sterman, 2000). Furthermore,the proposed model can be used to study the effects of policy interventions to preventoverweight and obesity. In particular, opens the possibility to test the effect ofpolicy interventions by BMI category, such as interventions on the TRs rates betweenBMI categories.
Additionally, the proposed model has some differences from the other SD modelsthat have been developed to study the obesity dynamics and its associated features atthe population level. First, this study seek to understand the nutritional stagesdynamics of Colombian urban population (population aged 0-59 years), which is amiddle income country, with a high burden of NCDs. Investigations about the obesitydynamics at population level using a systemic approach have been developed,particularly, in HICs (Dangerfield and Zainal Abidin, 2010; Fallah-Fini et al., 2014;Homer et al., 2006). Second, we proposed a heuristic that minimize the differencebetween the prevalence rates and the estimated prevalences by BMI categories toestimate the TRs of individuals between BMI categories. In contrast, Homer et al. (2006)used a method to estimate the flow rates between BMI categories. They proposed anequation that takes into account the cut-points for BMI categories, the median BMIwithin each BMI category, and the median height, to translate the change in caloricbalance into a change in a flow rate.
565
SD model ofthe nutritional
stages
Dow
nloa
ded
by U
nive
rsid
ad d
e C
hile
At 1
2:50
11
Aug
ust 2
016
(PT
)

The proposed model present some limitations. Due to the lack of longitudinal data totrace the growth of individuals by BMI categories, we only used data from ENDS 2005and 2010 to estimate the TRs between BMI categories. In future studies, it is importantinclude data of the next ENDS 2015 to validate the heuristic. Although we showed thatthe model can be used to study the effects of public health interventions to preventoverweight and obesity, it was developed to study the nutritional stages dynamicsof a complete population. Futures studies should focus on understanding how thenutritional stages dynamics can be separated by different age and socioeconomicstatus (SES) groups with the purpose to identify risk subgroups of the population(e.g. by BMI category, age, and SES) that ought to be targeted. Another limitation isthat in this work we could not assess the effect of the four attributes LTPA, TPA,PFSD, and ST on the TRs between BMI categories because in the ENDS and ENSINsurveys the information of these attributes was not collected for all BMI categories andages. The next ENDS and ENSIN surveys, for which the collecting data is planned for2015, will measure the different factors associated with physical activity, consumptionof food, and sedentary behaviors for the all ages. Futures studies could include thesedata to assess the effects of these attributes on the TRs.
In conclusion, the prevalences of overweight and obesity of Colombian urbanpopulation, as it is worldwide, are increasing over time. In this study, we proposed a SDmodel that offer an innovative tool to policy makers to help understanding thenutritional stages dynamics at population level. In particular, it can be used to studyand track the changes on the dynamics of the prevalences of BMI categories over time.In addition, the model can be used as a guide to analyze the effects of public healthinterventions on the TRs rates between BMI categories.
References
Abdel-Hamid, T.K. (2003), “Exercise and diet in obesity treatment: an integrative system dynamicsperspective”, Medicine and Science in Sports and Exercise, Vol. 35 No. 3, pp. 400-413.
Auchincloss, A.H., Riolo, R.L., Brown, D.G., Cook, J. and Diez Roux, A.V. (2011), “An agent-basedmodel of income inequalities in diet in the context of residential segregation”, AmericanJournal of Preventive Medicine, Vol. 40 No. 3, pp. 303-311.
Author (1998), “Clinical guidelines on the identification, evaluation, and treatment of overweightand obesity in adults: executive summary. Expert panel on the identification, evaluation,and treatment of overweight in adults”, The American Journal of Clinical Nutrition, Vol. 68No. 4, pp. 899-917.
Calle, E.E., Thun, M.J., Petrelli, J.M., Rodriguez, C. and Heath, C.W. Jr (1999), “Body-mass indexand mortality in a prospective cohort of US adults”, The New England Journal of Medicine,Vol. 341 No. 15, pp. 1097-1105.
Christakis, N.A. and Fowler, J.H. (2007), “The spread of obesity in a large social network over 32years”, The New England Journal of Medicine, Vol. 357 No. 4, pp. 370-379.
Colditz, G.A. (1999), “Economic costs of obesity and inactivity”, Medicine and Science in Sportsand Exercise, Vol. 31 No. 11, pp. S663-S667.
Cuevas, A., Alvarez, V. and Olivos, C. (2009), “The emerging obesity problem in Latin America”,Expert Review of Cardiovascular Therapy, Vol. 7 No. 3, pp. 281-288.
Dangerfield, B. and Norhaslinda, Z.A. (2011), “The role of behaviour change in eating andphysical activity in the battle against childhood obesity”, Presented at the Procs of the 29thInternational Conference of the System Dynamics Society, Washington, DC, July 24-28,available at: http://usir.salford.ac.uk/17831/ (accessed January 7, 2015).
566
K45,4
Dow
nloa
ded
by U
nive
rsid
ad d
e C
hile
At 1
2:50
11
Aug
ust 2
016
(PT
)

Dangerfield, B.C. and Zainal Abidin, N. (2010), “Towards a model-based tool for evaluatingpopulation-level interventions against childhood obesity”, Procs of the International SystemDynamics Conference, Presented at the International Conference of the System DynamicsSociety, Seoul, July 25-29, available at: www.systemdynamics.org/conferences/2010/proceed/index.html (accessed January 7, 2015).
De la Haye, K., Robins, G., Mohr, P. and Wilson, C. (2010), “Obesity-related behaviors inadolescent friendship networks”, Social Networks, Vol. 32 No. 3, pp. 161-167.
De Onis, M., Onyango, A.W., Borghi, E., Siyam, A., Nishida, C. and Siekmann, J. (2007),“Development of a WHO growth reference for school-aged children and adolescents”,Bulletin of the World Health Organization, Vol. 85 No. 9, pp. 660-667.
Dearth-Wesley, T., Wang, H. and Popkin, B.M. (2008), “Under- and overnutrition dynamicsin Chinese children and adults (1991-2004)”, European Journal of Clinical Nutrition, Vol. 62No. 11, pp. 1302-1307.
Departamento Administrativo Nacional de Estadística (2005), “Estadísticas vitales”, DANE, Bogotá.
Dinsa, G.D., Goryakin, Y., Fumagalli, E. and Suhrcke, M. (2012), “Obesity and socioeconomicstatus in developing countries: a systematic review”,Obesity Reviews: An Official Journal ofthe International Association for the Study of Obesity, Vol. 13 No. 11, pp. 1067-1079.
Eriksson, J.G. (2007), “Epidemiology, genes and the environment: lessons learned from theHelsinki Birth Cohort Study”, Journal of Internal Medicine, Vol. 261 No. 5, pp. 418-425.
Fallah-Fini, S., Rahmandad, H., Huang, T.T.-K., Bures, R.M. and Glass, T.A. (2014), “Modeling USadult obesity trends: a system dynamics model for estimating energy imbalance gap”,American Journal of Public Health, Vol. 104 No. 7, pp. 1230-1239.
Finkelstein, E.A., Fiebelkorn, I.C. and Wang, G. (2003), “National medical spending attributableto overweight and obesity: how much, and who’s paying?”, Health Affairs, SupplementWeb Exclusives W3, pp. 219-226. doi: 10.1377/hlthaff.w3.219.
Flatt, J.-P. (2004), “Carbohydrate-fat interactions and obesity examined by a two-compartmentcomputer model”, Obesity Research, Vol. 12 No. 12, pp. 2013-2022.
Fontaine, K.R., Redden, D.T., Wang, C., Westfall, A.O. and Allison, D.B. (2003), “Years of life lostdue to obesity”, JAMA: The Journal of the American Medical Association, Vol. 289 No. 2,pp. 187-193.
Gaziano, T.A. (2005), “Cardiovascular disease in the developing world and its cost-effectivemanagement”, Circulation, Vol. 112 No. 23, pp. 3547-3553.
Gobierno Federal (2010), “Acuerdo Nacional para la Salud Alimentaria. Estrategia contra elsobrepeso y la obesidad”, Secretaria de Salud. Estados Unidos Mexicanos, México, availableat: http://avs.org.mx/docs/AcuerdoNacionalSaludAlimentaria.pdf (accessed January 7, 2015).
Hammond, R.A. (2009), “Complex systems modeling for obesity research”, Preventing ChronicDisease, Vol. 6 No. 3, pp. A97, 1-10.
Homer, J., Milstein, B., Dietz, W., Buchner, D. and Majestic, E. (2006), “Obesity populationdynamics: exploring historical growth and plausible futures in the US”, Presented at theProcs of the 24th International Conference of the System Dynamics Society, Nijmegen, July23-27, available at: www.researchgate.net/publication/228433561_Obesity_population_dynamics_exploring_historical_growth_and_plausible_futures_in_the_US (accessedJanuary 7, 2015).
Huang, T.T., Drewnosksi, A., Kumanyika, S. and Glass, T.A. (2009), “A systems-orientedmultilevel framework for addressing obesity in the 21st century”, Preventing ChronicDisease, Vol. 6 No. 3, pp. A82, 1-10.
Instituto Colombiano de Bienestar Familiar (ICBF) (2005), Encuesta Nacional de la SituaciónNutricional en Colombia, Instituto Colombiano de Bienestar Familiar, Bogotá.
567
SD model ofthe nutritional
stages
Dow
nloa
ded
by U
nive
rsid
ad d
e C
hile
At 1
2:50
11
Aug
ust 2
016
(PT
)

Instituto Colombiano de Bienestar Familiar (ICBF) (2010), Encuesta Nacional de la SituaciónNutricional en Colombia, Instituto Colombiano de Bienestar Familiar ICBF, Bogotá.
Karanfil, Ö. (2009), “A system dynamics model of body weight regulation and obesity”, Presentedat the Proceedings of the 27th Int. System Dynamics Conference, Albuquerque, New Mexico,July 26-30.
Karanfil, Ö., Moore, T., Finley, P., Brown, T., Zagonel, A. and Glass, R. (2011), “Amulti-scale paradigmto design policy options for obesity prevention: exploring the integration of individual-basedmodeling and system dynamics”, Presented at the Procs of the 29th International Conference ofthe System Dynamics Society, Washington, DC, July 24-28, available at: www.sandia.gov/casosengineering/docs/SD2011_Obesity_2011-6146%20P.pdf (accessed January 7, 2015).
Lopez, A.D., Mathers, C.D., Ezzati, M., Jamison, D.T. and Murray, C.J. (2006), Global Burden ofDisease and Risk Factors, World Bank, Washington, DC, available at: www.ncbi.nlm.nih.gov/books/NBK11812/ (accessed 16 January 2015).
McLaren, L. (2007), “Socioeconomic status and obesity”, Epidemiologic Reviews, Vol. 29, pp. 29-48.doi: 10.1093/epirev/mxm001.
Martorell, R., Khan, L.K., Hughes, M.L. and Grummer-Strawn, L.M. (2000), “Obesity in women fromdeveloping countries”, European Journal of Clinical Nutrition, Vol. 54 No. 3, pp. 247-252.
Monteiro, C.A., Conde, W.L. and Popkin, B.M. (2007), “Income-specific trends in obesity in Brazil:1975-2003”, American Journal of Public Health, Vol. 97 No. 1, pp. 1808-1812.
Monteiro, C.A., Conde, W.L., Lu, B. and Popkin, B.M. (2004a), “Obesity and inequities in health in thedeveloping world”, International Journal of Obesity and RelatedMetabolic Disorders: Journal ofthe International Association for the Study of Obesity, Vol. 28 No. 9, pp. 1181-1186.
Monteiro, C.A., D’A Benicio, M.H., Conde, W.L. and Popkin, B.M. (2000), “Shifting obesity trendsin Brazil”, European Journal of Clinical Nutrition, Vol. 54 No. 4, pp. 342-346.
Monteiro, C.A., Moura, E.C., Conde, W.L. and Popkin, B.M. (2004b), “Socioeconomic status andobesity in adult populations of developing countries: a review”, Bulletin of the World HealthOrganization, Vol. 82 No. 12, pp. 940-946.
Ng, M., Fleming, T., Robinson, M., Thomson, B., Graetz, N., Margono, C., Mullany, E.C., Biryukov, S.,Abbafati, C., Abera, S.F., Abraham, J.P., Abu-Rmeileh, N.M.E., Achoki, T., AlBuhairan, F.S.,Alemu, Z.A., Alfonso, R., Ali, M.K., Ali, R., Guzman, N.A., et al. (2014), “Global, regional, andnational prevalence of overweight and obesity in children and adults during 1980-2013:a systematic analysis for the global burden of disease study 2013”, The Lancet, Vol. 384No. 9945, pp. 766-781. doi: 10.1016/S0140-6736(14)60460-8.
Pate, R.R., Pratt, M., Blair, S.N., Haskell, W.L., Macera, C.A., Bouchard, C., Buchner, D., Ettinger, W.,Heath, G.W. and King, A.C. (1995), “Physical activity and public health. A recommendationfrom the centers for disease control and prevention and the American college of sportsmedicine”, JAMA: the journal of the AmericanMedical Association, Vol. 273 No. 5, pp. 402-407.
Phillips, C.V. (1999), “Complex systems model of dietary choice with implications for improvingdiets and promoting vegetarianism”, The American Journal of Clinical Nutrition, Vol. 70No. 3, pp. 608S-614S.
Popkin, B.M. (2009), “Global changes in diet and activity patterns as drivers of the nutritiontransition”, Nestlé Nutrition Workshop Series. Paediatric Programme, Vol. 63, pp. 1-10,discussion 10-14, 259-268. doi: 10.1159/000209967.
Popkin, B.M., Adair, L.S. and Ng, S.W. (2012), “Global nutrition transition and the pandemic ofobesity in developing countries”, Nutrition Reviews, Vol. 70 No. 1, pp. 3-21.
Profamilia (2005), Encuesta Nacional de Demografía y Salud 2005 (ENDS). (NationalDemographic and Health Survey), Profamilia, Bogotá, Colombia.
568
K45,4
Dow
nloa
ded
by U
nive
rsid
ad d
e C
hile
At 1
2:50
11
Aug
ust 2
016
(PT
)

Profamilia (2010), Encuesta Nacional de Demografía y Salud 2010(ENDS). (National Demographicand Health Survey), Profamilia, Bogotá.
Rahmandad, B. (2012), “Modeling the dynamics of human body growth and maintenance”,Presented at the Procs of the 30th International Conference of the System Dynamics Society,St. Gallen, July 22-26, available at: www.systemdynamics.org/conferences/2012/proceed/papers/P1170.pdf (accessed January 7, 2015).
Rahmandad, H. and Sabounchi, N.S. (2011), “Building and estimating a dynamic model ofweight gain and loss for individuals and populations”, Presented at the Procs of the 29thInternational Conference of the System Dynamics Society, Washington, DC, July 24-28,available at: www.systemdynamics.org/conferences/2011/proceed/papers/P1230.pdf(accessed January 7, 2015).
Rahmandad, H. and Sabounchi, N.S. (2012), “Modeling and estimating individual and populationobesity dynamics”, SBP’12, Presented at the Proceedings of the 5th InternationalConference on Social Computing, Behavioral-Cultural Modeling and Prediction, Springer-Verlag, Berlin and Heidelberg, Maryland, April 3-5, pp. 306-313.
Sabounchi, N.S., Hovmand, P.S., Osgood, N.D., Dyck, R.F. and Jungheim, E.S. (2014), “A novelsystem dynamics model of female obesity and fertility”, American Journal of Public Health,Vol. 104 No. 7, pp. 1240-1246.
Sawka, K.J., McCormack, G.R., Nettel-Aguirre, A., Hawe, P. and Doyle-Baker, P.K. (2013),“Friendship networks and physical activity and sedentary behavior among youth: asystematized review”, The International Journal of Behavioral Nutrition and PhysicalActivity, Vol. 10 No. 130, pp. 1-9.
Schmidhuber, J. and Shetty, P. (2005), “Nutrition transition, obesity & noncommunicable diseases:drivers, outlook and concerns”, Overweight and obesity: a new nutrition emergency?SCN NEWS, Vol. 29, United Nations System.
Sterman, J.D. (2000), Business Dynamics: Systems Thinking and Modeling for a Complex World,McGraw-Hill/Irwin.
Swinburn, B.A., Sacks, G., Hall, K.D., McPherson, K., Finegood, D.T., Moodie, M.L. andGortmaker, S.L. (2011), “The global obesity pandemic: shaped by global drivers and localenvironments”, Lancet, Vol. 378 No. 9793, pp. 804-814.
Thompson, D., Brown, J.B., Nichols, G.A., Elmer, P.J. and Oster, G. (2001), “Bodymass index and futurehealthcare costs: a retrospective cohort study”, Obesity Research, Vol. 9 No. 3, pp. 210-218.
Thorpe, K.E., Florence, C.S., Howard, D.H. and Joski, P. (2004), “The impact of obesity on risingmedical spending”, Health Affairs, Supplement Web Exclusives, W4-480-6, pp. 480-486.doi: 10.1377/hlthaff.w4.480.
Wang, Y. and Lim, H. (2012), “The global childhood obesity epidemic and the association betweensocio-economic status and childhood obesity”, International Review of Psychiatry, Vol. 24No. 3, pp. 176-188.
Wilson, P.W.F., D’Agostino, R.B., Sullivan, L., Parise, H. and Kannel, W.B. (2002), “Overweightand obesity as determinants of cardiovascular risk: the Framingham experience”, Archivesof Internal Medicine, Vol. 162 No. 16, pp. 1867-1872.
World Health Organization (2006), “WHO child growth standards: length/height-for-age,weight-for-age, weight-for-length, weight-for-height and body mass index-for-age: methodsand development”, Geneva, available at: www.who.int/childgrowth/standards/technical_report/en/index.html (accessed February 19, 2013).
World Health Organization (2008), “The global burden of disease: 2004 update”, availableat: www.who.int/healthinfo/global_burden_disease/2004_report_update/en/index.html(accessed January, 16 2013).
569
SD model ofthe nutritional
stages
Dow
nloa
ded
by U
nive
rsid
ad d
e C
hile
At 1
2:50
11
Aug
ust 2
016
(PT
)

Zarate, A., Crestto, M., Maiz, A., Ravest, G., Pino, M.I., Valdivia, G., Moreno, M. and Villarroel, L.(2009), “Influence of obesity on health care costs and absenteeism among employees of amining company”, Revista médica de Chile, Vol. 137 No. 3, pp. 337-344.
About the authorsJose D. Meisel is an Associate Professor at the “Departamento de Ingeniería Industrial” of the“Facultad de Ingeniería” of the Universidad de Ibagué (Ibagué, Colombia). He has a PhD inEngineering from Universidad de los Andes. He is an Industrial Engineer from the “Universidadde Ibagué” and has a Master in Sciences from the Industrial Engineering Department, and a PhDin Engineering from the “Universidad de los Andes”. His current research interests includemodeling and simulation of complex systems, the study of obesity and physical activity from thecomplex systems approach, and structuring of social networks. He is a researcher of ComplexSystems Research Center (CEIBA), Theory of Organizational Systems Group (TESO),“Modelamiento y simulación de sistemas sociales complejos” (MYSCO) group, andEpidemiology Group of Universidad de los Andes (Epiandes). Jose D. Meisel is thecorresponding author and can be contacted at: [email protected]
Olga L. Sarmiento is an Associate Professor of the Department of Public Health at the Schoolof Medicine at the Universidad de los Andes (Bogota, Colombia). She holds an MD from theUniversidad Javeriana (Bogotá), an MPH, and a PhD in epidemiology at the University of NorthCarolina at Chapel Hill. Her current research interests include physical activity, nutrition andbuilt environment among the populations of children and adults in Latin America. She is partof International Physical Activity, and Environment Network (IPEN Network) and TheInternational Study of Childhood Obesity, Lifestyle and the Environment (ISCOLE).
Camilo Olaya is an Associate Professor of the Department of Industrial Engineering at theUniversidad de los Andes (Bogota, Colombia). His research area is the engineering of socialsystems and its applications to crime, justice, and security. He is the Member of the Theory ofOrganizational Systems Group (TESO) and the System Dynamics Society.
Juan A. Valdivia is a Professor at the “Departamento de Física” of the “Facultad de Ciencias”of the “Universidad de Chile” (Santiago, Chile). He has a PhD in Physics from the University ofMaryland, at College Park, with postdoctoral work at NASA Goddard Space Flight Center undera National Research Council Fellowship. His current areas of research are astrophysical andspace plasma physics, nano science, and complex system’s dynamics.
Roberto Zarama is a Mathematician of the Universidad Nacional de Colombia, PhD inPhilosophy of Ecole des Hautes Etudes en Sciences Sociales, with postdoctoral studies in theUniversity of Oxford and Ecole des Hautes Etudes en Sciences Sociales. Currently, he is aProfessor at the School of Engineering at the Universidad de los Andes (Bogota, Colombia) andthe Vice president of Complex Systems Research Center (CEIBA). His current research interestsinclude modeling and simulation of complex systems, understanding social exclusion systems,structuring of social networks, and learning models and methodologies.
For instructions on how to order reprints of this article, please visit our website:www.emeraldgrouppublishing.com/licensing/reprints.htmOr contact us for further details: [email protected]
570
K45,4
Dow
nloa
ded
by U
nive
rsid
ad d
e C
hile
At 1
2:50
11
Aug
ust 2
016
(PT
)