emergency medical services 2015 annual report cara m ... · havasu regional medical center - lake...
TRANSCRIPT
Cara M. Christ, MD, Director
Terry Mullins, MBA, Bureau Chief
Bentley J. Bobrow, MD, Medical Director
Emergency Medical Services
2015 Annual Report
Table of Contents
EMS Council Advisory Committee Membership ............................................................... i
Medical Direction Commission Advisory Committee Membership ................................ ii
Trauma & EMS Performance Improvement Standing Committee Membership ......... iii
Introduction ........................................................................................................................... 1
Map of Current Participating Agencies .............................................................................. 3
Submitting Agencies .............................................................................................................. 4
2014 Data EMS Annual Report ........................................................................................... 6
List of Tables & Figures ............................................................................................... 7
Purpose & Methodology .............................................................................................. 8
Total EMS Runs ............................................................................................................ 9
Treated & Transferred/Transported Population ..................................................... 16
Pediatric Population ................................................................................................... 20
Geriatric Population ................................................................................................... 25
Mortality ...................................................................................................................... 30
i.
Emergency Medical Services Council Advisory Committee Membership
Bentley Bobrow, MD
Chair
Arizona Department of Health Services– Medical
Director
Rebecca Haro, NREMT-P
Statewide Fire District Association Representative (TEPI
liaison)
North County Fire & Medical
Brian Smith
Emergency Medical Technician
Flagstaff Medical Center - Flagstaff, AZ
Chris Salvino, MD
Trauma Surgeon
Havasu Regional Medical Center - Lake Havasu City, AZ
Bob Ramsey
Ambulance Service Corporation
Dale Woolridge, MD
Public Member
Dan Millon
Department of Public Safety
Daniel Spaite, MD
Emergency Medicine Physician—Southeaster Region
Gene McDaniel
Prehospital Emergency Medical Training Program
Phoenix Fire Department
Glenn Kasprzyk
Public Member/Vice Chair
American Medical Response
Howard Reed
Ambulance Service Corporation
James Hayden, CEO
Public Member
Sara Perotti
Local EMS Coordinating System—Southeastern
Region
John Karolzak
Three Largest Employers of EMCTs
American Medical Response
Jonathan Maitem, DO
Emergency Medicine Physician—Central Region
Joseph Gibson
Local EMS Coordinating System—Central Region
Laura Baker
Three Largest Employer of EMCTs
Tucson Fire Department
Michele Preston, MD
Emergency Medicine Physician—Western Region
Nathan Lewis, RN
Public Member
Patricia Coryea-Hafkey, RN
Professional Nurse
Tyler Matthews, CEP
Public Member
Riane Page, MD
Emergency Medicine Physician—Northern Region
Robert Costello
Public Member
Rodney Reed
Local EMS Coordinating System—Western Region
Jim Dearing, DO
Hospital Administrator (Population >500K)
Todd Harms
Three Largest Employer of EMCTs
Alberto Gutier
Governor’s Office of Highway Safety
Christopher Baker, RN
Hospital Administrator (Population <500K)

ii.
Bentley Bobrow, MD
Chair
Arizona Department of Health Services– Medical
Director
Gail Bradley, MD
Physician Specializing in Cardiac Care/Vice Chair
Education Liaison
Daniel Spaite, MD
Emergency Medicine Physician—Southeastern
Region
Frank Walter, MD
Physician Specializing in Toxicology
Jonathan Maitem, DO
Emergency Medicine Physician—Central Region
Kevin Foster, MD
Physician Specializing in Trauma Surgery
Michele Preston, MD
Emergency Medicine Physician—Western Region
Nicholas Theodore, MD
Physician Specializing in Acute Head Injury/Spinal
Cord Care
Phillip Richemont
Physician with Full-Time Practice in a Rural Area
Riane Page, MD
Emergency Medicine Physician—Northern Region
(TEPI Liaison)
Toni Gross, MD
Physician Specializing in Pediatric Medicine (PMD
Liaison)
James Hayden, CEO
Public Member
Jim Dearing, DO
Hospital Administrator (Population >500K)
Medical Direction Commission Advisory Committee Membership
iii.
Trauma and EMS Performance Improvement Standing Committee Membership
Chris Salvino, MD, MS, FACS
Chair
Havasu Regional Medical Center - Lake Havasu City, AZ
Ralph Zane Kelly, MD
State Designated Level III Trauma Center Program Manager
Tuba City Regional Health Care Corporation - Tuba City, AZ
Bill Ashland, RN
Vice Chair/State Designated Level I Trauma Center Trauma
Program Manager
Flagstaff Medical Center - Flagstaff, AZ
Summer Magoteaux, RN
Pediatric Representative (MD or RN)
Phoenix Children’s Hospital - Phoenix, AZ
Brian Bowling, BS, FP-C
Air Ambulance Premier EMS Agency Quality Improvement
Native Air Ambulance - Tempe, AZ 85282
Jill McAdoo, RN
Ground Ambulance or First Responder Premier EMS Agency –
Quality Improvement Officer (NAEMS/WACEMS), Life Line
Ambulance Service, AZ
Gail Bradley, MD
Medical Direction Commission Liaison
Peoria, Sun City, and Goodyear Fire Departments - EMS
Medical Director
Mary McDonald, RN, BSN
Prehospital EMS Manager – (SAEMS/AEMS), Tucson Fire
Department, Tucson, AZ
Robert Corbell, EMT-P
EMS Registry Group Member
Northwest Fire District
Tucson, AZ
Eric Merrill, EMT-P
Ground Ambulance or First Responder Premier EMS Agency,
Quality Improvement Officer (SAEMS/AEMS)
Rio Verde Fire Department, Rio Verde, AZ
Paul Dabrowski, MD
Trauma Surgeon, Banner Good Samaritan Medical Center,
Phoenix, AZ
Heather Miller
Western Arizona Council of Emergency Services
Kingman Regional Medical Center
Robert Djergaian, MD
Rehabilitation Specialist
Banner Good Samaritan Hospital - Phoenix, AZ
Melissa Moyer, CSTR
Representative of the Trauma Registry Users Group
John C. Lincoln North Mountain Hospital
Phoenix, AZ
Josh Gaither, MD
EMS Researcher (AEMRC)
University Medical Center Base Hospital
Tucson, AZ
Pam Noland, RN
State Designated Level IV Trauma Center Program Manager
Northern Cochise Community Hospital
Willcox, AZ
Garth Gemar, MD
EMS Medical Director of a Premier EMS Agency
Rural/Metro-Southwest Ambulance, Glendale Fire Dept.,
Surprise Fire Dept. and Banner Healthcare - Phoenix, AZ
Jeffrey Schaff, RN, CEN
ACS Verified Level I Trauma Program Manager
Banner University Medical Center - Tucson, AZ
Pamela Goslar, PhD
IPAC Representative
St. Joseph’s Hospital & Medical Center
Phoenix, AZ
Danielle Stello, RN
Prehospital EMS Coordinator - Base Hospital (NAEMS/
WACEMS)
Havasu Regional Medical Center, Lake Havasu City, AZ
Michelle Guadnola, RN
State Designated Level I Trauma Center Trauma Program
St. Joseph’s Hospital & Medical Center - Phoenix, AZ
Tiffiny Strever, RN
State Designated Level I Trauma Center – Trauma Program
Representative - West Valley Hospital – Goodyear, AZ
Rebecca Haro, NREMT-P
EMS Council Liaison
Sun City West Fire District - Phoenix, AZ
Dale Woolridge, MD
Injury Researcher
University of Arizona Department of Emergency Medicine
Tucson, AZ
Darlene Herlinger, RN, MSN
Prehospital EMS Coordinator (SAEMS/AEMS)
University of Arizona South Campus
Tucson, AZ

1
Introduction
On behalf of the Data and Quality Assurance team, we are pleased to present the 2015 EMS Annual
Report. Much like the State Trauma Advisory Board Annual Report,1 this document should serve as a record
of system-level EMS activity for the 2014 reporting year. In order to document changes over time, this report
will maintain a consistent focus with additional content being added through time.
EMS is undergoing many changes. The Patient Protection and Affordable Care Act contains several
sections that apply directly or indirectly to the provision of EMS. Most of these sections focus on the
importance of EMS data collection, data analysis and the use of data in driving performance improvement
initiatives. Additionally, the EMS Compass (www.emscompass.org), a nationwide initiative funded through
the National Highway Traffic Safety Association (NHTSA) Office of EMS, has developed performance
measures and will continue to develop more.
This past year the Bureau of EMS and Trauma System successfully provided EMS agencies with
access to outcome data after linking the Arizona State Trauma Registry, the Hospital Discharge Database, and
the Cardiac Event Data and Reporting system (CEDaR). EMS has long considered accessing outcome data as
the gold standard for targeted and timely performance improvement initiatives. This is an expansion similar to
the long-standing success found in the Save Hearts in Arizona Registry & Education2 and the Excellence in
Prehospital Injury Care (EPIC).3
Arizona is fortunate to have medical directors, performance improvement officers, and chief executives
that value the importance of data collection, data analysis, and the continuous quality improvement processes.
In fact, Arizona’s EMS providers have helped shape the provision of out-of- hospital and in-hospital cardiac
arrest care around the world. More recently, the work of some of Arizona’s 9-1-1 dispatch centers has shown
dramatic results for bystander CPR. The Journal of the American Medical Association published a report on
Arizona’s success this month.4 Lastly, your work in adopting and reporting data on the traumatic brain injury
care in EPIC is also promising dramatic improvements in patient outcomes.
2
With the assistance of the Trauma and EMS Performance Improvement standing committee,5 several
EMS performance improvement resources and activities are now in place including the EMS Performance Im-
provement Manual,6 the EMS Registry Users Group, and numerous EMS registry training opportunities each
year.
As you review this report, we hope that you will share any ideas that you have for our next report. We
extend our sincerest thanks and gratitude to the 18,000 EMCTs in Arizona who respond to the requests for
EMS at all times. Your work makes a positive difference in the lives of all Arizonans.
In the future, we expect to see Community Integrated Paramedicine, which includes Treat and Refer
initiatives, as new models for the use of EMS personnel in our healthcare system. Being able to collect, ana-
lyze and use these data to improve care is vital to ensuring that these systems deliver the promised benefits.
The flow of data from Health Information Exchanges (HIE),7 with Arizona’s very own Health-e Connection,
will help shape the way organizations obtain outcome data and medical history data in the future.
Sincerely,
Terry Mullins Bentley Bobrow
Bureau Chief Medical Director
1http://azdhs.gov/documents/preparedness/emergency-medical-services-trauma-system/reports/2015-stab-annual-report.pdf 2http://azdhs.gov/preparedness/emergency-medical-services-trauma-system/save-hearts-az-registry-education/index.php 3http://www.epic.arizona.edu/ 4Bobrow BJ, Spaite DW, Vadeboncoeur TF, et al. Implementation of a Regional Telephone Cardiopulmonary Resuscitation Program and Outcomes
After Out-of-Hospital Cardiac Arrest. JAMA Cardiol. Published online May 04, 2016. doi:10.1001/jamacardio.2016.0251. 5http://azdhs.gov/documents/preparedness/emergency-medical-services-trauma-system/advisory/STAB/TEPImembership.pdf
6http://www.azdhs.gov/documents/preparedness/emergency-medical-services-trauma-system/data/users/ems-performance-improvement-plan.pdf 7http://www.azhec.org/
3
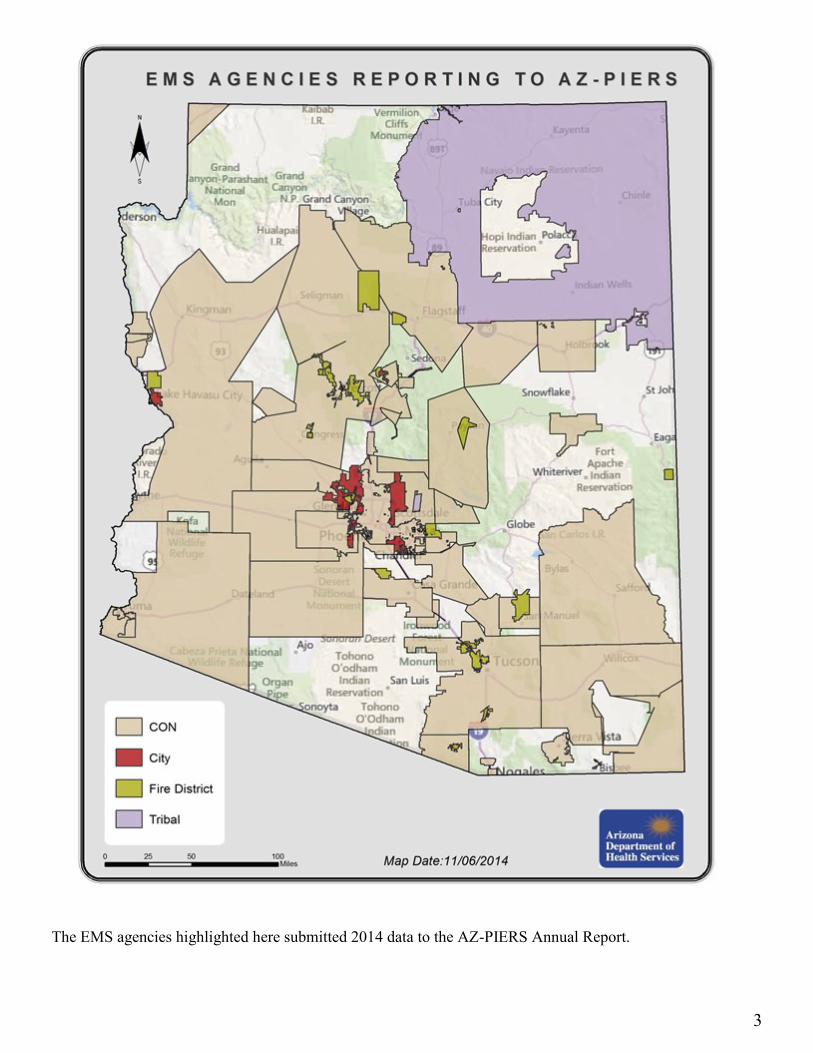
The EMS agencies highlighted here submitted 2014 data to the AZ-PIERS Annual Report.
4
Action Medical Svc. - Ganado
Action Medical Svc. - Winslow
Aerocare Med. Transport-AeroMed
Air Evac Svcs.
Alpine Fire Dist.
American Ambulance
American Comtrans
Arivaca Fire Dist.
Arizona State University Student EMS
Arrowhead Mobile Healthcare
Avondale Fire & Medical Department
Beaver Dam-Littlefield Fire District
Black Canyon Fire Dept.
Buckeye Valley Rural Vol. Fire Dist.
Bullhead City Fire Dept. Ambulance Svc.
Camp Verde Fire District
Central Yavapai Fire Dist.
Chandler Fire Dept.
Clarkdale Fire Dist.
Classic Lifeguard Aeromedical Svc.
Congress Fire Dist.
Cottonwood Fire Dept.
Eloy Fire District Ambulance Svc.
Fort McDowell Yavapai Nation Fire Department
Fort Mojave Mesa Fire District
Golder Ranch Fire District
Green Valley Fire Dist.
Guardian Air (Flagstaff)
Guardian Medical Transport
Healthcare Innovations
High Country Fire Rescue
Holbrook EMS
Kord's Southwest
Lake Havasu City Fire Department
Life Line Ambulance Svc.
LifeNet (Arizona)
LifeStar EMS
Maricopa County Sheriff's Office (MCSO)
Maricopa Fire Dept.
Mayer Fire & Rescue
Mohave Valley Fire Dept. Ambulance Svc.
Montezuma-Rimrock Fire District
Native American Air Ambul. - OMNI Flight
Navajo Nation EMS - Fort Defiance
Navajo Nation EMS - Red Mesa
North County Fire & Medical District
Northwest Fire Rescue Dist.
PMT- Professional Medical Transport
Peoria Fire Dept.
Pine/Strawberry Fire Dept.
Queen Creek Fire Dept.
REVA
Rio Rico Fire District
Rio Verde Fire Dist.
River Medical Inc.
Rural Metro Corp. (Pinal) - TRI-CITY MED
Rural/Metro Corp. (Pima)
Rural/Metro Corp. (Yuma)
Rural/Metro Corp. - AMT (Maricopa)
Sacred Mountain Medical Svc.
San Juan Regional Air Care (New Mexico)
Scottsdale Fire Dept.
Southwest Ambulance & Rescue of AZ
Southwest Ambulance (Maricopa)
Southwest Ambulance of Casa Grande
Southwest Ambulance of Safford
Sun Lakes Fire District
Superstition Fire and Medical District
Surprise Fire Dept.
Tonopah Valley Fire Dist.
Tri-Valley Ambulance Svc.
Tubac Fire District Ambulance Svc.
Twin Arrows EMS
Verde Valley Ambulance Co.
Verde Valley Fire District
Williamson Valley Fire Dist.
Yarnell Fire Dist.
Yuma Fire Department
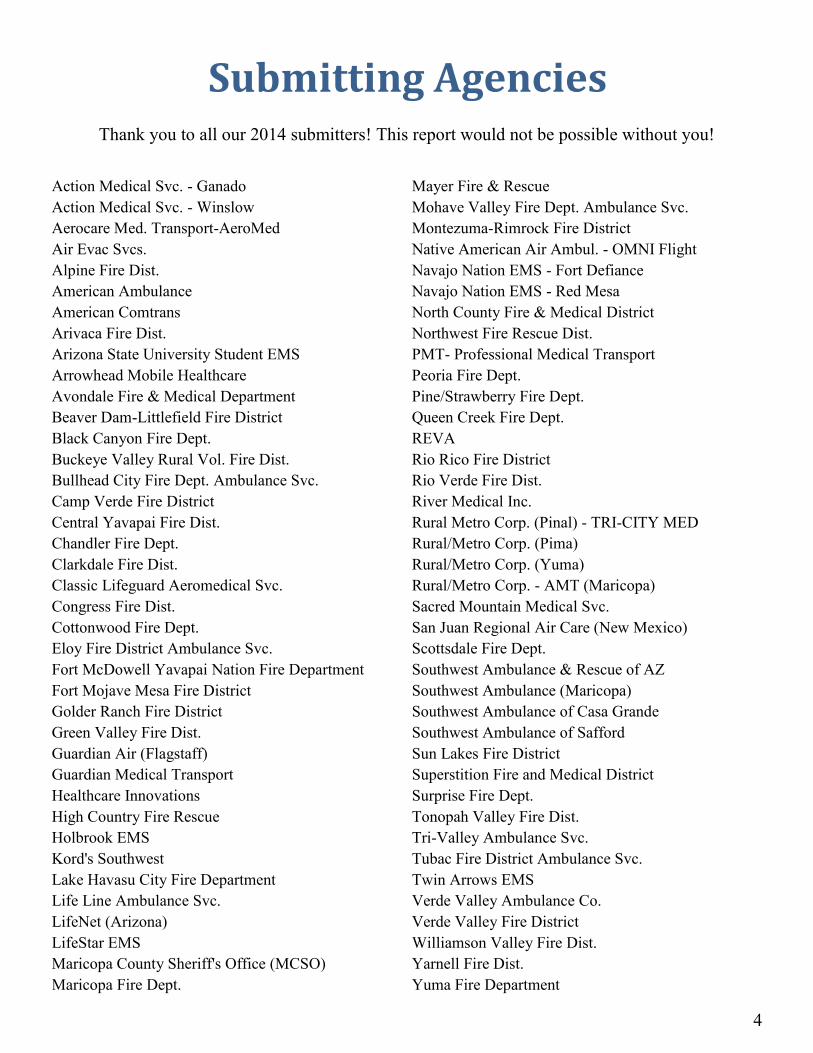
Submitting Agencies Thank you to all our 2014 submitters! This report would not be possible without you!

5
This Page Intentionally Left Blank
6
Arizona Department of Health Services
Bureau of Emergency Medical Services and Trauma System
Prepared by:
Vatsal Chikani, MPH, BHMS, Bureau Statistician
Robyn Blust, MPH, Bureau Epidemiologist
Anne Vossbrink, MS, EMS Registry Manager
Paula Brazil, MA, SHARE Program Coordinator
Rogelio Martinez, MPH, Data & Quality Assurance Section Chief
Terry Mullins, MBA, EMS & Trauma System Bureau Chief
Bentley Bobrow, MD, EMS & Trauma System Medical Director
2014 Data
Emergency Medical Services
Annual Report
7
Total EMS Runs ........................................................................................................................................ 9
Graph 1: Age distribution of EMS runs and Arizona population .......................................... 9
Table 1: EMS run volume by age ............................................................................................... 9
Graph 2/Table 2: EMS run rate per 100,000 Arizona residents by age ............................... 10
Graph 3/Table 3: EMS run rate per 100,000 Arizona residents by county ......................... 11
Graph 4: EMS run volume by race .......................................................................................... 12
Table 4: EMS run volume by gender, race and ethnicity ...................................................... 12
Graph 5/Table 5: Incident Disposition of total EMS runs ..................................................... 13
Graph 6/ Table 6a: Provider primary impression (Top 10) .................................................. 14
Table 6b/Table 6c: Provider primary impression (Next 11-20) and (Next 21-30) .............. 15
Treated & Transferred/Transported Population ................................................................................ 16
Graph 7/Table 7: Provider primary impression (Top 10) of transported EMS patients .... 16
Table 8: Hospital principal diagnosis (Top 10) of transported EMS patients ..................... 17
Graph 8/Table 9: Payer source for transported EMS patients ............................................. 18
Graph 9/Table 10: Hospital discharge status of transported EMS patients ........................ 19
Pediatric Population ............................................................................................................................... 20
Graph 10: Age-specific pediatric EMS run rate per 100,000 Arizona residents ................. 20
Table 11: Pediatric EMS run volume by age .......................................................................... 20
Graph 11/Table 12: Provider primary impression (Top 10) for pediatric EMS runs ........ 21
Graph 12/Table 13: Incident disposition for pediatric EMS runs ........................................ 22
Table 14: Hospital principal diagnosis (Top 10) for pediatric EMS runs ............................ 23
Graph 13/Table 15: Hospital discharge status for pediatric EMS runs ............................... 24
Geriatric Population ............................................................................................................................... 25
Graph 14/Table 16: Age-specific geriatric EMS run rate per 100,000 Arizona residents .. 25
Graph 15/Table 17: Provider primary impression (Top 10) for geriatric EMS runs ......... 26
Graph 16/Table 18: Incident disposition for geriatric EMS runs ......................................... 27
Table 19: Hospital principal diagnosis (Top 10) for geriatric EMS runs ............................. 28
Graph 17/Table 20: Hospital discharge status for geriatric EMS runs ................................ 29
Mortality .................................................................................................................................................. 30
Graph 18/Table 21: On scene and in-hospital mortality by age and gender ....................... 30
Table 22a: Provider primary impression (Top 10) for on scene mortality .......................... 31
Table 22b: Provider primary impression (Top 10) for in-hospital mortality ...................... 31
Table 23: Hospital principal diagnosis (Top 10) for in-hospital mortality ........................... 31
List of Tables & Figures
8
Purpose:
The purpose of this report is to systematically describe EMS calls occurring in Arizona. We have synthesized
data from the Arizona Prehospital Information & EMS Registry System (AZ-PIERS) and the Hospital
Discharge Database (HDD) to provide stakeholders with key information on Arizona’s EMS patients.
Methodology:
The AZ-PIERS is a free electronic Patient Care Records (ePCRs) registry that allows EMS agencies to collect
and transmit to the State. The primary purpose of the AZ-PIERS is to optimize prehospital care through a data
driven, quality assurance approach. In 2014, about 65 EMS agencies were submitting data to the AZ-PIERS;
these agencies cover approximately 63% of Arizona’s area and 97% of Arizona’s population. The database
includes both required and optional reporting elements and data are validated to meet National EMS
Information System (NEMSIS) standards. The AZ-PIERS captures agency information, patient demographics,
response times, incident location, and prehospital treatment.
A total of 484,265 EMS runs were submitted to AZ-PIERS from January 1, 2014, to December 31, 2014. We
used the 2014 population denominators, from the Arizona Health Status and Vital Statistics database, to
calculate EMS run rates per 100,000 Arizona residents. These data were analyzed using SAS software, version
9.4 (SAS Institute, Cary, NC).
In order to obtain the final hospital outcome for EMS runs with an incident disposition of Treated &
Transferred or Treated & Transported (n = 394,007), a deterministic linkage between AZ-PIERS and the
Hospital Discharge Database (HDD) was performed. Of the 394,007 treated/transported EMS runs, 290,902
(74%) qualified for linkage. Runs not qualifying for linkage consisted of patients who were transported to
facilities not reporting to the HDD, facilities outside of Arizona, or had missing data on all linkage variables.
Following linkage, 252,580 (87%) EMS runs were successfully matched to their respective records in the
HDD.
If a single patient is treated by more than one EMS agency, AZ-PIERS will collect that patients information
from all the corresponding agencies, leading to multiple records for the same patient. In order to report the
information from the HDD at the patient level, duplicate runs were removed. After removing the duplicates, a
total of 209,066 linked patient level records were available from the HDD. This patient level information was
used when reporting information from the HDD.
Purpose and Methods
9
EMS Annual Report | 2015
EMS Run Volume by age
Total EMS Runs
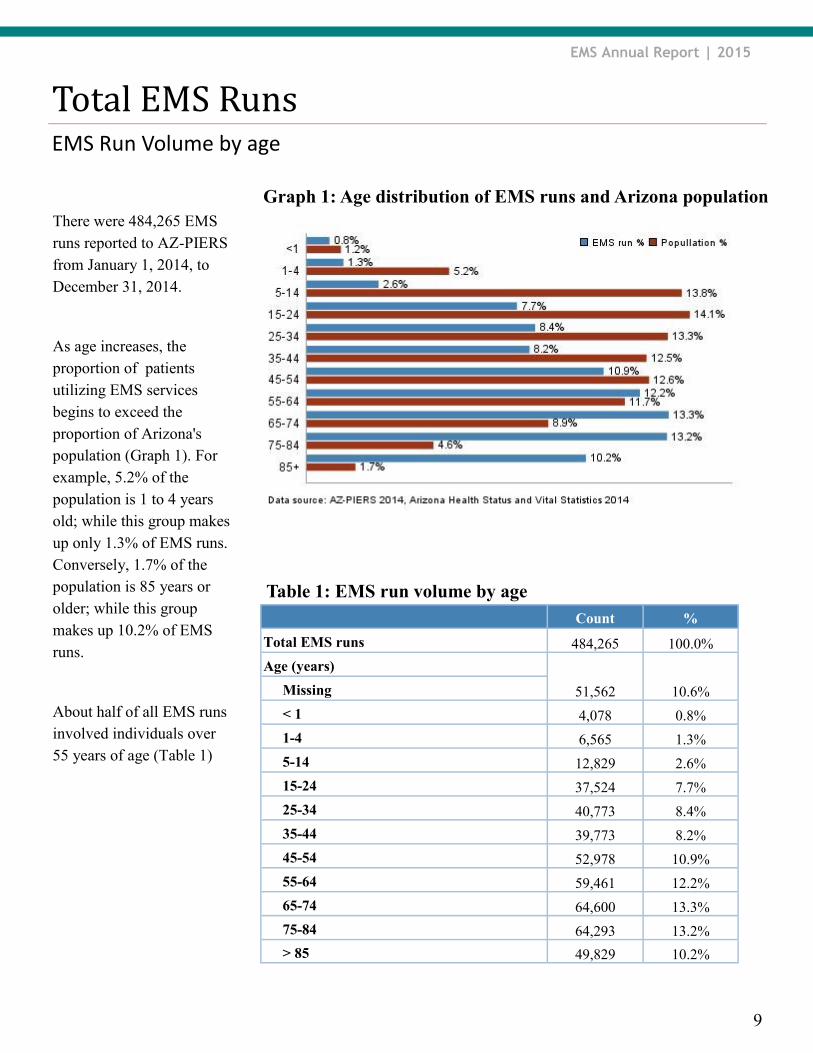
There were 484,265 EMS
runs reported to AZ-PIERS
from January 1, 2014, to
December 31, 2014.
As age increases, the
proportion of patients
utilizing EMS services
begins to exceed the
proportion of Arizona's
population (Graph 1). For
example, 5.2% of the
population is 1 to 4 years
old; while this group makes
up only 1.3% of EMS runs.
Conversely, 1.7% of the
population is 85 years or
older; while this group
makes up 10.2% of EMS
runs.
About half of all EMS runs
involved individuals over
55 years of age (Table 1)
Table 1: EMS run volume by age
Count %
Total EMS runs 484,265 100.0%
Age (years)
51,562 10.6% Missing
< 1 4,078 0.8%
1-4 6,565 1.3%
5-14 12,829 2.6%
15-24 37,524 7.7%
25-34 40,773 8.4%
35-44 39,773 8.2%
45-54 52,978 10.9%
55-64 59,461 12.2%
65-74 64,600 13.3%
75-84 64,293 13.2%
> 85 49,829 10.2%
Graph 1: Age distribution of EMS runs and Arizona population
10
EMS Annual Report | 2015
EMS run rate by age
Total EMS Runs
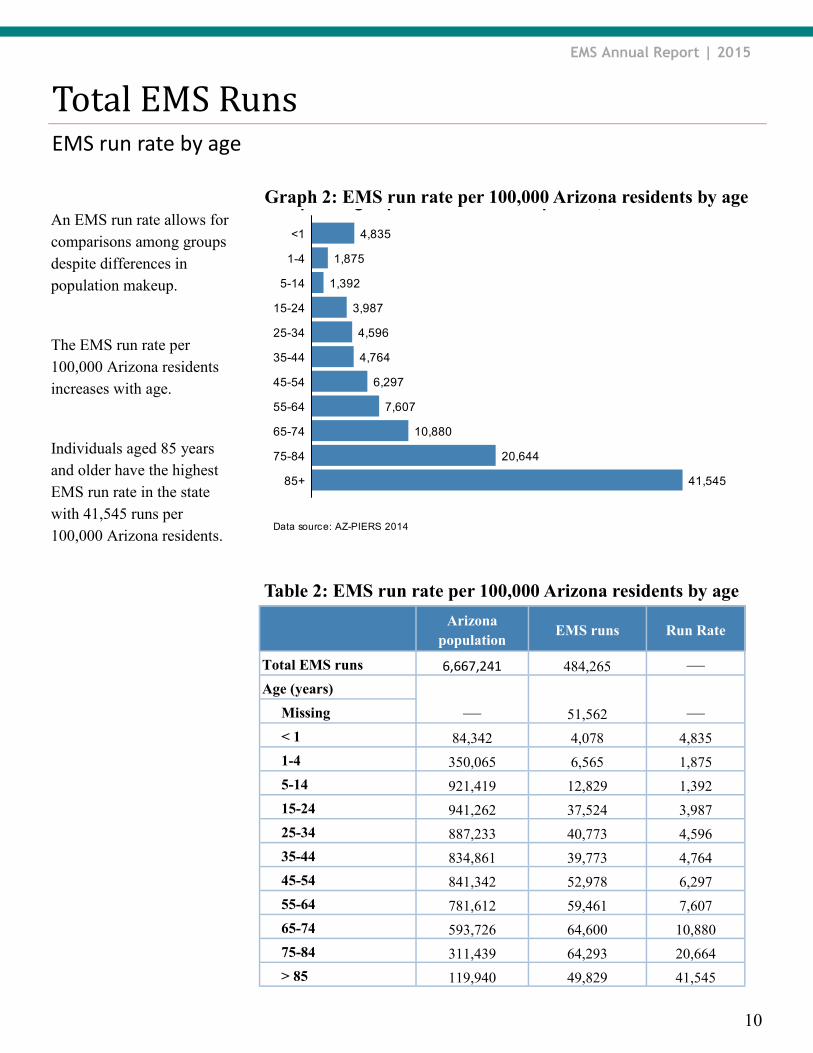
An EMS run rate allows for
comparisons among groups
despite differences in
population makeup.
The EMS run rate per
100,000 Arizona residents
increases with age.
Individuals aged 85 years
and older have the highest
EMS run rate in the state
with 41,545 runs per
100,000 Arizona residents.
Table 2: EMS run rate per 100,000 Arizona residents by age
EMS runs Run Rate Arizona
population
Total EMS runs 484,265 — 6,667,241
Age (years)
51,562 — — Missing
< 1 4,078 4,835 84,342
1-4 6,565 1,875 350,065
5-14 12,829 1,392 921,419
15-24 37,524 3,987 941,262
25-34 40,773 4,596 887,233
35-44 39,773 4,764 834,861
45-54 52,978 6,297 841,342
55-64 59,461 7,607 781,612
65-74 64,600 10,880 593,726
75-84 64,293 20,664 311,439
> 85 49,829 41,545 119,940
Data source: AZ-PIERS 2014
Graph 1: Age-specific EMS run rate per 100,000
4,835
1,875
1,392
3,987
4,596
4,764
6,297
7,607
10,880
20,644
41,54585+
75-84
65-74
55-64
45-54
35-44
25-34
15-24
5-14
1-4
<1
Graph 2: EMS run rate per 100,000 Arizona residents by age
11
EMS Annual Report | 2015
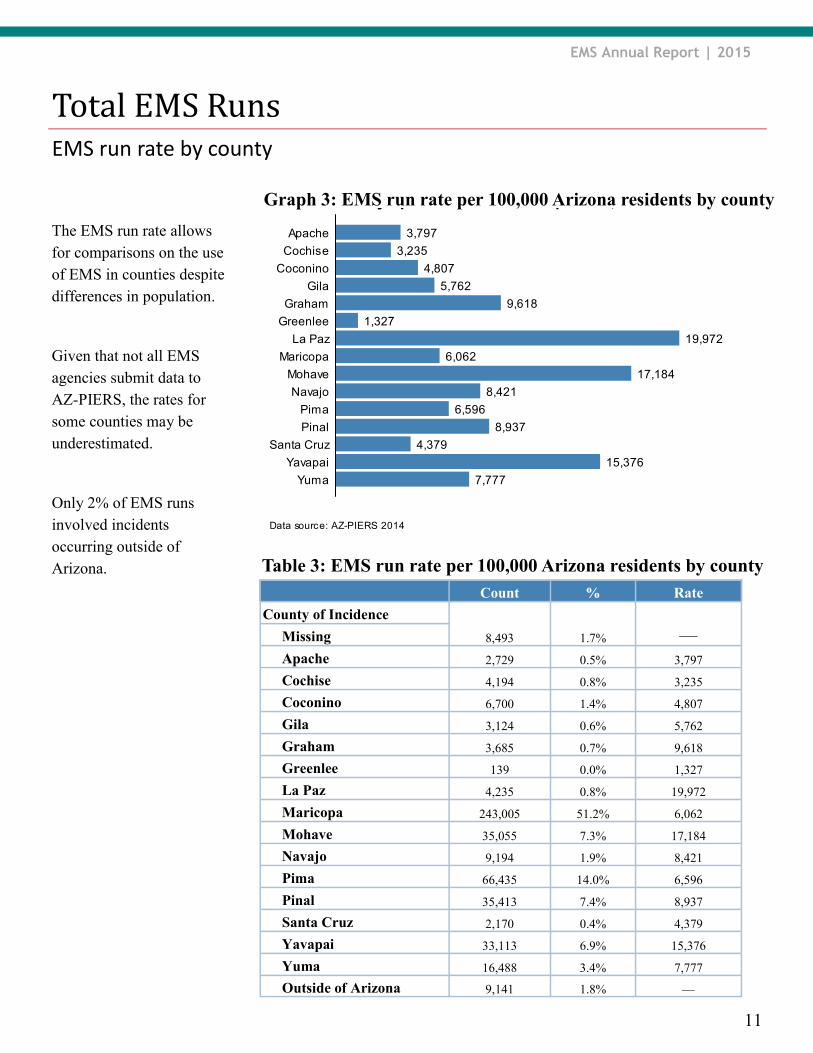
The EMS run rate allows
for comparisons on the use
of EMS in counties despite
differences in population.
Given that not all EMS
agencies submit data to
AZ-PIERS, the rates for
some counties may be
underestimated.
Only 2% of EMS runs
involved incidents
occurring outside of
Arizona.
EMS run rate by county
Total EMS Runs
Table 3: EMS run rate per 100,000 Arizona residents by county
Count % Rate
County of Incidence
8,493 1.7% — Missing
Apache 2,729 0.5% 3,797
Cochise 4,194 0.8% 3,235
Coconino 6,700 1.4% 4,807
Gila 3,124 0.6% 5,762
Graham 3,685 0.7% 9,618
Greenlee 139 0.0% 1,327
La Paz 4,235 0.8% 19,972
Maricopa 243,005 51.2% 6,062
Mohave 35,055 7.3% 17,184
Navajo 9,194 1.9% 8,421
Pima 66,435 14.0% 6,596
Pinal 35,413 7.4% 8,937
Santa Cruz 2,170 0.4% 4,379
Yavapai 33,113 6.9% 15,376
Yuma 16,488 3.4% 7,777
Outside of Arizona 9,141 1.8% —
Data source: AZ-PIERS 2014
Graph : County-specific EMS run rate per 100,000
3,797
3,235
4,807
5,762
9,618
1,327
19,972
6,062
17,184
8,421
6,596
8,937
4,379
15,376
7,777Yuma
Yavapai
Santa Cruz
Pinal
Pima
Navajo
Mohave
Maricopa
La Paz
Greenlee
Graham
Gila
Coconino
Cochise
Apache
Graph 3: EMS run rate per 100,000 Arizona residents by county
12
EMS Annual Report | 2015
Race, Ethnicity and Gender
Total EMS Runs
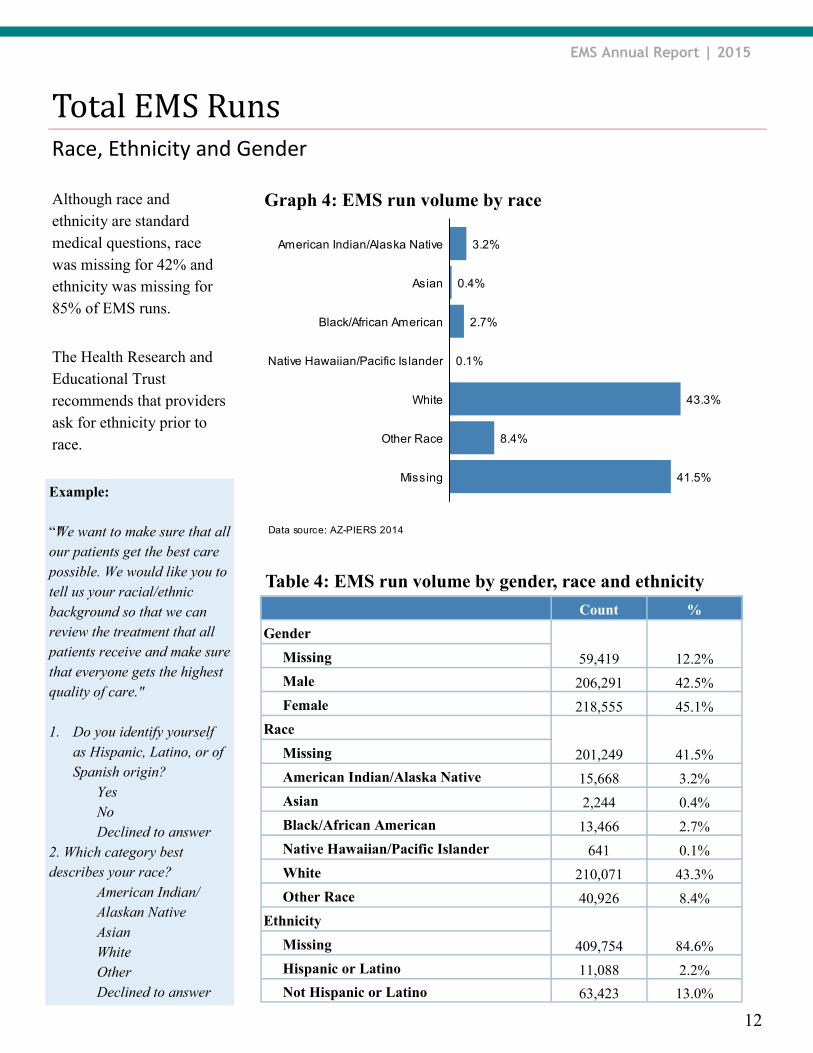
Although race and
ethnicity are standard
medical questions, race
was missing for 42% and
ethnicity was missing for
85% of EMS runs.
The Health Research and
Educational Trust
recommends that providers
ask for ethnicity prior to
race.
Table 4: EMS run volume by gender, race and ethnicity
Data source: AZ-PIERS 2014
Graph 2: EMS run volume by race
0.1%
0.4%
2.7%
3.2%
8.4%
41.5%
43.3%
Missing
Other Race
White
Native Hawaiian/Pacific Islander
Black/African American
Asian
American Indian/Alaska Native
Graph 4: EMS run volume by race
Count %
Gender
59,419 12.2% Missing
Male 206,291 42.5%
Female 218,555 45.1%
Race
201,249 41.5% Missing
American Indian/Alaska Native 15,668 3.2%
Asian 2,244 0.4%
Black/African American 13,466 2.7%
Native Hawaiian/Pacific Islander 641 0.1%
White 210,071 43.3%
Other Race 40,926 8.4%
Ethnicity
409,754 84.6% Missing
Hispanic or Latino 11,088 2.2%
Not Hispanic or Latino 63,423 13.0%
Example:
“"We want to make sure that all
our patients get the best care
possible. We would like you to
tell us your racial/ethnic
background so that we can
review the treatment that all
patients receive and make sure
that everyone gets the highest
quality of care."
1. Do you identify yourself
as Hispanic, Latino, or of
Spanish origin?
Yes
No
Declined to answer
2. Which category best
describes your race?
American Indian/
Alaskan Native
Asian
White
Other
Declined to answer
13
EMS Annual Report | 2015
Incident Disposition
Total EMS Runs
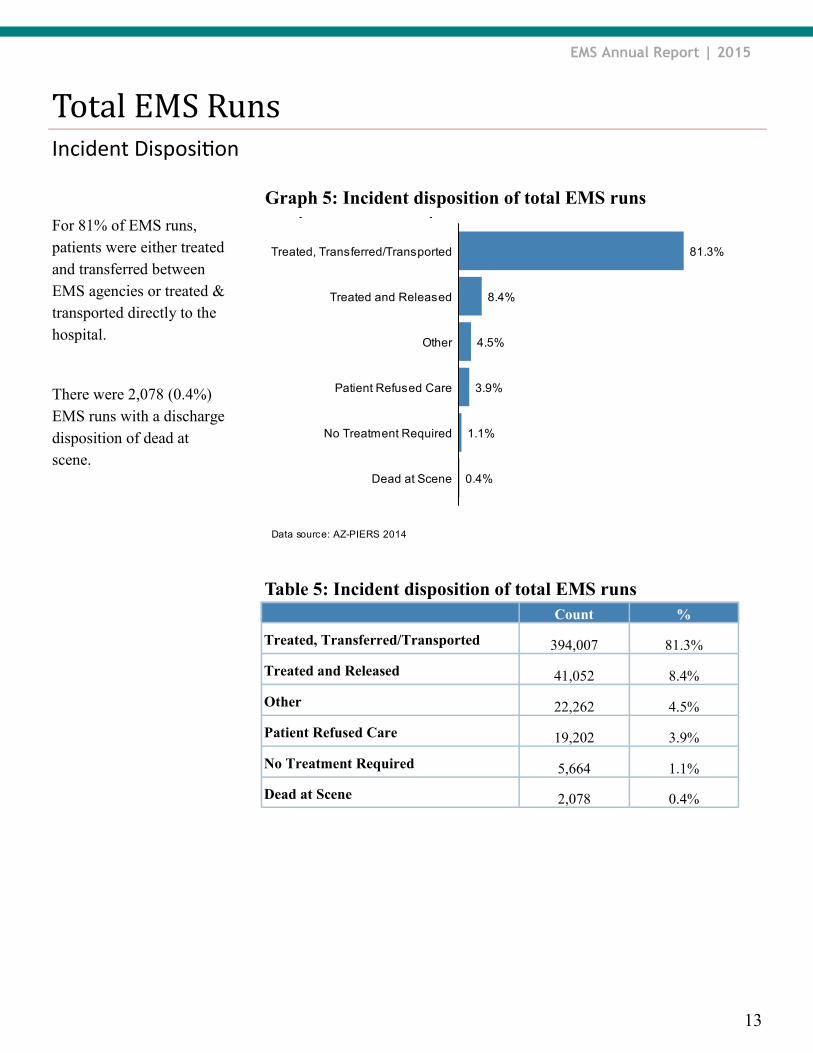
For 81% of EMS runs,
patients were either treated
and transferred between
EMS agencies or treated &
transported directly to the
hospital.
There were 2,078 (0.4%)
EMS runs with a discharge
disposition of dead at
scene.
Table 5: Incident disposition of total EMS runs
Data source: AZ-PIERS 2014
Graph 3: Incident disposition of total EMS runs
0.4%
1.1%
3.9%
4.5%
8.4%
81.3%
Dead at Scene
No Treatment Required
Patient Refused Care
Other
Treated and Released
Treated, Transferred/Transported
Graph 5: Incident disposition of total EMS runs
Count %
Treated, Transferred/Transported 394,007 81.3%
Treated and Released 41,052 8.4%
Other 22,262 4.5%
Patient Refused Care 19,202 3.9%
No Treatment Required 5,664 1.1%
Dead at Scene 2,078 0.4%

14
EMS Annual Report | 2015
Provider Primary Impression
Total EMS Runs
The EMS Provider Primary
Impression was missing for
37.3% of EMS runs. When
recorded, traumatic injury,
pain, and behavioral/
psychiatric disorder were
the top three primary
impressions.
Tables 6a to 6c show the
top 30 provider primary
impressions.
Table 6a: Provider primary impression (Top 10)
Count %
Traumatic injury 29,168 10.0%
Pain 28,322 9.7%
Behavioral/psychiatric disorder 22,576 7.7%
Abdominal pain/problems 20,219 6.9%
Altered level of consciousness 19,363 6.6%
Chest pain/discomfort 18,314 6.3%
Respiratory distress 13,249 4.5%
No Apparent Illness/Injury 12,510 4.3%
Other 12,068 4.1%
Weakness 10,475 3.6%
Data source: AZ-PIERS 2014
Graph 4: Provider primary impression (Top 10)
3.6%
4.1%
4.3%
4.5%
6.3%
6.6%
6.9%
7.7%
9.7%
10.0%
Weakness
Other
No Apparent Illness/Injury
Respiratory distress
Chest pain/discomfort
Altered level of consciousness
Abdominal pain/problems
Behavioral/psychiatric disorder
Pain
Traumatic injury
Graph 6: Provider Primary Impression (Top 10)
15
EMS Annual Report | 2015
Provider Primary Impression
Total EMS Runs
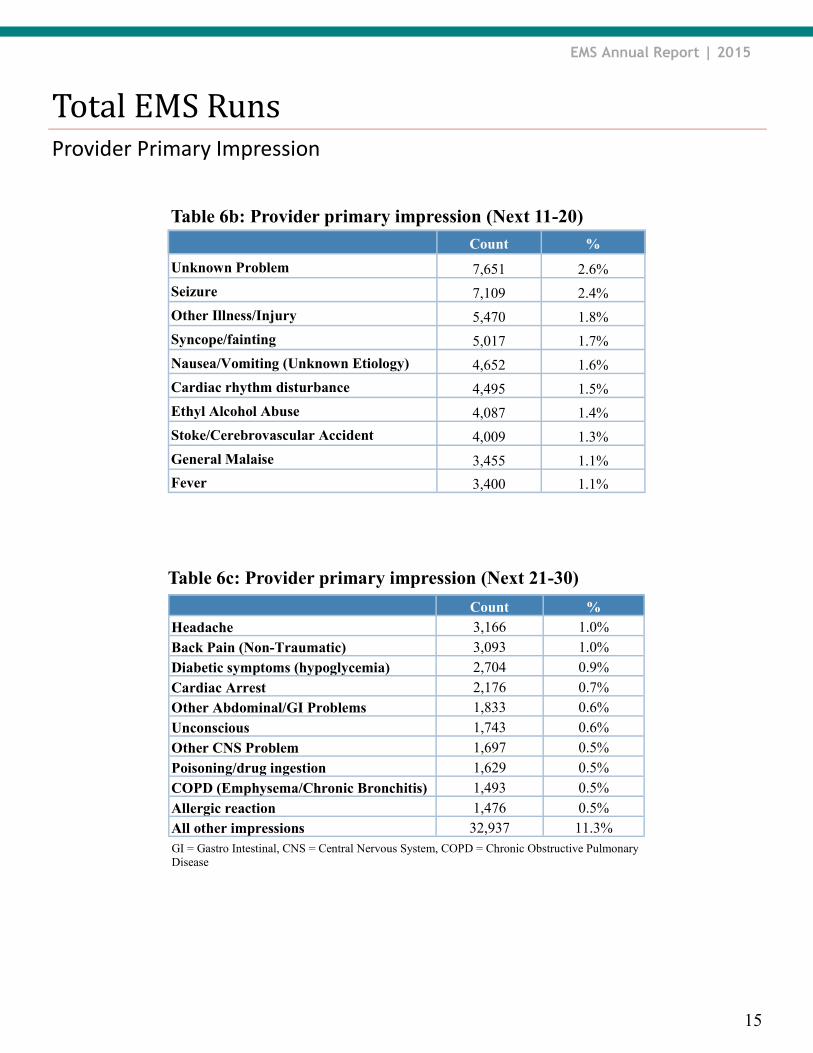
Table 6b: Provider primary impression (Next 11-20)
Count %
Unknown Problem 7,651 2.6%
Seizure 7,109 2.4%
Other Illness/Injury 5,470 1.8%
Syncope/fainting 5,017 1.7%
Nausea/Vomiting (Unknown Etiology) 4,652 1.6%
Cardiac rhythm disturbance 4,495 1.5%
Ethyl Alcohol Abuse 4,087 1.4%
Stoke/Cerebrovascular Accident 4,009 1.3%
General Malaise 3,455 1.1%
Fever 3,400 1.1%
GI = Gastro Intestinal, CNS = Central Nervous System, COPD = Chronic Obstructive Pulmonary
Disease
Table 6c: Provider primary impression (Next 21-30)
Count % Headache 3,166 1.0% Back Pain (Non-Traumatic) 3,093 1.0% Diabetic symptoms (hypoglycemia) 2,704 0.9% Cardiac Arrest 2,176 0.7% Other Abdominal/GI Problems 1,833 0.6% Unconscious 1,743 0.6% Other CNS Problem 1,697 0.5% Poisoning/drug ingestion 1,629 0.5% COPD (Emphysema/Chronic Bronchitis) 1,493 0.5% Allergic reaction 1,476 0.5% All other impressions 32,937 11.3%

EMS Annual Report | 2015
16
Provider Primary Impression
Treated & Transferred / Transported
After linkage (See page 8
for details), 87% of
qualifying EMS runs were
successfully matched to
their respective records in
the HDD, for a total of
252,580 linked records.
The EMS provider primary
impression was missing for
30% of the linked records.
When recorded, the top
three EMS primary
impressions for transported
patients were pain,
traumatic injury, and
altered level of
consciousness.
Table 7: EMS primary impression (Top 10) of EMS runs
transported to the hospital
Count %
Pain 19,685 11.1%
Traumatic injury 18,823 10.6%
Altered level of consciousness 14,172 8.0%
Chest pain/discomfort 13,105 7.4%
Abdominal pain/problems 12,052 6.8%
Behavioral/psychiatric disorder 9,830 5.5%
Respiratory distress 8,179 4.6%
Weakness 7,504 4.2%
Other 6,843 3.8%
Seizure 5,362 3.0%
Data source: AZ-PIERS 2014
Graph 5: EMS primary impression (Top 10) of EMS runstransported to hospital
3.0%
3.8%
4.2%
4.6%
5.5%
6.8%
7.4%
8.0%
10.6%
11.1%
Seizure
Other
Weakness
Respiratory distress
Behavioral/psychiatric disorder
Abdominal pain/problems
Chest pain/discomfort
Altered level of consciousness
Traumatic injury
Pain
Graph 7: EMS primary impression (Top 10) of EMS runs
transported to the hospital

EMS Annual Report | 2015
17
Hospital Primary Diagnosis
Treated & Transferred / Transported
The 252,580 linked EMS
runs represent 209,066
patient level records in the
HDD (see page 8 for
details).
The top three hospital
diagnoses for patients
transported to the hospital
were chest pain, alcohol-
related disorders and
superficial injury.
Table 8: Hospital principal diagnosis (Top 10) of EMS
patients transported to the hospital
Count %
Chest pain 10,276 4.9%
Alcohol-related disorders 8,163 3.9%
Superficial injury 7,096 3.3%
Other injury 6,955 3.3%
Syncope 6,379 3.0%
Epilepsy/Copy Number Variation 6,371 3.0%
Septicemia 6,256 2.9%
Abdominal pain 5,571 2.6%
Dysrhythmia 4,548 2.1%
Sprain 4,492 2.1%
Count %
Admitted as an inpatient 70,410 33.6%
Discharged from ED 138,656 66.3%

EMS Annual Report | 2015
18
Payer Source
Treated & Transferred / Transported
The majority of hospital
charges incurred by
transported EMS patients
were billed to either
Medicare (49%) or
Medicaid (24%).
Note: AHCCCS = Arizona Health Care Cost Containment System, HMO = Health Maintenance
Organization, PPO = Preferred Provider Organization
Table 9: Payer source for EMS patients transported to the
hospital
Payer status Count %
Medicare/Medicare risk 102,527 49.0%
AHCCCS/Medicaid 49,345 23.6%
Commercial/HMO/PPO 35,980 17.2%
Self pay 13,865 6.6%
Other 7,349 3.5%
Data source: AZ-PIERS 2014
Graph 6: Payer source for patients transported to hospital
3.5%
6.6%
17.2%
23.6%
49.0%
Other
Self pay
Commercial/HMO/PPO
AHCCCS/Medicaid
Medicare/Medicare risk
Graph 8: Payer source for EMS patients transported to the
hospital
Total Charges
The total charges for the 209,057 patients that were treated and transported to a hospital were $5,019,777,808,
with a median charge of $9,506.
EMS Annual Report | 2015
19
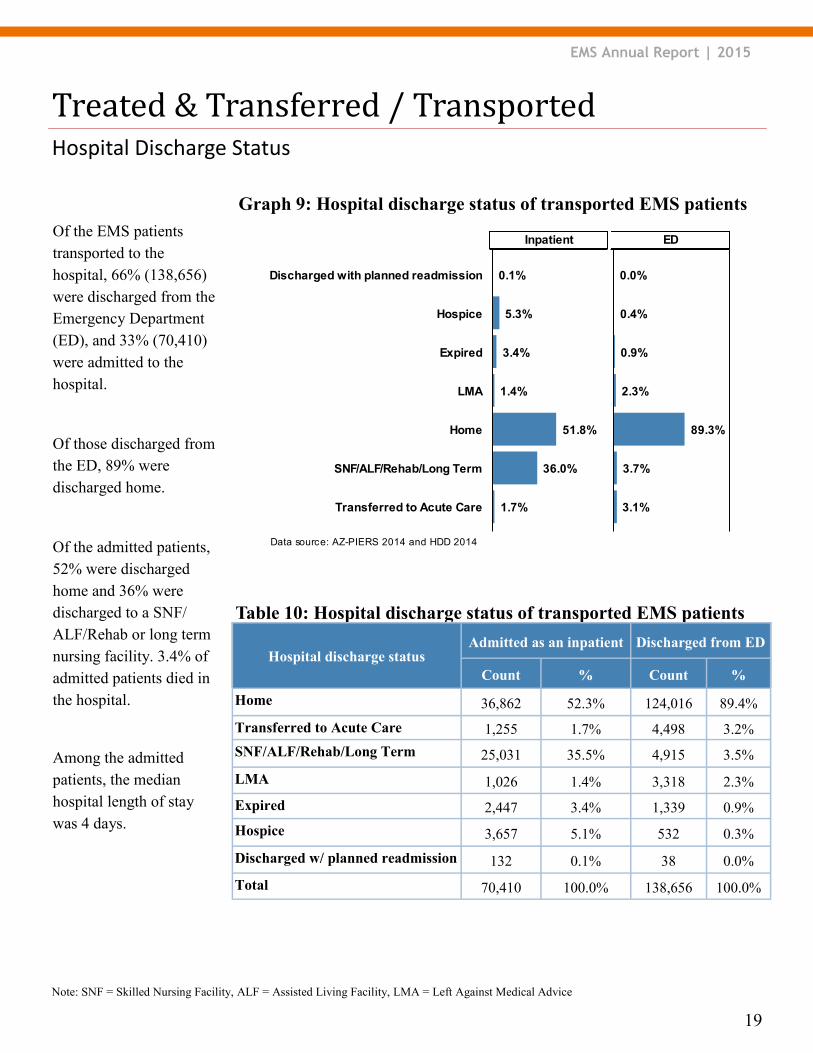
Of the EMS patients
transported to the
hospital, 66% (138,656)
were discharged from the
Emergency Department
(ED), and 33% (70,410)
were admitted to the
hospital.
Of those discharged from
the ED, 89% were
discharged home.
Of the admitted patients,
52% were discharged
home and 36% were
discharged to a SNF/
ALF/Rehab or long term
nursing facility. 3.4% of
admitted patients died in
the hospital.
Among the admitted
patients, the median
hospital length of stay
was 4 days.
Hospital Discharge Status
Treated & Transferred / Transported
Data source: AZ-PIERS 2014 and HDD 2014
Graph 6: Hospital discharge status of transported patients
3.7%
89.3%
2.3%
3.1%
0.4%
0.0%
0.9%
1.7%
1.4%
51.8%
3.4%
5.3%
36.0%
0.1%
Transferred to Acute Care
SNF/ALF/Rehab/Long Term
Home
LMA
Expired
Hospice
Discharged with planned readmission
EDInpatient
Note: SNF = Skilled Nursing Facility, ALF = Assisted Living Facility, LMA = Left Against Medical Advice
Table 10: Hospital discharge status of transported EMS patients
Hospital discharge status Admitted as an inpatient Discharged from ED
Count % Count %
Home 36,862 52.3% 124,016 89.4%
Transferred to Acute Care 1,255 1.7% 4,498 3.2%
SNF/ALF/Rehab/Long Term 25,031 35.5% 4,915 3.5%
LMA 1,026 1.4% 3,318 2.3%
Expired 2,447 3.4% 1,339 0.9%
Hospice 3,657 5.1% 532 0.3%
Discharged w/ planned readmission 132 0.1% 38 0.0%
Total 70,410 100.0% 138,656 100.0%
Graph 9: Hospital discharge status of transported EMS patients
EMS Annual Report | 2015
20
EMS run rate by age
Pediatric Population
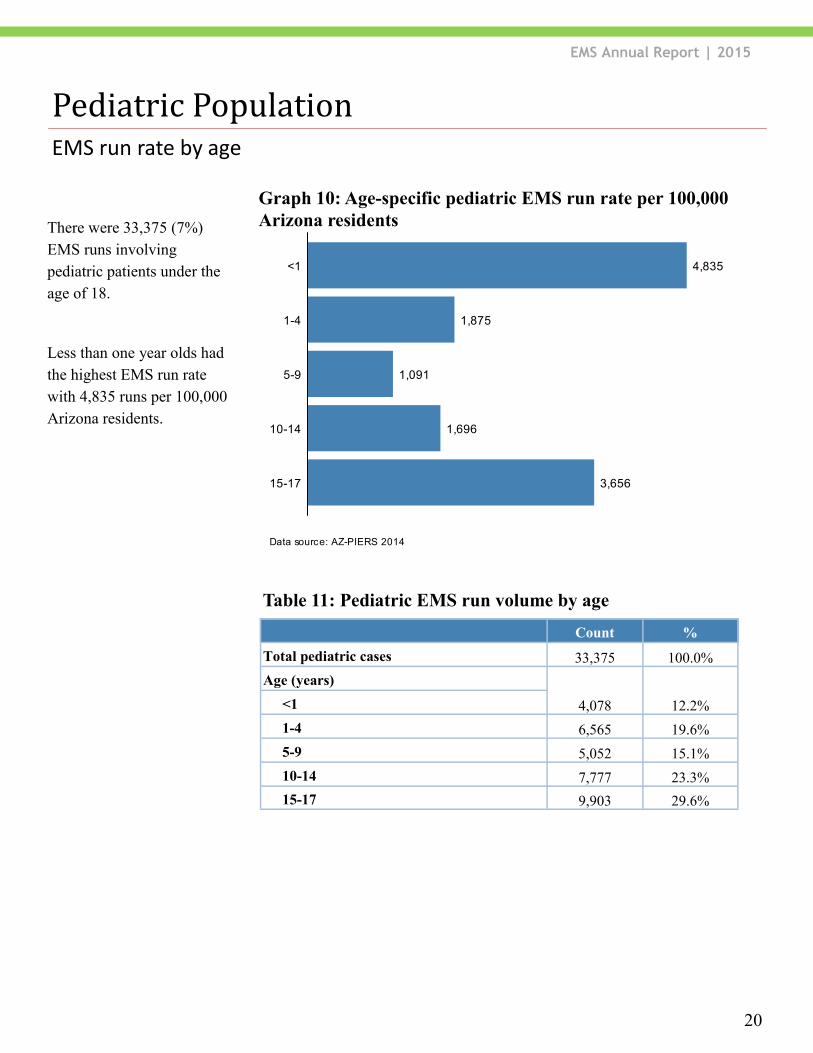
There were 33,375 (7%)
EMS runs involving
pediatric patients under the
age of 18.
Less than one year olds had
the highest EMS run rate
with 4,835 runs per 100,000
Arizona residents.
Data source: AZ-PIERS 2014
Graph 7: Age-specific pediatric EMS run rate per 100,000
4,835
1,875
1,091
1,696
3,65615-17
10-14
5-9
1-4
<1
Table 11: Pediatric EMS run volume by age
Count %
Total pediatric cases 33,375 100.0%
Age (years)
4,078 12.2% <1
1-4 6,565 19.6%
5-9 5,052 15.1%
10-14 7,777 23.3%
15-17 9,903 29.6%
Graph 10: Age-specific pediatric EMS run rate per 100,000
Arizona residents
EMS Annual Report | 2015
21
Provider Primary Impression
Pediatric Population
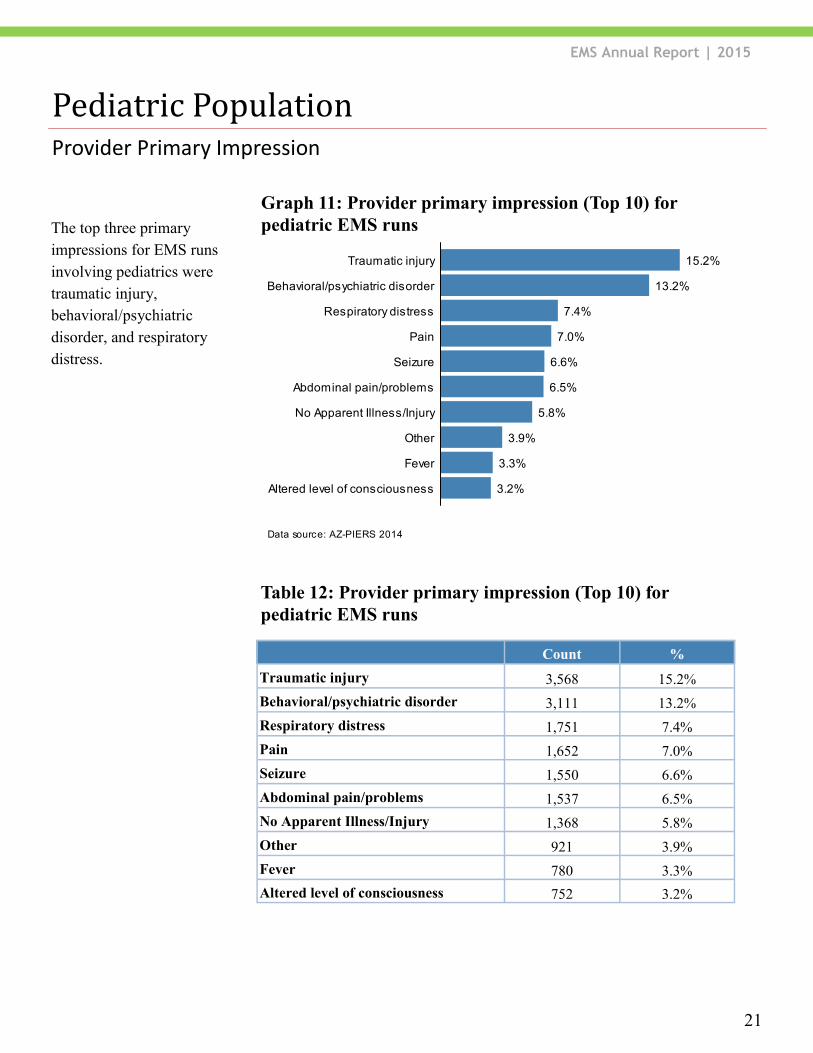
The top three primary
impressions for EMS runs
involving pediatrics were
traumatic injury,
behavioral/psychiatric
disorder, and respiratory
distress.
Table 12: Provider primary impression (Top 10) for
pediatric EMS runs
Count %
Traumatic injury 3,568 15.2%
Behavioral/psychiatric disorder 3,111 13.2%
Respiratory distress 1,751 7.4%
Pain 1,652 7.0%
Seizure 1,550 6.6%
Abdominal pain/problems 1,537 6.5%
No Apparent Illness/Injury 1,368 5.8%
Other 921 3.9%
Fever 780 3.3%
Altered level of consciousness 752 3.2%
Data source: AZ-PIERS 2014
Graph 9: Provider primary impression of all pediatric EMSruns (Top 10)
3.2%
3.3%
3.9%
5.8%
6.5%
6.6%
7.0%
7.4%
13.2%
15.2%
Altered level of consciousness
Fever
Other
No Apparent Illness/Injury
Abdominal pain/problems
Seizure
Pain
Respiratory distress
Behavioral/psychiatric disorder
Traumatic injury
Graph 11: Provider primary impression (Top 10) for
pediatric EMS runs
EMS Annual Report | 2015
22
Incident Disposition
Pediatric Population
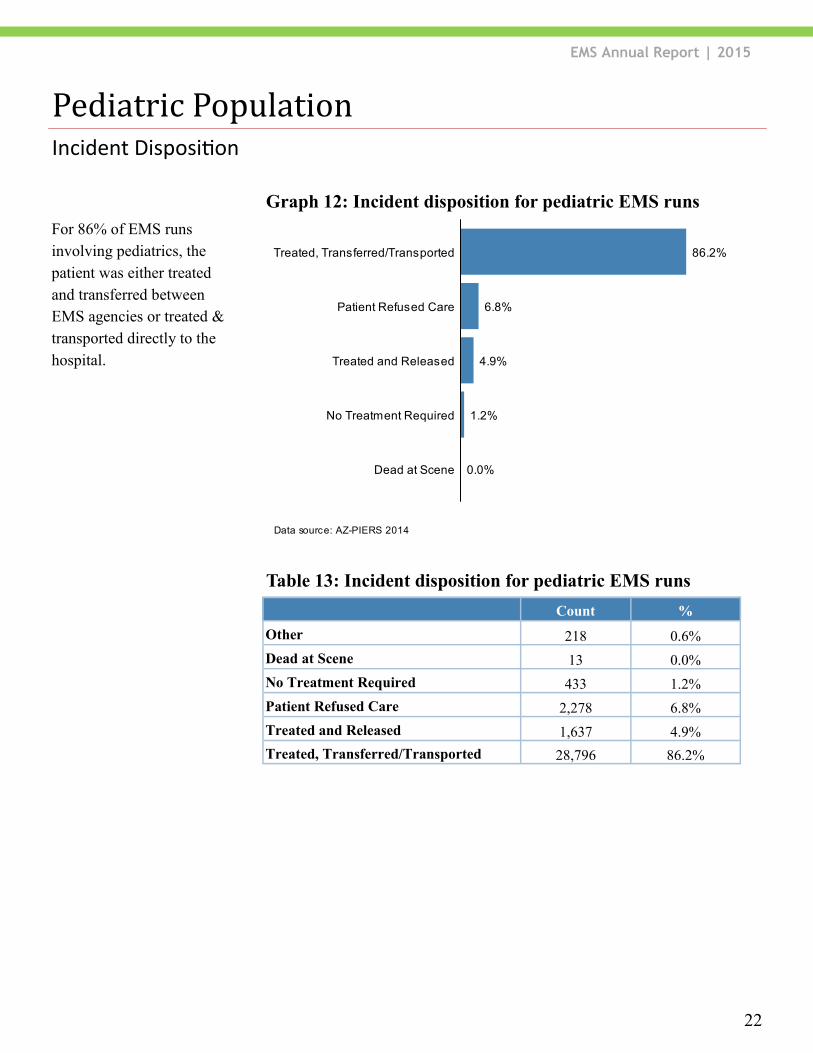
For 86% of EMS runs
involving pediatrics, the
patient was either treated
and transferred between
EMS agencies or treated &
transported directly to the
hospital.
Count %
Other 218 0.6%
Dead at Scene 13 0.0%
No Treatment Required 433 1.2%
Patient Refused Care 2,278 6.8%
Treated and Released 1,637 4.9%
Treated, Transferred/Transported 28,796 86.2%
Table 13: Incident disposition for pediatric EMS runs
Data source: AZ-PIERS 2014
Graph 10: Incident disposition of all pediatric EMS runs
0.0%
1.2%
4.9%
6.8%
86.2%
Dead at Scene
No Treatment Required
Treated and Released
Patient Refused Care
Treated, Transferred/Transported
Graph 12: Incident disposition for pediatric EMS runs
EMS Annual Report | 2015
23
Hospital Diagnosis
Pediatric Population
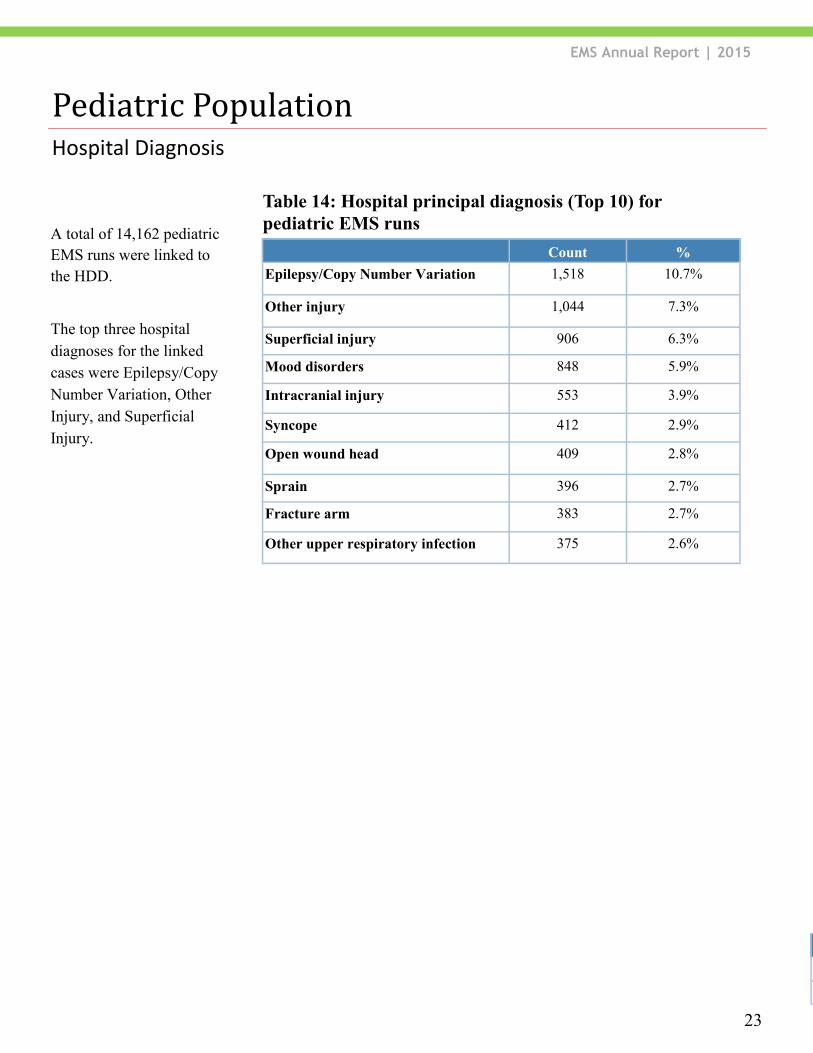
Count %
Epilepsy/Copy Number Variation 1,518 10.7%
Other injury 1,044 7.3%
Superficial injury 906 6.3%
Mood disorders 848 5.9%
Intracranial injury 553 3.9%
Syncope 412 2.9%
Open wound head 409 2.8%
Sprain 396 2.7%
Fracture arm 383 2.7%
Other upper respiratory infection 375 2.6%
Table 14: Hospital principal diagnosis (Top 10) for
pediatric EMS runs A total of 14,162 pediatric
EMS runs were linked to
the HDD.
The top three hospital
diagnoses for the linked
cases were Epilepsy/Copy
Number Variation, Other
Injury, and Superficial
Injury.
Count %
Admitted as an inpatient 2,525 17.8%
Discharged from ED 11,637 82.1%
EMS Annual Report | 2015
24
Hospital Discharge Status
Pediatric Population
Data source: AZ-PIERS 2014 and HDD 2014
Graph 9: Hospital discharge status of pediatric population
89.1%
0.3%
6.2%
2.0%
0.6%
1.3%
0.1%
91.7%
6.5%
0.7%
0.3%
0.4%
0.0%
0.0%
Home
Transferred to Acute Care
LMA
SNF/ALF/Rehab/Long Term
Expired
Discharged with planned readmission
Hospice
InpatientED
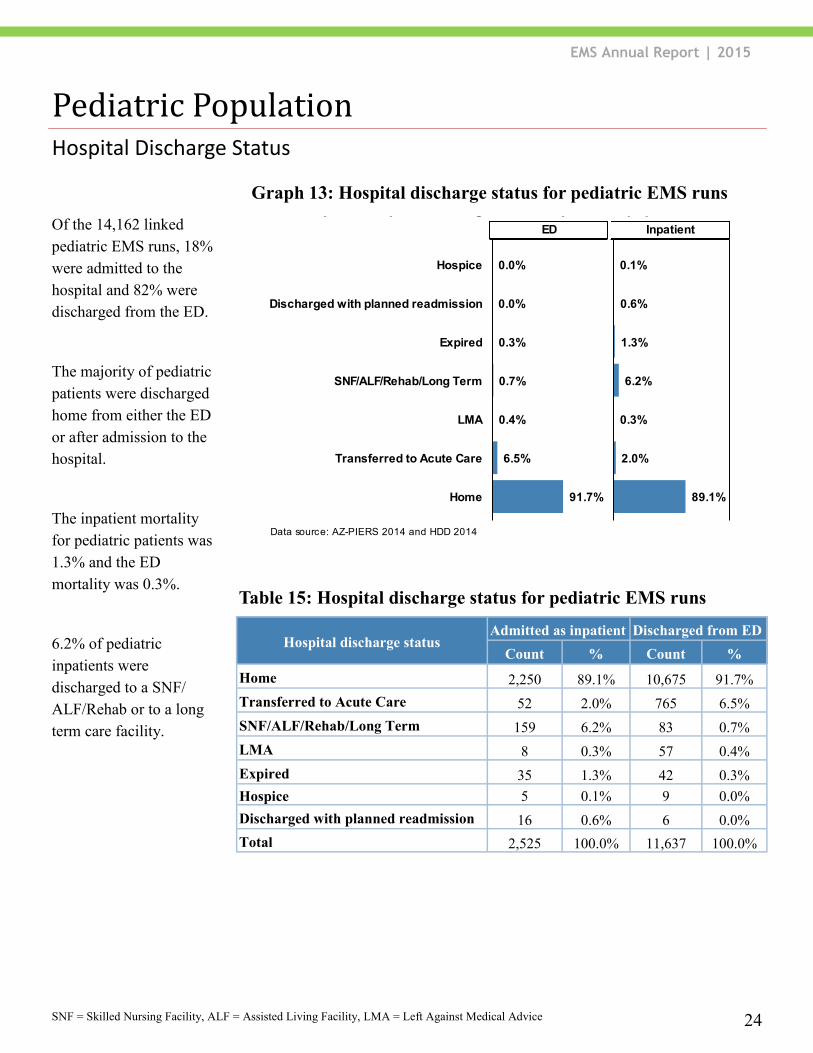
Hospital discharge status Admitted as inpatient Discharged from ED
Count % Count %
Home 2,250 89.1% 10,675 91.7%
Transferred to Acute Care 52 2.0% 765 6.5%
SNF/ALF/Rehab/Long Term 159 6.2% 83 0.7%
LMA 8 0.3% 57 0.4%
Expired 35 1.3% 42 0.3%
Hospice 5 0.1% 9 0.0%
Discharged with planned readmission 16 0.6% 6 0.0%
Total 2,525 100.0% 11,637 100.0%
Table 15: Hospital discharge status for pediatric EMS runs
SNF = Skilled Nursing Facility, ALF = Assisted Living Facility, LMA = Left Against Medical Advice
Of the 14,162 linked
pediatric EMS runs, 18%
were admitted to the
hospital and 82% were
discharged from the ED.
The majority of pediatric
patients were discharged
home from either the ED
or after admission to the
hospital.
The inpatient mortality
for pediatric patients was
1.3% and the ED
mortality was 0.3%.
6.2% of pediatric
inpatients were
discharged to a SNF/
ALF/Rehab or to a long
term care facility.
Graph 13: Hospital discharge status for pediatric EMS runs
EMS Annual Report | 2015
25
EMS run rate by age
Geriatric Population
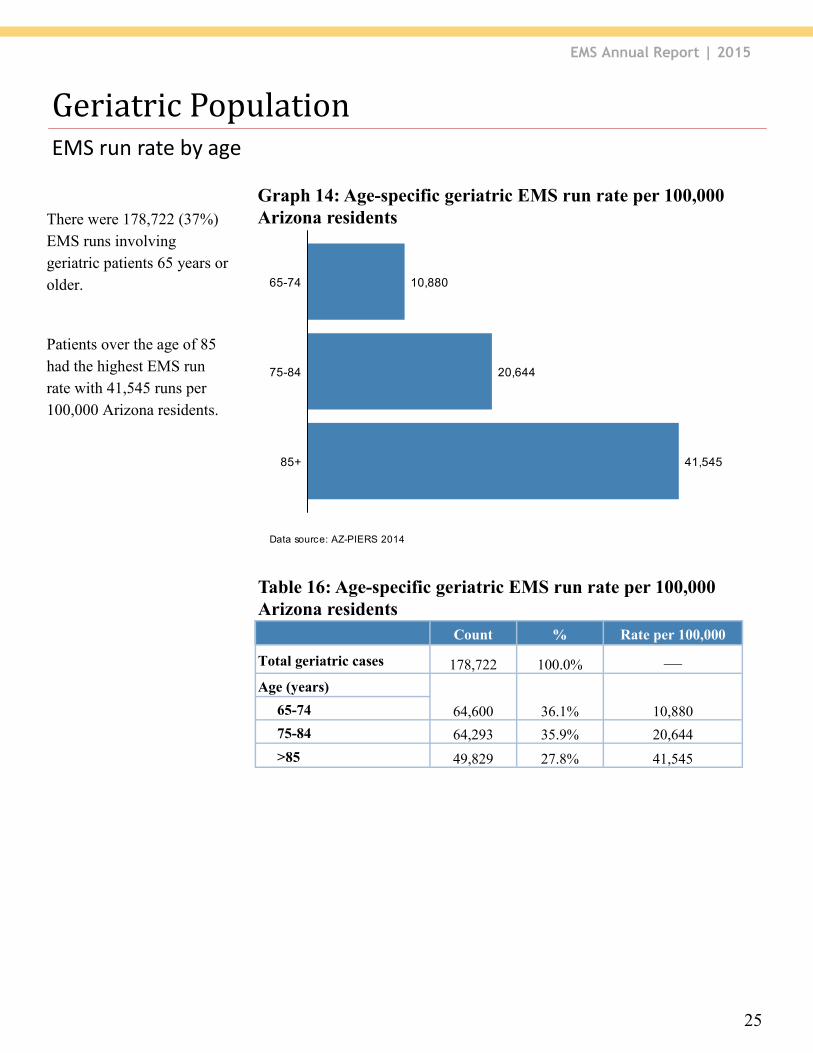
Count % Rate per 100,000
Total geriatric cases 178,722 100.0% —
Age (years)
64,600 36.1% 10,880 65-74
75-84 64,293 35.9% 20,644
>85 49,829 27.8% 41,545
Table 16: Age-specific geriatric EMS run rate per 100,000
Arizona residents
There were 178,722 (37%)
EMS runs involving
geriatric patients 65 years or
older.
Patients over the age of 85
had the highest EMS run
rate with 41,545 runs per
100,000 Arizona residents.
Data source: AZ-PIERS 2014
Graph 11: Age-specific geriatric EMS run rate per 100,000
10,880
20,644
41,54585+
75-84
65-74
Graph 14: Age-specific geriatric EMS run rate per 100,000
Arizona residents
EMS Annual Report | 2015
26
Provider Primary Impression
Geriatric Population
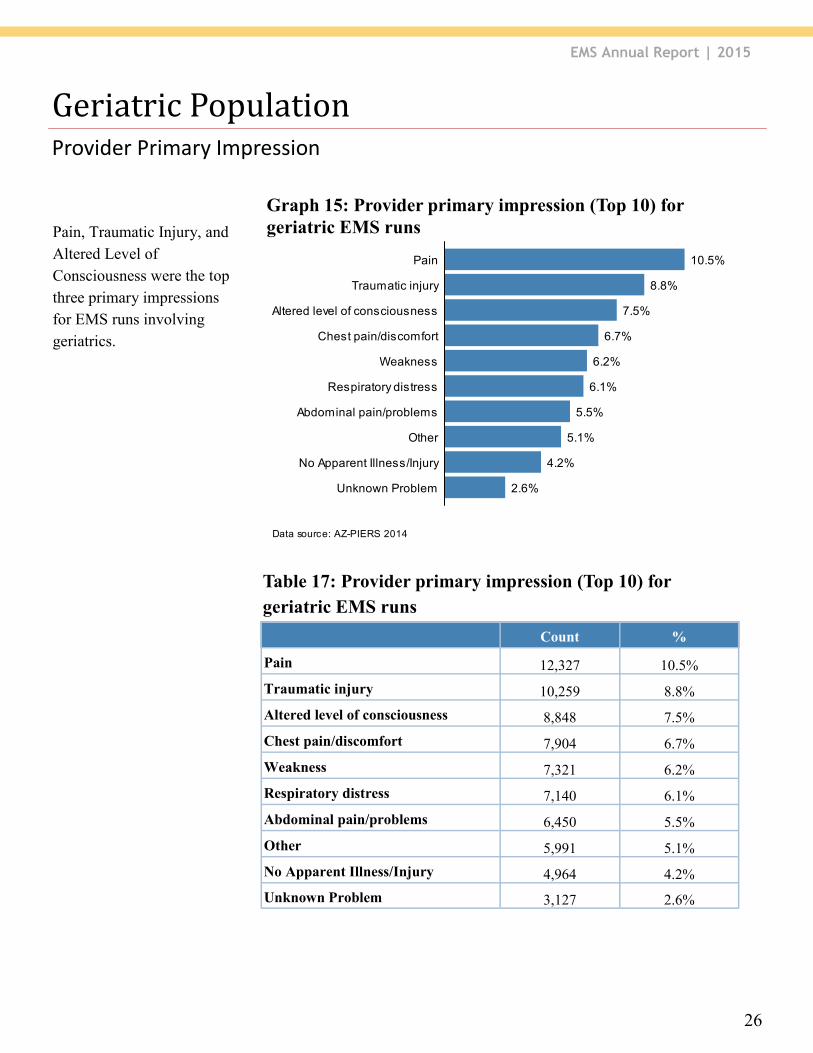
Count %
Pain 12,327 10.5%
Traumatic injury 10,259 8.8%
Altered level of consciousness 8,848 7.5%
Chest pain/discomfort 7,904 6.7%
Weakness 7,321 6.2%
Respiratory distress 7,140 6.1%
Abdominal pain/problems 6,450 5.5%
Other 5,991 5.1%
No Apparent Illness/Injury 4,964 4.2%
Unknown Problem 3,127 2.6%
Table 17: Provider primary impression (Top 10) for
geriatric EMS runs
Pain, Traumatic Injury, and
Altered Level of
Consciousness were the top
three primary impressions
for EMS runs involving
geriatrics.
Data source: AZ-PIERS 2014
Graph 13: Provider primary impression of all geriatric EMSruns (Top 10)
2.6%
4.2%
5.1%
5.5%
6.1%
6.2%
6.7%
7.5%
8.8%
10.5%
Unknown Problem
No Apparent Illness/Injury
Other
Abdominal pain/problems
Respiratory distress
Weakness
Chest pain/discomfort
Altered level of consciousness
Traumatic injury
Pain
Graph 15: Provider primary impression (Top 10) for
geriatric EMS runs
EMS Annual Report | 2015
27
Incident Disposition
Geriatric Population
Count %
Not Documented 371 0.2%
Cancelled 257 0.1%
Dead at Scene 1,032 0.5%
No Patient Found 204 0.1%
No Treatment Required 1,490 0.8%
Patient Refused Care 6,478 3.6%
Treated and Released 5,065 2.8%
Treated, Transferred/Transported 163,058 91.2%
Public Assist 210 0.1%
EMS Care / Assistance 557 0.3%
Table 18: Incident disposition for geriatric EMS patients
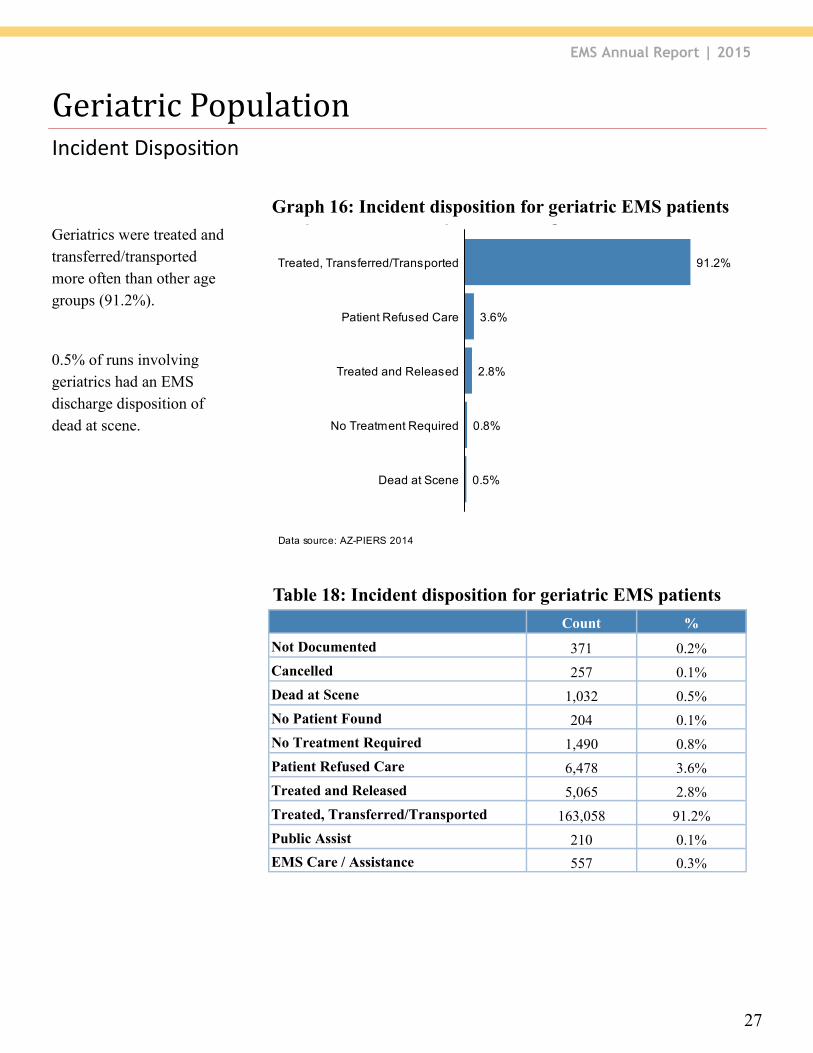
Geriatrics were treated and
transferred/transported
more often than other age
groups (91.2%).
0.5% of runs involving
geriatrics had an EMS
discharge disposition of
dead at scene.
Data source: AZ-PIERS 2014
Graph 14: Incident disposition of all geriatric EMS runs
0.5%
0.8%
2.8%
3.6%
91.2%
Dead at Scene
No Treatment Required
Treated and Released
Patient Refused Care
Treated, Transferred/Transported
Graph 16: Incident disposition for geriatric EMS patients
EMS Annual Report | 2015
28
Hospital Diagnosis
Geriatric Population
Count %
Septicemia 5,344 4.7%
Chest pain 4,859 4.3%
Syncope 4,035 3.6%
Dysrhythmia 3,762 3.3%
Other injury 3,510 3.1%
Fracture hip 3,393 3.0%
Urinary Tract Infection 3,351 3.0%
Acute Cerebrovascular Disease 3,167 2.8%
Superficial injury 3,105 2.7%
Pneumonia 2,889 2.5%
Table 19: Hospital principal diagnosis (Top 10) for geriatric
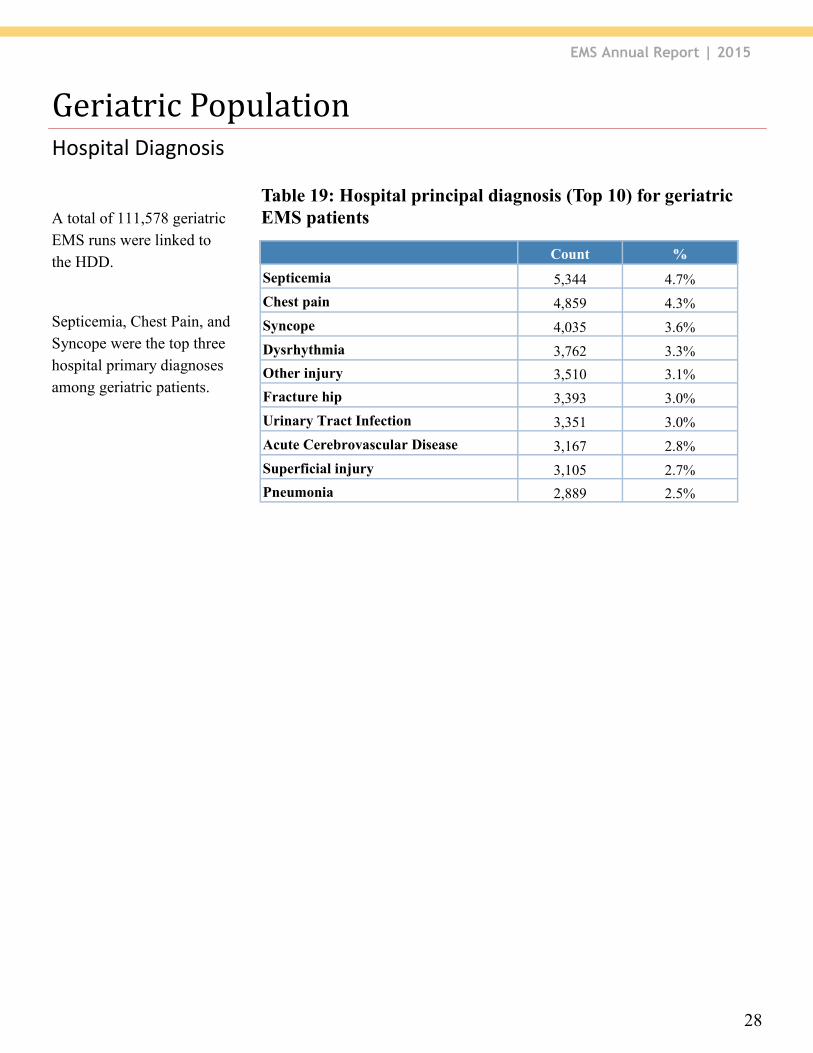
EMS patients A total of 111,578 geriatric
EMS runs were linked to
the HDD.
Septicemia, Chest Pain, and
Syncope were the top three
hospital primary diagnoses
among geriatric patients.
EMS Annual Report | 2015
29
Hospital Discharge Status
Geriatric Population
Data source: AZ-PIERS 2014 and HDD 2014
Graph 9: Hospital discharge status of geriatric population
7.9%
84.4%
1.4%
3.6%
1.6%
0.9%
0.0%
1.5%
38.3%
7.8%
4.0%
47.4%
0.5%
0.1%
Transferred to Acute Care
SNF/ALF/Rehab/Long Term
Home
Hospice
Expired
LMA
Discharged with planned readmission
EDInpatient
Hospital discharge status Admitted as inpatient Discharged from ED
Count % Count %
Home 19,822 38.3% 50,603 84.4%
Transferred to Acute Care 826 1.5% 2,178 3.6%
SNF/ALF/Rehab/Long Term 24,474 47.4% 4,767 7.9%
LMA 277 0.5% 846 1.4%
Expired 2,106 4.0% 989 1.6%
Hospice 4,069 7.8% 553 0.9%
Discharged with planned readmission 53 0.1% 15 0.0%
Total 51,627 100.0% 59,951 100.0%
Table 20: Hospital discharge status for geriatric EMS patients
Note: SNF = Skilled Nursing Facility, ALF = Assisted Living Facility, LMA = Left Against Medical Advice
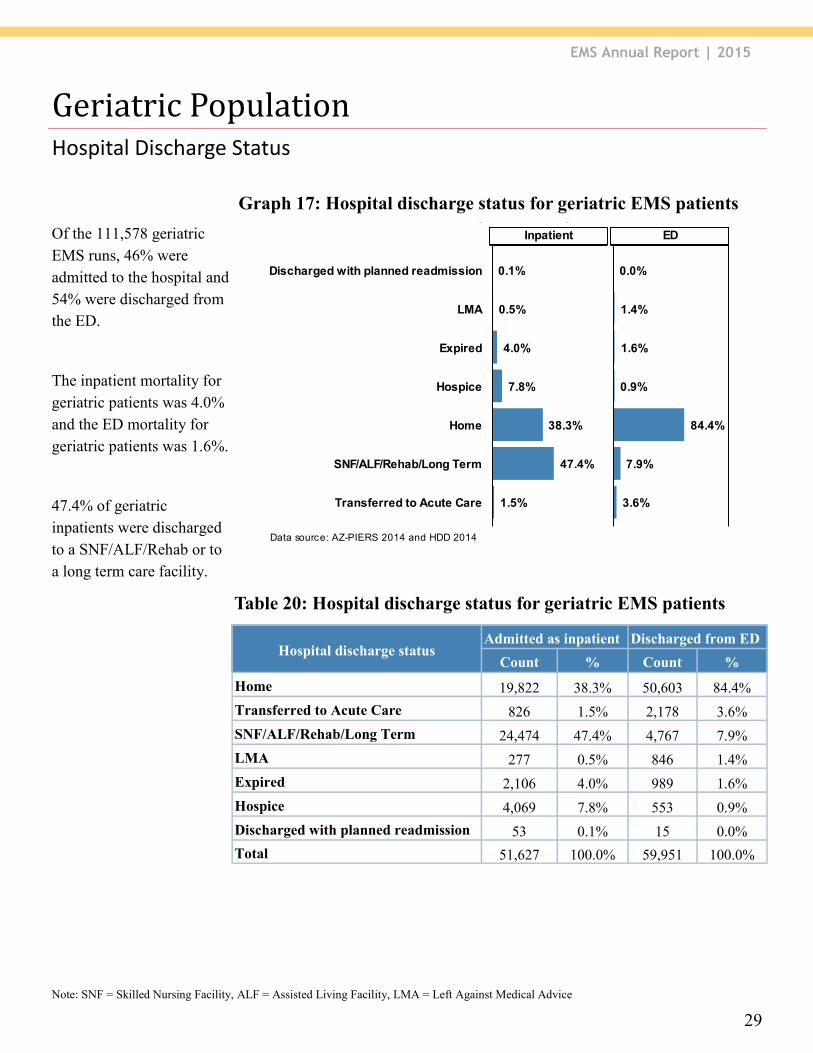
Of the 111,578 geriatric
EMS runs, 46% were
admitted to the hospital and
54% were discharged from
the ED.
The inpatient mortality for
geriatric patients was 4.0%
and the ED mortality for
geriatric patients was 1.6%.
47.4% of geriatric
inpatients were discharged
to a SNF/ALF/Rehab or to
a long term care facility.
Graph 17: Hospital discharge status for geriatric EMS patients
EMS Annual Report | 2015
30
On Scene & In-hospital
Mortality
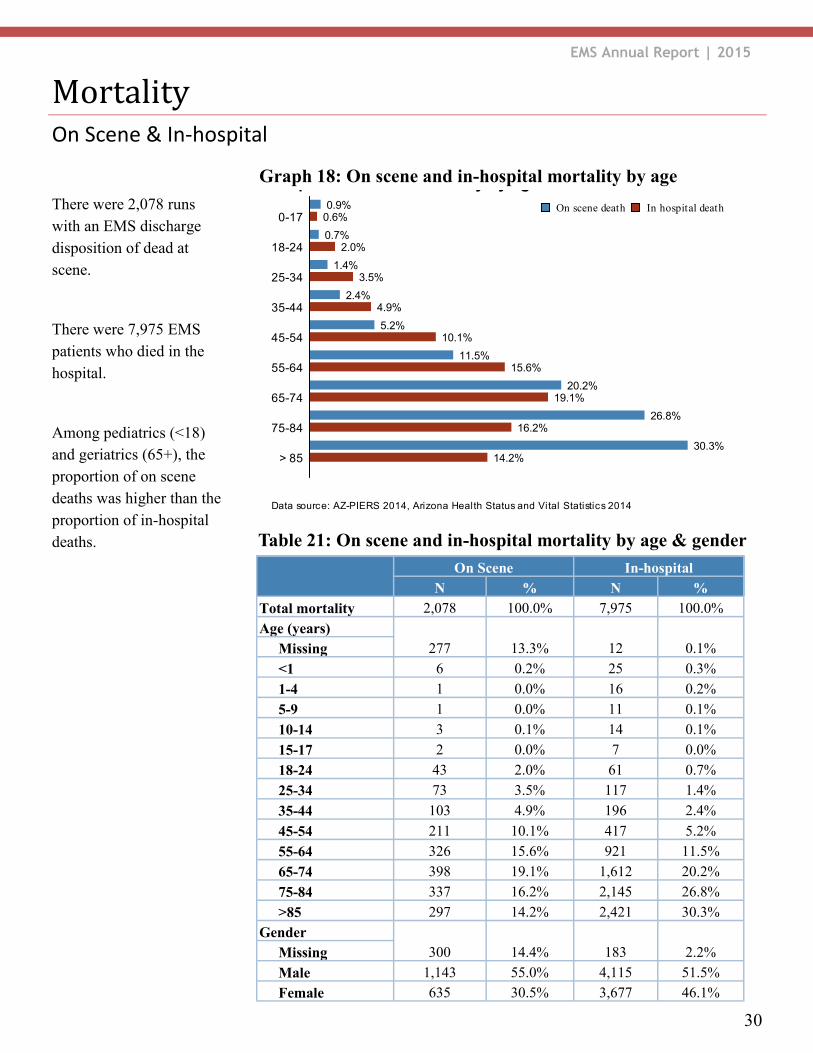
There were 2,078 runs
with an EMS discharge
disposition of dead at
scene.
There were 7,975 EMS
patients who died in the
hospital.
Among pediatrics (<18)
and geriatrics (65+), the
proportion of on scene
deaths was higher than the
proportion of in-hospital
deaths.
On Scene In-hospital
N % N % Total mortality 2,078 100.0% 7,975 100.0% Age (years)
277 13.3% 12 0.1% Missing <1 6 0.2% 25 0.3%
1-4 1 0.0% 16 0.2%
5-9 1 0.0% 11 0.1%
10-14 3 0.1% 14 0.1%
15-17 2 0.0% 7 0.0%
18-24 43 2.0% 61 0.7%
25-34 73 3.5% 117 1.4%
35-44 103 4.9% 196 2.4%
45-54 211 10.1% 417 5.2%
55-64 326 15.6% 921 11.5%
65-74 398 19.1% 1,612 20.2%
75-84 337 16.2% 2,145 26.8%
>85 297 14.2% 2,421 30.3% Gender
300 14.4% 183 2.2% Missing Male 1,143 55.0% 4,115 51.5% Female 635 30.5% 3,677 46.1%
Data source: AZ-PIERS 2014, Arizona Health Status and Vital Statistics 2014
Graph 16: EMS run mortality by age
0.9%
0.7%
1.4%
2.4%
5.2%
11.5%
20.2%
26.8%
30.3%
0.6%
2.0%
3.5%
4.9%
10.1%
15.6%
19.1%
16.2%
14.2%> 85
75-84
65-74
55-64
45-54
35-44
25-34
18-24
0-17In hospital deathOn scene death
Table 21: On scene and in-hospital mortality by age & gender
Graph 18: On scene and in-hospital mortality by age
EMS Annual Report | 2015
31
Died In Hospital N % Altered level of consciousness 1,049 14.6%
Cardiac Arrest 1,033 14.4%
Respiratory distress 873 12.2%
Weakness 392 5.4%
Pain 389 5.4%
Traumatic injury 373 5.2%
Abdominal pain/problems 347 4.8%
Stoke/CVA 244 3.4%
Other 231 3.2% Chest pain/discomfort 230 3.2%
Provider Primary Impression/Hospital Primary Diagnosis
Mortality
Died On Scene N %
Obvious death 807 48.4%
Cardiac Arrest 592 35.5%
Traumatic injury 57 3.4%
Cardiac Arrest - Asystole 52 3.1%
Unconscious 43 2.5%
Other 27 1.6%
Altered level of consciousness 18 1.0%
Gun Shot Wound/Open Wound 12 0.7%
Respiratory arrest 6 0.3%
Syncope/fainting 4 0.2%
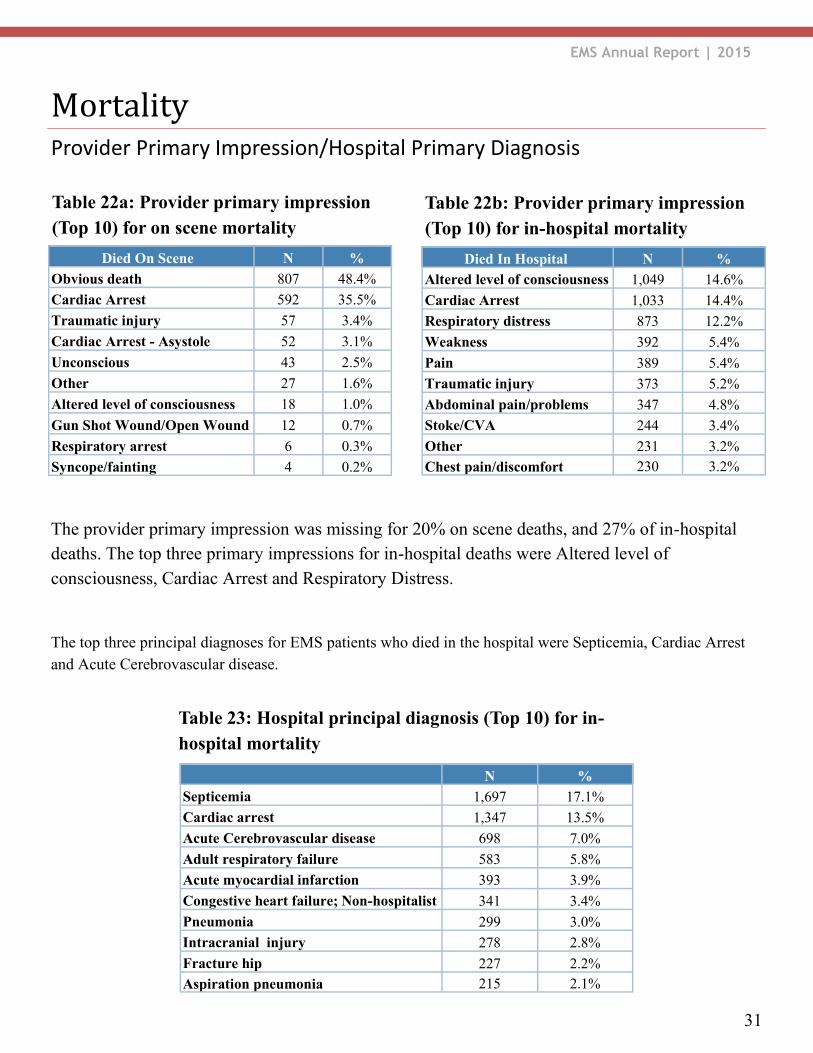
Table 22a: Provider primary impression
(Top 10) for on scene mortality
N % Septicemia 1,697 17.1%
Cardiac arrest 1,347 13.5%
Acute Cerebrovascular disease 698 7.0%
Adult respiratory failure 583 5.8%
Acute myocardial infarction 393 3.9%
Congestive heart failure; Non-hospitalist 341 3.4%
Pneumonia 299 3.0%
Intracranial injury 278 2.8%
Fracture hip 227 2.2% Aspiration pneumonia 215 2.1%
Table 22b: Provider primary impression
(Top 10) for in-hospital mortality
Table 23: Hospital principal diagnosis (Top 10) for in-
hospital mortality
The provider primary impression was missing for 20% on scene deaths, and 27% of in-hospital
deaths. The top three primary impressions for in-hospital deaths were Altered level of
consciousness, Cardiac Arrest and Respiratory Distress.
The top three principal diagnoses for EMS patients who died in the hospital were Septicemia, Cardiac Arrest
and Acute Cerebrovascular disease.