emerging financial market 6. measuring political risk prof. j.p. mei
Post on 22-Dec-2015
215 views
TRANSCRIPT

Emerging Financial Market 6. Measuring Political Risk
Prof. J.P. Mei

1
Emerging markets in the 1900s World Trade accounted for huge part of
GDP in many countries. Equity markets at the turn of the
century flourished, many markets established.
Internet Technology (Railroad) & Worldwide Real Time Communication
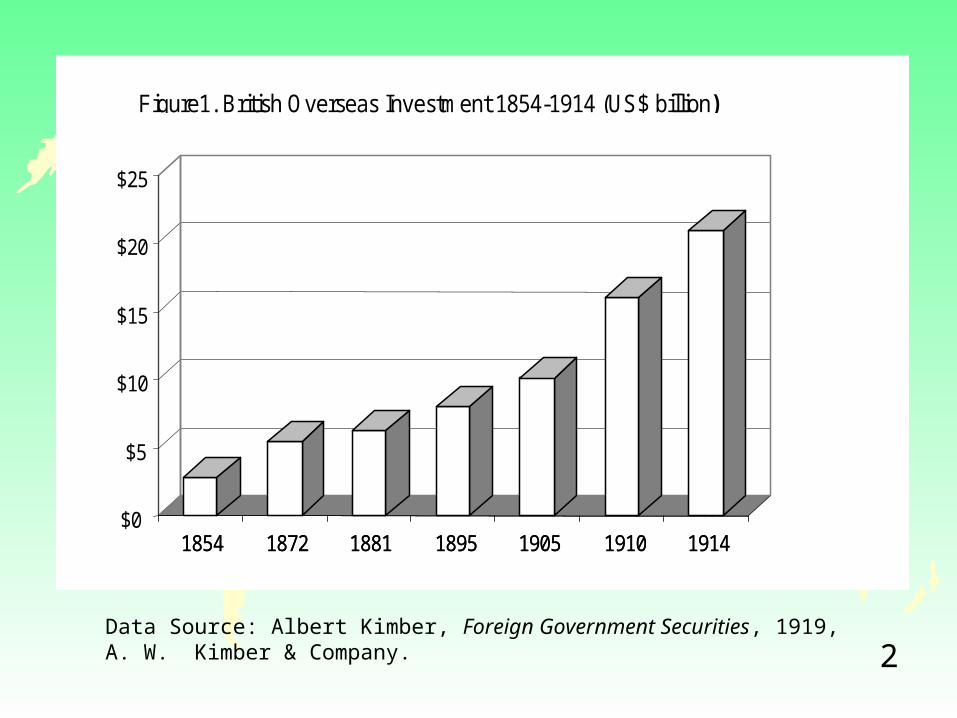
Foreign Investment surged (US$44 Billion in 1913 dollars)
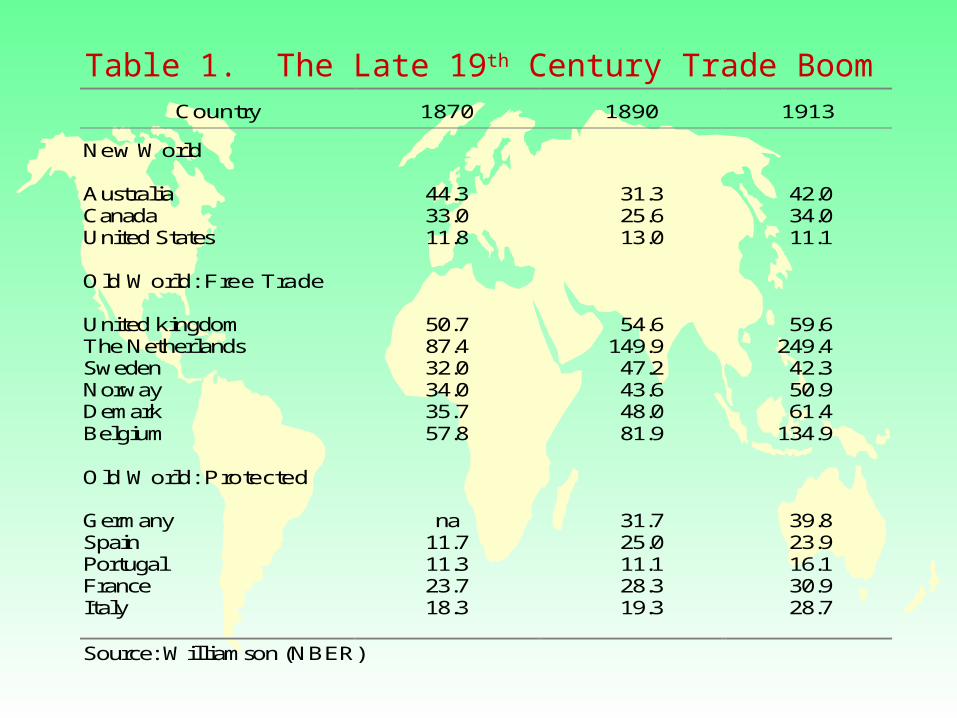
Table 1. The Late 19th Century Trade BoomCountry 1870 1890 1913
New World
Australia 44.3 31.3 42.0Canada 33.0 25.6 34.0United States 11.8 13.0 11.1
Old World: Free Trade
United kingdom 50.7 54.6 59.6The Netherlands 87.4 149.9 249.4Sweden 32.0 47.2 42.3Norway 34.0 43.6 50.9Demark 35.7 48.0 61.4Belgium 57.8 81.9 134.9
Old World: Protected
Germany na 31.7 39.8Spain 11.7 25.0 23.9Portugal 11.3 11.1 16.1France 23.7 28.3 30.9Italy 18.3 19.3 28.7
Source: Williamson (NBER)
2
Data Source: Albert Kimber, Foreign Government Securities, 1919, A. W. Kimber & Company.
1854 1872 1881 1895 1905 1910 1914$0
$5
$10
$15
$20
$25
1854 1872 1881 1895 1905 1910 1914
Figure1. British Overseas Investment 1854-1914 (US$ billion)

Table 2. Main Creditor and Debtor Countries, 1913Source: United Nations (1949)

Major sources of Political Risk in the past
Two Major Exploitations: within and across Countries (Slavery and Child Labor) Caused Strong Resentment.
Communism and the Risk of Nationalization Colonialism and the Risk of Political Upheaval.
(Then superpower was the largest government supported drug dealer in the world)
World WAR I and the Russian Revolution ended the first wave of globalization.
Long-term Return of Emerging markets (not glamorous due to submerged markets)

Figure 2: British Sales of Opium to China (Thousand Chests)Source: Mark Borthwick, Pacific Century, Westview Press, 1992
0
5
10
15
20
25
1729 1790 1819 1823 1832

Cultural Clash between the Modern and Ancient
Measuring Risks Measurement of political risk
Measuring corruption
Measuring the rule of Law
Political risk measurements can be used
in project financing. (discount rates)
Measuring political risks is still an art
rather than a science.2

Political Risk Insurance Eligibility & Coverage OPIC insurance can cover the following
three political risks: currency inconverti-bility, expropriation, political violence.
OPIC insures Business income and assets.
Election of Coverage & Premium Base Rates
Problem: Lack a systematic approach 3

Political Uncertainty and Elections
Election cycle a) the time leading up to an election and the
time of government transition after the election, and
b) the time after the transition is complete and the next election season starts.
In a democratic system, the election process is a major political event for determining future political course of a country.
4
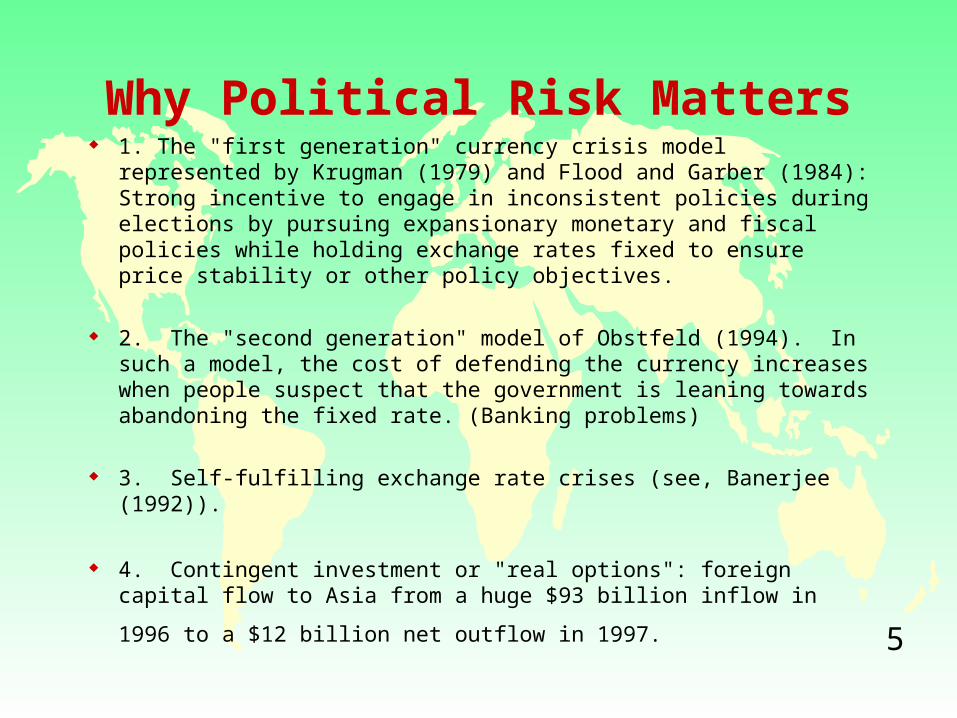
Why Political Risk Matters 1. The "first generation" currency crisis model represented by Krugman
(1979) and Flood and Garber (1984): Strong incentive to engage in inconsistent policies during elections by pursuing expansionary monetary and fiscal policies while holding exchange rates fixed to ensure price stability or other policy objectives.
2. The "second generation" model of Obstfeld (1994). In such a model, the cost of defending the currency increases when people suspect that the government is leaning towards abandoning the fixed rate. (Banking problems)
3. Self-fulfilling exchange rate crises (see, Banerjee (1992)).
4. Contingent investment or "real options": foreign capital flow to Asia from a huge $93 billion inflow in 1996 to a $12 billion net outflow in
1997. 5

Dependent Variables Financial crisis: defined as a sharp shift
from inflow to outflow between year t-1 and t
Turkey and Venezuela in 1994, Argentina and Mexico in 1995; and Indonesia, Korea, Malaysia, the Philippines, and Thailand in 1997.
78 observations (22 x 4 - 10 excluded observations)
equity returns and market volatility: the IFC index.
6
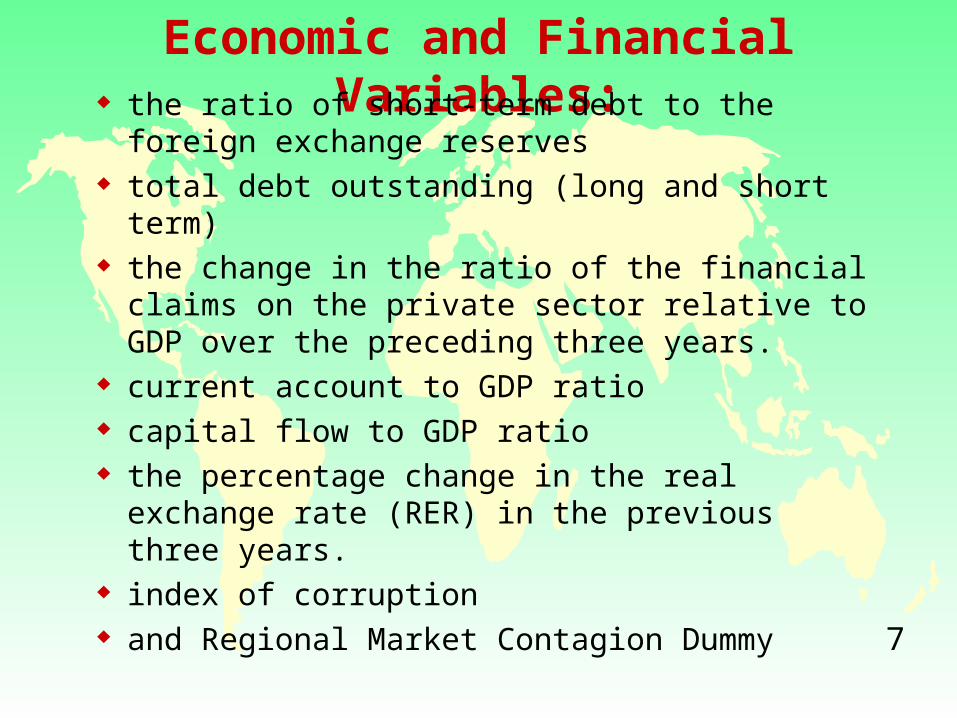
Economic and Financial Variables: the ratio of short-term debt to the foreign
exchange reserves total debt outstanding (long and short term) the change in the ratio of the financial claims on
the private sector relative to GDP over the preceding three years.
current account to GDP ratio capital flow to GDP ratio the percentage change in the real exchange rate
(RER) in the previous three years. index of corruption and Regional Market Contagion Dummy
7
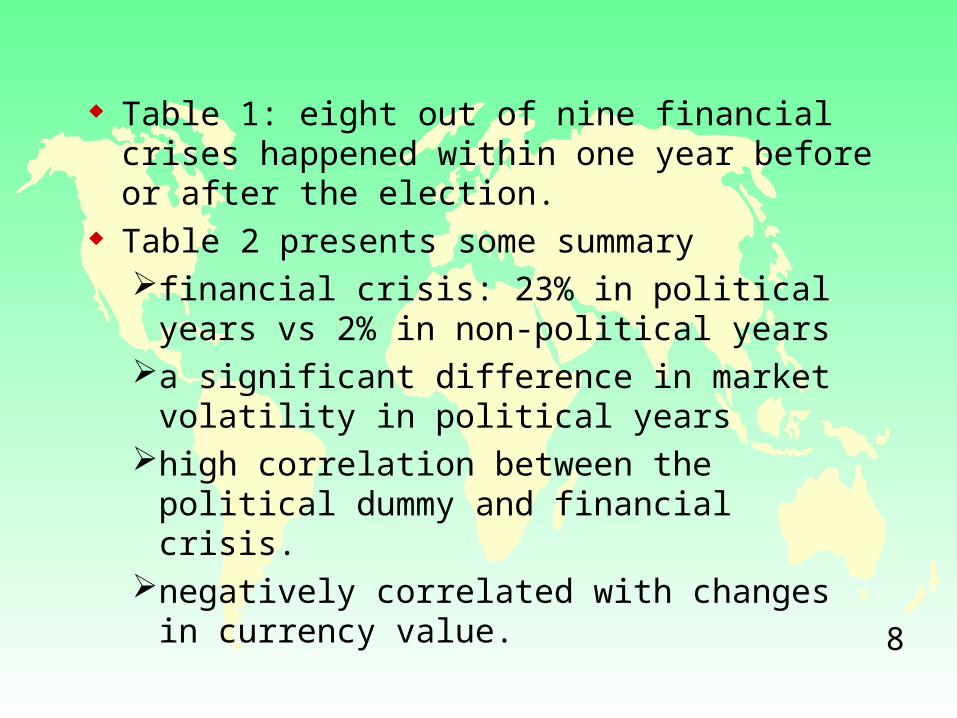
Table 1: eight out of nine financial crises happened within one year before or after the election.
Table 2 presents some summary financial crisis: 23% in political years vs 2% in
non-political yearsa significant difference in market volatility in
political years high correlation between the political dummy
and financial crisis. negatively correlated with changes in currency
value. 8
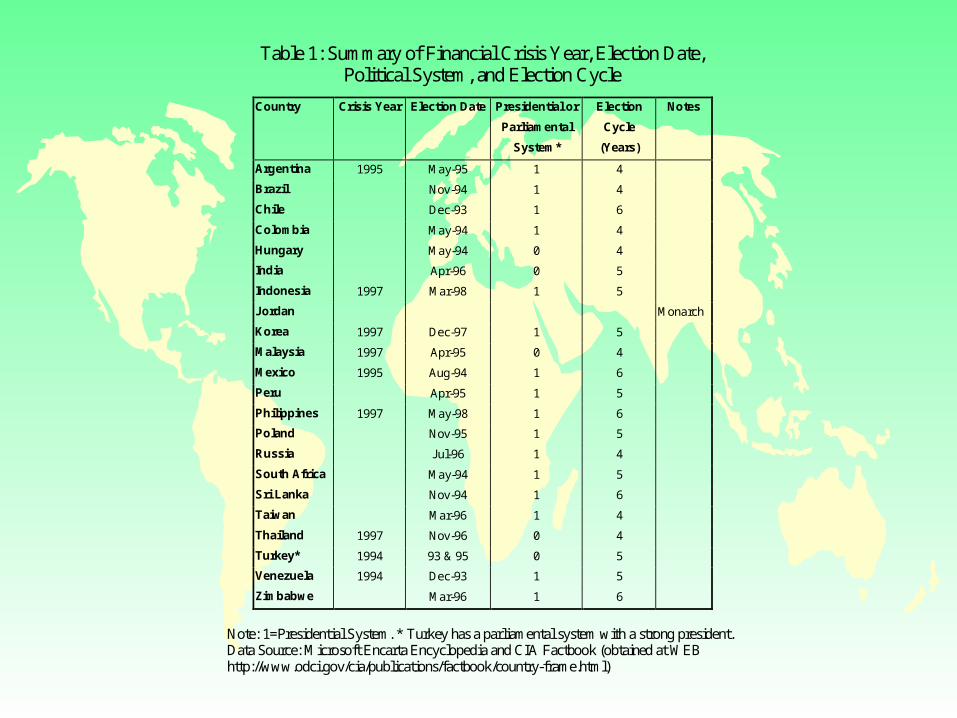
Table 1: Summary of Financial Crisis Year, Election Date,Political System, and Election Cycle
Country Crisis Year Election Date Presidential or
Parliamental
System*
Election
Cycle
(Years)
Notes
Argentina 1995 May-95 1 4
Brazil Nov-94 1 4
Chile Dec-93 1 6
Colombia May-94 1 4
Hungary May-94 0 4
India Apr-96 0 5
Indonesia 1997 Mar-98 1 5
Jordan Monarch
Korea 1997 Dec-97 1 5
Malaysia 1997 Apr-95 0 4
Mexico 1995 Aug-94 1 6
Peru Apr-95 1 5
Philippines 1997 May-98 1 6
Poland Nov-95 1 5
Russia Jul-96 1 4
South Africa May-94 1 5
Sri Lanka Nov-94 1 6
Taiwan Mar-96 1 4
Thailand 1997 Nov-96 0 4
Turkey* 1994 93 & 95 0 5
Venezuela 1994 Dec-93 1 5
Zimbabwe Mar-96 1 6
Note: 1=Presidential System. * Turkey has a parliamental system with a strong president.Data Source: Microsoft Encarta Encyclopedia and CIA Factbook (obtained at WEBhttp://www.odci.gov/cia/publications/factbook/country-frame.html)

Table 2: Summary Statistics of Crisis Variables (by Political Dummy)Financial
CrisisCurrentAccountto GDP
CapitalInflow to
GDP
CorruptIndex
3 yearChangein Creditto GDP
3 year %change inReal FX
rate
Short-term debt
to GDP
Totaldebt toreserve
ratio
EquityReturn $
Changein
CurrencyValue
EquityMarket
Volatility
Contagion
PoliticalMean 0.23 -0.03 0.06 3.47 0.07 -17.09 1.15 2.06 0.02 -0.17 0.11 0.34
St. Dev 0.43 0.04 0.09 0.81 0.13 26.74 1.16 2.21 0.53 0.22 0.04 0.48
Non-Political
Mean 0.02 -0.02 0.01 3.63 0.04 -14.95 1.04 2.29 0.12 -0.09 0.08 0.14St. Dev 0.15 0.09 0.21 0.95 0.26 25.13 1.04 3.37 0.73 0.14 0.06 0.35
T-stat. 2.71 -0.97 1.36 -0.78 0.55 -0.36 0.45 -0.36 -0.69 -1.83 2.62 2.09
Correla tionsC. Acc -0.15
Cap. FL 0.07 -0.9Corrupt -0.14 -0.06 0.05Credit 0.20 0.31 -0.33 -0.05
Real FX 0.00 -0.26 0.31 0.31 0.31ST Debt 0.24 0.34 -0.37 -0.03 -0.07 -0.25Debt/Res 0.01 0.38 -0.38 0.07 -0.07 -0.21 0.78Eq. Ret$ -0.31 0.73 -0.73 -0.03 0.3 -0.29 0.13 0.16Devalue -0.53 -0.24 0.29 0.15 -0.34 0.04 -0.26 -0.23 -0.10Volatility 0.31 0.53 -0.54 -0.08 0.29 -0.31 0.27 0.2 0.46 -0.65Political 0.32 -0.10 0.14 -0.09 0.06 -0.04 0.05 -0.04 -0.08 -0.21 0.28
Contagion 0.28 -0.10 0.08 -0.26 0.16 -0.09 -0.12 -0.06 -0.15 -0.24 0.08 0.24
Data Sources: The political dummy variables are based on election information provided inWorld Factbook published by CIA and confirmed by Microsoft's Encarta Encyclopedia.Radelet and Sachs (1998) provided the economic variables and crisis definition.Note: The current account to GDP ratio, the capital Inflow to GDP ratio, 3 year Change inCredit to GDP ratio, 3 year % change in Real FX rate, Short-term debt to GDP ratio, andtotal debt to reserve ratio are measured at the end of last year.

Table 3 presents some summary statistics according to financial crisis.
significantly higher current account deficit, higher capital inflows, larger change in bank credit in the past three years, and higher short-term debt to GDP ratios.
A Probit Analysis of Emerging Market Crises
9
iiii cDbXaY
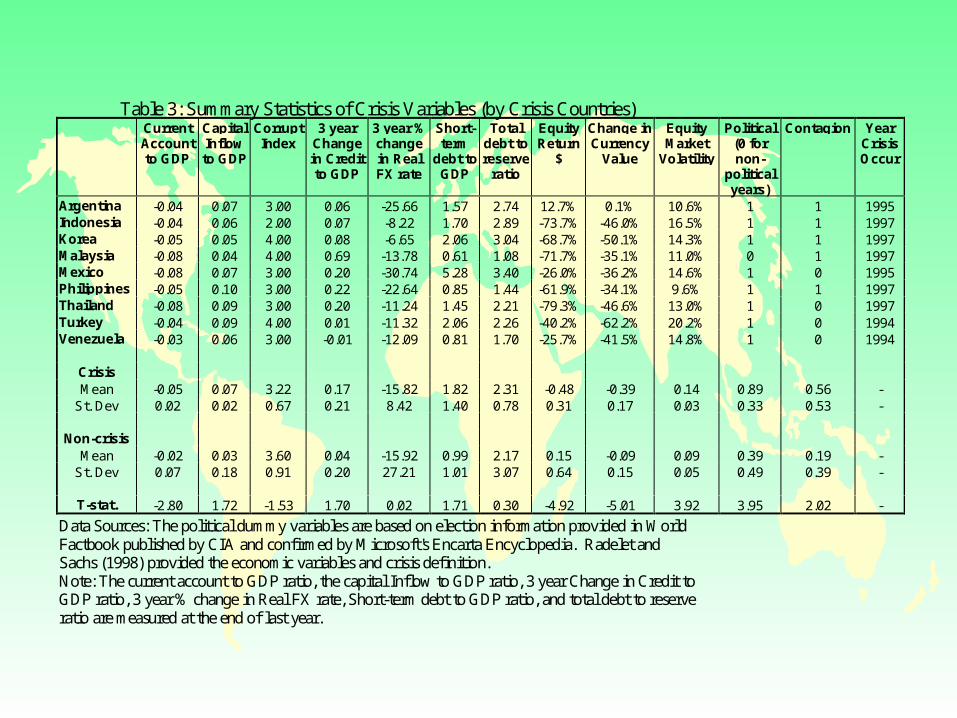
Table 3: Summary Statistics of Crisis Variables (by Crisis Countries)CurrentAccountto GDP
CapitalInflowto GDP
CorruptIndex
3 yearChangein Creditto GDP
3 year %changein RealFX rate
Short-term
debt toGDP
Totaldebt toreserve
ratio
EquityReturn
$
Change inCurrency
Value
EquityMarket
Volatility
Political(0 fornon-
politicalyears)
Contagion YearCrisisOccur
Argentina -0.04 0.07 3.00 0.06 -25.66 1.57 2.74 12.7% 0.1% 10.6% 1 1 1995Indonesia -0.04 0.06 2.00 0.07 -8.22 1.70 2.89 -73.7% -46.0% 16.5% 1 1 1997Korea -0.05 0.05 4.00 0.08 -6.65 2.06 3.04 -68.7% -50.1% 14.3% 1 1 1997Malaysia -0.08 0.04 4.00 0.69 -13.78 0.61 1.08 -71.7% -35.1% 11.0% 0 1 1997Mexico -0.08 0.07 3.00 0.20 -30.74 5.28 3.40 -26.0% -36.2% 14.6% 1 0 1995Philippines -0.05 0.10 3.00 0.22 -22.64 0.85 1.44 -61.9% -34.1% 9.6% 1 1 1997Thailand -0.08 0.09 3.00 0.20 -11.24 1.45 2.21 -79.3% -46.6% 13.0% 1 0 1997Turkey -0.04 0.09 4.00 0.01 -11.32 2.06 2.26 -40.2% -62.2% 20.2% 1 0 1994Venezuela -0.03 0.06 3.00 -0.01 -12.09 0.81 1.70 -25.7% -41.5% 14.8% 1 0 1994
CrisisMean -0.05 0.07 3.22 0.17 -15.82 1.82 2.31 -0.48 -0.39 0.14 0.89 0.56 -
St. Dev 0.02 0.02 0.67 0.21 8.42 1.40 0.78 0.31 0.17 0.03 0.33 0.53 -
Non-crisisMean -0.02 0.03 3.60 0.04 -15.92 0.99 2.17 0.15 -0.09 0.09 0.39 0.19 -
St. Dev 0.07 0.18 0.91 0.20 27.21 1.01 3.07 0.64 0.15 0.05 0.49 0.39 -
T-stat. -2.80 1.72 -1.53 1.70 0.02 1.71 0.30 -4.92 -5.01 3.92 3.95 2.02 -
Data Sources: The political dummy variables are based on election information provided in WorldFactbook published by CIA and confirmed by Microsoft's Encarta Encyclopedia. Radelet andSachs (1998) provided the economic variables and crisis definition.Note: The current account to GDP ratio, the capital Inflow to GDP ratio, 3 year Change in Credit toGDP ratio, 3 year % change in Real FX rate, Short-term debt to GDP ratio, and total debt to reserveratio are measured at the end of last year.
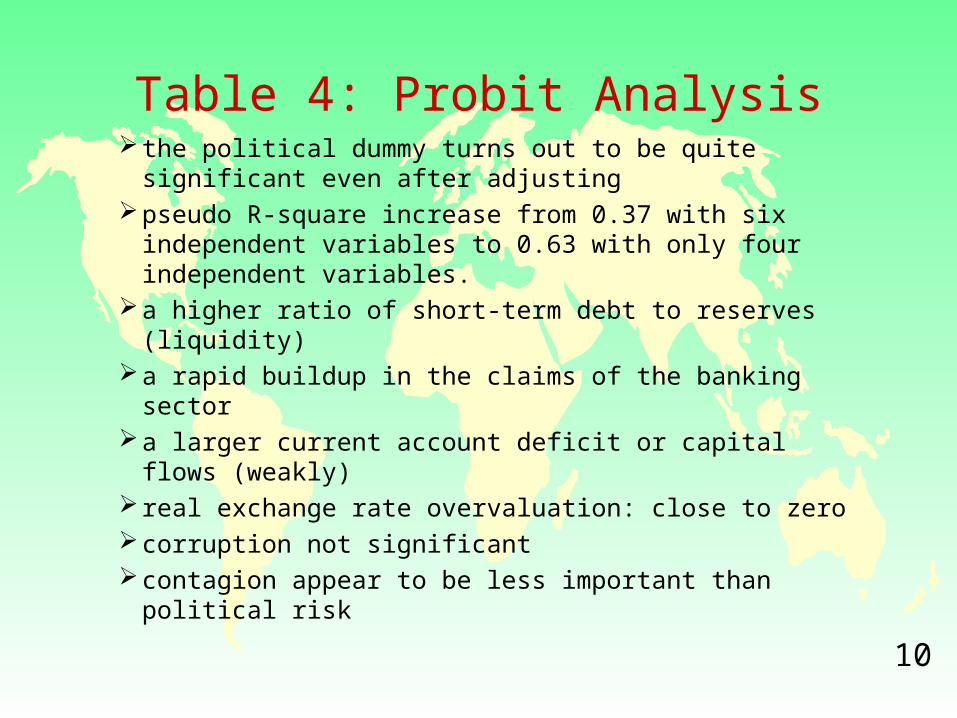
Table 4: Probit Analysis the political dummy turns out to be quite significant
even after adjusting pseudo R-square increase from 0.37 with six
independent variables to 0.63 with only four independent variables.
a higher ratio of short-term debt to reserves (liquidity) a rapid buildup in the claims of the banking sector a larger current account deficit or capital flows
(weakly) real exchange rate overvaluation: close to zero corruption not significant contagion appear to be less important than political risk
10

Table 4. Probit Results for Financial Crisis__________________________________________________________________________________________________
OutputProbit results I II III IV V VI VII VIII
Independent variable Coefficient (Z stat)
Short term debt/ Reserves 0.543 2.501 0.538 0.590 2.201 0.353 0.639 0.579(2.12)** (1.96)** (2.04)** (2.05)** (1.70)* (1.76)* (2.66)*** (2.23)**
Private credit/GDP 3.774 4.147 4.152 3.967 5.178 2.145 2.610 3.174(2.51)** (2.51)** (2.51)** (2.55)** (2.35)** (2.03)** (1.76)* (2.03)**
Total debt/reserves -1.071 -0.820(-1.55) (-1.08)
Capital inflow/GDP 3.203 1.923 3.653 3.357 -6.108(1.63) (0.55) (1.82)* (1.81)* (-0.98)
Current acct surplus/GDP -26.911(-1.67)*
Real exchange rate -0.008 -0.709(-0.65) (-0.05)
Corruption -0.363 -0.621(-1.06) (-1.27)
Political risk 1.486 1.589 1.506 1.420 2.287 1.574 1.308(2.11)** (2.16)** (2.01)** (2.01)** (1.93)* (2.19)** (1.78)*
Contagion 1.009 0.742(2.08)** (1.41)
Polticalrisk*Parliamentary 0.197(0.34)
Constant -3.483 -3.662 -3.675 -2.302 -3.041 -2.997 -2.809 -3.599(-3.98)*** (-3.68)*** (-3.77)*** (-1.74)* (-1.57) (-3.83)*** (-4.86)*** (-4.02)***
Pseudo Rsquared 0.63 0.86 0.64 0.65 0.88 0.56 0.51 0.62
No. of obs 78 78 78 78 78 78 78 78*** 1% significance** 5% significance* 10% significance__________________________________________________________________________________________________
Data Sources: The political dummy variables are based on information provided in World Factbookpublished by CIA and confirmed by Microsoft's Encarta World Encyclopedia. Radelet and Sachs (1998)provided the economic variables and crisis definition.
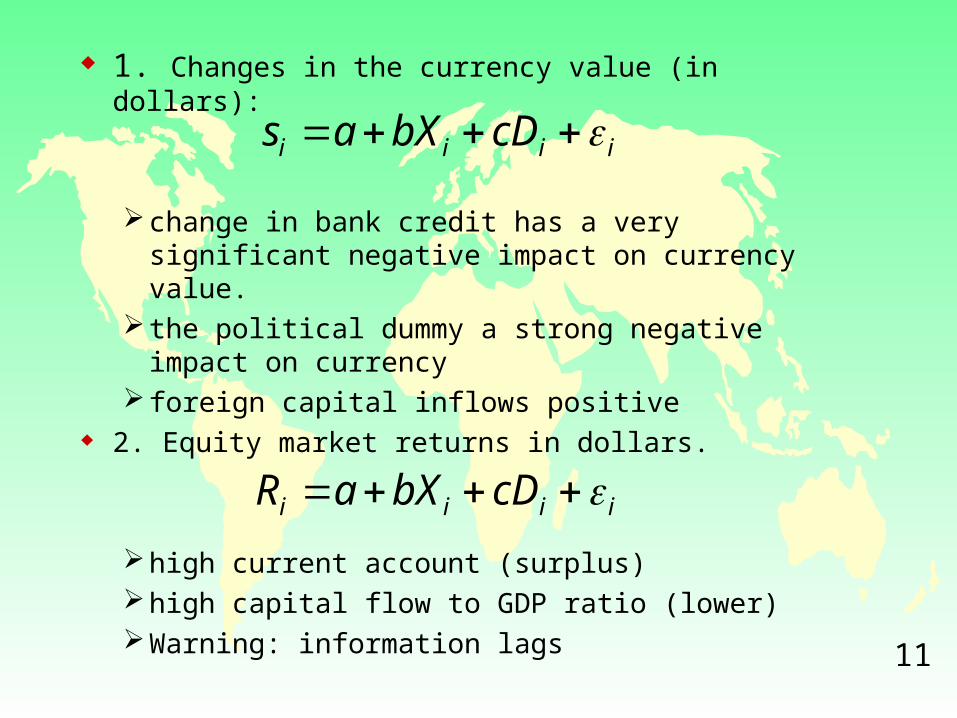
1. Changes in the currency value (in dollars):
change in bank credit has a very significant negative impact on currency value.
the political dummy a strong negative impact on currency
foreign capital inflows positive 2. Equity market returns in dollars.
high current account (surplus) high capital flow to GDP ratio (lower) Warning: information lags 11
iiii cDbXaR
iiii cDbXas
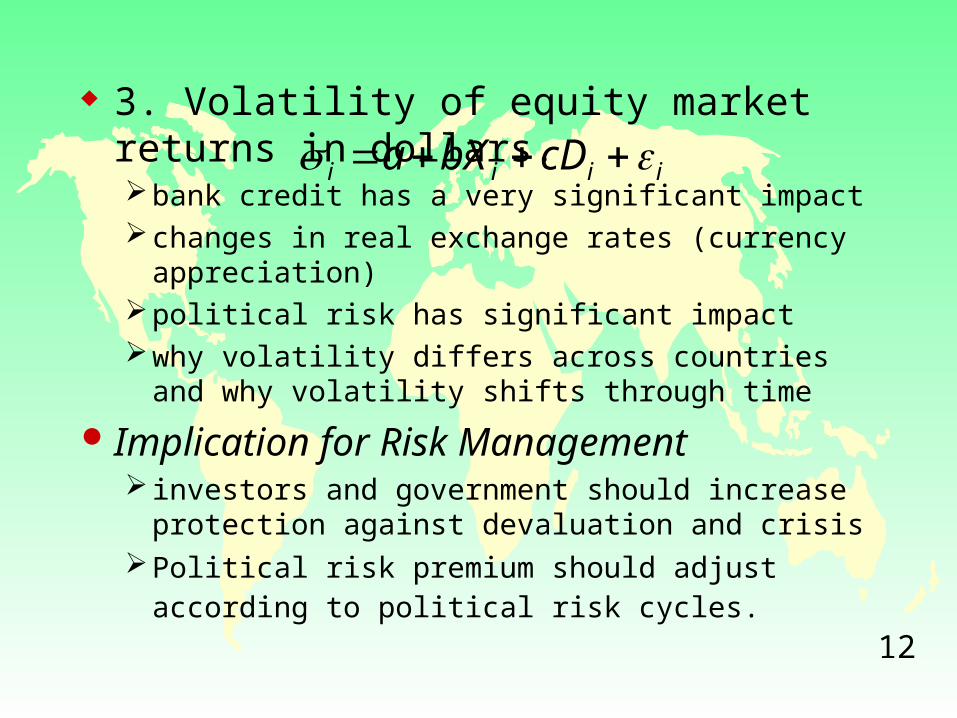
3. Volatility of equity market returns in dollars. bank credit has a very significant impact changes in real exchange rates (currency appreciation) political risk has significant impactwhy volatility differs across countries and why
volatility shifts through time
Implication for Risk Management investors and government should increase protection
against devaluation and crisisPolitical risk premium should adjust according to
political risk cycles. 12
iiii cDbXa

Table 5: Regression Analysis of Determinants of CurrencyDevaluation, Equity Returns (in Dollars) and Market Volatility
________________________________________________________________________________
Dependent variable % Change inCurrencyValue ($)
EquityReturn ($)
EquityMarket
Volatility ($)
Constant -0.092 0.134 0.058(-1.06) (0.60) (2.20)**
Current Account to GDP 0.541 3.972 0.177(0.99) (2.94)*** (1.19)
Capital Inflow to GDP 0.364 -1.114 -0.068(1.64) (-1.89)* (-1.16)
Corrupt Index 0.018 0.036 0.005(0.89) (0.56) (0.66)
3 year change in credit to GDP -0.220 0.442 0.049(-3.02)*** (1.01) (2.66)***
3 year %change in real FX rate -0.000 -0.005 -0.000(-0.31) (-2.19)** (-2.04)**
Short-term debt to GDP -0.026 -0.091 0.006(-1.15) (-1.94)* (1.07)
Total debt to reserve ratio -0.007 -0.009 -0.002(-1.22) (-0.77) (-1.33)
Political Dummy -0.064 0.045 0.031(-1.87)* (0.47) (3.74)***
Contagion -0.072 -0.215 0.003(1.38) (-1.91)* (0.33)
Adjusted R-square 0.196 0.571 0.403
No. of obs 78 78 78
*** 1% significance** 5% significance* 10% significance_______________________________________________________________________________
Data Sources: The political dummy variables are based on information provided in WorldFactbook published by CIA and confirmed by Microsoft's Encarta World Encyclopedia.Radelet and Sachs (1998) provided the economic and financial variables. . The t-statistics have been adjusted for heteroscadaticity using the White-matrix.