emerging from the pandemic
TRANSCRIPT
Updated November 9, 2021Emerging From the Pandemic
“To suggest that the airlines should have better prepared for this environment seems akin to suggesting Pompeii should have invested more heavily in firefighting technology.” (JPMorgan, Mar. 22, 2020)
2
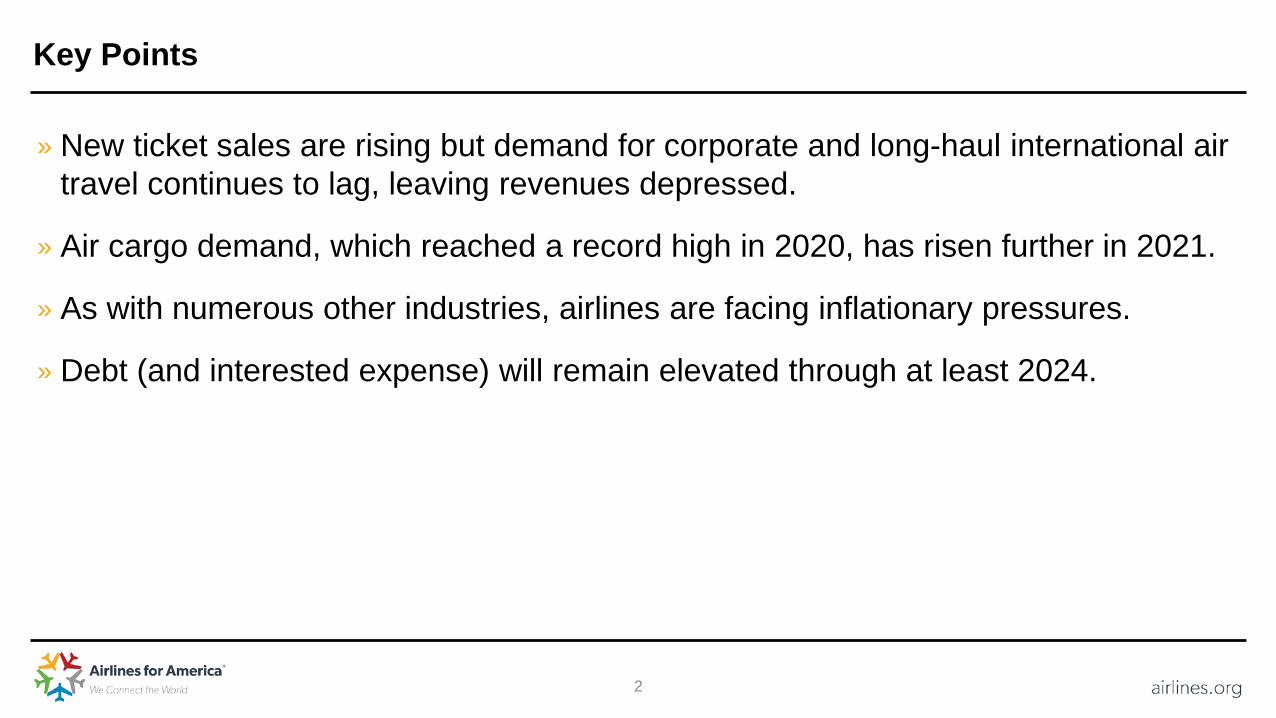
» New ticket sales are rising but demand for corporate and long-haul international air travel continues to lag, leaving revenues depressed.
» Air cargo demand, which reached a record high in 2020, has risen further in 2021.
» As with numerous other industries, airlines are facing inflationary pressures.
» Debt (and interested expense) will remain elevated through at least 2024.
Key Points

3
The Largest U.S. Passenger Airlines Incurred $841 Million in Pre-Tax Losses in YTD 3Q 2021Results Boosted Materially by $19B in Federal Payroll Support Program (PSP) Funds
1. Sale of frequent flyer award miles to airline business partners, transportation of pets, in-sourced aircraft and engine repair, flight simulator rentals, inflight sales, etc.2. Related primarily to ownership of aircraft, ground support equipment, information technology, etc.3. Aircraft rents, professional fees, food/beverage, insurance, commissions, GDS fees, communications, advertising, utilities, office supplies, crew hotels, payments to regional carriers, etc.
Source: Alaska, Allegiant, American, Delta, Hawaiian, JetBlue, Southwest, Spirit and United
Financial Results (in $ Billions) Jan-Sep 2021 % vs. 2019 % of CategoryPassenger (RPMs down 42%, yield down 8%) 67.8 (47) 83.6Cargo 3.6 53 4.5Other1 9.7 (9) 12.0
Total operating revenues 81.1 (41) 100.0Salaries, wages and benefits* 33.3 (6) 42.7Aircraft fuel and related taxes 17.7 (10) 22.7Maintenance materials and repairs 5.0 (1.5) 6.4Landing fees and airport rentals 7.6 0.6 9.8Depreciation and amortization2 7.1 0 9.2Other3 7.2 (10) 9.2Total operating expenses 77.9 (45) 100.0
Interest and other non-op expenses, net 4.0 2 n/aPre-tax income/(loss) (0.8) n/a n/a
* Includes the benefit of ~$19B in federal PSP funds (Jan. 1-Sept. 30, 2021)
Includes the benefit of ~$19B in federal PSP funds.

4
In 2020, Travel-Sector Profitability Took a Massive Hit; Overall Corporate Profitability Was FlatPre-Tax Profit Margin (% of Operating Revenues)
Source: Company SEC filings
6.3 9.8 13
.8
13.8
14.5
21.5
27.8
28.6
34.6
4.9
(58.
8)
(7.1
)
3.6 14
.5
25.4
(34.
3)
32.0
32.9
Chipotle Airlines Disney Starbucks All USA Apple Hotels McDonald´s Railroads
2019 2020
Note: Airlines = Alaska/Allegiant/American/Delta/Hawaiian/JetBlue/Southwest/Spirit/United; Hotels = Choice/Hilton/Hyatt/Marriott/Wyndham; Railroads = CSX/Norfolk Southern/Union Pacific

5
A Multiyear, Multistage Recovery Is Underway
Traffic Recovery
Revenue Recovery
Financial Recovery
Reduce Cash Burn
Restore Profitability& Rebuild Margins
Repair Balance Sheets
Contain the Virus
Stabilize the Economy
Increase Efficiency
Aviation-Government Collaboration on Health/Facilitation/Safety/Technology
Business Model Adaptation + Cost-Reduction Initiatives + Debt ReductionCost-Reduction Initiatives + Business Model Adaptation + Debt Reduction

6
J.D. Power: North America Airline Customer Satisfaction Climbs to Record HighLatest Results Released May 2021
Source: J.D. Power North America Airline Satisfaction StudySM
Note: The 2021 study is based on responses from 2,309 passengers who flew on a major North American airline between August 2020 and March 2021.
692
687
668
658
673
683
681
695
712
717
726
756
762
773
792
819
0
200
400
600
800
1,000
2006 2007 2008 2009 2010 2011 2012 2013 2014 2015 2016 2017 2018 2019 2020 2021
“The airline industry adapted to a most unusual year by simplifying ticketing processes, waiving change fees and baggage fees which were key to persuading people to fly during the pandemic. Airline personnel rose to meet the challenges of a drastically altered travel environment. Maintaining that level of flexibility and recognition of individual passenger needs will be a strategic advantage for airlines that want to set themselves apart in passenger satisfaction as travel volumes start to recover.” (Michael Taylor, J.D. Power, May 12, 2021)
Aircraft Baggage Boarding Check-in Cost and fees Flight crew ReservationIn-flight services

7
Per Wells Fargo, the Global Economy Will Grow 4.3% in 2022The U.S. Economy Is Projected to Grow 4%
4.3 4.0
4.3 5.1
2.5 4.1
3.6 5.5
8.1 3.0
2.3
WorldUSA
EurozoneUK
JapanCanada
AustraliaChinaIndia
MexicoBrazil
Source: Wells Fargo Securities (Oct. 14, 2021)
“While we remain concerned about COVID’s impact on consumer spending, most individuals seem to be going about their daily routines, albeit perhaps not with the same vigor as they did earlier in the summer when the pandemic appeared to be winding down. In short, significant retrenchment in consumer spending does not appear likely unless the new case count shoots markedly higher…” (Wells Fargo, Oct. 14, 2021)
Projected 2022 Real GDP Growth (%)
$18.7$19.1
$18.4
$19.5
$20.2
2018 2019 2020 2021F 2022F
U.S. Real GDP (Trillions, $2012)
8
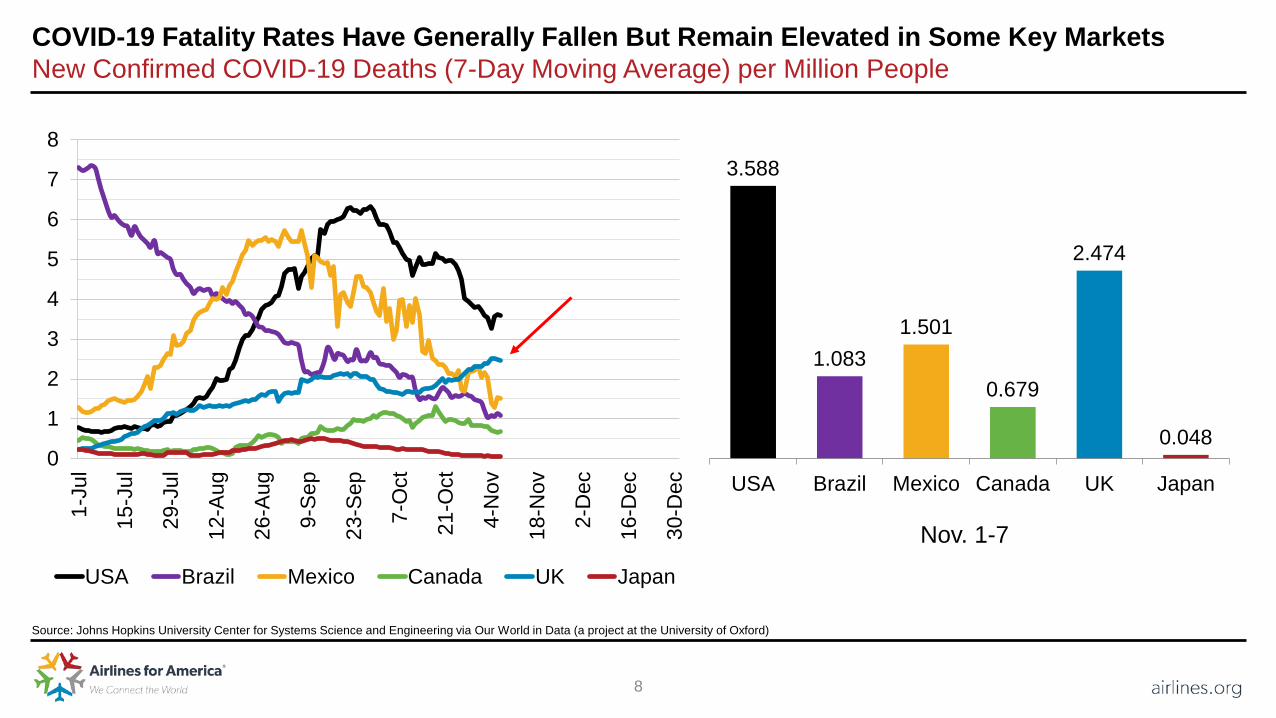
COVID-19 Fatality Rates Have Generally Fallen But Remain Elevated in Some Key MarketsNew Confirmed COVID-19 Deaths (7-Day Moving Average) per Million People
Source: Johns Hopkins University Center for Systems Science and Engineering via Our World in Data (a project at the University of Oxford)
0
1
2
3
4
5
6
7
8
1-Ju
l
15-J
ul
29-J
ul
12-A
ug
26-A
ug
9-Se
p
23-S
ep
7-O
ct
21-O
ct
4-N
ov
18-N
ov
2-D
ec
16-D
ec
30-D
ec
USA Brazil Mexico Canada UK Japan
3.588
1.0831.501
0.679
2.474
0.048
USA Brazil Mexico Canada UK Japan
Nov. 1-7

9
In Several Nations, at Least 70% of the Population Has Received at Least One Dose of a VaccineAruba/Belgium/Canada/China/Ireland/Italy/Japan/S. Korea/Spain Are 70%+ Fully Vaccinated
58 4976 69
5074 67
15
72 69 7755
79
3358
4469 68
25
73 6376 65 76 75
60
910
46
13
43
6
6 86
19
2
4
1818
7 7
29
56
12
5 13
6759
80 7563
7870
21
78 77 8374
81
37
7662
76 75
54
7869
7767
81 7663
0102030405060708090
100
Fully Partially
Source: Our World in Data (a project at the University of Oxford using governmental sources) via The New York Times and DOT Data Bank 1B * Partially = received at least one dose of a vaccine as of Nov. 9, 2021
% of Entire Population Vaccinated* in Selected U.S.-International O&D MarketsSorted left to right by U.S.-carrier O&D passenger volume in 2019
10
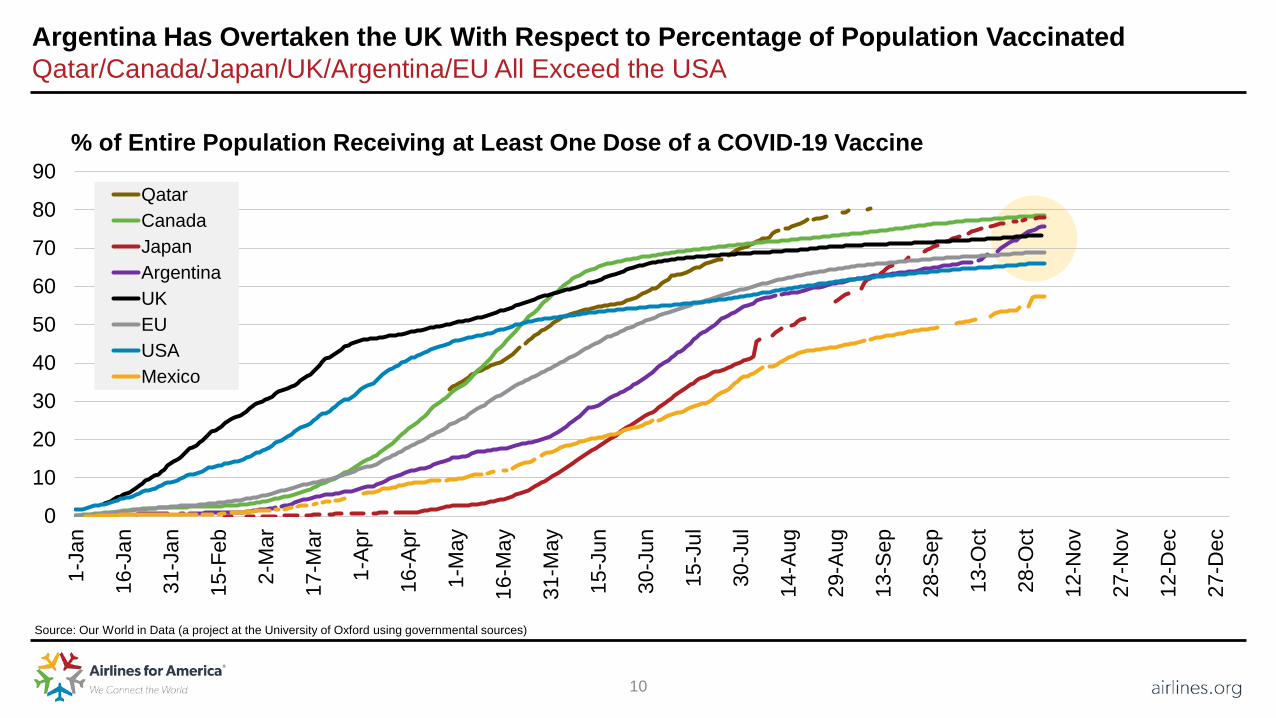
Argentina Has Overtaken the UK With Respect to Percentage of Population VaccinatedQatar/Canada/Japan/UK/Argentina/EU All Exceed the USA
0
10
20
30
40
50
60
70
80
90
1-Ja
n
16-J
an
31-J
an
15-F
eb
2-M
ar
17-M
ar
1-Ap
r
16-A
pr
1-M
ay
16-M
ay
31-M
ay
15-J
un
30-J
un
15-J
ul
30-J
ul
14-A
ug
29-A
ug
13-S
ep
28-S
ep
13-O
ct
28-O
ct
12-N
ov
27-N
ov
12-D
ec
27-D
ec
QatarCanadaJapanArgentinaUKEUUSAMexico
% of Entire Population Receiving at Least One Dose of a COVID-19 Vaccine
Source: Our World in Data (a project at the University of Oxford using governmental sources)

11
In Most Recent Week, U.S. Airline Passenger Volumes Were 18% Below Pre-Pandemic LevelsDomestic Air Travel Down 16%, International Air Travel Down 35%
(100)
(80)
(60)
(40)
(20)
0
20
40
7-Ja
n-20
28-J
an-2
0
18-F
eb-2
0
10-M
ar-2
0
31-M
ar-2
0
21-A
pr-2
0
12-M
ay-2
0
2-Ju
n-20
23-J
un-2
0
14-J
ul-2
0
4-Au
g-20
25-A
ug-2
0
15-S
ep-2
0
6-O
ct-2
0
27-O
ct-2
0
17-N
ov-2
0
8-D
ec-2
0
29-D
ec-2
0
19-J
an-2
1
9-Fe
b-21
2-M
ar-2
1
23-M
ar-2
1
13-A
pr-2
1
4-M
ay-2
1
25-M
ay-2
1
15-J
un-2
1
6-Ju
l-21
27-J
ul-2
1
17-A
ug-2
1
7-Se
p-21
28-S
ep-2
1
19-O
ct-2
1
9-N
ov-2
1
30-N
ov-2
1
21-D
ec-2
1
Domestic USA Canada Mexico Atlantic Latin (excl. Mexico) Pacific
7-Day Rolling Change (%) vs. Pre-Pandemic in Onboard Passengers*
* Onboard (“segment”) passengers; “pre-pandemic” precedes March 1, 2020Source: A4A member passenger airlines and branded code share partners
12
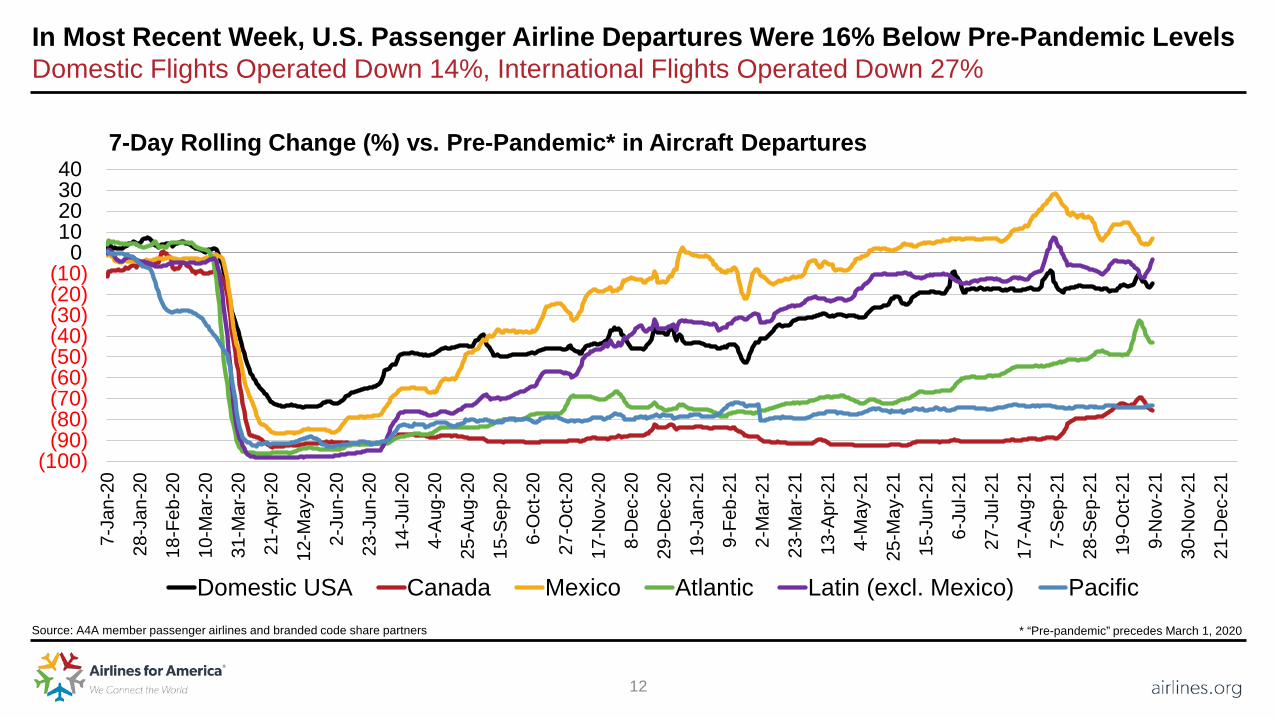
In Most Recent Week, U.S. Passenger Airline Departures Were 16% Below Pre-Pandemic LevelsDomestic Flights Operated Down 14%, International Flights Operated Down 27%
Source: A4A member passenger airlines and branded code share partners
(100)(90)(80)(70)(60)(50)(40)(30)(20)(10)
010203040
7-Ja
n-20
28-J
an-2
0
18-F
eb-2
0
10-M
ar-2
0
31-M
ar-2
0
21-A
pr-2
0
12-M
ay-2
0
2-Ju
n-20
23-J
un-2
0
14-J
ul-2
0
4-Au
g-20
25-A
ug-2
0
15-S
ep-2
0
6-O
ct-2
0
27-O
ct-2
0
17-N
ov-2
0
8-D
ec-2
0
29-D
ec-2
0
19-J
an-2
1
9-Fe
b-21
2-M
ar-2
1
23-M
ar-2
1
13-A
pr-2
1
4-M
ay-2
1
25-M
ay-2
1
15-J
un-2
1
6-Ju
l-21
27-J
ul-2
1
17-A
ug-2
1
7-Se
p-21
28-S
ep-2
1
19-O
ct-2
1
9-N
ov-2
1
30-N
ov-2
1
21-D
ec-2
1
Domestic USA Canada Mexico Atlantic Latin (excl. Mexico) Pacific
7-Day Rolling Change (%) vs. Pre-Pandemic* in Aircraft Departures
* “Pre-pandemic” precedes March 1, 2020
13
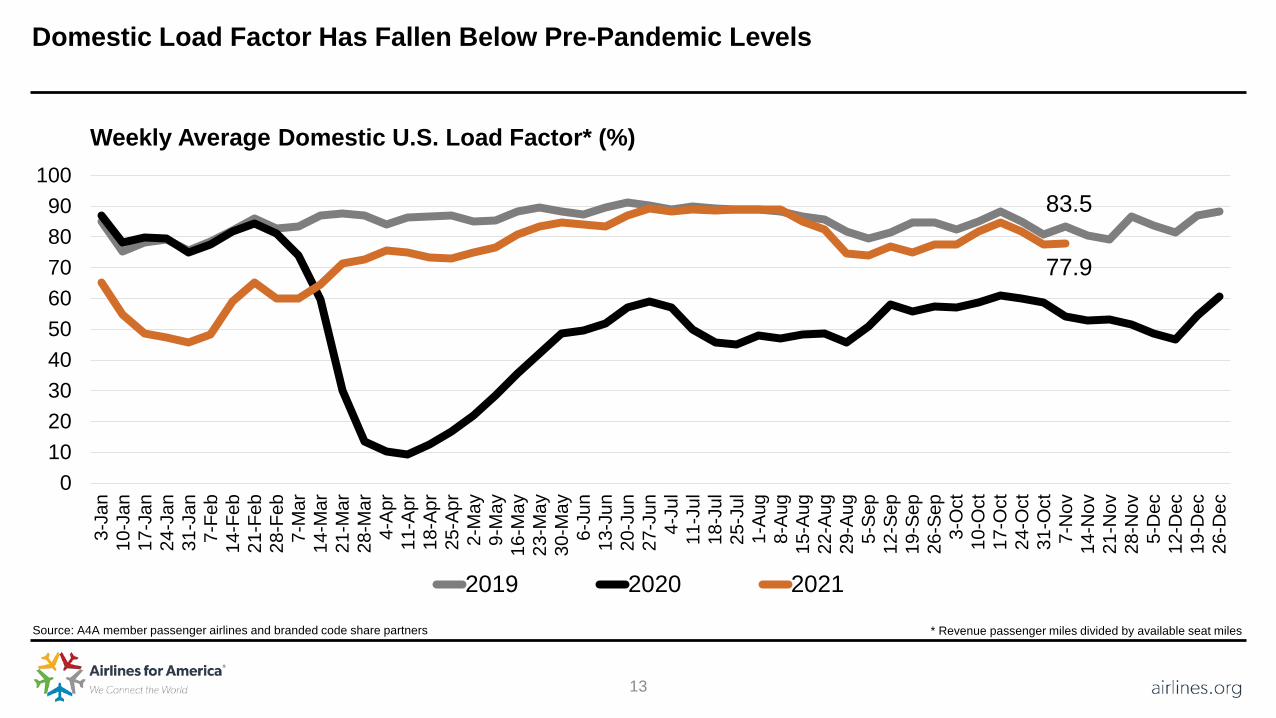
Domestic Load Factor Has Fallen Below Pre-Pandemic Levels
77.9
83.5
0102030405060708090
100
3-Ja
n10
-Jan
17-J
an24
-Jan
31-J
an7-
Feb
14-F
eb21
-Feb
28-F
eb7-
Mar
14-M
ar21
-Mar
28-M
ar4-
Apr
11-A
pr18
-Apr
25-A
pr2-
May
9-M
ay16
-May
23-M
ay30
-May
6-Ju
n13
-Jun
20-J
un27
-Jun
4-Ju
l11
-Jul
18-J
ul25
-Jul
1-Au
g8-
Aug
15-A
ug22
-Aug
29-A
ug5-
Sep
12-S
ep19
-Sep
26-S
ep3-
Oct
10-O
ct17
-Oct
24-O
ct31
-Oct
7-N
ov14
-Nov
21-N
ov28
-Nov
5-D
ec12
-Dec
19-D
ec26
-Dec
2019 2020 2021
Weekly Average Domestic U.S. Load Factor* (%)
Source: A4A member passenger airlines and branded code share partners * Revenue passenger miles divided by available seat miles

14
Average U.S.-Canada Onboard Volumes Notably Improved
Source: A4A member passenger airlines and branded code share partners * Onboard (“segment”) passengers
7-Day Moving Average Onboard Passengers* per Flight
0255075
100125150175200225250
7-Ja
n-19
4-Fe
b-19
4-M
ar-1
91-
Apr-1
929
-Apr
-19
27-M
ay-1
924
-Jun
-19
22-J
ul-1
919
-Aug
-19
16-S
ep-1
914
-Oct
-19
11-N
ov-1
99-
Dec
-19
6-Ja
n-20
3-Fe
b-20
2-M
ar-2
030
-Mar
-20
27-A
pr-2
025
-May
-20
22-J
un-2
020
-Jul
-20
17-A
ug-2
014
-Sep
-20
12-O
ct-2
09-
Nov
-20
7-D
ec-2
04-
Jan-
211-
Feb-
211-
Mar
-21
29-M
ar-2
126
-Apr
-21
24-M
ay-2
121
-Jun
-21
19-J
ul-2
116
-Aug
-21
13-S
ep-2
111
-Oct
-21
8-N
ov-2
16-
Dec
-21
3-Ja
n-22
31-J
an-2
228
-Feb
-22
28-M
ar-2
2
Domestic USA Canada Mexico Atlantic Latin (excl. Mexico) Pacific
15
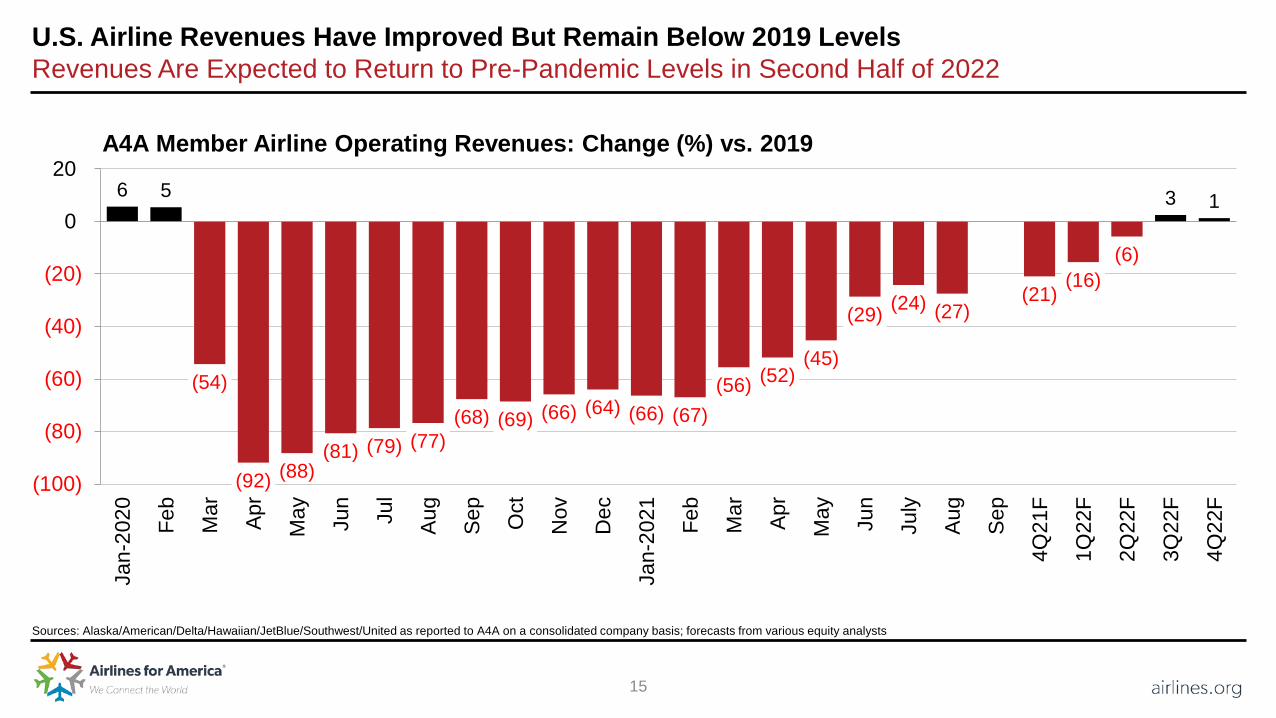
U.S. Airline Revenues Have Improved But Remain Below 2019 LevelsRevenues Are Expected to Return to Pre-Pandemic Levels in Second Half of 2022
Sources: Alaska/American/Delta/Hawaiian/JetBlue/Southwest/United as reported to A4A on a consolidated company basis; forecasts from various equity analysts
A4A Member Airline Operating Revenues: Change (%) vs. 2019
6 5
(54)
(92) (88)(81) (79) (77)
(68) (69) (66) (64) (66) (67)(56) (52)
(45)
(29) (24) (27)(21)
(16)(6)
3 1
(100)
(80)
(60)
(40)
(20)
0
20
Jan-
2020 Fe
b
Mar Ap
r
May Jun
Jul
Aug
Sep
Oct
Nov
Dec
Jan-
2021 Fe
b
Mar Ap
r
May Jun
July
Aug
Sep
4Q21
F
1Q22
F
2Q22
F
3Q22
F
4Q22
F
16
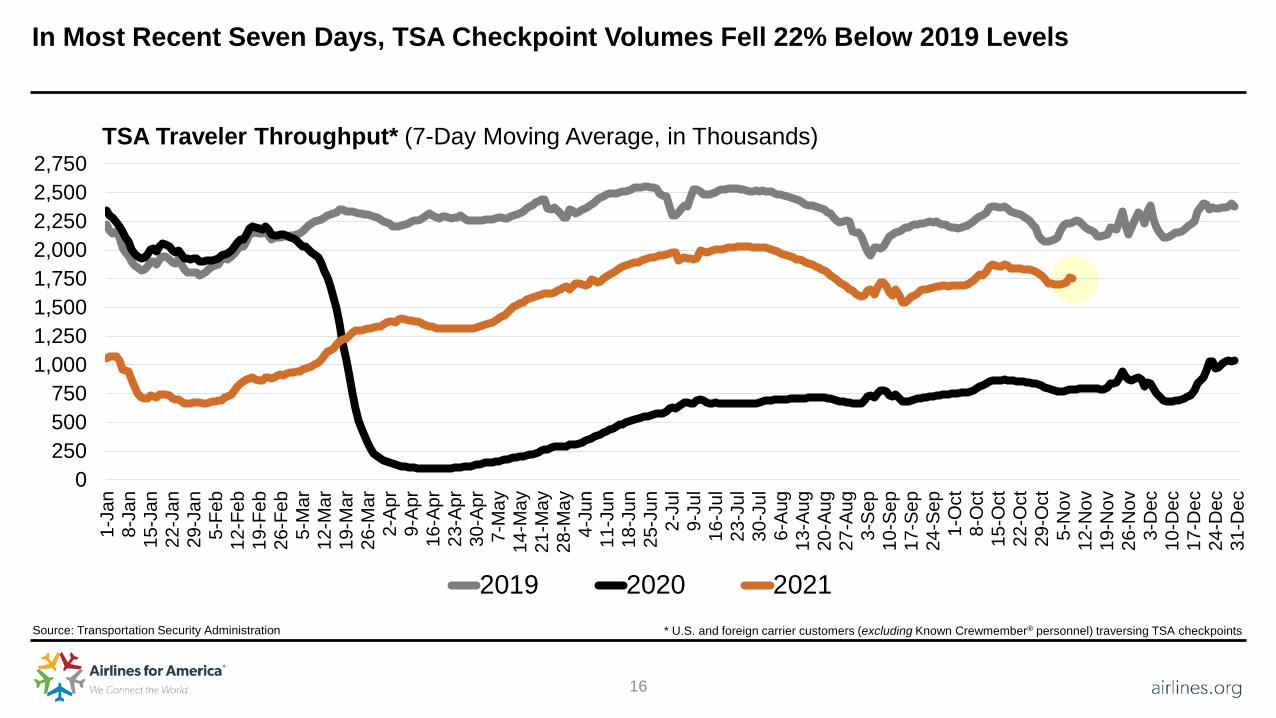
In Most Recent Seven Days, TSA Checkpoint Volumes Fell 22% Below 2019 Levels
Source: Transportation Security Administration
0250500750
1,0001,2501,5001,7502,0002,2502,5002,750
1-Ja
n8-
Jan
15-J
an22
-Jan
29-J
an5-
Feb
12-F
eb19
-Feb
26-F
eb5-
Mar
12-M
ar19
-Mar
26-M
ar2-
Apr
9-Ap
r16
-Apr
23-A
pr30
-Apr
7-M
ay14
-May
21-M
ay28
-May
4-Ju
n11
-Jun
18-J
un25
-Jun
2-Ju
l9-
Jul
16-J
ul23
-Jul
30-J
ul6-
Aug
13-A
ug20
-Aug
27-A
ug3-
Sep
10-S
ep17
-Sep
24-S
ep1-
Oct
8-O
ct15
-Oct
22-O
ct29
-Oct
5-N
ov12
-Nov
19-N
ov26
-Nov
3-D
ec10
-Dec
17-D
ec24
-Dec
31-D
ec
2019 2020 2021* U.S. and foreign carrier customers (excluding Known Crewmember® personnel) traversing TSA checkpoints
TSA Traveler Throughput* (7-Day Moving Average, in Thousands)
17
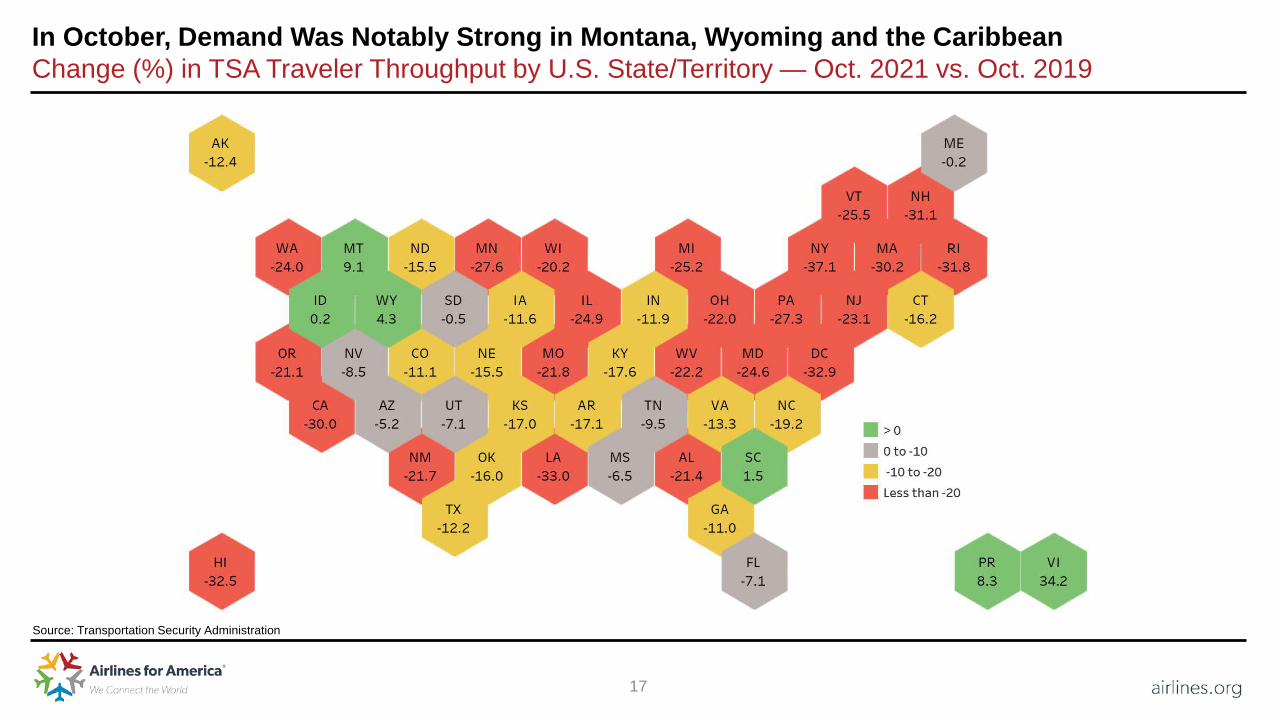
In October, Demand Was Notably Strong in Montana, Wyoming and the CaribbeanChange (%) in TSA Traveler Throughput by U.S. State/Territory — Oct. 2021 vs. Oct. 2019
Source: Transportation Security Administration
18
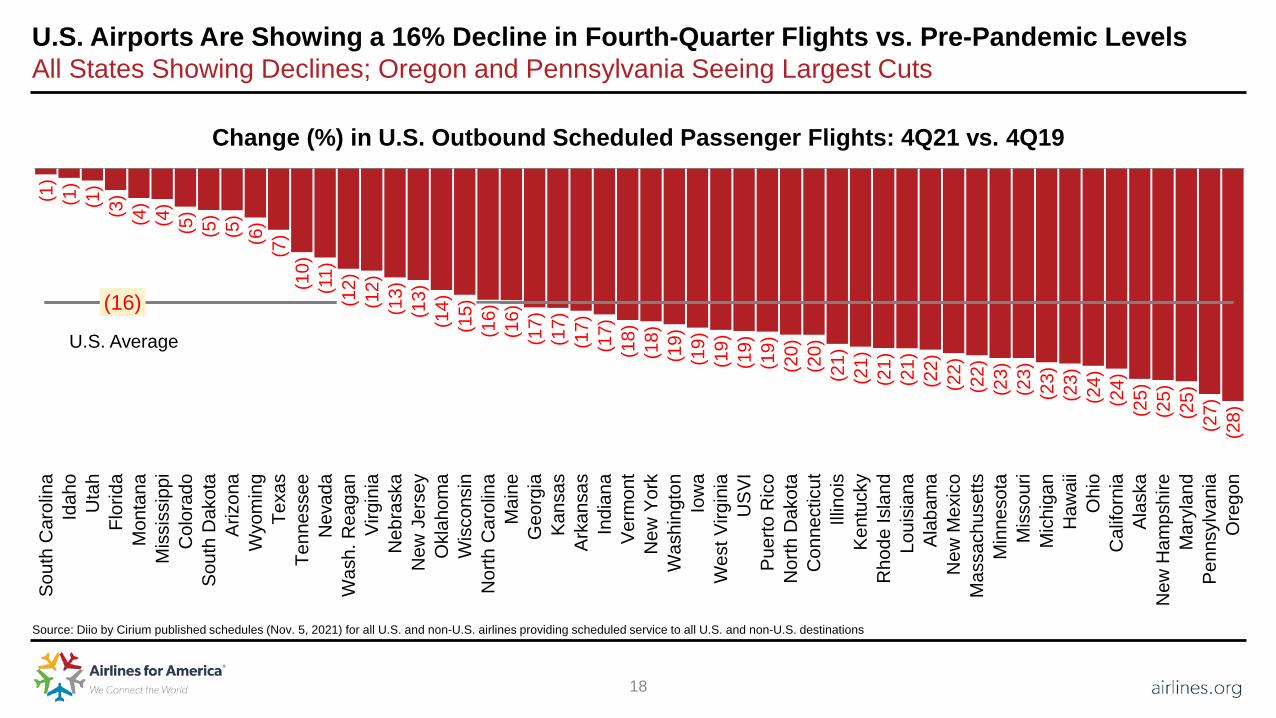
U.S. Airports Are Showing a 16% Decline in Fourth-Quarter Flights vs. Pre-Pandemic LevelsAll States Showing Declines; Oregon and Pennsylvania Seeing Largest Cuts
Source: Diio by Cirium published schedules (Nov. 5, 2021) for all U.S. and non-U.S. airlines providing scheduled service to all U.S. and non-U.S. destinations
(1)
(1)
(1)
(3)
(4)
(4)
(5)
(5)
(5)
(6)
(7)
(10)
(11)
(12)
(12)
(13)
(13)
(14)
(15)
(16)
(16)
(17)
(17)
(17)
(17)
(18)
(18)
(19)
(19)
(19)
(19)
(19)
(20)
(20)
(21)
(21)
(21)
(21)
(22)
(22)
(22)
(23)
(23)
(23)
(23)
(24)
(24)
(25)
(25)
(25)
(27)
(28)
(16)
Sout
h C
arol
ina
Idah
oU
tah
Flor
ida
Mon
tana
Mis
siss
ippi
Col
orad
oSo
uth
Dak
ota
Ariz
ona
Wyo
min
gTe
xas
Tenn
esse
eN
evad
aW
ash.
Rea
gan
Virg
inia
Neb
rask
aN
ew J
erse
yO
klah
oma
Wis
cons
inN
orth
Car
olin
aM
aine
Geo
rgia
Kans
asAr
kans
asIn
dian
aVe
rmon
tN
ew Y
ork
Was
hing
ton
Iow
aW
est V
irgin
iaU
SVI
Puer
to R
ico
Nor
th D
akot
aC
onne
ctic
utIll
inoi
sKe
ntuc
kyR
hode
Isla
ndLo
uisi
ana
Alab
ama
New
Mex
ico
Mas
sach
uset
tsM
inne
sota
Mis
sour
iM
ichi
gan
Haw
aii
Ohi
oC
alifo
rnia
Alas
kaN
ew H
amps
hire
Mar
ylan
dPe
nnsy
lvan
iaO
rego
n
U.S. Average
Change (%) in U.S. Outbound Scheduled Passenger Flights: 4Q21 vs. 4Q19

19
Only Three U.S. Airlines Are Deploying More Capacity in 4Q 2021 Than in 4Q 2019Allegiant and Spirit Growing the Fastest; United and Delta Are Down the Most
Source: Diio by Cirium published schedules (Nov. 5, 2021)
18.4 12.1
3.5
(4.2) (7.7) (12.1) (13.2)(19.8) (20.5) (22.4)
Change (%) in Systemwide Scheduled Available Seat Miles: 4Q21 vs. 4Q19
20
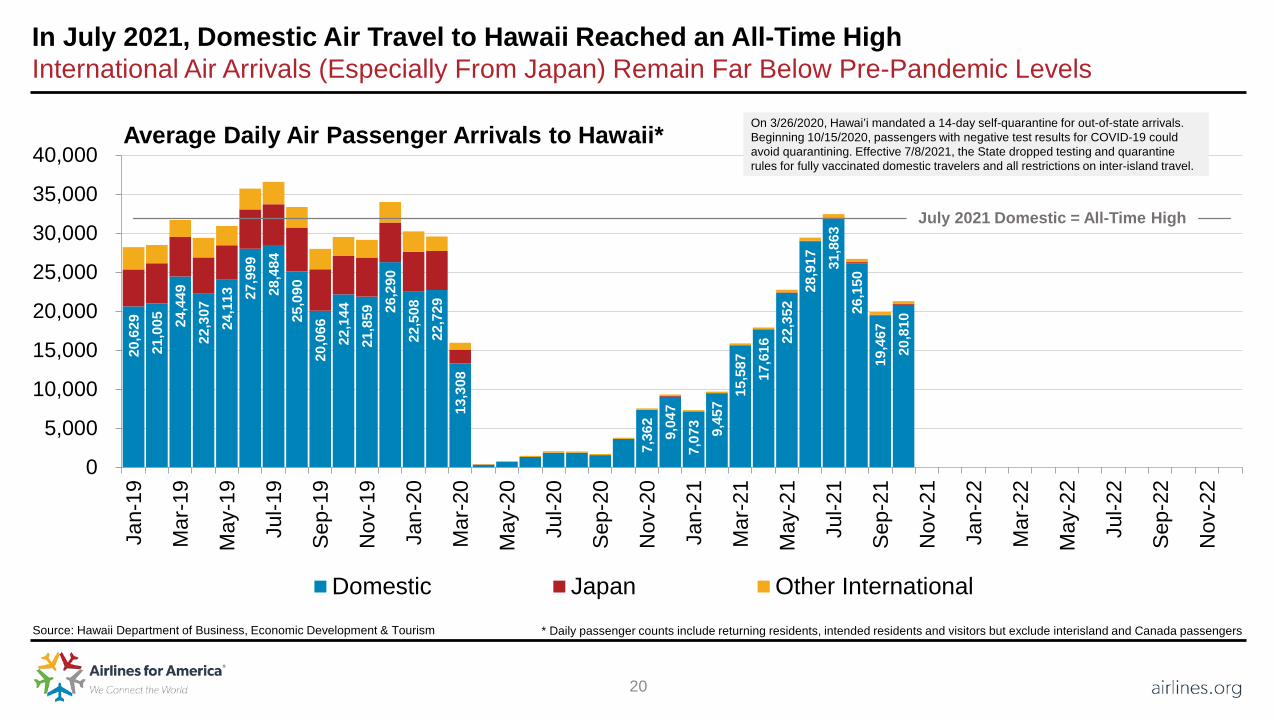
In July 2021, Domestic Air Travel to Hawaii Reached an All-Time HighInternational Air Arrivals (Especially From Japan) Remain Far Below Pre-Pandemic Levels
Source: Hawaii Department of Business, Economic Development & Tourism * Daily passenger counts include returning residents, intended residents and visitors but exclude interisland and Canada passengers
Average Daily Air Passenger Arrivals to Hawaii*20
,629
21
,005
24
,449
22
,307
24
,113
27
,999
28
,484
25
,090
20
,066
22
,144
21
,859
26,2
90
22,5
08
22,7
29
13,3
08
7,36
2 9,
047
7,07
3 9,45
7 15
,587
17
,616
22,3
52 28
,917
31
,863
26
,150
19
,467
20
,810
0
5,000
10,000
15,000
20,000
25,000
30,000
35,000
40,000Ja
n-19
Mar
-19
May
-19
Jul-1
9
Sep-
19
Nov
-19
Jan-
20
Mar
-20
May
-20
Jul-2
0
Sep-
20
Nov
-20
Jan-
21
Mar
-21
May
-21
Jul-2
1
Sep-
21
Nov
-21
Jan-
22
Mar
-22
May
-22
Jul-2
2
Sep-
22
Nov
-22
Domestic Japan Other International
On 3/26/2020, Hawai’i mandated a 14-day self-quarantine for out-of-state arrivals. Beginning 10/15/2020, passengers with negative test results for COVID-19 could avoid quarantining. Effective 7/8/2021, the State dropped testing and quarantine rules for fully vaccinated domestic travelers and all restrictions on inter-island travel.
July 2021 Domestic = All-Time High

21
In October 2021, U.S.-International Air Travel* Fell 52% Below 2019 LevelsNon-U.S. Citizen Arrivals Trailed U.S. Citizen Departures by ~23 Percentage Points
(52.4)
(39.6)
(62.8)
(100)
(80)
(60)
(40)
(20)
0
20
Jan-
20
Mar
-20
May
-20
Jul-2
0
Sep-
20
Nov
-20
Jan-
21
Mar
-21
May
-21
Jul-2
1
Sep-
21
Nov
-21
Jan-
22
Mar
-22
May
-22
Jul-2
2
Sep-
22
Nov
-22
Non-U.S. Citizen Arrivals U.S. Citizen Departures Total
Change (%) vs. 2019 in Total* U.S.-International Air Passengers
Source: U.S. Department of Commerce National Travel and Tourism Office using DHS I-92 / APIS data * Gateway-to-gateway passengers on U.S. and foreign scheduled and charter airlines and general aviation
22
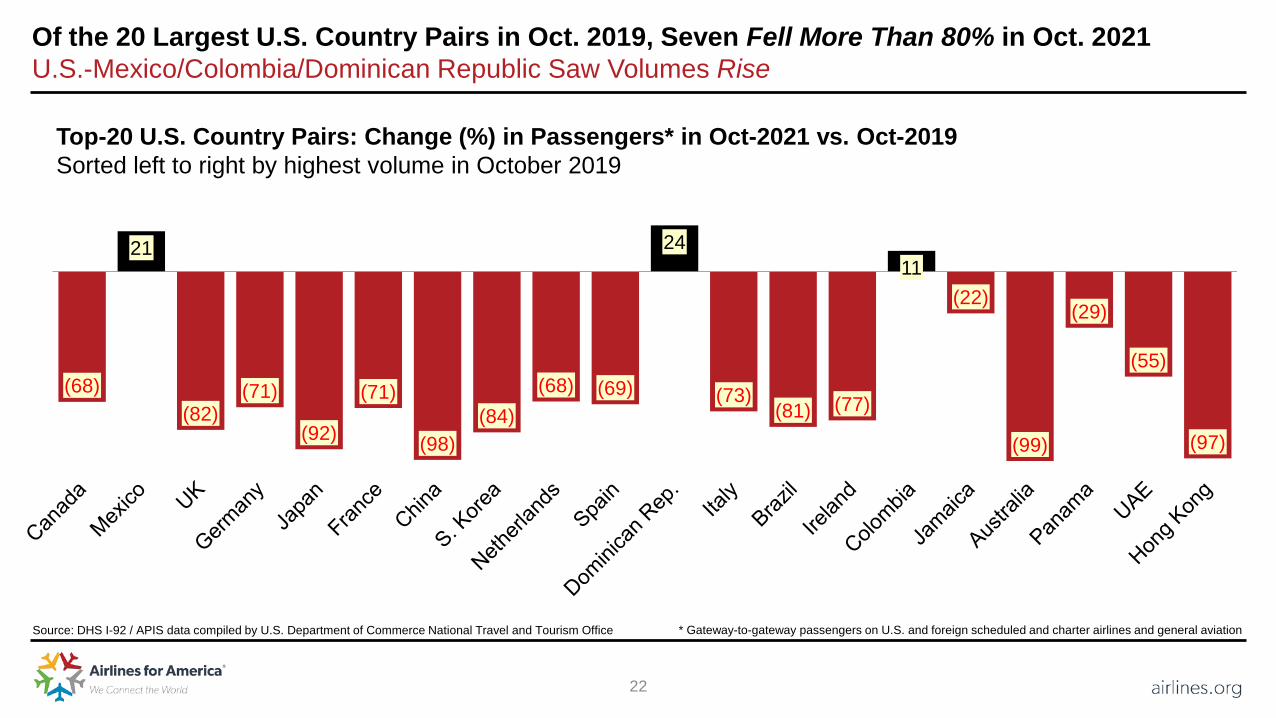
Of the 20 Largest U.S. Country Pairs in Oct. 2019, Seven Fell More Than 80% in Oct. 2021U.S.-Mexico/Colombia/Dominican Republic Saw Volumes Rise
Top-20 U.S. Country Pairs: Change (%) in Passengers* in Oct-2021 vs. Oct-2019Sorted left to right by highest volume in October 2019
(68)
21
(82)(71)
(92)
(71)
(98)(84)
(68) (69)
24
(73)(81) (77)
11 (22)
(99)
(29)
(55)
(97)
* Gateway-to-gateway passengers on U.S. and foreign scheduled and charter airlines and general aviationSource: DHS I-92 / APIS data compiled by U.S. Department of Commerce National Travel and Tourism Office
23
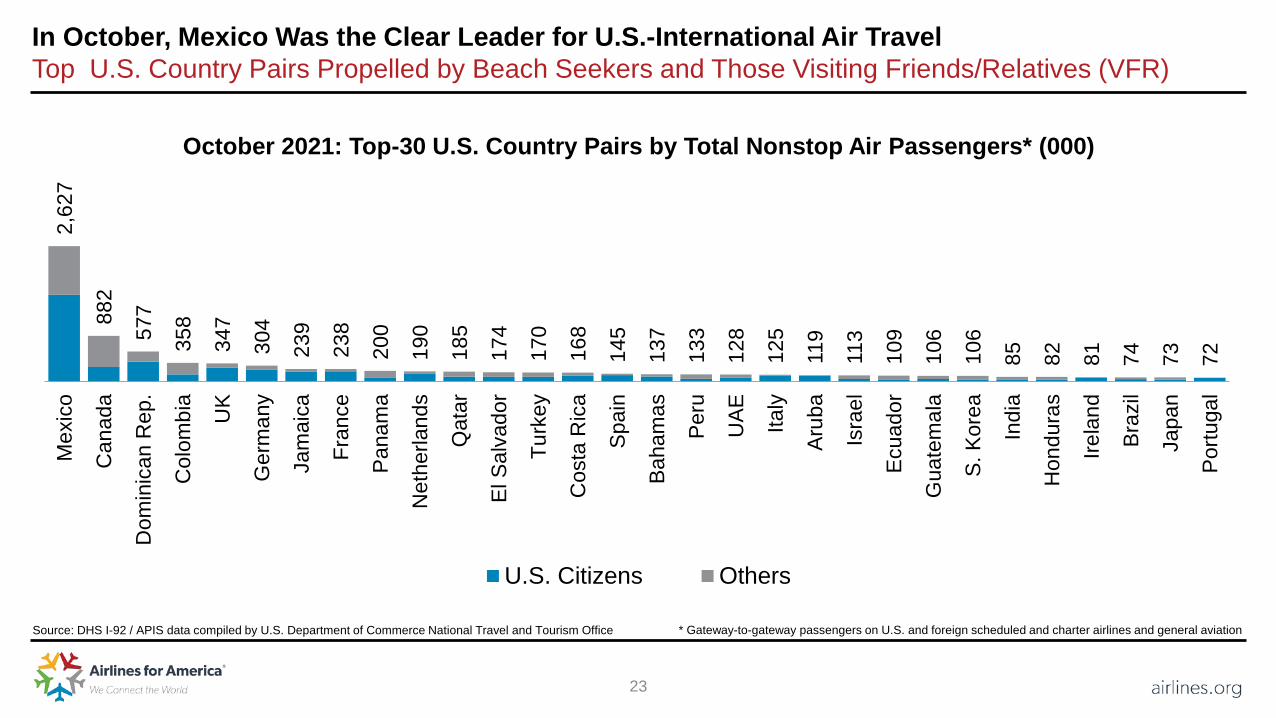
In October, Mexico Was the Clear Leader for U.S.-International Air TravelTop U.S. Country Pairs Propelled by Beach Seekers and Those Visiting Friends/Relatives (VFR)
October 2021: Top-30 U.S. Country Pairs by Total Nonstop Air Passengers* (000)
2,62
7
882
577
358
347
304
239
238
200
190
185
174
170
168
145
137
133
128
125
119
113
109
106
106
85
82
81
74
73
72
Mex
ico
Can
ada
Dom
inic
an R
ep.
Col
ombi
a
UK
Ger
man
y
Jam
aica
Fran
ce
Pana
ma
Net
herla
nds
Qat
ar
El S
alva
dor
Turk
ey
Cos
ta R
ica
Spai
n
Baha
mas
Peru
UAE Ita
ly
Arub
a
Isra
el
Ecua
dor
Gua
tem
ala
S. K
orea
Indi
a
Hon
dura
s
Irela
nd
Braz
il
Japa
n
Portu
gal
U.S. Citizens Others
Source: DHS I-92 / APIS data compiled by U.S. Department of Commerce National Travel and Tourism Office * Gateway-to-gateway passengers on U.S. and foreign scheduled and charter airlines and general aviation
24
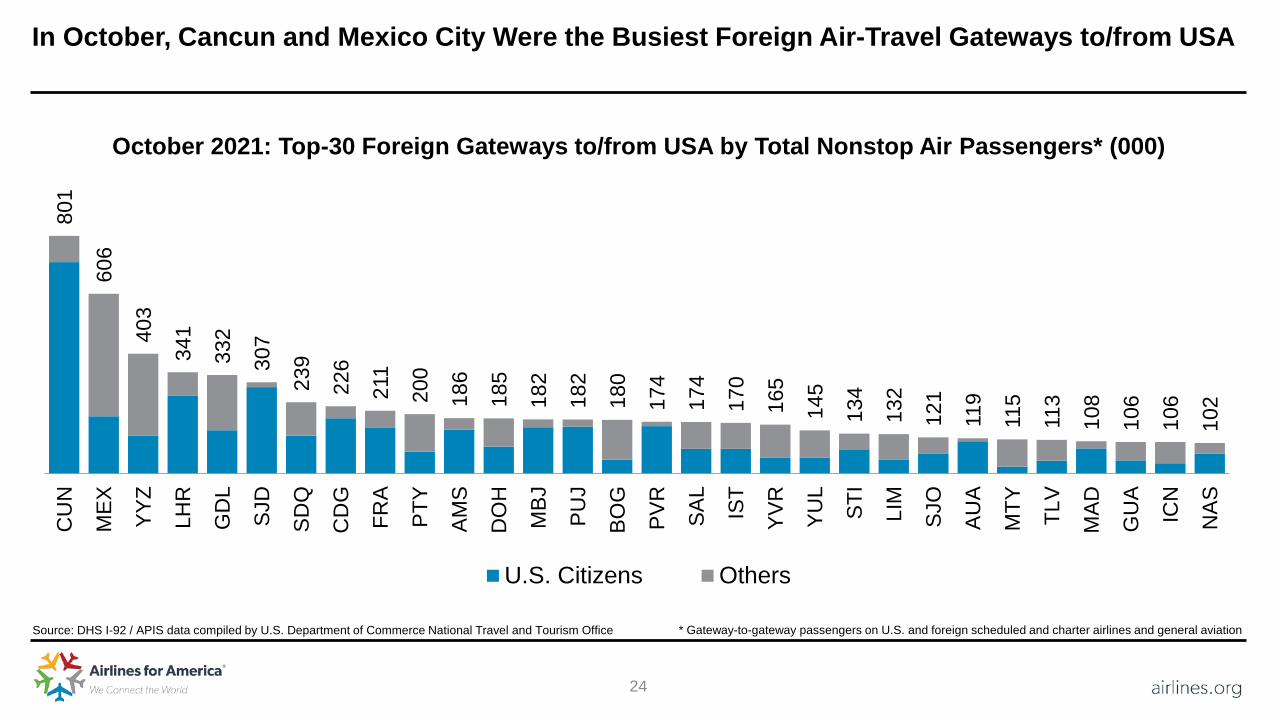
In October, Cancun and Mexico City Were the Busiest Foreign Air-Travel Gateways to/from USA
October 2021: Top-30 Foreign Gateways to/from USA by Total Nonstop Air Passengers* (000)
801
606
403
341
332
307
239
226
211
200
186
185
182
182
180
174
174
170
165
145
134
132
121
119
115
113
108
106
106
102
CU
N
MEX YY
Z
LHR
GD
L
SJD
SDQ
CD
G
FRA
PTY
AMS
DO
H
MBJ
PUJ
BOG
PVR
SAL
IST
YVR
YUL
STI
LIM
SJO
AUA
MTY TL
V
MAD
GU
A
ICN
NAS
U.S. Citizens Others
* Gateway-to-gateway passengers on U.S. and foreign scheduled and charter airlines and general aviationSource: DHS I-92 / APIS data compiled by U.S. Department of Commerce National Travel and Tourism Office
25
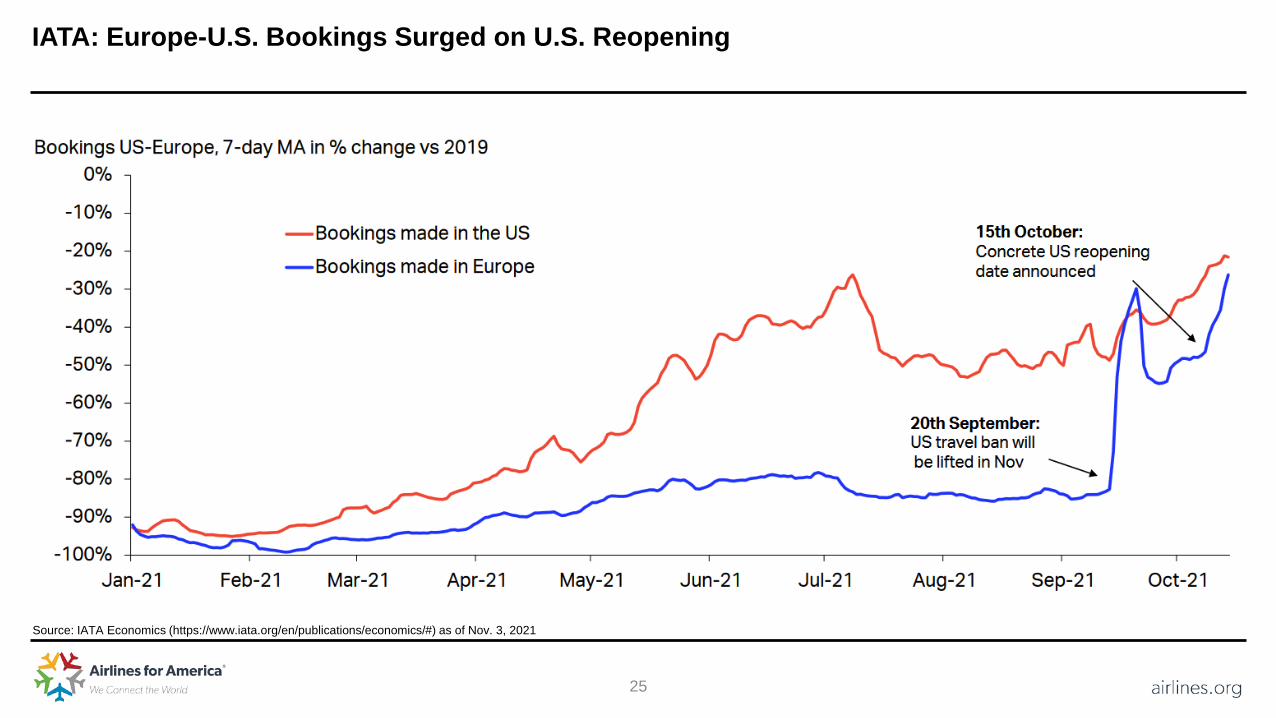
IATA: Europe-U.S. Bookings Surged on U.S. Reopening
Source: IATA Economics (https://www.iata.org/en/publications/economics/#) as of Nov. 3, 2021

26
In Most Recent Week, Average Airfares on Tickets Sold Were 13% Below Pre-Pandemic LevelsFares Down From 2019 Due Primarily to Scarcity of Corporate and Long-Haul International Travel
(13)
(52)
(100)(90)(80)(70)(60)(50)(40)(30)(20)(10)
0
7-Ju
n-20
21-J
un-2
05-
Jul-2
019
-Jul
-20
2-Au
g-20
16-A
ug-2
030
-Aug
-20
13-S
ep-2
027
-Sep
-20
11-O
ct-2
025
-Oct
-20
8-N
ov-2
022
-Nov
-20
6-D
ec-2
020
-Dec
-20
10-J
an-2
124
-Jan
-21
7-Fe
b-21
21-F
eb-2
17-
Mar
-21
21-M
ar-2
14-
Apr-2
118
-Apr
-21
2-M
ay-2
116
-May
-21
30-M
ay-2
113
-Jun
-21
27-J
un-2
111
-Jul
-21
25-J
ul-2
18-
Aug-
2122
-Aug
-21
5-Se
p-21
19-S
ep-2
13-
Oct
-21
17-O
ct-2
131
-Oct
-21
14-N
ov-2
128
-Nov
-21
12-D
ec-2
126
-Dec
-21
Passengers Ticketed (All) Average Fare Passengers Ticketed via Corporate Agency
* Net tickets and fares (gross sales minus refunds) sold in the United States for future travel to/from U.S. airports
Change (%) vs. 2019 in Weekly Ticket Sales*
Source: A4A analysis of data from Airlines Reporting Corporation (ARC)

27
Government Data Shows Average Airfares Remain Lower Than Pre-Pandemic Levels
Source: Bureau of Labor Statistics (CPI series CUSR0000SETG01) and DOT Data Bank 1B (all carriers/cabins/fare basis codes)
$400 $406$418 $421 $423 $419
$387$370
$354 $351$332
$324$340
$356 $364$373 $370
$345$336 $330 $333
$316
$225$200
$250
$300
$350
$400
$450
2010
2011
2012
2013
2014
2015
2016
2017
2018
2019
2020
2021
Real ($2021) FareNominal Fare
Average 2Q Domestic Round-Trip AirfareSecond quarter of each year
278.
873
314.
655
312.
078
316.
426
306.
111
287.
452
275.
578
267.
277
266.
300
271.
396
203.
594
205.
194
0
50
100
150
200
250
300
350
2010
2011
2012
2013
2014
2015
2016
2017
2018
2019
2020
2021
U.S. CPI for Airline Fares (Index: 1982-84 = 100)U.S. city average for Sept. of each year, seasonally adjusted
Down 24% from 2019 and 33% from 2014 Down 36% from 2019 and 47% from 2014
2019
Inde
x: 1
982-
84 =
100
28
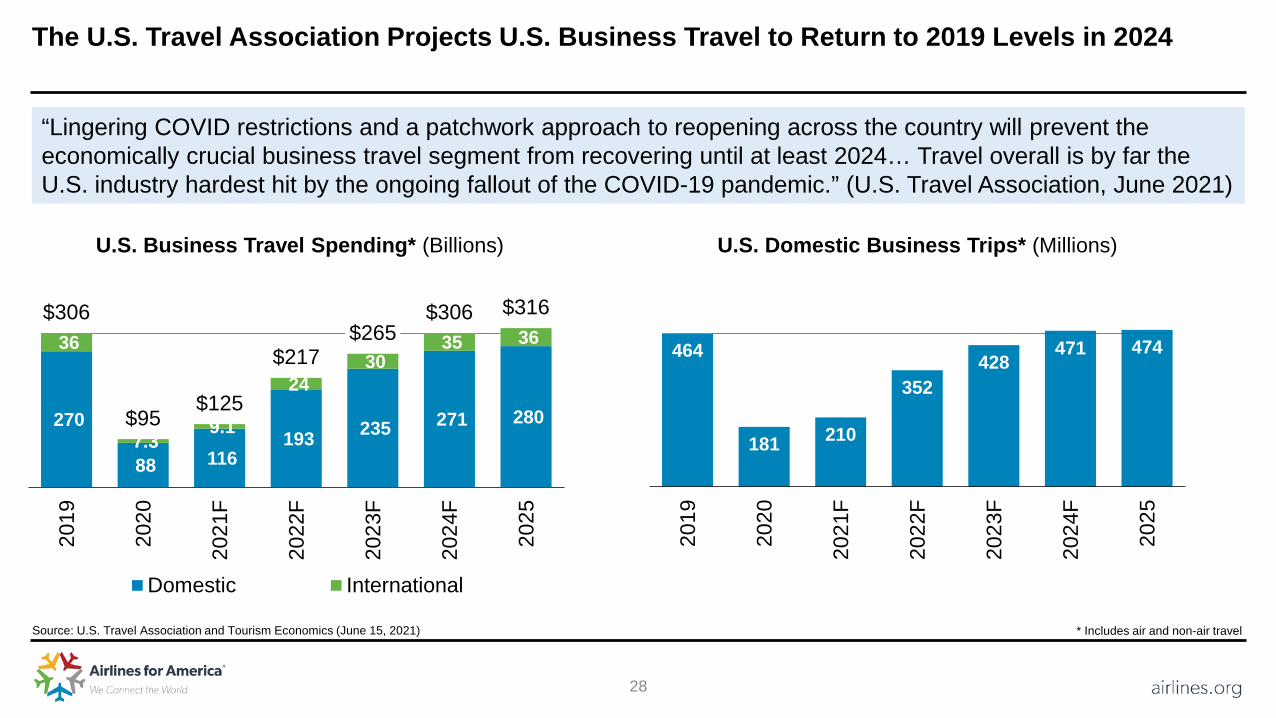
The U.S. Travel Association Projects U.S. Business Travel to Return to 2019 Levels in 2024
Source: U.S. Travel Association and Tourism Economics (June 15, 2021)
270
88 116 193 235 271 280
36
7.3 9.1
24 30
35 36 $306
$95$125
$217$265
$306 $316
2019
2020
2021
F
2022
F
2023
F
2024
F
2025
Domestic International
U.S. Business Travel Spending* (Billions)
“Lingering COVID restrictions and a patchwork approach to reopening across the country will prevent the economically crucial business travel segment from recovering until at least 2024… Travel overall is by far the U.S. industry hardest hit by the ongoing fallout of the COVID-19 pandemic.” (U.S. Travel Association, June 2021)
* Includes air and non-air travel
464
181 210
352428
471 474
2019
2020
2021
F
2022
F
2023
F
2024
F
2025
U.S. Domestic Business Trips* (Millions)
29
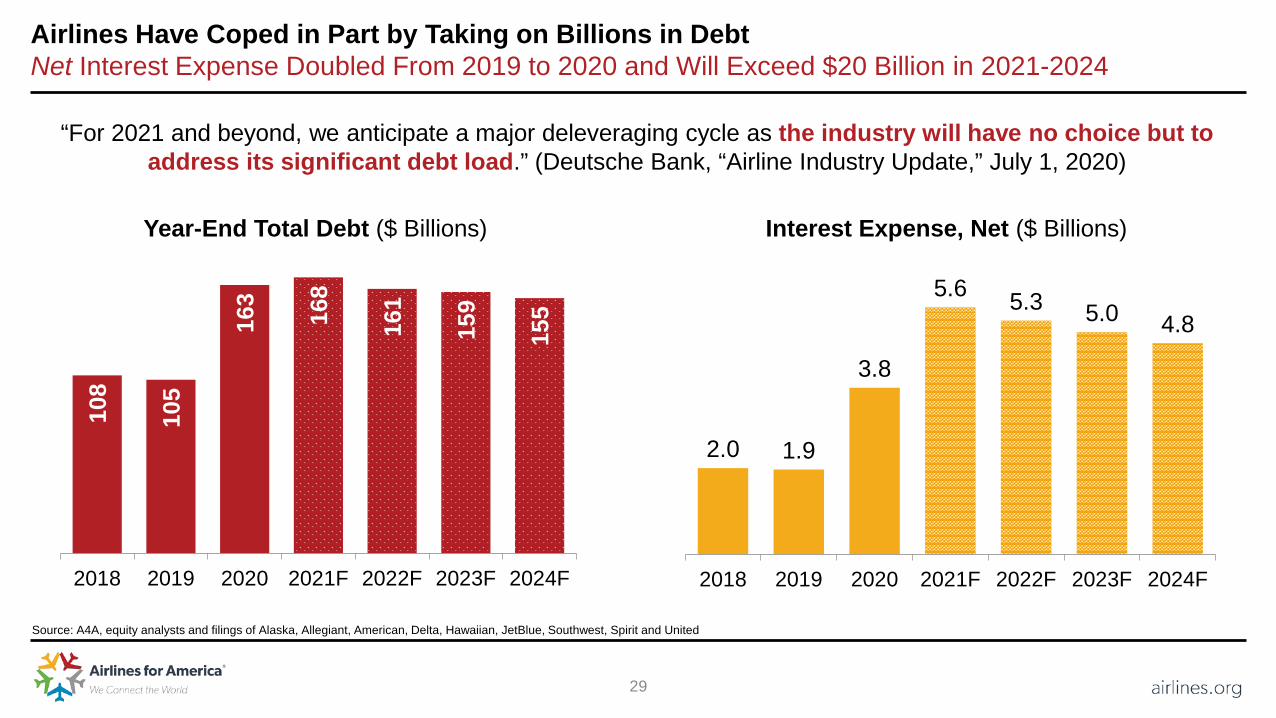
Airlines Have Coped in Part by Taking on Billions in DebtNet Interest Expense Doubled From 2019 to 2020 and Will Exceed $20 Billion in 2021-2024
108
105
163
168
161
159
155
2018 2019 2020 2021F 2022F 2023F 2024F
Year-End Total Debt ($ Billions)
2.0 1.9
3.8
5.6 5.3 5.0 4.8
2018 2019 2020 2021F 2022F 2023F 2024F
Interest Expense, Net ($ Billions)
“For 2021 and beyond, we anticipate a major deleveraging cycle as the industry will have no choice but to address its significant debt load.” (Deutsche Bank, “Airline Industry Update,” July 1, 2020)
Source: A4A, equity analysts and filings of Alaska, Allegiant, American, Delta, Hawaiian, JetBlue, Southwest, Spirit and United
30
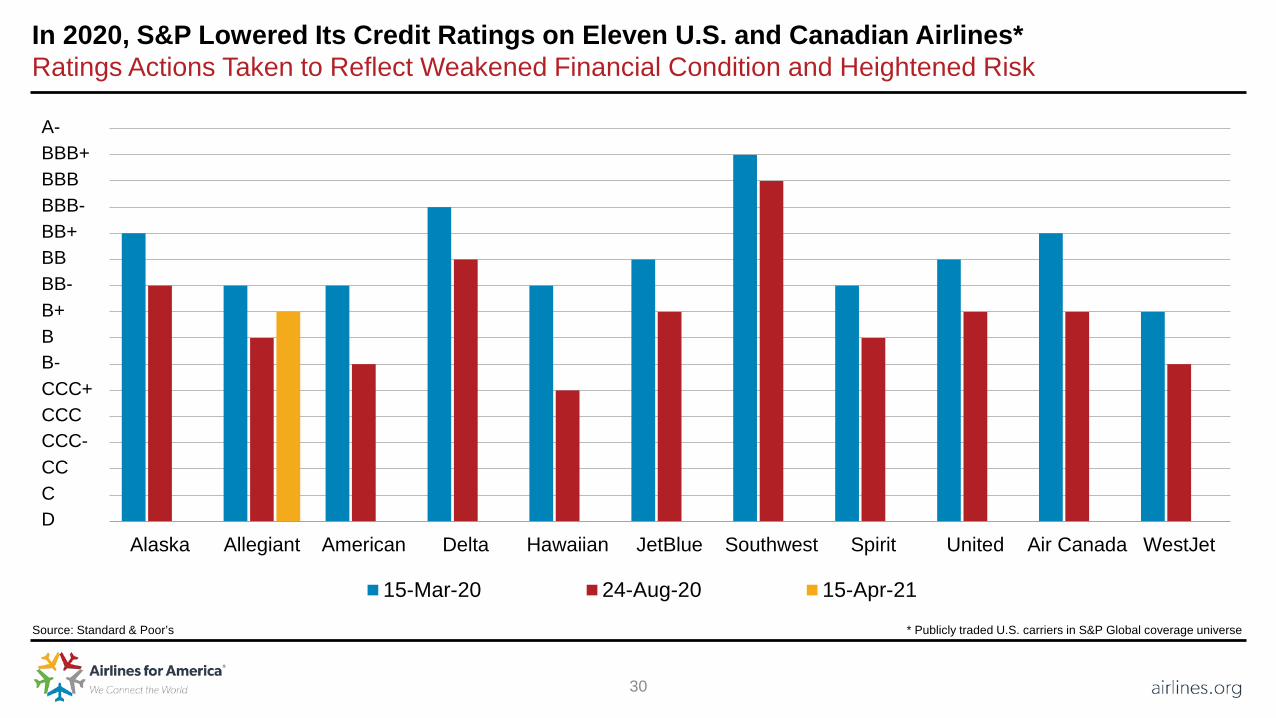
In 2020, S&P Lowered Its Credit Ratings on Eleven U.S. and Canadian Airlines*Ratings Actions Taken to Reflect Weakened Financial Condition and Heightened Risk
Source: Standard & Poor’s
Alaska Allegiant American Delta Hawaiian JetBlue Southwest Spirit United Air Canada WestJet
15-Mar-20 24-Aug-20 15-Apr-21
BBB+BBBBBB-BB+BBBB-B+BB-CCC+CCCCCC-CCCD
* Publicly traded U.S. carriers in S&P Global coverage universe
A-

31
Ridership on U.S. Intercity Rail Remains Far Below Pre-Pandemic LevelsJuly 2021 Ridership Fell 39% Below July 2019
Sources: Bureau of Transportation Statistics
0
500
1,000
1,500
2,000
2,500
3,000
3,500
Jan Feb Mar Apr May Jun Jul Aug Sep Oct Nov Dec
2019 2020 2021
Monthly Ridership (000s) on U.S. Intercity Passenger Rail*
* Passengers transported on Amtrak and Alaska Railroad operations
32
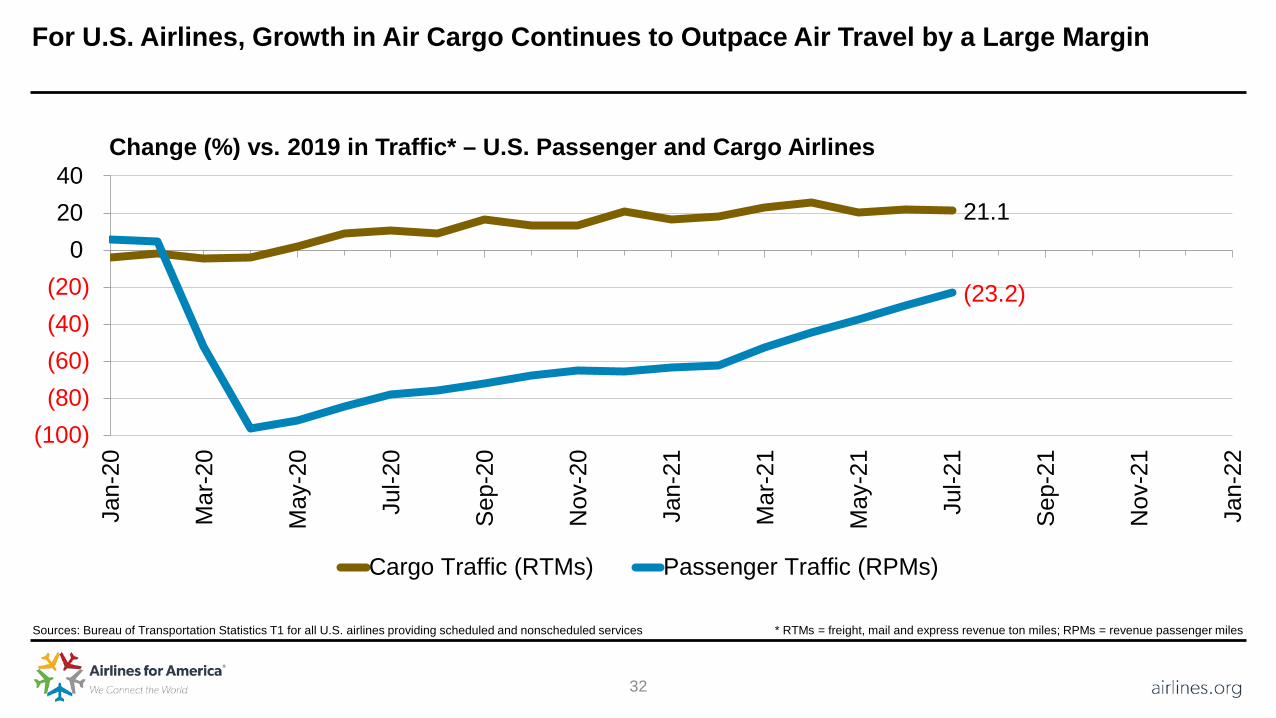
For U.S. Airlines, Growth in Air Cargo Continues to Outpace Air Travel by a Large Margin
Sources: Bureau of Transportation Statistics T1 for all U.S. airlines providing scheduled and nonscheduled services
21.1
(23.2)
(100)(80)(60)(40)(20)
02040
Jan-
20
Mar
-20
May
-20
Jul-2
0
Sep-
20
Nov
-20
Jan-
21
Mar
-21
May
-21
Jul-2
1
Sep-
21
Nov
-21
Jan-
22
Cargo Traffic (RTMs) Passenger Traffic (RPMs)
Change (%) vs. 2019 in Traffic* – U.S. Passenger and Cargo Airlines
* RTMs = freight, mail and express revenue ton miles; RPMs = revenue passenger miles

33
The Pandemic Has Taken a Material Toll on U.S. Airline EmploymentVoluntary Reductions, Retirements, Job Changes, Employer Shutdowns and Other Factors at Play
Source: Bureau of Transportation Statistics based on payroll near the 15th of the month
Carrier Universe Scheduled U.S. Passenger Airlines
All U.S. Passengerand Cargo Airlines
Measure FTEs* (000) Headcount (000)
All-Time High Jun-2001: 545.9 May-2001: 760.8
Post-2000 Low Point Apr-2010: 376.7 Apr-2010: 562.3
Pre-COVID Peak Feb-2020: 458.2 Feb-2020: 753.4
Latest Available Data Point Aug-2021: 408.0 Aug-2021: 719.0
* Full-time equivalents (FTE) = full-time workers plus 0.5 * part-time workers
34
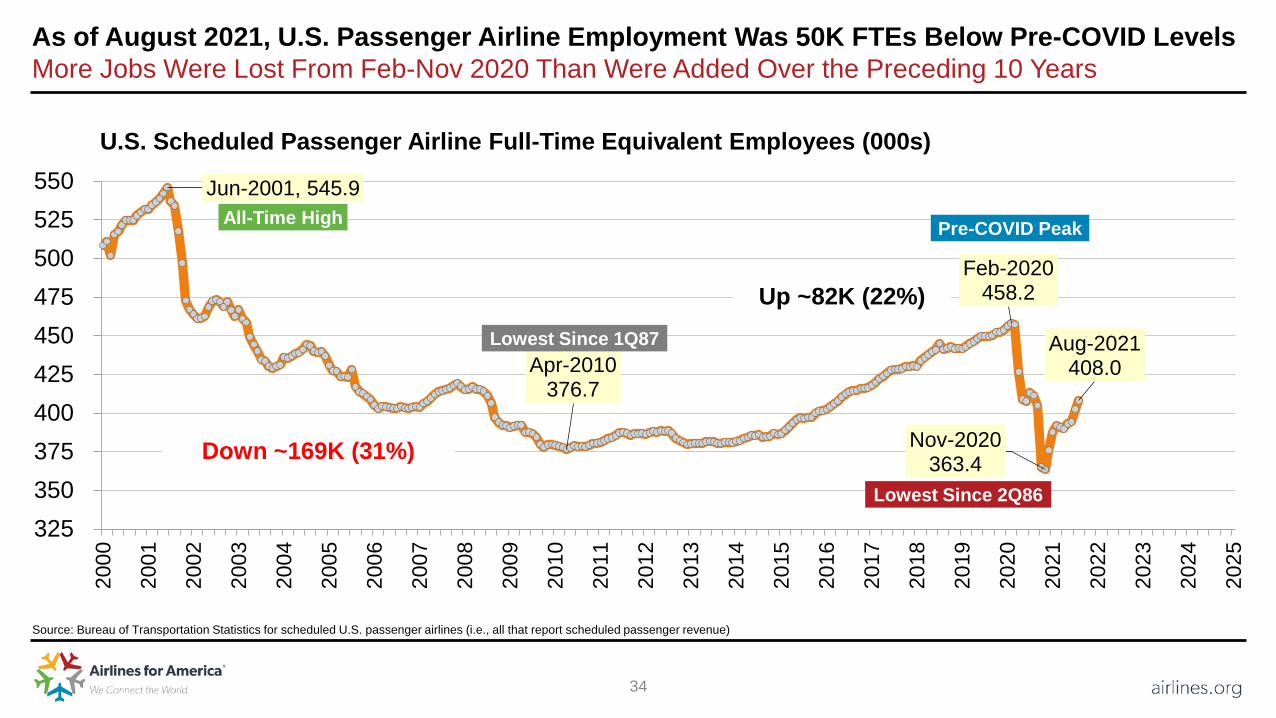
As of August 2021, U.S. Passenger Airline Employment Was 50K FTEs Below Pre-COVID LevelsMore Jobs Were Lost From Feb-Nov 2020 Than Were Added Over the Preceding 10 Years
Source: Bureau of Transportation Statistics for scheduled U.S. passenger airlines (i.e., all that report scheduled passenger revenue)
Jun-2001, 545.9
Apr-2010376.7
Feb-2020458.2
Nov-2020363.4
Aug-2021408.0
325350375400425450475500525550
2000
2001
2002
2003
2004
2005
2006
2007
2008
2009
2010
2011
2012
2013
2014
2015
2016
2017
2018
2019
2020
2021
2022
2023
2024
2025
U.S. Scheduled Passenger Airline Full-Time Equivalent Employees (000s)
All-Time High
Lowest Since 1Q87
Pre-COVID Peak
Down ~169K (31%)
Up ~82K (22%)
Lowest Since 2Q86
35
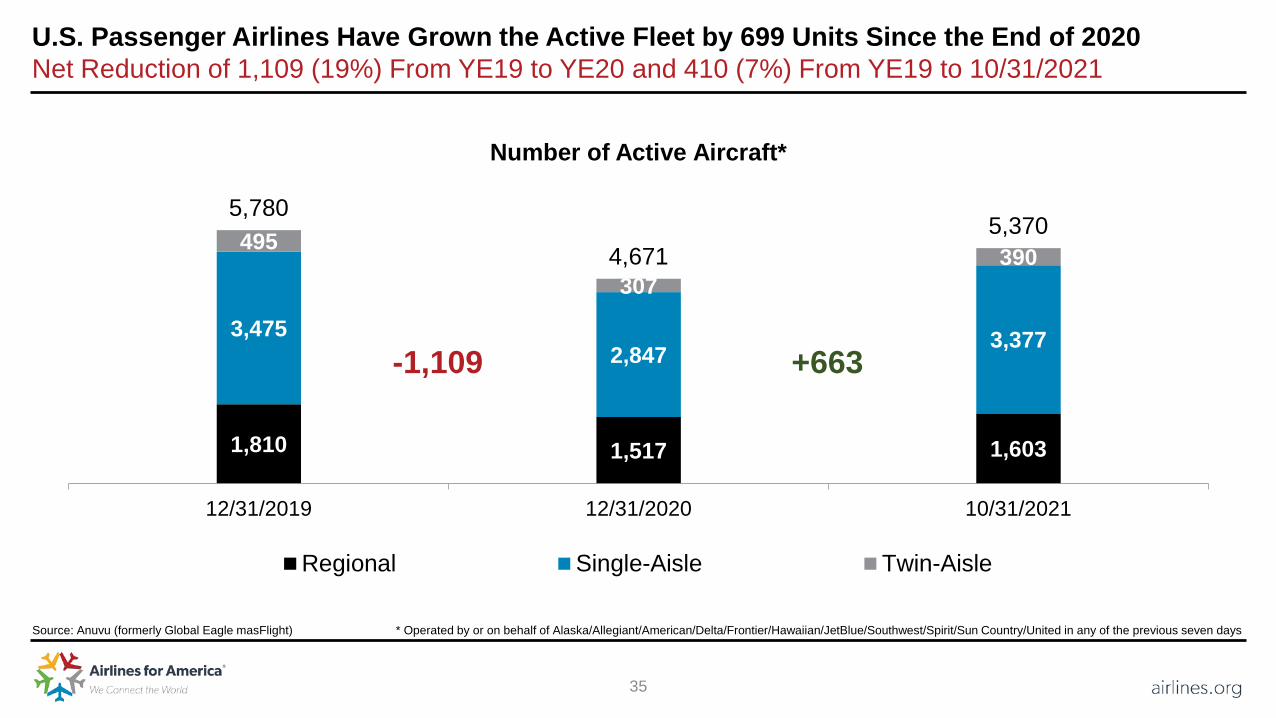
U.S. Passenger Airlines Have Grown the Active Fleet by 699 Units Since the End of 2020Net Reduction of 1,109 (19%) From YE19 to YE20 and 410 (7%) From YE19 to 10/31/2021
Number of Active Aircraft*
1,810 1,517 1,603
3,475 2,847 3,377
495
307 390
5,780
4,671 5,370
12/31/2019 12/31/2020 10/31/2021
Regional Single-Aisle Twin-Aisle
Source: Anuvu (formerly Global Eagle masFlight) * Operated by or on behalf of Alaska/Allegiant/American/Delta/Frontier/Hawaiian/JetBlue/Southwest/Spirit/Sun Country/United in any of the previous seven days
-1,109 +663

36
The Timing of a Return to 2019 Passenger Volumes Depends in Large Part on Business TravelAnother Open Question Is the Degree to Which Leisure and VFR Traffic Remain Robust in 2022-2023
(70)
(60)
(50)
(40)
(30)
(20)
(10)
0
10
20
2019A 2020A 2021F 2022F 2023F 2024F
Pessimistic OptimisticSource: A4A and various airline equity analysts
U.S. Airline Passenger Traffic Change (%) vs. 2019
2019 Passenger Volumes
Note: A = actual; F= forecast
37
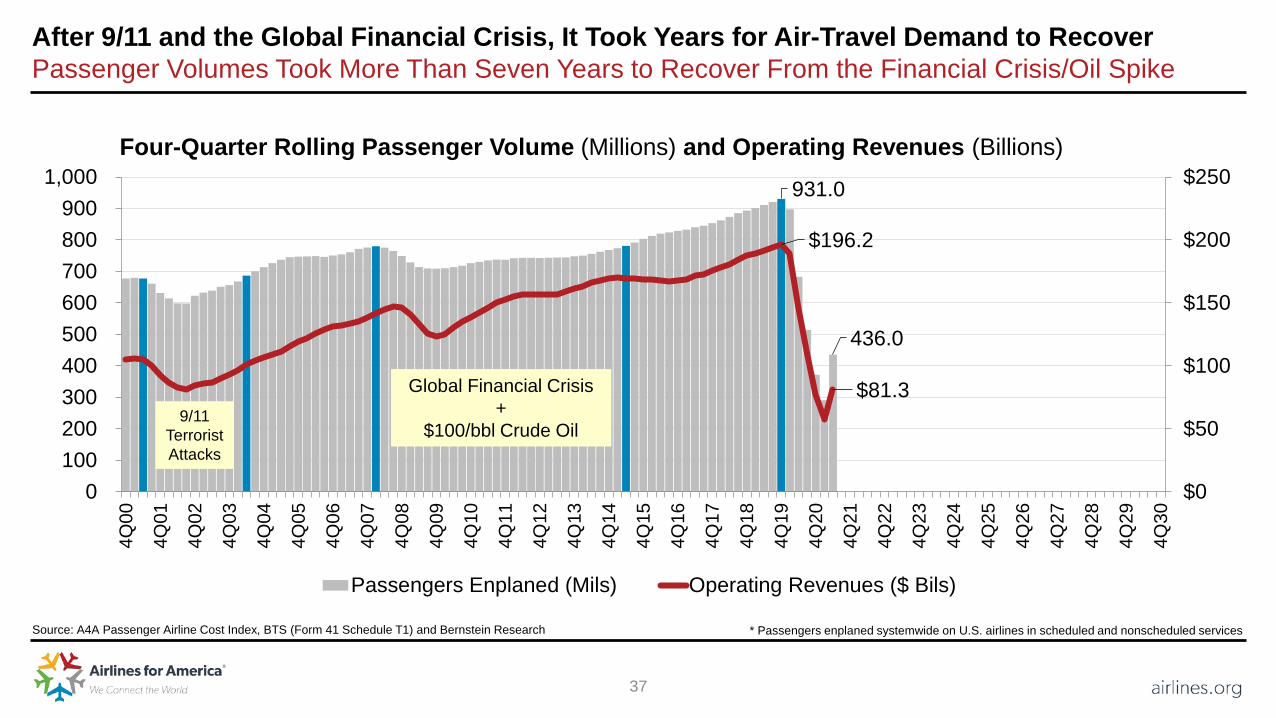
After 9/11 and the Global Financial Crisis, It Took Years for Air-Travel Demand to RecoverPassenger Volumes Took More Than Seven Years to Recover From the Financial Crisis/Oil Spike
Source: A4A Passenger Airline Cost Index, BTS (Form 41 Schedule T1) and Bernstein Research
Four-Quarter Rolling Passenger Volume (Millions) and Operating Revenues (Billions)
931.0
436.0
$196.2
$81.3
$0
$50
$100
$150
$200
$250
0100200300400500600700800900
1,000
4Q00
4Q01
4Q02
4Q03
4Q04
4Q05
4Q06
4Q07
4Q08
4Q09
4Q10
4Q11
4Q12
4Q13
4Q14
4Q15
4Q16
4Q17
4Q18
4Q19
4Q20
4Q21
4Q22
4Q23
4Q24
4Q25
4Q26
4Q27
4Q28
4Q29
4Q30
Passengers Enplaned (Mils) Operating Revenues ($ Bils)
* Passengers enplaned systemwide on U.S. airlines in scheduled and nonscheduled services
9/11 Terrorist Attacks
Global Financial Crisis+
$100/bbl Crude Oil
38
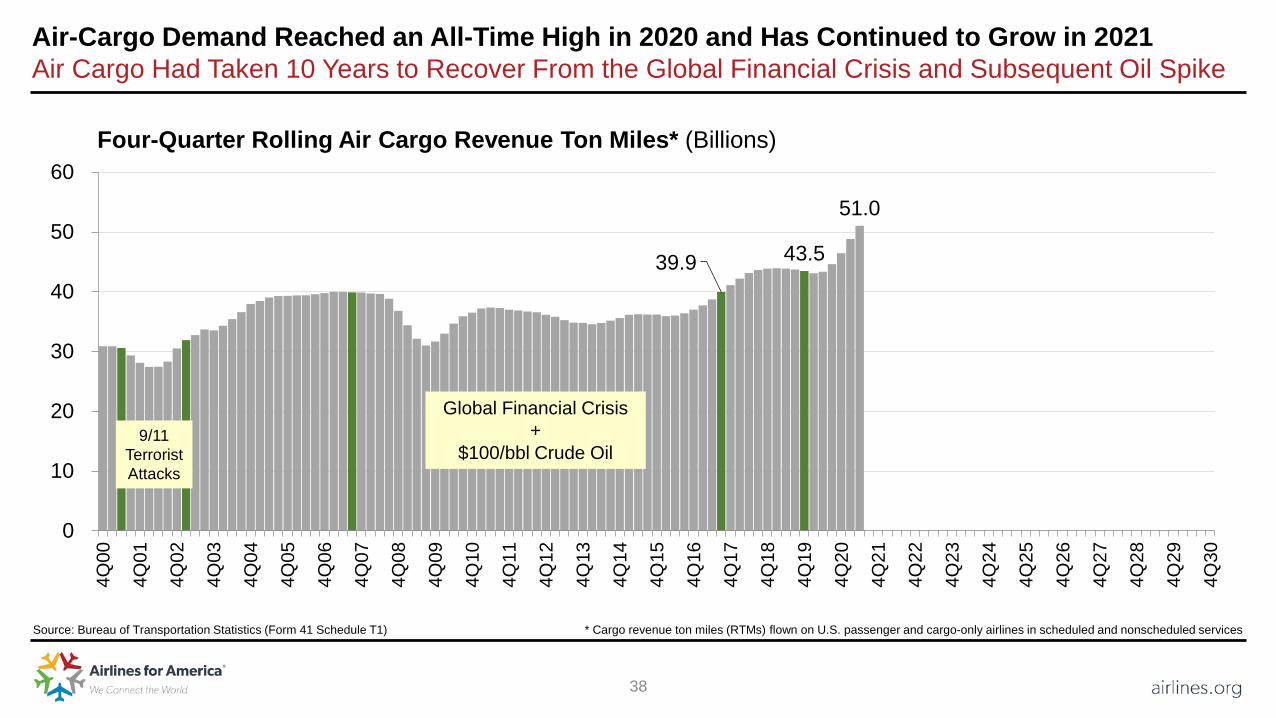
Air-Cargo Demand Reached an All-Time High in 2020 and Has Continued to Grow in 2021Air Cargo Had Taken 10 Years to Recover From the Global Financial Crisis and Subsequent Oil Spike
Source: Bureau of Transportation Statistics (Form 41 Schedule T1)
Four-Quarter Rolling Air Cargo Revenue Ton Miles* (Billions)
39.9 43.5
51.0
0
10
20
30
40
50
60
4Q00
4Q01
4Q02
4Q03
4Q04
4Q05
4Q06
4Q07
4Q08
4Q09
4Q10
4Q11
4Q12
4Q13
4Q14
4Q15
4Q16
4Q17
4Q18
4Q19
4Q20
4Q21
4Q22
4Q23
4Q24
4Q25
4Q26
4Q27
4Q28
4Q29
4Q30
* Cargo revenue ton miles (RTMs) flown on U.S. passenger and cargo-only airlines in scheduled and nonscheduled services
9/11 Terrorist Attacks
Global Financial Crisis+
$100/bbl Crude Oil

39
Pandemic-Driven Technology Acceptance, Digital Competence and Enhanced Cleaning Protocols Will Endure, and Airlines and Airports Will Continue to Invest Accordingly
Source: McKinsey & Company interview with Massachusetts Port Authority CEO Lisa Wieland (Nov. 20, 2020)
“COVID-19 has brought about an acceleration of digital competency across demographic cohorts. We have a lot of different people who fly through the airport. We are constantly thinking about the experience we present to them. And if people have become more technology savvy, more digitally competent, that means we can accelerate and roll out the contactless passenger journey across many platforms—and there will be an acceptance of and a desire for them.”
“Airports and airplanes are cleaner than they’ve ever been and will continue to be that way because it’s important for restoring confidence in air travel. We expect the new hygiene and enhanced-cleaning protocols we’ve implemented to continue. Passengers can expect that from airports and airlines going forward.”
40