emerging hotspots for commercial vehicles in africa
TRANSCRIPT
Emerging Hotspots for Commercial Vehicles in Emerging Hotspots for Commercial Vehicles in AfricaAfrica
Key Trends in SubKey Trends in Sub--Saharan AfricaSaharan Africa
Derrick Derrick ChikangaChikanga, Research Analyst, Research Analyst
Automotive and TransportationAutomotive and TransportationAutomotive and TransportationAutomotive and Transportation
Africa Africa
© 2012 Frost & Sullivan. All rights reserved. This document contains highly confidential information and is the sole property of
Frost & Sullivan. No part of it may be circulated, quoted, copied or otherwise reproduced without the written approval of Frost & Sullivan.
Functional Expertise
� 6 years of research and consulting expertise, which include more than 26 research and 21 consulting projects.
Particular expertise in:
- Research, Data Collection and Analysis
- Report Writing and PowerPoint Presentation
- Contacts Establishment and Project Management
Industry Expertise
� Experience base covering broad range of sectors, leveraging long-standing working relationships with leading industry
participants’ Senior Executives
- Electronic and Security Systems
- Automotive & Transportation Industry
- Water and Wastewater Treatment Technologies; Waste Management and Waste-to-energy
- Renewable Energy Technologies
- Air Pollution Control Technologies; HVAC and Lighting Equipment; Facilities Management
Derrick ChikangaResearch Analyst
Frost & SullivanSouth Africa
Derrick Chikanga
2
- Air Pollution Control Technologies; HVAC and Lighting Equipment; Facilities Management
- Energy Efficiency Technology Analysis (Lighting, HVAC, BMS)
- Sub-Saharan Africa Infrastructure Development Analysis (Transportation, Energy and Power, Telecommunication,
Social and Water Infrastructure)
What I bring to the Team
� Solid Research and Analytical Skills
� Client Relationship Management
� Industry Experience; Broad Network of Industry Contacts
Career Highlights
� Extensive expertise in the Southern African Environmental and Infrastructure Sectors
Education
� MCom Finance (Financial Management) from University of Cape Town, Cape Town, South Africa (On-going)
� BCom (Hons) Financial Analysis & Portfolio Management from University of Cape Town, Cape Town, South Africa
� BCom (Hons) Economics from University of Cape Town, Cape Town, South Africa
� BCom Economics & Finance, Cape Town, South Africa
South AfricaCape Town
Focus PointSlide
Number
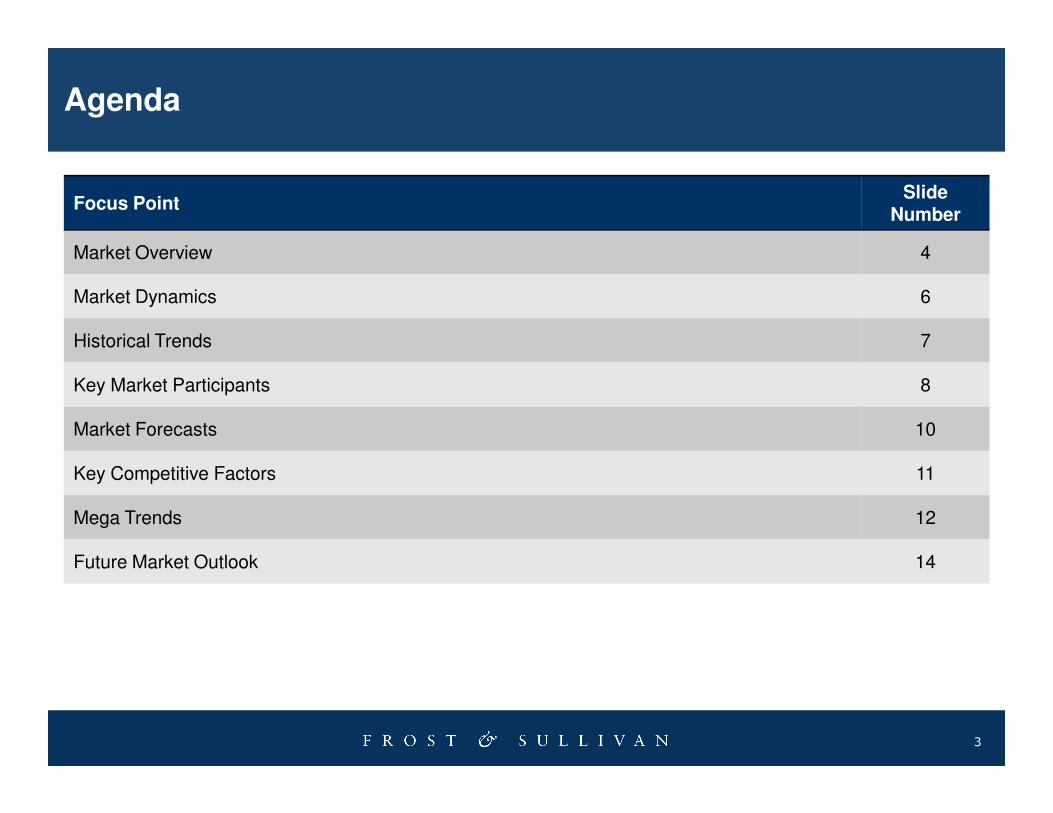
Market Overview 4
Market Dynamics 6
Historical Trends 7
Key Market Participants 8
Agenda
3
Market Forecasts 10
Key Competitive Factors 11
Mega Trends 12
Future Market Outlook 14
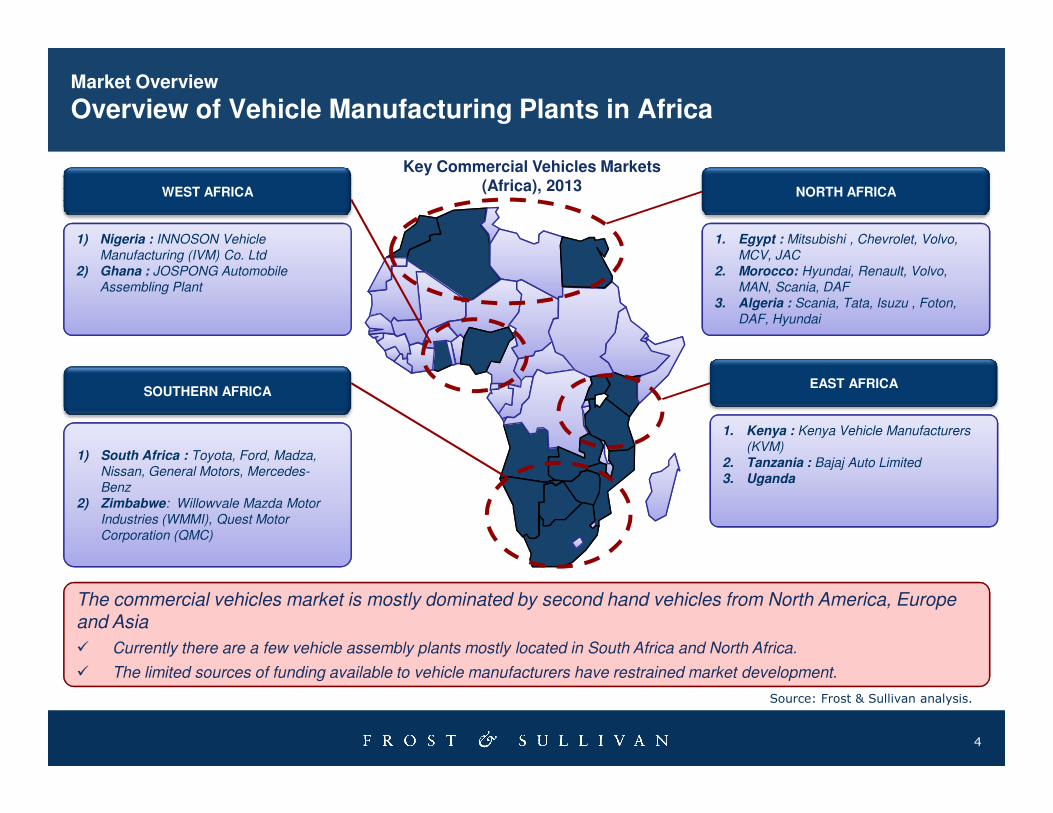
Key Commercial Vehicles Markets (Africa), 2013
1) Nigeria : INNOSON Vehicle
Manufacturing (IVM) Co. Ltd
2) Ghana : JOSPONG Automobile
Assembling Plant
WEST AFRICA
1. Egypt : Mitsubishi , Chevrolet, Volvo,
MCV, JAC
2. Morocco: Hyundai, Renault, Volvo,
MAN, Scania, DAF
3. Algeria : Scania, Tata, Isuzu , Foton,
DAF, Hyundai
NORTH AFRICA
EAST AFRICASOUTHERN AFRICA
Market Overview
Overview of Vehicle Manufacturing Plants in Africa
4
1. Kenya : Kenya Vehicle Manufacturers
(KVM)
2. Tanzania : Bajaj Auto Limited
3. Uganda
1) South Africa : Toyota, Ford, Madza,
Nissan, General Motors, Mercedes-
Benz
2) Zimbabwe: Willowvale Mazda Motor
Industries (WMMI), Quest Motor
Corporation (QMC)
The commercial vehicles market is mostly dominated by second hand vehicles from North America, Europe and Asia
� Currently there are a few vehicle assembly plants mostly located in South Africa and North Africa.
� The limited sources of funding available to vehicle manufacturers have restrained market development.
Source: Frost & Sullivan analysis.
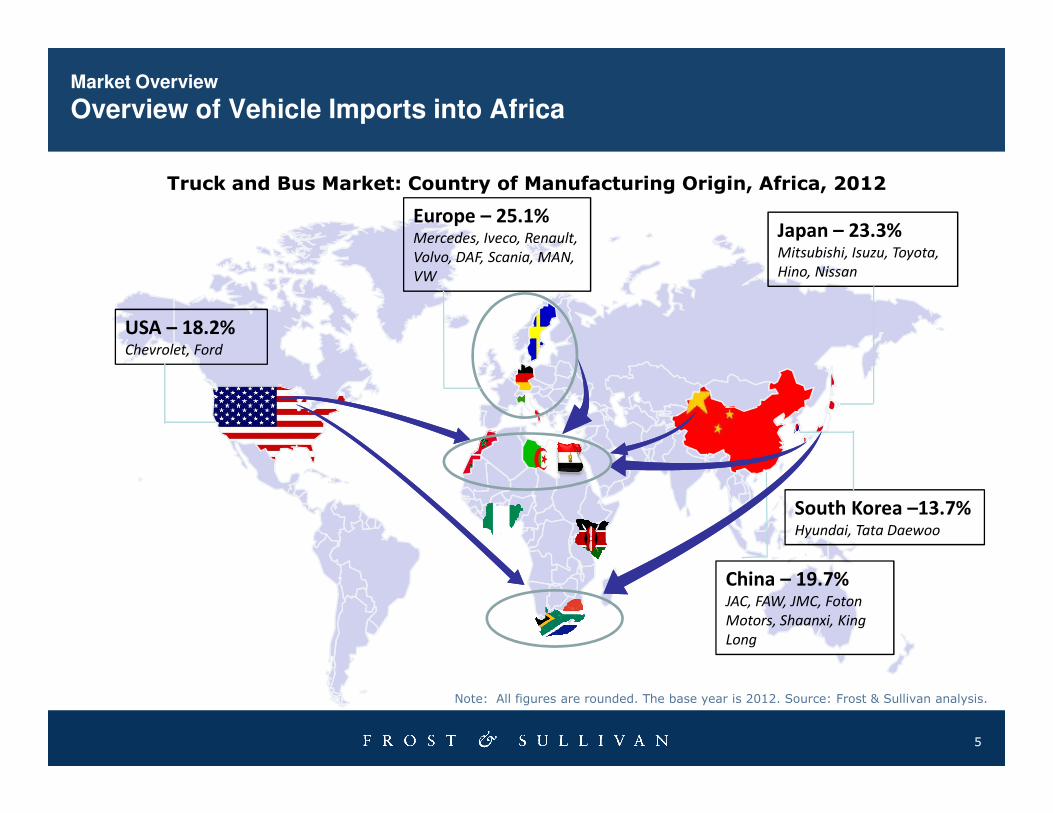
USA – 18.2%Chevrolet, Ford
Japan – 23.3%Mitsubishi, Isuzu, Toyota,
Hino, Nissan
Europe – 25.1%Mercedes, Iveco, Renault,
Volvo, DAF, Scania, MAN,
VW
Truck and Bus Market: Country of Manufacturing Origin, Africa, 2012
Market Overview
Overview of Vehicle Imports into Africa
5
China – 19.7%JAC, FAW, JMC, Foton
Motors, Shaanxi, King
Long
South Korea –13.7%Hyundai, Tata Daewoo
Note: All figures are rounded. The base year is 2012. Source: Frost & Sullivan analysis.
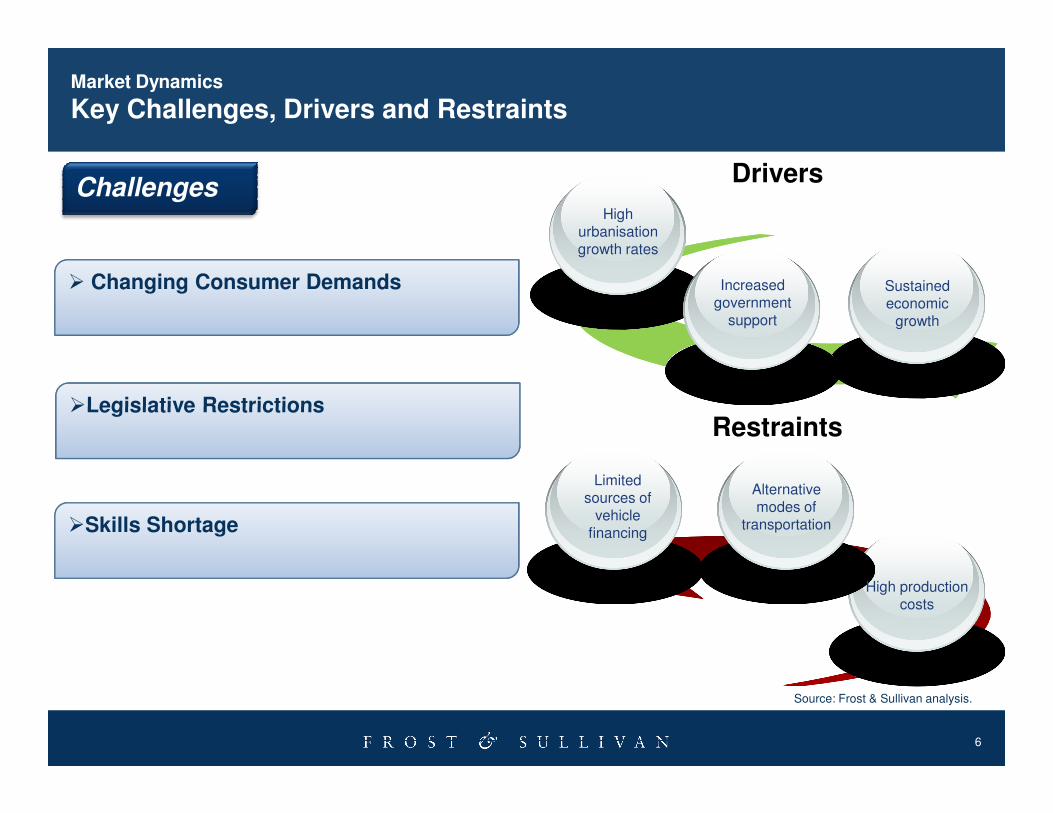
Drivers
High urbanisation growth rates
Sustained economic
growth
Increased government
support
Challenges
� Changing Consumer Demands
�Legislative Restrictions
Market Dynamics
Key Challenges, Drivers and Restraints
6
Restraints
Limited sources of
vehicle financing
Alternative modes of
transportation
High production costs
�Skills Shortage
�Legislative Restrictions
Source: Frost & Sullivan analysis.

Historical Sales of Buses, Light, Medium and Heavy Vehicles (Sub-Saharan Africa), 2000-2011
200,000
250,000
300,000
350,000
Ve
hic
le a
nd
Bu
s S
ale
s
LCV MCV/HCV Buses
Historical Trends
Historical Vehicle and Bus Sales
Peak period:• LCV : 306,886 units
• MCV/HCV: 55,659 units
• Buses: 12,421 units
7
0
50,000
100,000
150,000
200,000
2000 2001 2002 2003 2004 2005 2006 2007 2008 2009 2010 2011
Ve
hic
le a
nd
Bu
s S
ale
s
Year
Note: All figures are rounded. The base year is 2012. Source: Frost & Sullivan analysis.
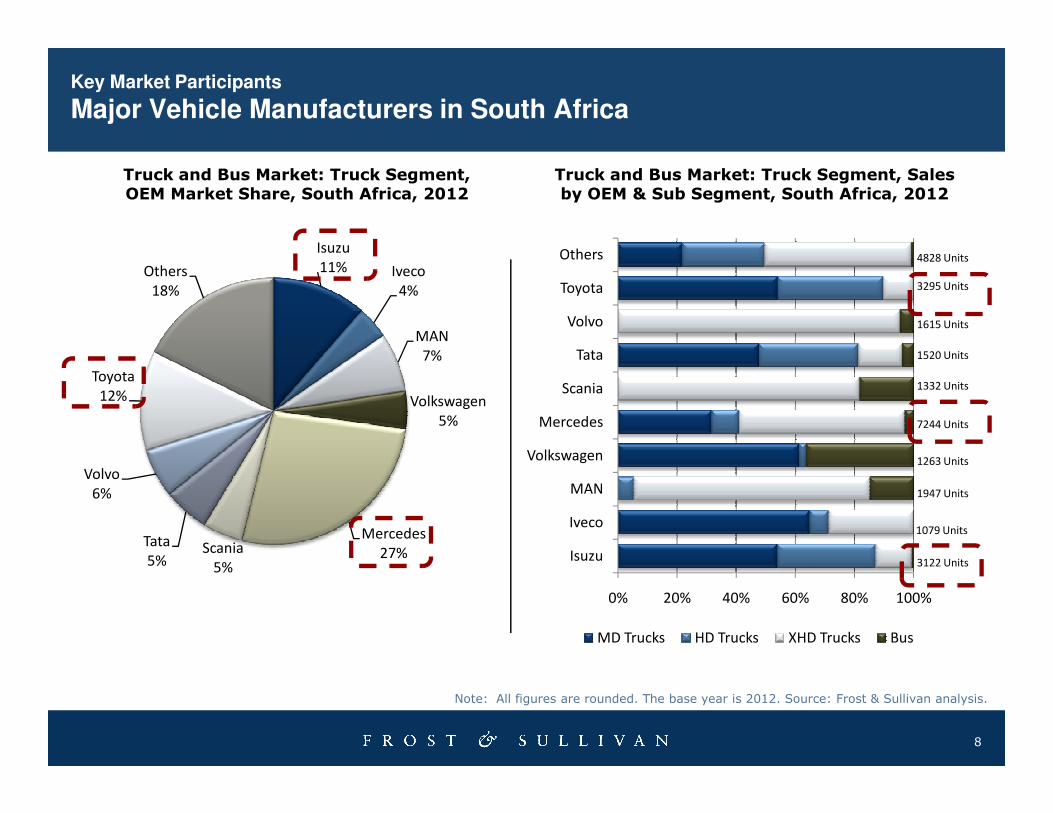
Truck and Bus Market: Truck Segment, OEM Market Share, South Africa, 2012
Truck and Bus Market: Truck Segment, Salesby OEM & Sub Segment, South Africa, 2012
Isuzu
11% Iveco
4%
MAN
7%
Volkswagen
Toyota
12%
Others
18%
Scania
Tata
Volvo
Toyota
Others 4828 Units
3295 Units
1615 Units
1520 Units
1332 Units
Key Market Participants
Major Vehicle Manufacturers in South Africa
8
Volkswagen
5%
Mercedes
27%Scania
5%
Tata
5%
Volvo
6%
0% 20% 40% 60% 80% 100%
Isuzu
Iveco
MAN
Volkswagen
Mercedes
MD Trucks HD Trucks XHD Trucks Bus
7244 Units
1263 Units
1947 Units
3122 Units
1079 Units
Note: All figures are rounded. The base year is 2012. Source: Frost & Sullivan analysis.
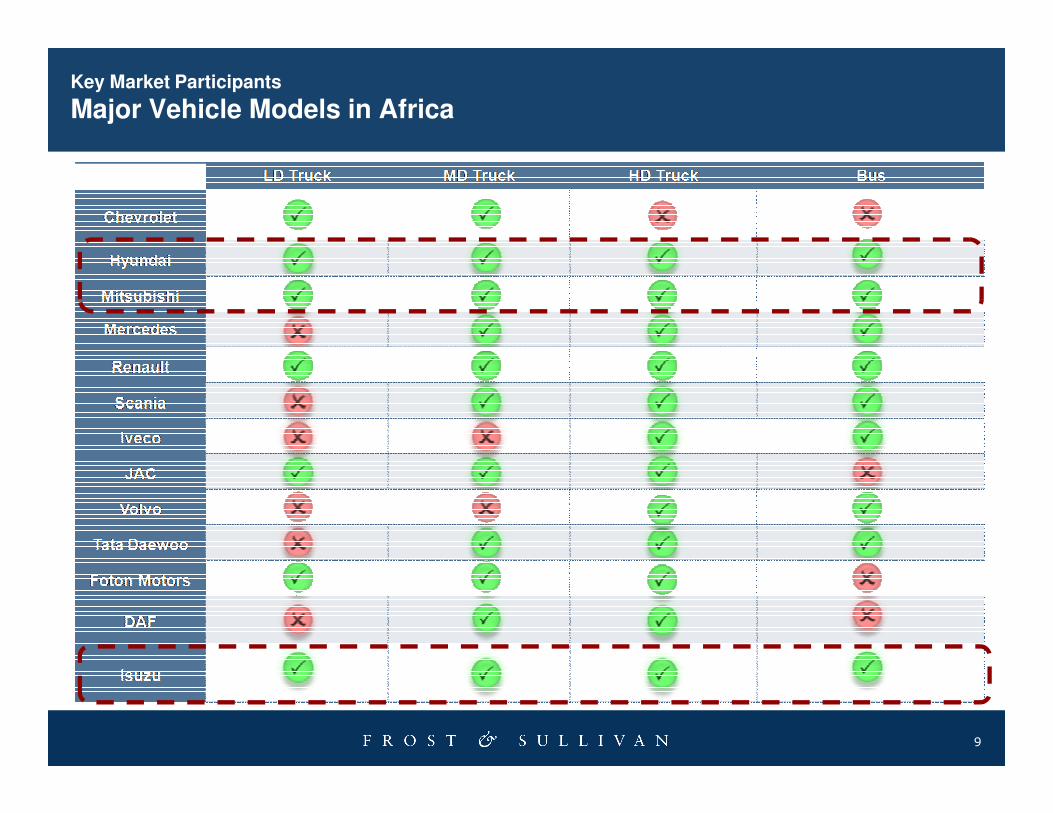
Key Market Participants
Major Vehicle Models in Africa
9
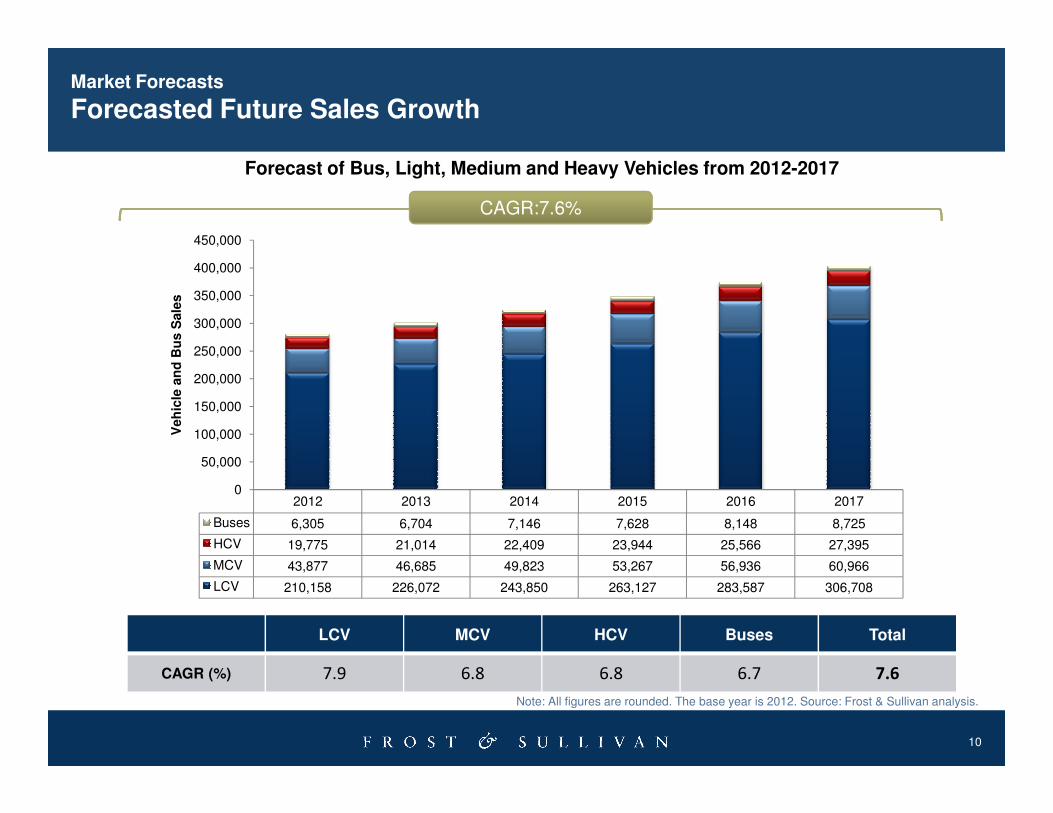
CAGR:7.6%
Forecast of Bus, Light, Medium and Heavy Vehicles from 2012-2017
150,000
200,000
250,000
300,000
350,000
400,000
450,000
Veh
icle
an
d B
us S
ale
s
Market Forecasts
Forecasted Future Sales Growth
10
Note: All figures are rounded. The base year is 2012. Source: Frost & Sullivan analysis.
LCV MCV HCV Buses Total
CAGR (%) 7.9 6.8 6.8 6.7 7.6
2012 2013 2014 2015 2016 2017
Buses 6,305 6,704 7,146 7,628 8,148 8,725
HCV 19,775 21,014 22,409 23,944 25,566 27,395
MCV 43,877 46,685 49,823 53,267 56,936 60,966
LCV 210,158 226,072 243,850 263,127 283,587 306,708
0
50,000
100,000
150,000
Veh
icle
an
d B
us S
ale
s
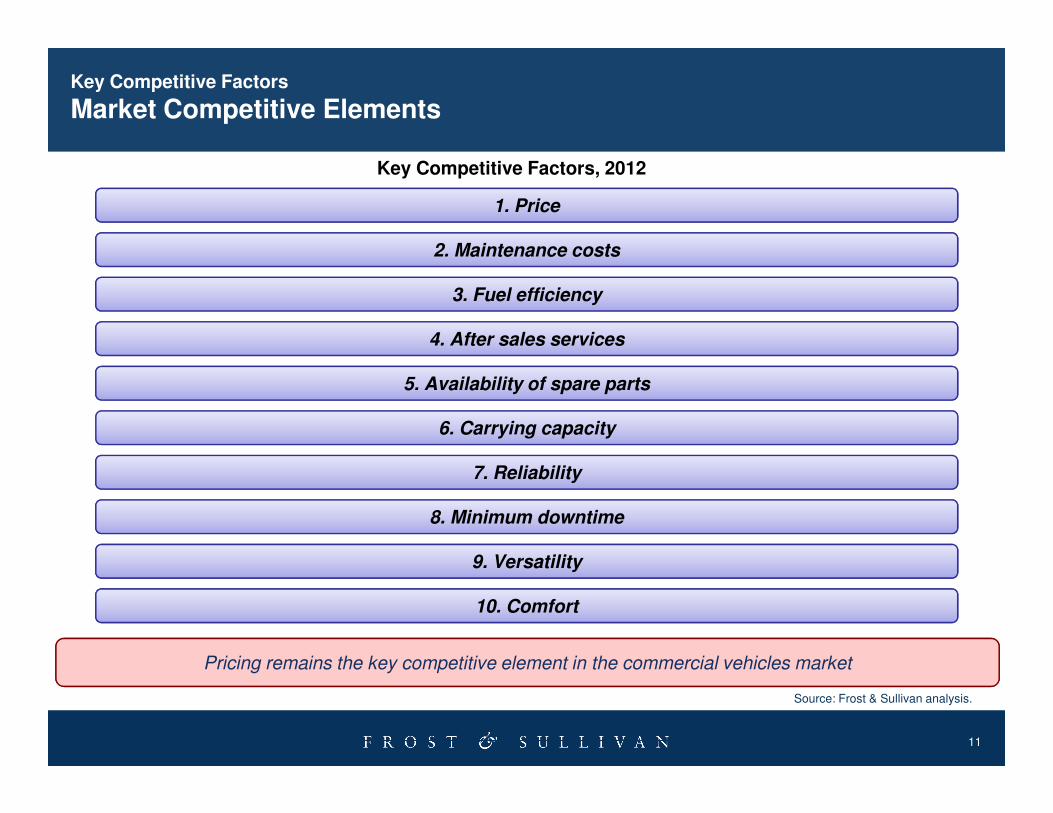
Key Competitive Factors, 2012
1. Price
2. Maintenance costs
3. Fuel efficiency
4. After sales services
5. Availability of spare parts
Key Competitive Factors
Market Competitive Elements
11
6. Carrying capacity
7. Reliability
8. Minimum downtime
9. Versatility
10. Comfort
Pricing remains the key competitive element in the commercial vehicles market
Source: Frost & Sullivan analysis.
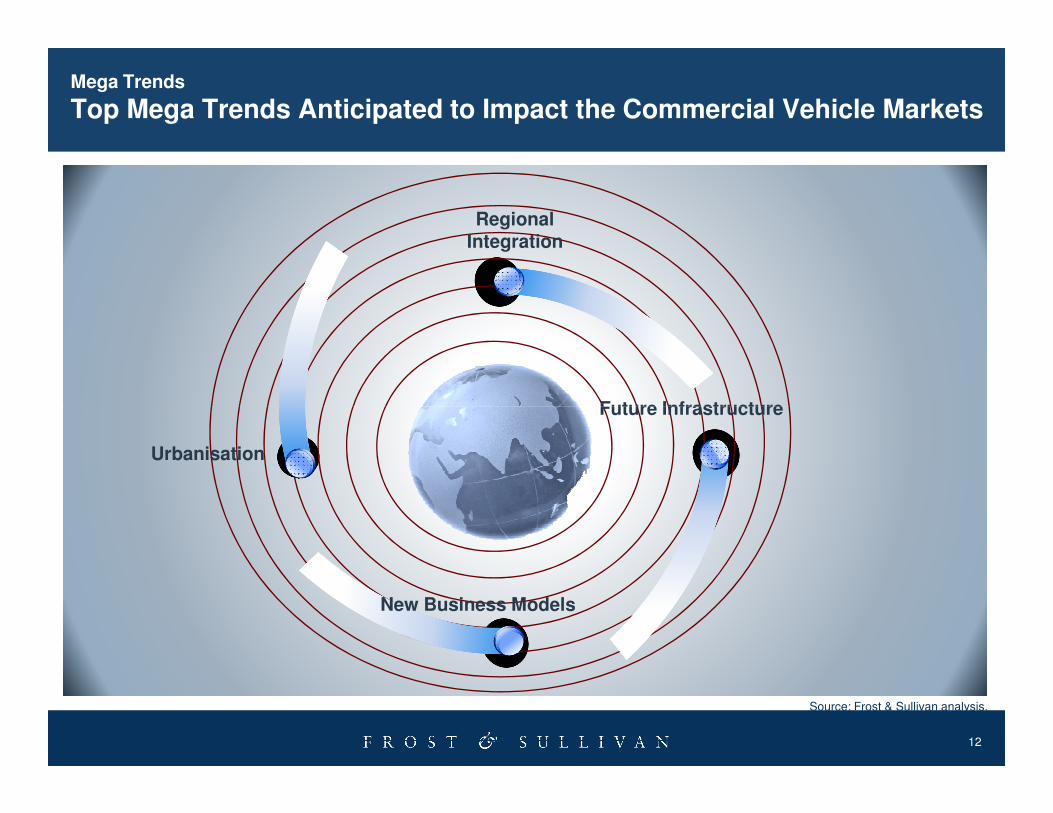
Regional Integration
Future Infrastructure
Mega Trends
Top Mega Trends Anticipated to Impact the Commercial Vehicle Markets
12
Urbanisation
New Business Models
Future Infrastructure
Source: Frost & Sullivan analysis.
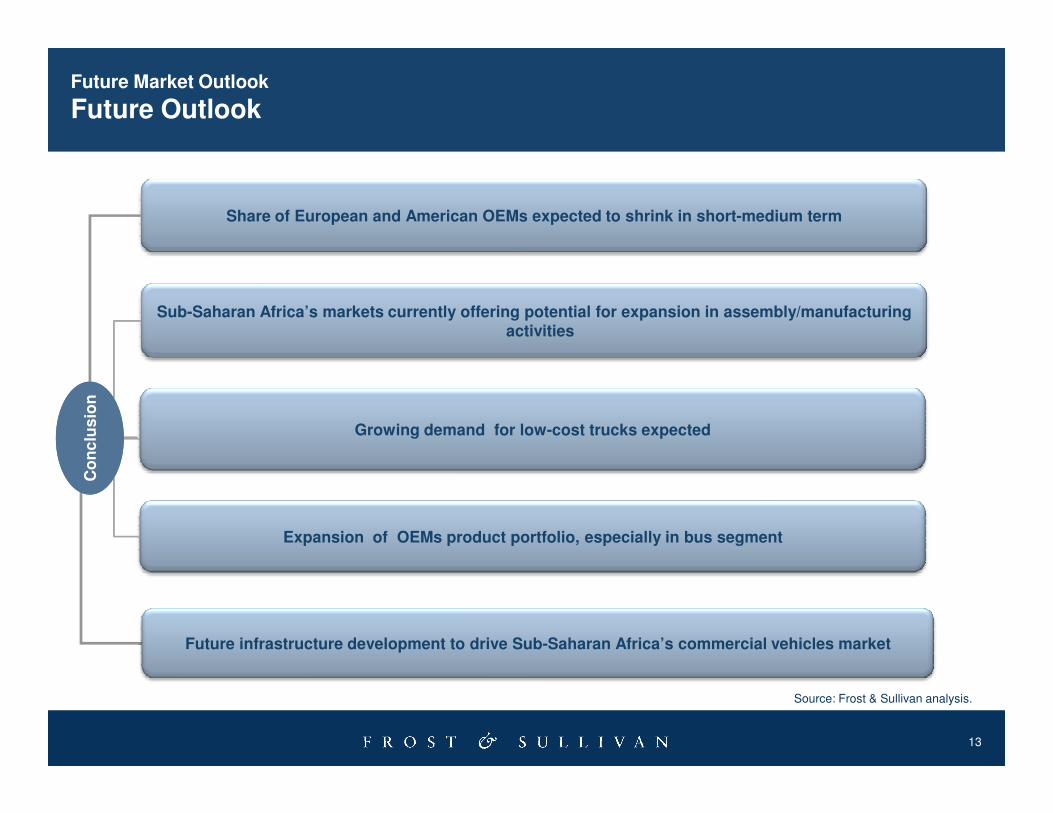
Sub-Saharan Africa’s markets currently offering potential for expansion in assembly/manufacturing activities
Share of European and American OEMs expected to shrink in short-medium term
Co
nc
lus
ion
Future Market Outlook
Future Outlook
13
Source: Frost & Sullivan analysis.
Future infrastructure development to drive Sub-Saharan Africa’s commercial vehicles market
Growing demand for low-cost trucks expected
Expansion of OEMs product portfolio, especially in bus segment
Co
nc
lus
ion
Next Steps
Develop Your Visionary and Innovative Skills Growth Partnership Service
Share your growth thought leadership and ideas or join our GIL Global Community
14
Skills Growth Partnership Service ideas or join our GIL Global Community
Join our GIL Community NewsletterKeep abreast of innovative growth opportunities
Your Feedback is Important to Us
What would you like to see from Frost & Sullivan?
Growth Forecasts?
Competitive Structure?
15
Emerging Trends?
Strategic Recommendations?
Other?
Please inform us by “Rating” this presentation.
Follow Frost & Sullivan on Facebook, LinkedIn, SlideShare, and Twitter
http://www.facebook.com/FrostandSullivan
http://www.linkedin.com/companies/4506
1616
http://www.linkedin.com/companies/4506
http://www.slideshare.net/FrostandSullivan
http://twitter.com/FrostsullivanSA
For Additional Information
Samantha James
Corporate Communications
+27 (0)21 680 3574
Derrick Chikanga
Research Analyst – EBT / A&T
+27 (0)21 680 3204
17
Kudzanayi Bangure
Programme Manager – EBT / A&T
+27 (0)21 680 3207
Guillaume de Bassompierre
Director – Business Development
+27 (0)21 680 3203