emerging markets debt relief: kicking the can down …
TRANSCRIPT
24 June 2021
04 Growing inequalities and vulnerabilities
06 Current debt restructuring initiatives will continue to kick the can
down the road
08 Meet the top 20 EMs at risk
10 The devil is in the details
Ph
oto
by
Luck
e S
tack
po
ole
on
Un
spla
sh
EMERGING MARKETS DEBT RELIEF: KICKING THE CAN DOWN THE ROAD
ALLIANZ RESEARCH
2
Selin Ozyurt, Senior Economist for France and Africa
Manfred Stamer, Senior Economist for Emerging Europe
and the Middle East
The Covid-19 pandemic and related global economic crisis triggered an unprece-dented shift in public debt sustainability in the developing world. Emerging Mar-kets (EMs) and Low-income Developing Countries (LDCs) have been hit harder by the post-Covid debt surge, reflecting their heavy debt-service burden compared to Advanced Economies (AEs). A decade ago, the share of government interest pay-ments in fiscal revenues was nearly the same (on average around 6%) for the three country categories. Since then, the debt-service cost has fallen for AEs (to 4% in 2020), gradually increased for EMs (7.3%) and more than doubled for LDCs (13.7%).
Despite the global economic recovery that is already underway (+5.5% in 2021, the fastest recovery in the past 40 years), we expect increased debt distress in EMs and especially in LDCs in the next two years and further sovereign downgrades as well as some defaults. Low-income countries will need a minimum of USD450bn in order to step up their spending response to Covid-19, to rebuild or preserve for-eign exchange reserves and to offset the long-lasting scars of the crisis. In the ab-sence of a comprehensive solution, heavy debt burdens may generate a perma-nent global divergence between rich and poor countries.
Current debt restructuring initiatives will certainly continue to kick the can down the road and are likely to fall short of their objectives. The IMF’s new USD650bn SDR allocation is a step in the right direction but will be no game-changer. The G20/Paris Club Debt Service Suspension Initiative (DSSI) has the merit of including China, for the first time, into a coordinated debt relief initiative. Yet, it will bring only “temporary” relief (i.e. payment deferral without debt cancellation) in 2021 and covers a very small portion of the debt-service burden (excludes EM borro-wers and private creditors, for example).
The changing creditor landscape of public debt (Eurobond holders, China, India and some Middle Eastern countries) has created a “race to seniority” and increa-sed debt sustainability risks. This shift from traditional (concessional) to private and commercial debt complicates debt restructuring and leaves less room for debt forgiveness. China’s collateralized lending with strategic assets gives it a mo-re senior status, for instance in Angola and Zambia, compared to official internati-onal lenders (such as the IMF, World Bank). This creates a race to seniority that complicates debt-resolution negotiations in case of repayment difficulties. So far, when things have gone wrong and repayment difficulties arose, countries have bilaterally engaged in debt-restructuring talks with China behind closed doors (Sri Lanka, Ecuador, Angola, Zambia, Kenya), with barely any disclosure on agreed repayment deferrals (rather than write-offs).
The IMF-coordinated “Common Framework” aims at offering the same restruc-turing terms for all creditors, including private creditors, by following a “case by case” approach. Coordination, transparency and acceptability will be the main challenges for reaching a satisfactory debt restructuring agreement with all stake-holders. Given the overwhelming share of Eurobond holders, official creditors are currently pushing for private sector involvement in debt restructuring to ensure “fair” burden sharing. Yet, some borrower countries are less inclined to incur losses on private creditors, with the fear of having their sovereign ratings downgraded, which would lead to losing market access. In addition, the success of the initiative hinges on transparent information sharing regarding the stock and conditionality of the debt with China. We believe that the political acceptability of these debt-relief initiatives could be jeopardized should China not take sufficient part in the process. The US and other bilateral creditors may not want to join the initiative if the provided debt relief is used to repay Chinese debt.
EXECUTIVE
SUMMARY
Allianz Research
3
Overall, we expect neither a fundamental blanket solution nor a tsunami of debt defaults in the near future. The international community is likely to step in to bring the needed liquidity relief in case of stress, without being able to offer an overar-ching solution. Debt forgiveness will bring only temporary financial relief to count-ries without tackling the root causes of unsustainable debt accumulation. In this sense, proposals like the “New Deal” for Africa from the Paris Summit would offer a viable solution through private sector-led growth if countries manage to overco-me their structural impediments (i.e. high exposure to commodity cycles, weak fiscal revenue collection, inefficient government spending, corruption and poor governance, low potential growth due to shortfalls in human capital, infrastruc-ture and energy investment etc.).
We identify pockets of sovereign debt stress vulnerability for the next two years. The top 20 riskiest EM countries include the heavyweights Egypt, South Africa, In-dia and Brazil, as well as Pakistan. Our Public Debt Sustainability Risk Score (PDSRS) analyzes sovereign debt dynamics in 61 EMs and 40 LDCs. The countries that we flag as “most vulnerable” have high chances of being next to seek financi-al support from international lenders, to apply for debt relief/restructuring initiati-ves or to default on their sovereign debt (i.e. failure to reimburse principal or inte-rest payments in due time). The top 20 riskiest countries include seven economies each from Latin America (Suriname, El Salvador, Costa Rica, Trinidad & Tobago, Panama, Brazil, Argentina) and Africa (Egypt, Zambia, Angola, Tunisia, Ghana, South Africa, Mozambique) and three each from the Middle East (Lebanon, Bahr-ain, Jordan) and Asia (Sri Lanka, Pakistan, India). However, there is no country from Emerging Europe. The top 20 also includes four of the five countries that defaulted in 2020 (Lebanon, Suriname, Zambia, Argentina).
The traditional debt sustainability analysis toolbox may not catch all high-risk eco-nomies as some specific factors could suddenly trigger severe liquidity tensions followed by sovereign debt defaults, even if the overall debt metrics appear at acceptable levels (the example of Ecuador showed this in 2020). Therefore, we pay particular attention to EMs and LDCs with a high annual interest or amortiza-tion burden on sovereign debt and/or with a high level of foreign exchange-denominated public debt along with significant exchange rate vulnerability. This adds Bangladesh, the Dominican Republic, Guatemala, Iran, Kenya, Malawi, Ni-geria, Uganda, Albania, Kazakhstan, Morocco, Congo DR, Kyrgyzstan, Tajikistan and Uzbekistan to our watch list for debt distress in the next two years.
24 June 2021
46% Median debt-to-GDP ratio for Low-income
Developing Countries in 2020.
4
GROWING INEQUALITIES AND VULNERABILITIES
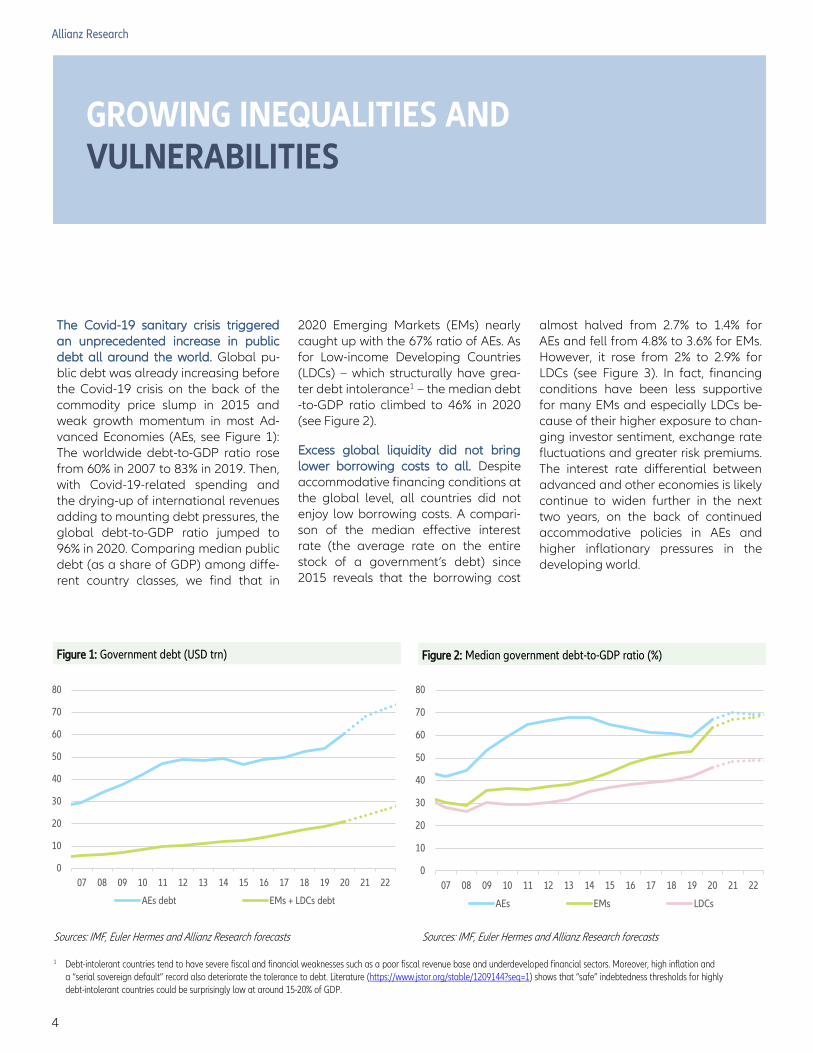
The Covid-19 sanitary crisis triggered an unprecedented increase in public debt all around the world. Global pu-blic debt was already increasing before the Covid-19 crisis on the back of the commodity price slump in 2015 and weak growth momentum in most Ad-vanced Economies (AEs, see Figure 1): The worldwide debt-to-GDP ratio rose from 60% in 2007 to 83% in 2019. Then, with Covid-19-related spending and the drying-up of international revenues adding to mounting debt pressures, the global debt-to-GDP ratio jumped to 96% in 2020. Comparing median public debt (as a share of GDP) among diffe-rent country classes, we find that in
2020 Emerging Markets (EMs) nearly caught up with the 67% ratio of AEs. As for Low-income Developing Countries (LDCs) – which structurally have grea-ter debt intolerance1 – the median debt-to-GDP ratio climbed to 46% in 2020 (see Figure 2).
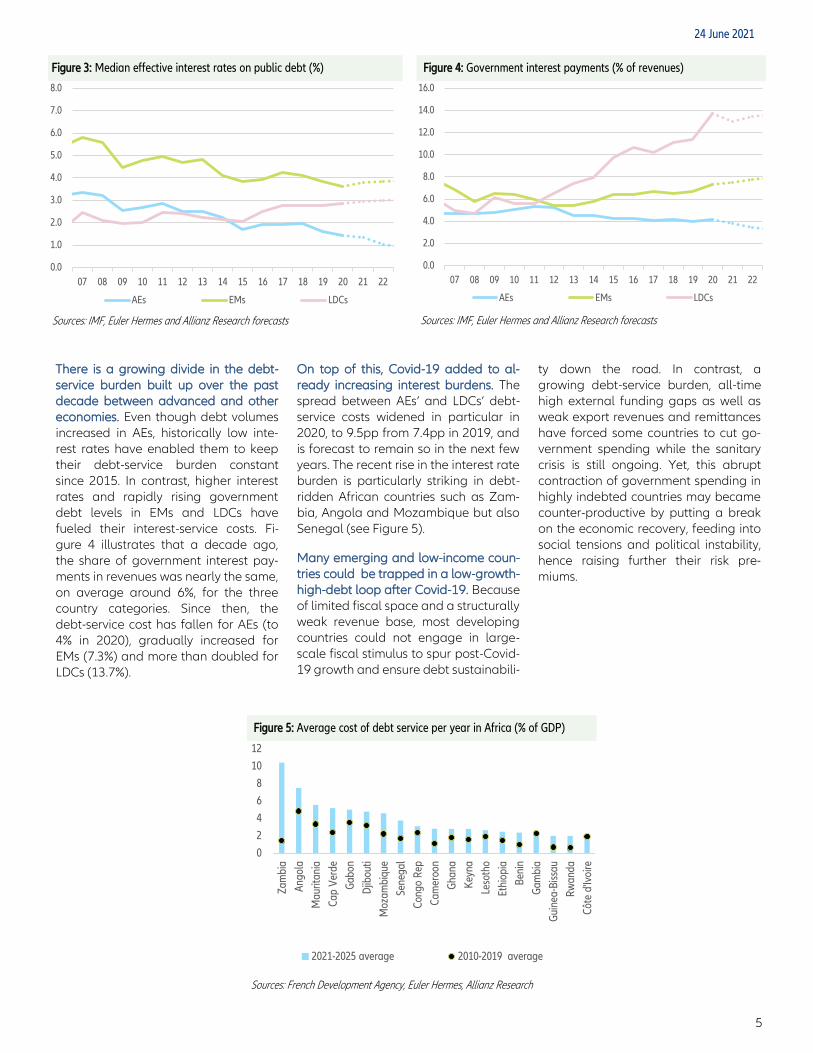
Excess global liquidity did not bring lower borrowing costs to all. Despite accommodative financing conditions at the global level, all countries did not enjoy low borrowing costs. A compari-son of the median effective interest rate (the average rate on the entire stock of a government’s debt) since 2015 reveals that the borrowing cost
almost halved from 2.7% to 1.4% for AEs and fell from 4.8% to 3.6% for EMs. However, it rose from 2% to 2.9% for LDCs (see Figure 3). In fact, financing conditions have been less supportive for many EMs and especially LDCs be-cause of their higher exposure to chan-ging investor sentiment, exchange rate fluctuations and greater risk premiums. The interest rate differential between advanced and other economies is likely continue to widen further in the next two years, on the back of continued accommodative policies in AEs and higher inflationary pressures in the developing world.
Sources: IMF, Euler Hermes and Allianz Research forecasts
Figure 1: Government debt (USD trn)
Allianz Research
1 Debt-intolerant countries tend to have severe fiscal and financial weaknesses such as a poor fiscal revenue base and underdeveloped financial sectors. Moreover, high inflation and a “serial sovereign default” record also deteriorate the tolerance to debt. Literature (https://www.jstor.org/stable/1209144?seq=1) shows that “safe” indebtedness thresholds for highly debt-intolerant countries could be surprisingly low at around 15-20% of GDP.
Figure 2: Median government debt-to-GDP ratio (%)
Sources: IMF, Euler Hermes and Allianz Research forecasts
0
10
20
30
40
50
60
70
80
07 08 09 10 11 12 13 14 15 16 17 18 19 20 21 22
AEs debt EMs + LDCs debt
0
10
20
30
40
50
60
70
80
07 08 09 10 11 12 13 14 15 16 17 18 19 20 21 22
AEs EMs LDCs
5
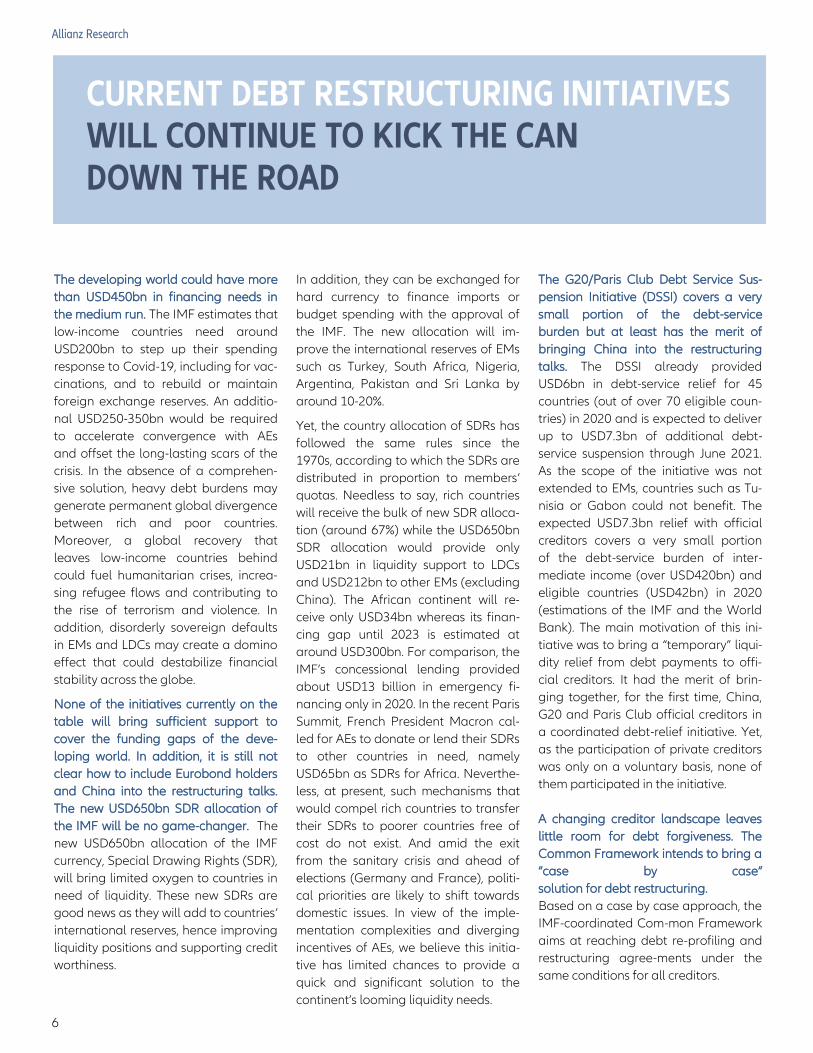
There is a growing divide in the debt-service burden built up over the past decade between advanced and other economies. Even though debt volumes increased in AEs, historically low inte-rest rates have enabled them to keep their debt-service burden constant since 2015. In contrast, higher interest rates and rapidly rising government debt levels in EMs and LDCs have fueled their interest-service costs. Fi-gure 4 illustrates that a decade ago, the share of government interest pay-ments in revenues was nearly the same, on average around 6%, for the three country categories. Since then, the debt-service cost has fallen for AEs (to 4% in 2020), gradually increased for EMs (7.3%) and more than doubled for LDCs (13.7%).
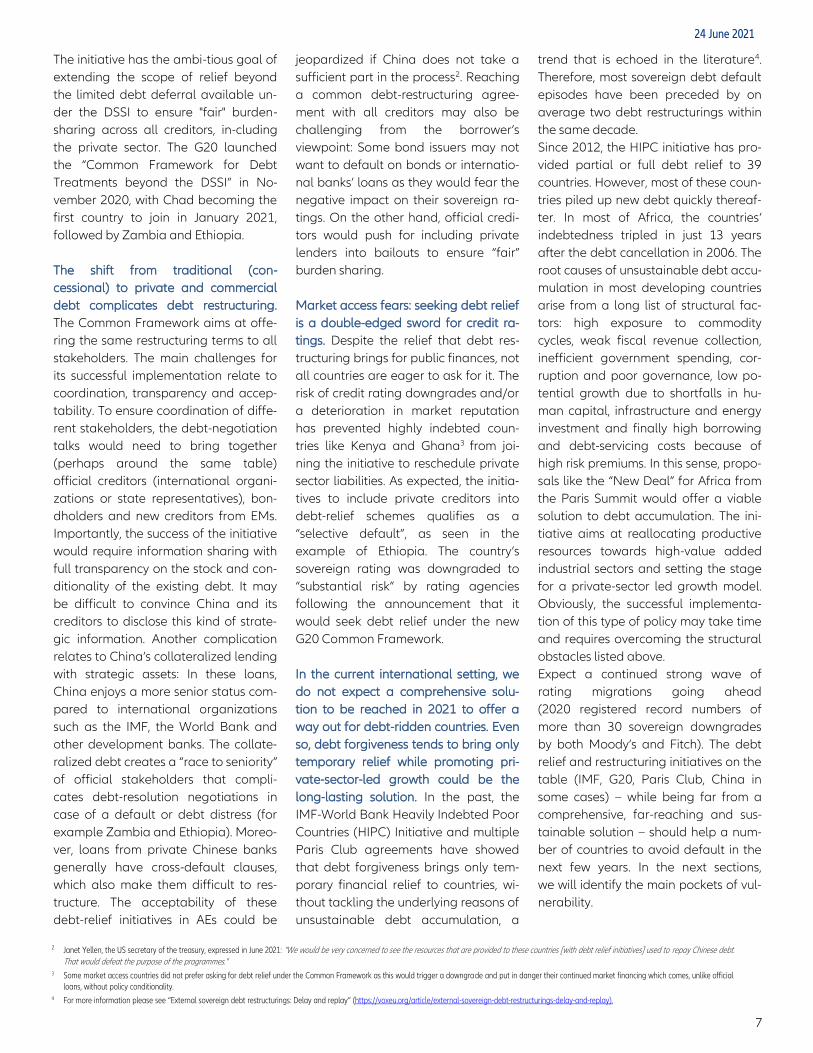
On top of this, Covid-19 added to al-ready increasing interest burdens. The spread between AEs’ and LDCs’ debt-service costs widened in particular in 2020, to 9.5pp from 7.4pp in 2019, and is forecast to remain so in the next few years. The recent rise in the interest rate burden is particularly striking in debt-ridden African countries such as Zam-bia, Angola and Mozambique but also Senegal (see Figure 5).
Many emerging and low-income coun-tries could be trapped in a low-growth-high-debt loop after Covid-19. Because of limited fiscal space and a structurally weak revenue base, most developing countries could not engage in large-scale fiscal stimulus to spur post-Covid-19 growth and ensure debt sustainabili-
ty down the road. In contrast, a growing debt-service burden, all-time high external funding gaps as well as weak export revenues and remittances have forced some countries to cut go-vernment spending while the sanitary crisis is still ongoing. Yet, this abrupt contraction of government spending in highly indebted countries may became counter-productive by putting a break on the economic recovery, feeding into social tensions and political instability, hence raising further their risk pre-miums.
Figure 3: Median effective interest rates on public debt (%)
24 June 2021
Figure 4: Government interest payments (% of revenues)
Sources: IMF, Euler Hermes and Allianz Research forecasts Sources: IMF, Euler Hermes and Allianz Research forecasts
Figure 5: Average cost of debt service per year in Africa (% of GDP)
Sources: French Development Agency, Euler Hermes, Allianz Research
0.0
1.0
2.0
3.0
4.0
5.0
6.0
7.0
8.0
07 08 09 10 11 12 13 14 15 16 17 18 19 20 21 22
AEs EMs LDCs
0.0
2.0
4.0
6.0
8.0
10.0
12.0
14.0
16.0
07 08 09 10 11 12 13 14 15 16 17 18 19 20 21 22
AEs EMs LDCs
0
2
4
6
8
10
12
Zam
bia
Ang
ola
Mau
ritan
ia
Cap
Ver
de
Gab
on
Djib
outi
Moz
ambi
que
Sene
gal
Cong
o R
ep
Cam
eroo
n
Gha
na
Key
na
Leso
tho
Ethi
opia
Ben
in
Gam
bia
Gui
nea-
Biss
au
Rw
anda
Côte
d'Iv
oire
2021-2025 average 2010-2019 average
6
The developing world could have more
than USD450bn in financing needs in
the medium run. The IMF estimates that
low-income countries need around
USD200bn to step up their spending
response to Covid-19, including for vac-
cinations, and to rebuild or maintain
foreign exchange reserves. An additio-
nal USD250-350bn would be required
to accelerate convergence with AEs
and offset the long-lasting scars of the
crisis. In the absence of a comprehen-
sive solution, heavy debt burdens may
generate permanent global divergence
between rich and poor countries.
Moreover, a global recovery that
leaves low-income countries behind
could fuel humanitarian crises, increa-
sing refugee flows and contributing to
the rise of terrorism and violence. In
addition, disorderly sovereign defaults
in EMs and LDCs may create a domino
effect that could destabilize financial
stability across the globe.
None of the initiatives currently on the
table will bring sufficient support to
cover the funding gaps of the deve-
loping world. In addition, it is still not
clear how to include Eurobond holders
and China into the restructuring talks.
The new USD650bn SDR allocation of
the IMF will be no game-changer. The
new USD650bn allocation of the IMF
currency, Special Drawing Rights (SDR),
will bring limited oxygen to countries in
need of liquidity. These new SDRs are
good news as they will add to countries’
international reserves, hence improving
liquidity positions and supporting credit
worthiness.
In addition, they can be exchanged for
hard currency to finance imports or
budget spending with the approval of
the IMF. The new allocation will im-
prove the international reserves of EMs
such as Turkey, South Africa, Nigeria,
Argentina, Pakistan and Sri Lanka by
around 10-20%.
Yet, the country allocation of SDRs has
followed the same rules since the
1970s, according to which the SDRs are
distributed in proportion to members’
quotas. Needless to say, rich countries
will receive the bulk of new SDR alloca-
tion (around 67%) while the USD650bn
SDR allocation would provide only
USD21bn in liquidity support to LDCs
and USD212bn to other EMs (excluding
China). The African continent will re-
ceive only USD34bn whereas its finan-
cing gap until 2023 is estimated at
around USD300bn. For comparison, the
IMF’s concessional lending provided
about USD13 billion in emergency fi-
nancing only in 2020. In the recent Paris
Summit, French President Macron cal-
led for AEs to donate or lend their SDRs
to other countries in need, namely
USD65bn as SDRs for Africa. Neverthe-
less, at present, such mechanisms that
would compel rich countries to transfer
their SDRs to poorer countries free of
cost do not exist. And amid the exit
from the sanitary crisis and ahead of
elections (Germany and France), politi-
cal priorities are likely to shift towards
domestic issues. In view of the imple-
mentation complexities and diverging
incentives of AEs, we believe this initia-
tive has limited chances to provide a
quick and significant solution to the
continent’s looming liquidity needs.
The G20/Paris Club Debt Service Sus-
pension Initiative (DSSI) covers a very
small portion of the debt-service
burden but at least has the merit of
bringing China into the restructuring
talks. The DSSI already provided
USD6bn in debt-service relief for 45
countries (out of over 70 eligible coun-
tries) in 2020 and is expected to deliver
up to USD7.3bn of additional debt-
service suspension through June 2021.
As the scope of the initiative was not
extended to EMs, countries such as Tu-
nisia or Gabon could not benefit. The
expected USD7.3bn relief with official
creditors covers a very small portion
of the debt-service burden of inter-
mediate income (over USD420bn) and
eligible countries (USD42bn) in 2020
(estimations of the IMF and the World
Bank). The main motivation of this ini-
tiative was to bring a “temporary” liqui-
dity relief from debt payments to offi-
cial creditors. It had the merit of brin-
ging together, for the first time, China,
G20 and Paris Club official creditors in
a coordinated debt-relief initiative. Yet,
as the participation of private creditors
was only on a voluntary basis, none of
them participated in the initiative.
A changing creditor landscape leaves
little room for debt forgiveness. The
Common Framework intends to bring a
“case by case”
solution for debt restructuring.
Based on a case by case approach, the
IMF-coordinated Com-mon Framework
aims at reaching debt re-profiling and
restructuring agree-ments under the
same conditions for all creditors.
Allianz Research
CURRENT DEBT RESTRUCTURING INITIATIVES WILL CONTINUE TO KICK THE CAN DOWN THE ROAD
7
The initiative has the ambi-tious goal of
extending the scope of relief beyond
the limited debt deferral available un-
der the DSSI to ensure "fair" burden-
sharing across all creditors, in-cluding
the private sector. The G20 launched
the “Common Framework for Debt
Treatments beyond the DSSI” in No-
vember 2020, with Chad becoming the
first country to join in January 2021,
followed by Zambia and Ethiopia.
The shift from traditional (con-
cessional) to private and commercial
debt complicates debt restructuring.
The Common Framework aims at offe-
ring the same restructuring terms to all
stakeholders. The main challenges for
its successful implementation relate to
coordination, transparency and accep-
tability. To ensure coordination of diffe-
rent stakeholders, the debt-negotiation
talks would need to bring together
(perhaps around the same table)
official creditors (international organi-
zations or state representatives), bon-
dholders and new creditors from EMs.
Importantly, the success of the initiative
would require information sharing with
full transparency on the stock and con-
ditionality of the existing debt. It may
be difficult to convince China and its
creditors to disclose this kind of strate-
gic information. Another complication
relates to China’s collateralized lending
with strategic assets: In these loans,
China enjoys a more senior status com-
pared to international organizations
such as the IMF, the World Bank and
other development banks. The collate-
ralized debt creates a “race to seniority”
of official stakeholders that compli-
cates debt-resolution negotiations in
case of a default or debt distress (for
example Zambia and Ethiopia). Moreo-
ver, loans from private Chinese banks
generally have cross-default clauses,
which also make them difficult to res-
tructure. The acceptability of these
debt-relief initiatives in AEs could be
jeopardized if China does not take a
sufficient part in the process2. Reaching
a common debt-restructuring agree-
ment with all creditors may also be
challenging from the borrower’s
viewpoint: Some bond issuers may not
want to default on bonds or internatio-
nal banks’ loans as they would fear the
negative impact on their sovereign ra-
tings. On the other hand, official credi-
tors would push for including private
lenders into bailouts to ensure “fair”
burden sharing.
Market access fears: seeking debt relief
is a double-edged sword for credit ra-
tings. Despite the relief that debt res-
tructuring brings for public finances, not
all countries are eager to ask for it. The
risk of credit rating downgrades and/or
a deterioration in market reputation
has prevented highly indebted coun-
tries like Kenya and Ghana3 from joi-
ning the initiative to reschedule private
sector liabilities. As expected, the initia-
tives to include private creditors into
debt-relief schemes qualifies as a
“selective default”, as seen in the
example of Ethiopia. The country’s
sovereign rating was downgraded to
“substantial risk” by rating agencies
following the announcement that it
would seek debt relief under the new
G20 Common Framework.
In the current international setting, we
do not expect a comprehensive solu-
tion to be reached in 2021 to offer a
way out for debt-ridden countries. Even
so, debt forgiveness tends to bring only
temporary relief while promoting pri-
vate-sector-led growth could be the
long-lasting solution. In the past, the
IMF-World Bank Heavily Indebted Poor
Countries (HIPC) Initiative and multiple
Paris Club agreements have showed
that debt forgiveness brings only tem-
porary financial relief to countries, wi-
thout tackling the underlying reasons of
unsustainable debt accumulation, a
trend that is echoed in the literature4.
Therefore, most sovereign debt default
episodes have been preceded by on
average two debt restructurings within
the same decade.
Since 2012, the HIPC initiative has pro-
vided partial or full debt relief to 39
countries. However, most of these coun-
tries piled up new debt quickly thereaf-
ter. In most of Africa, the countries’
indebtedness tripled in just 13 years
after the debt cancellation in 2006. The
root causes of unsustainable debt accu-
mulation in most developing countries
arise from a long list of structural fac-
tors: high exposure to commodity
cycles, weak fiscal revenue collection,
inefficient government spending, cor-
ruption and poor governance, low po-
tential growth due to shortfalls in hu-
man capital, infrastructure and energy
investment and finally high borrowing
and debt-servicing costs because of
high risk premiums. In this sense, propo-
sals like the “New Deal” for Africa from
the Paris Summit would offer a viable
solution to debt accumulation. The ini-
tiative aims at reallocating productive
resources towards high-value added
industrial sectors and setting the stage
for a private-sector led growth model.
Obviously, the successful implementa-
tion of this type of policy may take time
and requires overcoming the structural
obstacles listed above.
Expect a continued strong wave of
rating migrations going ahead
(2020 registered record numbers of
more than 30 sovereign downgrades
by both Moody’s and Fitch). The debt
relief and restructuring initiatives on the
table (IMF, G20, Paris Club, China in
some cases) – while being far from a
comprehensive, far-reaching and sus-
tainable solution – should help a num-
ber of countries to avoid default in the
next few years. In the next sections,
we will identify the main pockets of vul-
nerability.
2 Janet Yellen, the US secretary of the treasury, expressed in June 2021: "We would be very concerned to see the resources that are provided to these countries [with debt relief initiatives] used to repay Chinese debt. That would defeat the purpose of the programmes."
3 Some market access countries did not prefer asking for debt relief under the Common Framework as this would trigger a downgrade and put in danger their continued market financing which comes, unlike official loans, without policy conditionality.
4 For more information please see “External sovereign debt restructurings: Delay and replay” (https://voxeu.org/article/external-sovereign-debt-restructurings-delay-and-replay).
24 June 2021
8
Allianz Research
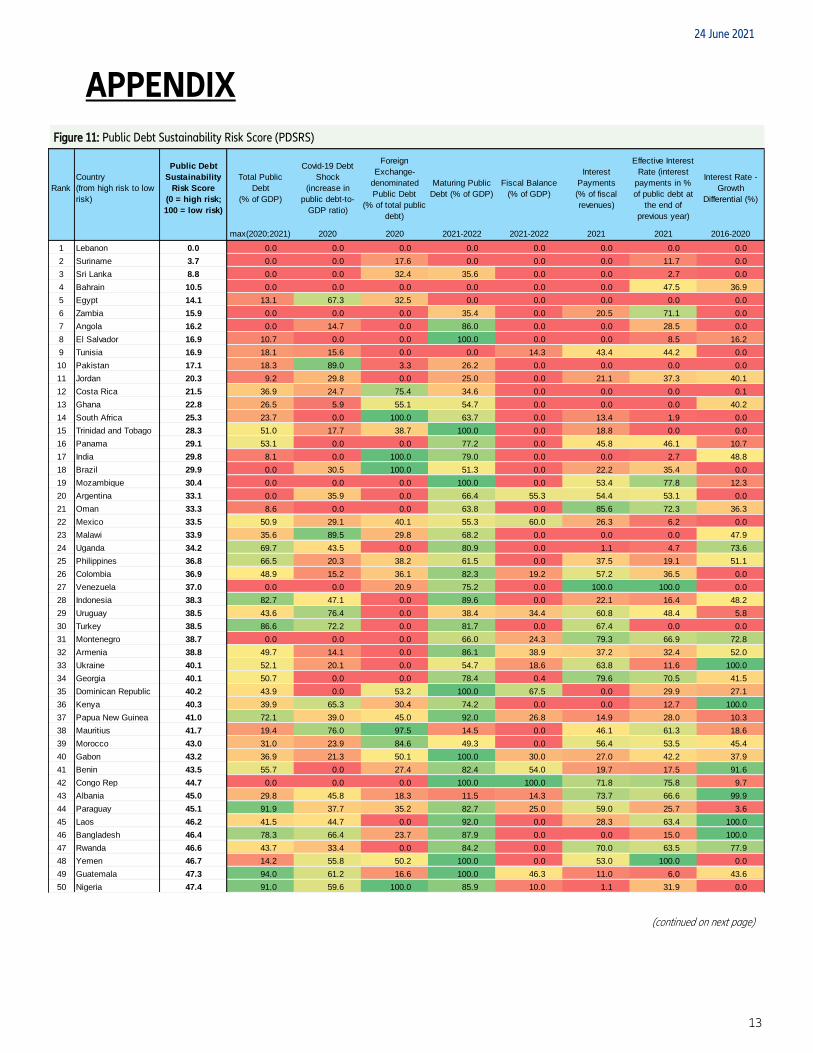
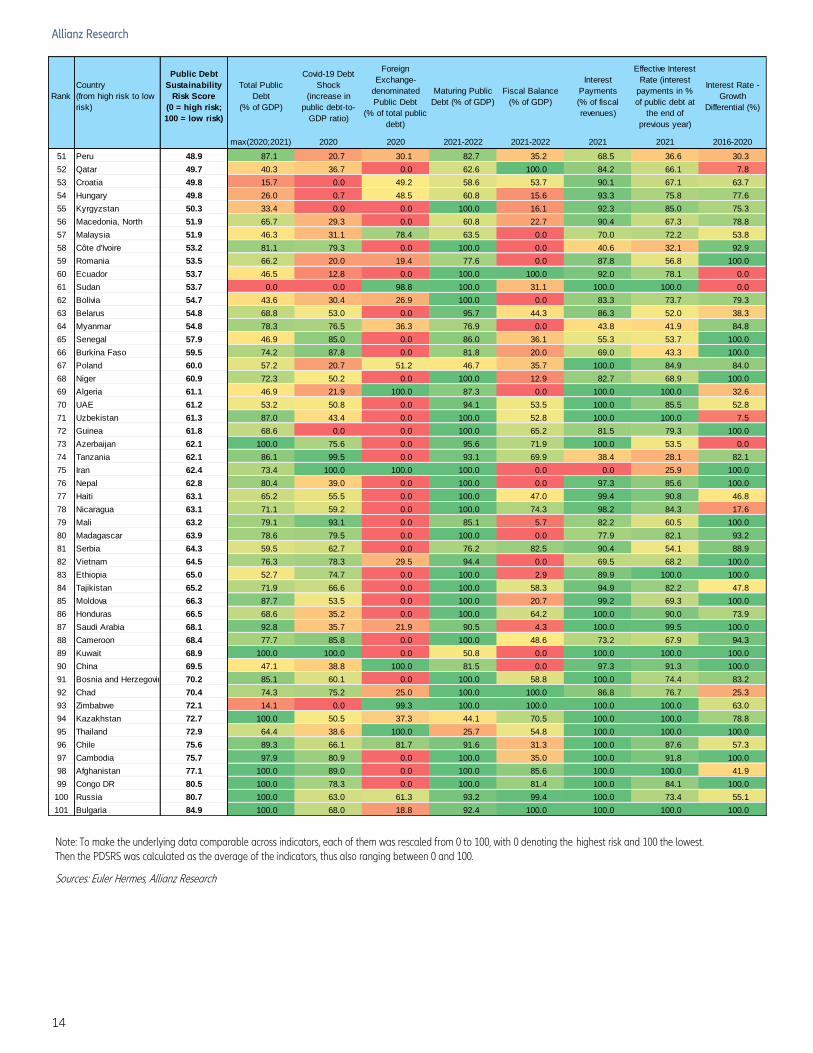
Fiscal vulnerabilities depend on both the level and composition of govern-ment debt. We analyze the sustainabili-ty of sovereign debt in 101 countries – 61 EMs and 40 LDCs.5 We calculate a Public Debt Sustainability Risk Score (PDSRS) for these markets in order to identify the most vulnerable ones that could be next in line to seek financial support and/or a debt restructuring or relief, or which may default on their sovereign debt. We apply a number of hard data combined with some forward-looking indicators based on our macroeconomic scenario.
The top 20 countries with the least sus-tainable public debt according to our analysis include seven economies each from Latin America and Africa and three each from the Middle East and Asia, though none from Emerging Europe (see Figure 11 in the Appendix for the complete scoreboard of our analysis). The top 20 ranking also includes four of the five countries that defaulted in 2020 – Lebanon, Suri-name, Zambia and Argentina.
Importantly, the top 20 riskiest include the heavyweight EMs Egypt, South Afri-ca, India and Brazil, as well as Pakistan, which are all included in the MSCI Emerging Market Index. India, Brazil and South Africa are expected to post large post-Covid-19 annual fiscal defi-cits that will certainly add to their alrea-dy high public debt burdens. Yet, these heavyweights should be able to avoid default in the next two years as most of their debt is domestic and they enjoy
manageable debt maturity structures. India should also experience solid no-minal GDP growth in the medium term, which should help contain the debt-to-GDP ratio. However, Egypt’s debt me-trics are a cause for serious concern, as they include a high level of foreign ex-change denominated public debt (39% of the total) and maturing public debt accounting for 15% of GDP in 2021-2022 (among the highest in our country sample). Moreover, the country’s inte-rest payments account for 40% of reve-nues, with an effective interest rate reaching 10%. Meanwhile, Pakistan continues to face strong debt distress: The country had an IMF Extended Fund Facility (EFF) program in place before Covid-19 that was disrupted by the pandemic and then paused for a year while it got support from the IMF’s Ra-pid Financing Instrument (RFI) and G20 debt suspension.
Sri Lanka is another Asian country with debt sustainability concerns. An IMF Extended Fund Facility (EFF) expired in 2020 and discussions on a RFI have not been completed to date due to di-sagreements over policy requirements from the IMF. To ease the liquidity ten-sions, the Sri Lankan authorities have concluded a USD1.5bn currency swap with China in the meantime.
Regarding Africa, we have furthermore identified Angola, Tunisia, Ghana and Mozambique as highly vul-nerable countries. Their debt-to-GDP ratios are exceeding 80% after the Co-vid-19 shock. Angola’s debt is currently
at unsustainable levels but the country will benefit from the G20 DSSI until the end of 2021 and has negotiated with China USD6.2bn in debt relief at the horizon of 2023. Angola lost market access in 2018 and received in June 2021 the final tranche (USD0.7bn) of the USD4.5bn facility (Emergency Assis-tance and EFF) agreed with the IMF. The Fund assesses the debt of Mozam-bique as in distress while the country continues to accumulate external debt service arrears, particularly on the “hidden loans” contracted with some international banks. The stock of exter-nal arrears on public and publicly gua-ranteed external debt service is above 10% of GDP. Ghana will face important rollover risks in 2022-2023 but the country was able to quickly return to Eurobond markets in early 2021. Final-ly, Tunisia’s public debt soared to over 90% of GDP after the pandemic due to the collapse of the tourism sector. While striking a deal with the IMF appears to be the only way out, political paralysis – a power struggle between the presi-dent, the prime minister and the frag-mented parliament – has made it im-possible to reach a loan agreement before summer. The country may need additional bilateral loans, potentially from the Middle East, to cover its short-term financing needs. However, as a young democracy, should a liquidity crisis ma-terialize, Tunisia is likely to benefit from the financial support of the internatio-nal community.
MEET THE TOP 20 EMS AT RISK
5 We have followed the classification of EMs and LDCs in the latest IMF Fiscal Monitor from April 2021 and added 21 EMs that are not included in the Fund’s publication. Our sample of 101 EMs and LDCs together with all AEs – which are not part of our analysis – account for 98% of global GDP.
9
In the Middle East we have Bahrain and Jordan in the top 20 riskiest list. Bahrain already ran out of fiscal policy buffers in 2017 and has since “survived”, thanks to financial support from Saudi Arabia and the UAE, wi-thout which it would be in default. Jor-dan’s public debt trajectory had de-teriorated already before Covid-19 – and got a boost through the latter – owing to a combination of many years of low growth and high fiscal deficits amid a rapidly growing population. Yet, an IMF support package and ongoing aid from the GCC should help Jordan to avoid a debt default or restructuring in the next two years.
El Salvador, Costa Rica, Trinidad & To-bago and Panama are additional Latin American countries on the debt sustai-nability watch list. All have a worrisome debt trajectory and relatively high inte-rest obligations, though near-term ma-turing public debt is not an immediate concern.
Meanwhile, Ecuador is not in the top 20 riskiest anymore. Following its sove-reign default last year it completed a USD17bn debt restructuring in August 2020, which has postponed its amor-tization payments to 2026. More-over, Ecuador’s debt metrics are rather mixed and not overall weak (see Figure 11 in the Appendix).
Nonetheless, the fully-dollarized coun-try7 defaulted last year as it could not serve debt falling due. This example shows that a multi-factor analysis of public debt sustainability such as our PDSRS may not identify all countries at risk of a debt default or restructuring as in some cases one or a few factors alone could trigger severe liquidity shortages that may lead to a default. Thus, in the following section, we look at some specific factors that may threaten debt sustai-nability.
24 June 2021
6 We derive the Pubic Debt Sustainability Risk Score (PDSRS) from a set of eight indicators: public debt (% of GDP), Covid-19 debt shock (increase in public debt-to-GDP ratio in pp), FX public debt (% of total public debt), maturing public debt in the next two years (% of GDP), fiscal balance (% of GDP), government interest payments (% of fiscal revenues), effective interest rate (interest payments in % of public debt at the end of previous year), and the interest rate-growth differential (pp). To make the data comparable across indicators, each of them was rescaled from 0 to 100, with 0 denoting the highest risk and 100 the lowest. Then the PDSRS was calculated as the average of the indicators, thus also ranging between 0 and 100.
7 For more information on Ecuador’s debt distress episodes, please see “Twenty years of official dollarization in Ecuador: a blessing or a curse?” (https://www.afd.fr/sites/afd/files/2020-09-04-23-15/official-dollarization-ecuador.pdf)
10
Allianz Research
THE DEVIL IS IN THE DETAILS
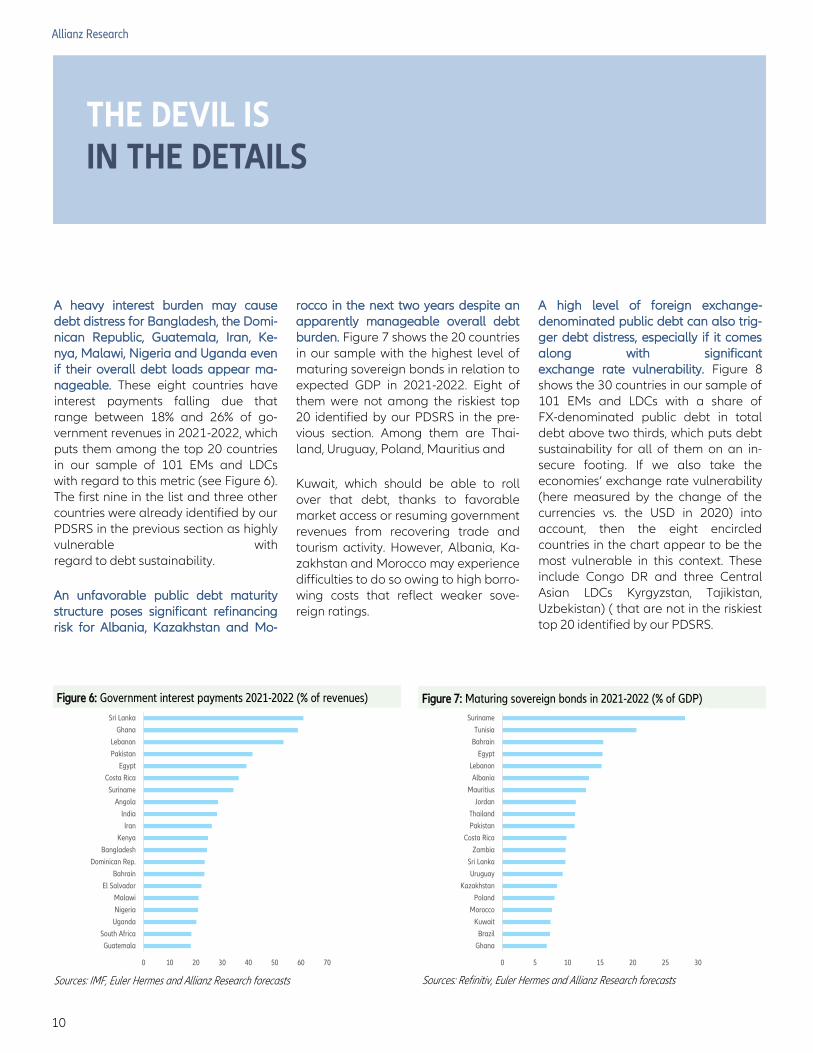
A heavy interest burden may cause debt distress for Bangladesh, the Domi-nican Republic, Guatemala, Iran, Ke-nya, Malawi, Nigeria and Uganda even if their overall debt loads appear ma-nageable. These eight countries have interest payments falling due that range between 18% and 26% of go-vernment revenues in 2021-2022, which puts them among the top 20 countries in our sample of 101 EMs and LDCs with regard to this metric (see Figure 6). The first nine in the list and three other countries were already identified by our PDSRS in the previous section as highly vulnerable with regard to debt sustainability.
An unfavorable public debt maturity structure poses significant refinancing risk for Albania, Kazakhstan and Mo-
rocco in the next two years despite an apparently manageable overall debt burden. Figure 7 shows the 20 countries in our sample with the highest level of maturing sovereign bonds in relation to expected GDP in 2021-2022. Eight of them were not among the riskiest top 20 identified by our PDSRS in the pre-vious section. Among them are Thai-land, Uruguay, Poland, Mauritius and
Kuwait, which should be able to roll over that debt, thanks to favorable market access or resuming government revenues from recovering trade and tourism activity. However, Albania, Ka-zakhstan and Morocco may experience difficulties to do so owing to high borro-wing costs that reflect weaker sove-reign ratings.
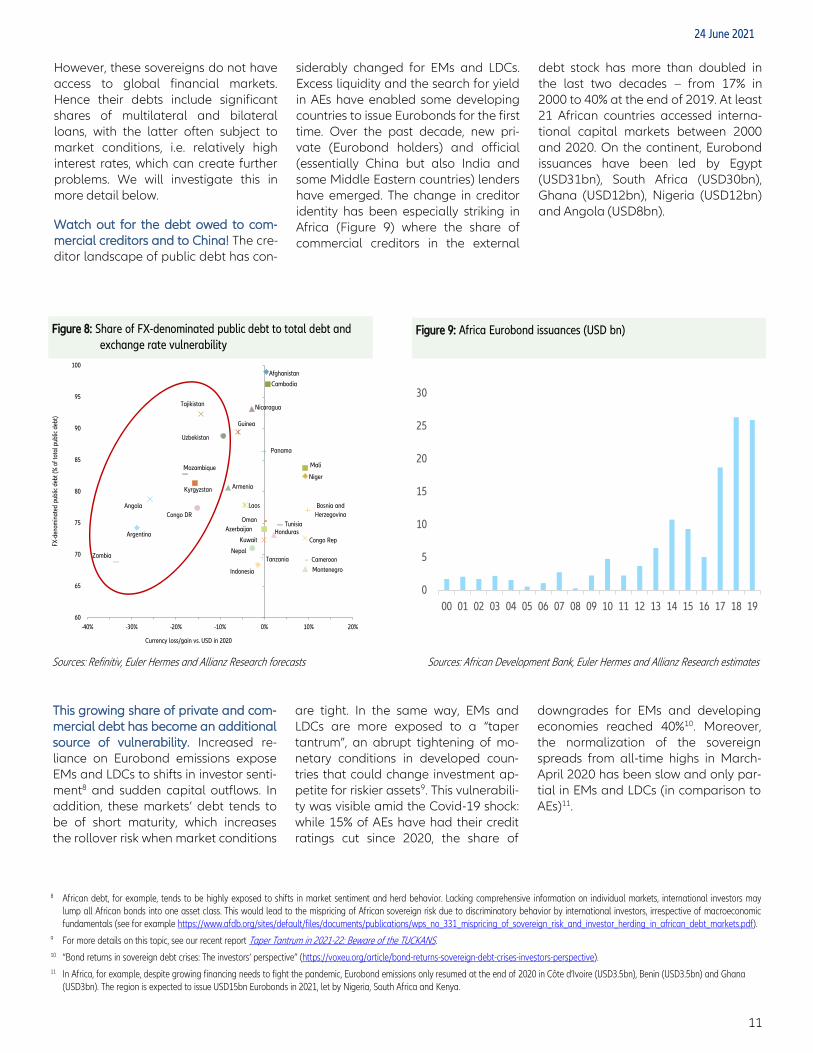
A high level of foreign exchange-denominated public debt can also trig-ger debt distress, especially if it comes along with significant exchange rate vulnerability. Figure 8 shows the 30 countries in our sample of 101 EMs and LDCs with a share of FX-denominated public debt in total debt above two thirds, which puts debt sustainability for all of them on an in-secure footing. If we also take the economies’ exchange rate vulnerability (here measured by the change of the currencies vs. the USD in 2020) into account, then the eight encircled countries in the chart appear to be the most vulnerable in this context. These include Congo DR and three Central Asian LDCs Kyrgyzstan, Tajikistan, Uzbekistan) ( that are not in the riskiest top 20 identified by our PDSRS.
0 10 20 30 40 50 60 70
Sri Lanka
Ghana
Lebanon
Pakistan
Egypt
Costa Rica
Suriname
Angola
India
Iran
Kenya
Bangladesh
Dominican Rep.
Bahrain
El Salvador
Malawi
Nigeria
Uganda
South Africa
Guatemala
Sources: IMF, Euler Hermes and Allianz Research forecasts
Figure 6: Government interest payments 2021-2022 (% of revenues) Figure 7: Maturing sovereign bonds in 2021-2022 (% of GDP)
0 5 10 15 20 25 30
Suriname
Tunisia
Bahrain
Egypt
Lebanon
Albania
Mauritius
Jordan
Thailand
Pakistan
Costa Rica
Zambia
Sri Lanka
Uruguay
Kazakhstan
Poland
Morocco
Kuwait
Brazil
Ghana
Sources: Refinitiv, Euler Hermes and Allianz Research forecasts
11
Figure 8: Share of FX-denominated public debt to total debt and exchange rate vulnerability
Figure 9: Africa Eurobond issuances (USD bn)
However, these sovereigns do not have access to global financial markets. Hence their debts include significant shares of multilateral and bilateral loans, with the latter often subject to market conditions, i.e. relatively high interest rates, which can create further problems. We will investigate this in more detail below.
Watch out for the debt owed to com-mercial creditors and to China! The cre-ditor landscape of public debt has con-
siderably changed for EMs and LDCs. Excess liquidity and the search for yield in AEs have enabled some developing countries to issue Eurobonds for the first time. Over the past decade, new pri-vate (Eurobond holders) and official (essentially China but also India and some Middle Eastern countries) lenders have emerged. The change in creditor identity has been especially striking in Africa (Figure 9) where the share of commercial creditors in the external
debt stock has more than doubled in the last two decades – from 17% in 2000 to 40% at the end of 2019. At least 21 African countries accessed interna-tional capital markets between 2000 and 2020. On the continent, Eurobond issuances have been led by Egypt (USD31bn), South Africa (USD30bn), Ghana (USD12bn), Nigeria (USD12bn) and Angola (USD8bn).
24 June 2021
Sources: Refinitiv, Euler Hermes and Allianz Research forecasts Sources: African Development Bank, Euler Hermes and Allianz Research estimates
This growing share of private and com-mercial debt has become an additional source of vulnerability. Increased re-liance on Eurobond emissions expose EMs and LDCs to shifts in investor senti-ment8 and sudden capital outflows. In addition, these markets’ debt tends to be of short maturity, which increases the rollover risk when market conditions
are tight. In the same way, EMs and LDCs are more exposed to a “taper tantrum”, an abrupt tightening of mo-netary conditions in developed coun-tries that could change investment ap-petite for riskier assets9. This vulnerabili-ty was visible amid the Covid-19 shock: while 15% of AEs have had their credit ratings cut since 2020, the share of
downgrades for EMs and developing economies reached 40%10. Moreover, the normalization of the sovereign spreads from all-time highs in March-April 2020 has been slow and only par-tial in EMs and LDCs (in comparison to AEs)11.
8 African debt, for example, tends to be highly exposed to shifts in market sentiment and herd behavior. Lacking comprehensive information on individual markets, international investors may lump all African bonds into one asset class. This would lead to the mispricing of African sovereign risk due to discriminatory behavior by international investors, irrespective of macroeconomic fundamentals (see for example https://www.afdb.org/sites/default/files/documents/publications/wps_no_331_mispricing_of_sovereign_risk_and_investor_herding_in_african_debt_markets.pdf).
9 For more details on this topic, see our recent report Taper Tantrum in 2021-22: Beware of the TUCKANS. 10 “Bond returns in sovereign debt crises: The investors’ perspective” (https://voxeu.org/article/bond-returns-sovereign-debt-crises-investors-perspective). 11 In Africa, for example, despite growing financing needs to fight the pandemic, Eurobond emissions only resumed at the end of 2020 in Côte d’Ivoire (USD3.5bn), Benin (USD3.5bn) and Ghana
(USD3bn). The region is expected to issue USD15bn Eurobonds in 2021, let by Nigeria, South Africa and Kenya.
0
5
10
15
20
25
30
00 01 02 03 04 05 06 07 08 09 10 11 12 13 14 15 16 17 18 19
Afghanistan
Cambodia
NicaraguaTajikistan
Guinea
Uzbekistan
Panama
MaliMozambique
Niger
Kyrgyzstan Armenia
Angola Laos
Congo DR
Bosnia and
HerzegovinaOman
Tunisia
ArgentinaAzerbaijan Honduras
Congo RepKuwait
NepalTanzania Cameroon
Zambia
Indonesia Montenegro
60
65
70
75
80
85
90
95
100
-40% -30% -20% -10% 0% 10% 20%
FX-d
enom
inat
ed p
ublic
deb
t (%
of t
otal
pub
lic d
ebt)
Currency loss/gain vs. USD in 2020
12
Allianz Research
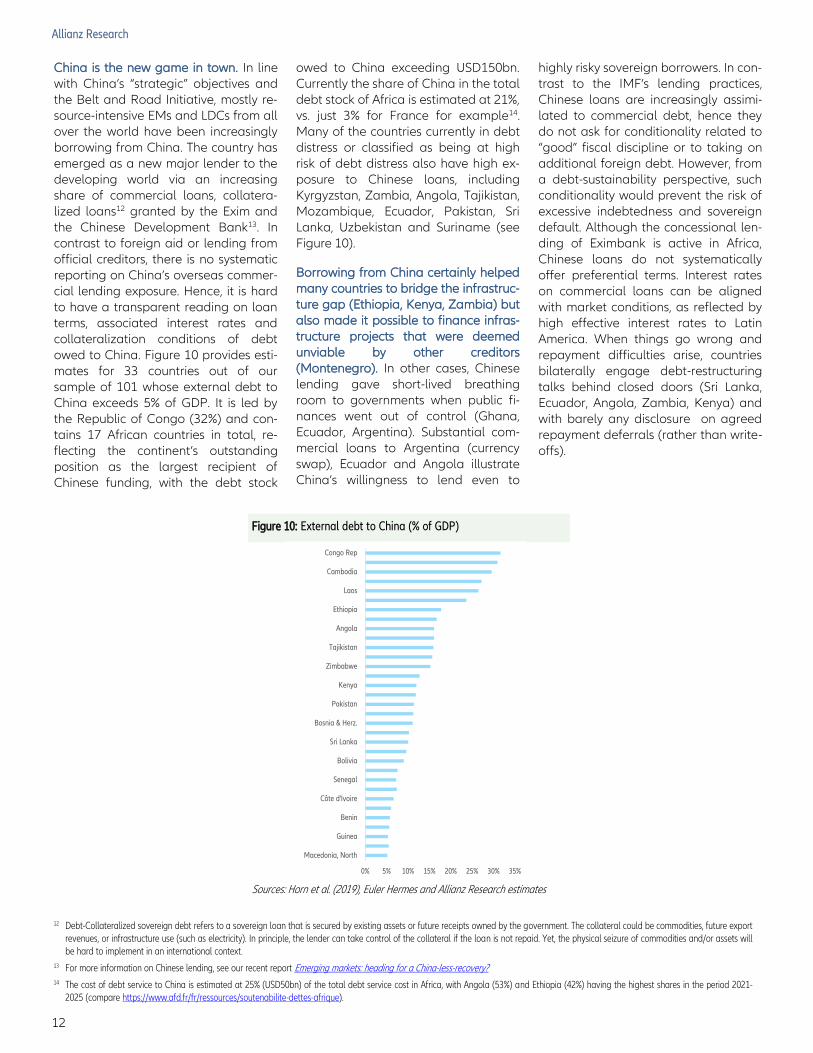
China is the new game in town. In line with China’s “strategic” objectives and the Belt and Road Initiative, mostly re-source-intensive EMs and LDCs from all over the world have been increasingly borrowing from China. The country has emerged as a new major lender to the developing world via an increasing share of commercial loans, collatera-lized loans12 granted by the Exim and the Chinese Development Bank13. In contrast to foreign aid or lending from official creditors, there is no systematic reporting on China’s overseas commer-cial lending exposure. Hence, it is hard to have a transparent reading on loan terms, associated interest rates and collateralization conditions of debt owed to China. Figure 10 provides esti-mates for 33 countries out of our sample of 101 whose external debt to China exceeds 5% of GDP. It is led by the Republic of Congo (32%) and con-tains 17 African countries in total, re-flecting the continent’s outstanding position as the largest recipient of Chinese funding, with the debt stock
owed to China exceeding USD150bn. Currently the share of China in the total debt stock of Africa is estimated at 21%, vs. just 3% for France for example14. Many of the countries currently in debt distress or classified as being at high risk of debt distress also have high ex-posure to Chinese loans, including Kyrgyzstan, Zambia, Angola, Tajikistan, Mozambique, Ecuador, Pakistan, Sri Lanka, Uzbekistan and Suriname (see Figure 10).
Borrowing from China certainly helped many countries to bridge the infrastruc-ture gap (Ethiopia, Kenya, Zambia) but also made it possible to finance infras-tructure projects that were deemed unviable by other creditors (Montenegro). In other cases, Chinese lending gave short-lived breathing room to governments when public fi-nances went out of control (Ghana, Ecuador, Argentina). Substantial com-mercial loans to Argentina (currency swap), Ecuador and Angola illustrate China’s willingness to lend even to
highly risky sovereign borrowers. In con-trast to the IMF’s lending practices, Chinese loans are increasingly assimi-lated to commercial debt, hence they do not ask for conditionality related to “good” fiscal discipline or to taking on additional foreign debt. However, from a debt-sustainability perspective, such conditionality would prevent the risk of excessive indebtedness and sovereign default. Although the concessional len-ding of Eximbank is active in Africa, Chinese loans do not systematically offer preferential terms. Interest rates on commercial loans can be aligned with market conditions, as reflected by high effective interest rates to Latin America. When things go wrong and repayment difficulties arise, countries bilaterally engage debt-restructuring talks behind closed doors (Sri Lanka, Ecuador, Angola, Zambia, Kenya) and with barely any disclosure on agreed repayment deferrals (rather than write-offs).
Sources: Horn et al. (2019), Euler Hermes and Allianz Research estimates
Figure 10: External debt to China (% of GDP)
12 Debt-Collateralized sovereign debt refers to a sovereign loan that is secured by existing assets or future receipts owned by the government. The collateral could be commodities, future export revenues, or infrastructure use (such as electricity). In principle, the lender can take control of the collateral if the loan is not repaid. Yet, the physical seizure of commodities and/or assets will be hard to implement in an international context.
13 For more information on Chinese lending, see our recent report Emerging markets: heading for a China-less-recovery? 14 The cost of debt service to China is estimated at 25% (USD50bn) of the total debt service cost in Africa, with Angola (53%) and Ethiopia (42%) having the highest shares in the period 2021-
2025 (compare https://www.afd.fr/fr/ressources/soutenabilite-dettes-afrique).
0% 5% 10% 15% 20% 25% 30% 35%
Congo Rep
Cambodia
Laos
Ethiopia
Angola
Tajikistan
Zimbabwe
Kenya
Pakistan
Bosnia & Herz.
Sri Lanka
Bolivia
Senegal
Côte d'Ivoire
Benin
Guinea
Macedonia, North
13
24 June 2021
APPENDIX
(continued on next page)
Figure 11: Public Debt Sustainability Risk Score (PDSRS)
Rank
Country
(from high risk to low
risk)
Public Debt
Sustainability
Risk Score
(0 = high risk;
100 = low risk)
Total Public
Debt
(% of GDP)
Covid-19 Debt
Shock
(increase in
public debt-to-
GDP ratio)
Foreign
Exchange-
denominated
Public Debt
(% of total public
debt)
Maturing Public
Debt (% of GDP)
Fiscal Balance
(% of GDP)
Interest
Payments
(% of fiscal
revenues)
Effective Interest
Rate (interest
payments in %
of public debt at
the end of
previous year)
Interest Rate -
Growth
Differential (%)
max(2020;2021) 2020 2020 2021-2022 2021-2022 2021 2021 2016-2020
1 Lebanon 0.0 0.0 0.0 0.0 0.0 0.0 0.0 0.0 0.0
2 Suriname 3.7 0.0 0.0 17.6 0.0 0.0 0.0 11.7 0.0
3 Sri Lanka 8.8 0.0 0.0 32.4 35.6 0.0 0.0 2.7 0.0
4 Bahrain 10.5 0.0 0.0 0.0 0.0 0.0 0.0 47.5 36.9
5 Egypt 14.1 13.1 67.3 32.5 0.0 0.0 0.0 0.0 0.0
6 Zambia 15.9 0.0 0.0 0.0 35.4 0.0 20.5 71.1 0.0
7 Angola 16.2 0.0 14.7 0.0 86.0 0.0 0.0 28.5 0.0
8 El Salvador 16.9 10.7 0.0 0.0 100.0 0.0 0.0 8.5 16.2
9 Tunisia 16.9 18.1 15.6 0.0 0.0 14.3 43.4 44.2 0.0
10 Pakistan 17.1 18.3 89.0 3.3 26.2 0.0 0.0 0.0 0.0
11 Jordan 20.3 9.2 29.8 0.0 25.0 0.0 21.1 37.3 40.1
12 Costa Rica 21.5 36.9 24.7 75.4 34.6 0.0 0.0 0.0 0.1
13 Ghana 22.8 26.5 5.9 55.1 54.7 0.0 0.0 0.0 40.2
14 South Africa 25.3 23.7 0.0 100.0 63.7 0.0 13.4 1.9 0.0
15 Trinidad and Tobago 28.3 51.0 17.7 38.7 100.0 0.0 18.8 0.0 0.0
16 Panama 29.1 53.1 0.0 0.0 77.2 0.0 45.8 46.1 10.7
17 India 29.8 8.1 0.0 100.0 79.0 0.0 0.0 2.7 48.8
18 Brazil 29.9 0.0 30.5 100.0 51.3 0.0 22.2 35.4 0.0
19 Mozambique 30.4 0.0 0.0 0.0 100.0 0.0 53.4 77.8 12.3
20 Argentina 33.1 0.0 35.9 0.0 66.4 55.3 54.4 53.1 0.0
21 Oman 33.3 8.6 0.0 0.0 63.8 0.0 85.6 72.3 36.3
22 Mexico 33.5 50.9 29.1 40.1 55.3 60.0 26.3 6.2 0.0
23 Malawi 33.9 35.6 89.5 29.8 68.2 0.0 0.0 0.0 47.9
24 Uganda 34.2 69.7 43.5 0.0 80.9 0.0 1.1 4.7 73.6
25 Philippines 36.8 66.5 20.3 38.2 61.5 0.0 37.5 19.1 51.1
26 Colombia 36.9 48.9 15.2 36.1 82.3 19.2 57.2 36.5 0.0
27 Venezuela 37.0 0.0 0.0 20.9 75.2 0.0 100.0 100.0 0.0
28 Indonesia 38.3 82.7 47.1 0.0 89.6 0.0 22.1 16.4 48.2
29 Uruguay 38.5 43.6 76.4 0.0 38.4 34.4 60.8 48.4 5.8
30 Turkey 38.5 86.6 72.2 0.0 81.7 0.0 67.4 0.0 0.0
31 Montenegro 38.7 0.0 0.0 0.0 66.0 24.3 79.3 66.9 72.8
32 Armenia 38.8 49.7 14.1 0.0 86.1 38.9 37.2 32.4 52.0
33 Ukraine 40.1 52.1 20.1 0.0 54.7 18.6 63.8 11.6 100.0
34 Georgia 40.1 50.7 0.0 0.0 78.4 0.4 79.6 70.5 41.5
35 Dominican Republic 40.2 43.9 0.0 53.2 100.0 67.5 0.0 29.9 27.1
36 Kenya 40.3 39.9 65.3 30.4 74.2 0.0 0.0 12.7 100.0
37 Papua New Guinea 41.0 72.1 39.0 45.0 92.0 26.8 14.9 28.0 10.3
38 Mauritius 41.7 19.4 76.0 97.5 14.5 0.0 46.1 61.3 18.6
39 Morocco 43.0 31.0 23.9 84.6 49.3 0.0 56.4 53.5 45.4
40 Gabon 43.2 36.9 21.3 50.1 100.0 30.0 27.0 42.2 37.9
41 Benin 43.5 55.7 0.0 27.4 82.4 54.0 19.7 17.5 91.6
42 Congo Rep 44.7 0.0 0.0 0.0 100.0 100.0 71.8 75.8 9.7
43 Albania 45.0 29.8 45.8 18.3 11.5 14.3 73.7 66.6 99.9
44 Paraguay 45.1 91.9 37.7 35.2 82.7 25.0 59.0 25.7 3.6
45 Laos 46.2 41.5 44.7 0.0 92.0 0.0 28.3 63.4 100.0
46 Bangladesh 46.4 78.3 66.4 23.7 87.9 0.0 0.0 15.0 100.0
47 Rwanda 46.6 43.7 33.4 0.0 84.2 0.0 70.0 63.5 77.9
48 Yemen 46.7 14.2 55.8 50.2 100.0 0.0 53.0 100.0 0.0
49 Guatemala 47.3 94.0 61.2 16.6 100.0 46.3 11.0 6.0 43.6
50 Nigeria 47.4 91.0 59.6 100.0 85.9 10.0 1.1 31.9 0.0
14
Allianz Research
Note: To make the underlying data comparable across indicators, each of them was rescaled from 0 to 100, with 0 denoting the highest risk and 100 the lowest. Then the PDSRS was calculated as the average of the indicators, thus also ranging between 0 and 100.
Sources: Euler Hermes, Allianz Research
Rank
Country
(from high risk to low
risk)
Public Debt
Sustainability
Risk Score
(0 = high risk;
100 = low risk)
Total Public
Debt
(% of GDP)
Covid-19 Debt
Shock
(increase in
public debt-to-
GDP ratio)
Foreign
Exchange-
denominated
Public Debt
(% of total public
debt)
Maturing Public
Debt (% of GDP)
Fiscal Balance
(% of GDP)
Interest
Payments
(% of fiscal
revenues)
Effective Interest
Rate (interest
payments in %
of public debt at
the end of
previous year)
Interest Rate -
Growth
Differential (%)
max(2020;2021) 2020 2020 2021-2022 2021-2022 2021 2021 2016-2020
51 Peru 48.9 87.1 20.7 30.1 82.7 35.2 68.5 36.6 30.3
52 Qatar 49.7 40.3 36.7 0.0 62.6 100.0 84.2 66.1 7.8
53 Croatia 49.8 15.7 0.0 49.2 58.6 53.7 90.1 67.1 63.7
54 Hungary 49.8 26.0 0.7 48.5 60.8 15.6 93.3 75.8 77.6
55 Kyrgyzstan 50.3 33.4 0.0 0.0 100.0 16.1 92.3 85.0 75.3
56 Macedonia, North 51.9 65.7 29.3 0.0 60.8 22.7 90.4 67.3 78.8
57 Malaysia 51.9 46.3 31.1 78.4 63.5 0.0 70.0 72.2 53.8
58 Côte d'Ivoire 53.2 81.1 79.3 0.0 100.0 0.0 40.6 32.1 92.9
59 Romania 53.5 66.2 20.0 19.4 77.6 0.0 87.8 56.8 100.0
60 Ecuador 53.7 46.5 12.8 0.0 100.0 100.0 92.0 78.1 0.0
61 Sudan 53.7 0.0 0.0 98.8 100.0 31.1 100.0 100.0 0.0
62 Bolivia 54.7 43.6 30.4 26.9 100.0 0.0 83.3 73.7 79.3
63 Belarus 54.8 68.8 53.0 0.0 95.7 44.3 86.3 52.0 38.3
64 Myanmar 54.8 78.3 76.5 36.3 76.9 0.0 43.8 41.9 84.8
65 Senegal 57.9 46.9 85.0 0.0 86.0 36.1 55.3 53.7 100.0
66 Burkina Faso 59.5 74.2 87.8 0.0 81.8 20.0 69.0 43.3 100.0
67 Poland 60.0 57.2 20.7 51.2 46.7 35.7 100.0 84.9 84.0
68 Niger 60.9 72.3 50.2 0.0 100.0 12.9 82.7 68.9 100.0
69 Algeria 61.1 46.9 21.9 100.0 87.3 0.0 100.0 100.0 32.6
70 UAE 61.2 53.2 50.8 0.0 94.1 53.5 100.0 85.5 52.8
71 Uzbekistan 61.3 87.0 43.4 0.0 100.0 52.8 100.0 100.0 7.5
72 Guinea 61.8 68.6 0.0 0.0 100.0 65.2 81.5 79.3 100.0
73 Azerbaijan 62.1 100.0 75.6 0.0 95.6 71.9 100.0 53.5 0.0
74 Tanzania 62.1 86.1 99.5 0.0 93.1 69.9 38.4 28.1 82.1
75 Iran 62.4 73.4 100.0 100.0 100.0 0.0 0.0 25.9 100.0
76 Nepal 62.8 80.4 39.0 0.0 100.0 0.0 97.3 85.6 100.0
77 Haiti 63.1 65.2 55.5 0.0 100.0 47.0 99.4 90.8 46.8
78 Nicaragua 63.1 71.1 59.2 0.0 100.0 74.3 98.2 84.3 17.6
79 Mali 63.2 79.1 93.1 0.0 85.1 5.7 82.2 60.5 100.0
80 Madagascar 63.9 78.6 79.5 0.0 100.0 0.0 77.9 82.1 93.2
81 Serbia 64.3 59.5 62.7 0.0 76.2 82.5 90.4 54.1 88.9
82 Vietnam 64.5 76.3 78.3 29.5 94.4 0.0 69.5 68.2 100.0
83 Ethiopia 65.0 52.7 74.7 0.0 100.0 2.9 89.9 100.0 100.0
84 Tajikistan 65.2 71.9 66.6 0.0 100.0 58.3 94.9 82.2 47.8
85 Moldova 66.3 87.7 53.5 0.0 100.0 20.7 99.2 69.3 100.0
86 Honduras 66.5 68.6 35.2 0.0 100.0 64.2 100.0 90.0 73.9
87 Saudi Arabia 68.1 92.8 35.7 21.9 90.5 4.3 100.0 99.5 100.0
88 Cameroon 68.4 77.7 85.8 0.0 100.0 48.6 73.2 67.9 94.3
89 Kuwait 68.9 100.0 100.0 0.0 50.8 0.0 100.0 100.0 100.0
90 China 69.5 47.1 38.8 100.0 81.5 0.0 97.3 91.3 100.0
91 Bosnia and Herzegovina 70.2 85.1 60.1 0.0 100.0 58.8 100.0 74.4 83.2
92 Chad 70.4 74.3 75.2 25.0 100.0 100.0 86.8 76.7 25.3
93 Zimbabwe 72.1 14.1 0.0 99.3 100.0 100.0 100.0 100.0 63.0
94 Kazakhstan 72.7 100.0 50.5 37.3 44.1 70.5 100.0 100.0 78.8
95 Thailand 72.9 64.4 38.6 100.0 25.7 54.8 100.0 100.0 100.0
96 Chile 75.6 89.3 66.1 81.7 91.6 31.3 100.0 87.6 57.3
97 Cambodia 75.7 97.9 80.9 0.0 100.0 35.0 100.0 91.8 100.0
98 Afghanistan 77.1 100.0 89.0 0.0 100.0 85.6 100.0 100.0 41.9
99 Congo DR 80.5 100.0 78.3 0.0 100.0 81.4 100.0 84.1 100.0
100 Russia 80.7 100.0 63.0 61.3 93.2 99.4 100.0 73.4 55.1
101 Bulgaria 84.9 100.0 68.0 18.8 92.4 100.0 100.0 100.0 100.0

15
OUR TEAM
16
RECENT PUBLICATIONS
Discover all our publications on our websites: Allianz Research and Euler Hermes Economic Research
23/06/2021 Allianz Pulse 2021: Old beliefs die hard
17/06/2021 Boom or bust? The Covid-19 crisis emphasizes wider fertility challenges
15/06/2021 US yields: Where the music plays
11/06/2021 G7 corporate tax deal: Who is winning, who is losing?
09/06/2021 Grand reopening: new opportunities, old risks
02/06/2021 European corporates: It could take 5 years to offload Covid-19 debt
31/05/2021 The flaw in the liquidity paradigm: lessons from China
27/05/2021 French export barometer: 8 out of 10 companies aim to increase exports in 2021
26/05/2021 Semiconductors realpolitik : A reality check for Europe
20/05/2021 Eurozone government debt—Quo vadis from here?
19/05/2021 Abolishing fuel subsidies in a green and just transition
14/05/2021 Drivers of growth: Property and casualty insurance
12/05/2021 Global Insurance Report 2021
07/05/2021 Pricing superpowers: Which sectors have them in the Eurozone?
05/05/2021 Germany´s constitutional court: Reincarnation under the climate veil of ignorance
29/04/2021 European households: The double dividend of excess savings
26/04/2021 Equity markets: in search of Goldilocks' inflation
22/04/2021 Investment is back: Harder, better, faster, stronger?
19/04/2021 European Corporates: Cash-rich sectors get richer
15/04/2021 Demystifying the four horsemen of the inflation apocalypse
12/04/2021 Taper Tantrum in 2021-22: Beware of the TUCKANS
07/04/2021 Unleashing excess foreign exchange reserves to boost growth in Latin America
06/04/2021 Joe Biden's infrastructure plan: defying gravity
01/04/2021 Race to the post Covid-19 recovery: 7 obstacles to overcome
26/03/2021 The Suez Canal ship isn't the only thing clogging global trade
23/03/2021 The Hotel California effect: European hospitality sector looking for people who stay
22/03/2021 China's policy mix: "proactive" and "prudent" in name, tightening in practice
17/03/2021 Show me the money: debunking a couple of myths about excess liquidity
15/03/2021 The irony of Biden's super stimulus: USD360bn for exporters around the world
11/03/2021 Commodities: higher demand, supply bottlenecks, but no speculation (yet)
08/03/2021 US yield: Let's twist again?
17
FORWARD-LOOKING STATEMENTS
The statements contained herein may include prospects, statements of future expectations and other forward -looking
statements that are based on management's current views and assumptions and involve known and unknown risks and
uncertainties. Actual results, performance or events may differ materially from those expressed or implied in such forward -
looking statements.
Such deviations may arise due to, without limitation, (i) changes of the general economic conditions and competitive situa-
tion, particularly in the Allianz Group's core business and core markets, (ii) performance of financial markets (particularly
market volatility, liquidity and credit events), (iii) frequency and severity of insured loss events, including from natural ca-
tastrophes, and the development of loss expenses, (iv) mortality and morbidity levels and trends, (v) persistency levels, (vi )
particularly in the banking business, the extent of credit defaults, (vii) interest rate levels, (viii) currency exchange rat es
including the EUR/USD exchange rate, (ix) changes in laws and regulations, including tax regulations, (x) the impact of
acquisitions, including related integration issues, and reorganization measures, and (xi) general competitive factors, in
each case on a local, regional, national and/or global basis. Many of these factors may be more likely to occur, or more
pronounced, as a result of terrorist activities and their consequences.
NO DUTY TO UPDATE
The company assumes no obligation to update any information or forward -looking statement contained herein, save for
any information required to be disclosed by law.
Director of Publications: Ludovic Subran, Chief Economist
Allianz and Euler Hermes
Phone +49 89 3800 7859
Allianz Research
https://www.allianz.com/en/economic_research
Euler Hermes Economic Research
http://www.eulerhermes.com/economic-research
Königinstraße 28 | 80802 Munich | Germany
1 Place des Saisons | 92048 Paris-La-Défense Cedex | France
allianz
@allianz
euler-hermes
@eulerhermes