emerging onto a still wider stage
TRANSCRIPT

Emerging onto a Still Wider Stage
Revision of Numerical Targets in Medium-Term Management Plan
Ortus Stage 2February 8, 2019
* Ortus: A Latin word meaning “beginning and birth”

Contents
Background to the Revisions to Numerical Targets
Progress Report on Medium-Term Management Plan Ortus Stage 2
State of Progress
Strategic Direction
Key Issues and Results to Date
Cost Reduction Activities at Production & Logistics Division
Expansion of On-site Business in Southeast Asia
Acquisition of Europe Business
Acquisition of U.S. HyCO Business
Revisions to the Numerical Targets of the Medium-Term Management Plan Ortus Stage 2
Preconditions and Definitions
Numerical Targets
Financial Strategy
Revised Investment Plan
Envisaged Stronger Financial Position
Ortus Stage 2
Background to the Revisions to Numerical Targets

Background to the Revisions to Numerical Targets
Medium-Term Management Plan Ortus Stage 2
With the merger of German company Linde (currently Linde AG) and U.S. company Praxair, TNSC has acquired Praxair’s European business and carries forward the procedures of acquisition of Linde’s U.S. HyCO business. Through these two large-scale acquisitions, TNSC’s business scale will expand significantly. We have therefore revised the numerical targets for the final year of the medium-term management plan Ortus Stage 2, the fiscal year ending March 31, 2021.
(Four-year plan spanning FYE 2018 to FYE 2021)
4
Gas business in Japan
Gas business in the U.S.
Gas business in Asia and Oceania
Thermos business
Existing Businesses Acquired Businesses
Europe business(acquired
from Praxair)HyCO business
(plan to acquire from Linde)
Gas business in the U.S.

Ortus Stage 2
Medium-Term Management Plan
Ortus Stage 2
Progress Report

581.5 620.0 646.2
735.0
0.0
800.0
1,000.0
54.7 56.5 60.066.5
760
76.0
Operating income
(Billions of yen)
FYE2017 Actual (IFRS)
FYE2018 Target (IFRS)
FYE2018 Actual (IFRS)
FYE2019 Forecast (IFRS)
FYE2021 Projection
(IFRS)
Long-Term Vision
Revenue 581.5 620.0 646.2 735.0 800.0
Core operating income 54.7 56.5 60.0 66.5 76.0
Core operating income ratio 9.4% 9.1% 9.3% 9.0% 9.5%
Overseas revenue ratio 40.8% - 43.3% 47.2% 45.0%
ROCE* 8.4% 7.9% 8.4% 6.3% 9.0%
Revenue(Billions of yen)
Final fiscal year of Ortus Stage 1
Final fiscal year of Ortus Stage 1
* ROCE (Return on capital employed) = Core operating income / Outstanding Interest-bearing Debt + Equity attributable to owners of parent* Core operating income is calculated as operating income excluding certain gains and expenses attributable to non-recurring factors (non-recurring items).* Nonrecurring items are costs of structural reform (cost for withdrawal or downsizing business operations and special retirement allowances), losses caused
by disasters or serious accidents, and other gains and expenses (such as disposal of idling assets).
State of ProgressContinuing on from the previous medium-term management plan, Ortus Stage 1, we are making good progress overall on our targets for the second year in our current medium-term management plan, Ortus Stage 2. We will therefore continue the basic policies and key strategies set out when the plan was formulated.
6

Strategic Direction
Safety, Quality, and Compliance
Accelerating
R&D Strategy
Strengthening
Corporate Functions
Expanding Domestic
Gas Business
Globalization
Reinforce Operating Foundation
Growth Strategies
3. Globalization 4.M&A
1. Structural Reform
Strengthen collaborationin the sales and marketing functions
Integration of engineering functions
Integration of production & logistics
Promotion of shared services
Maximizing group power by augmenting collaboration
Strengthen the functions of global operations
Strengthen the functions of regional holding companies
Expanding business areas
Total Electronics
Enhancement of governance
Growth Strategies
Expand business territory and reinforce operational density
Acquiring new products, technologies, and supply chains
Expansion of medical business
Seek promising M&A opportunities to ensure sustainability and accelerate growth
Basic Policy Key Strategies
2. Innovation
Innovation in R&D
Innovation in engineering
Innovation in sales approaches
Innovation in production & logistics
Promote innovation by capitalizing on external resources and IoT
7
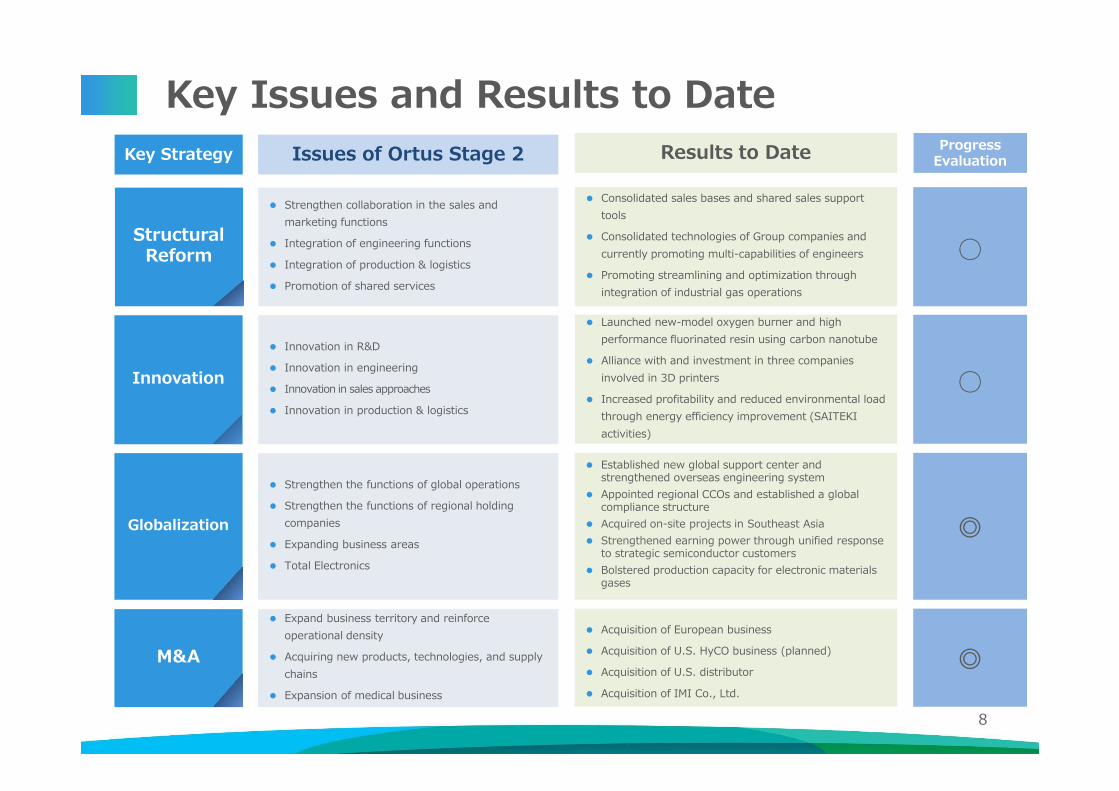
Issues of Ortus Stage 2
Key Issues and Results to Date
Strengthen collaboration in the sales and
marketing functions
Integration of engineering functions
Integration of production & logistics
Promotion of shared services
Innovation in R&D
Innovation in engineering
Innovation in sales approaches
Innovation in production & logistics
Innovation
Strengthen the functions of global operations
Strengthen the functions of regional holding
companies
Expanding business areas
Total Electronics
Globalization
Expand business territory and reinforce
operational density
Acquiring new products, technologies, and supply
chains
Expansion of medical business
M&A
Key Strategy
Structural Reform
Consolidated sales bases and shared sales support
tools
Consolidated technologies of Group companies and
currently promoting multi-capabilities of engineers
Promoting streamlining and optimization through
integration of industrial gas operations
Launched new-model oxygen burner and high
performance fluorinated resin using carbon nanotube
Alliance with and investment in three companies
involved in 3D printers
Increased profitability and reduced environmental load
through energy efficiency improvement (SAITEKI
activities)
Established new global support center and strengthened overseas engineering system
Appointed regional CCOs and established a global compliance structure
Acquired on-site projects in Southeast Asia
Strengthened earning power through unified response to strategic semiconductor customers
Bolstered production capacity for electronic materials gases
Acquisition of European business
Acquisition of U.S. HyCO business (planned)
Acquisition of U.S. distributor
Acquisition of IMI Co., Ltd.
Results to Date Progress Evaluation
○
○
◎
◎
8
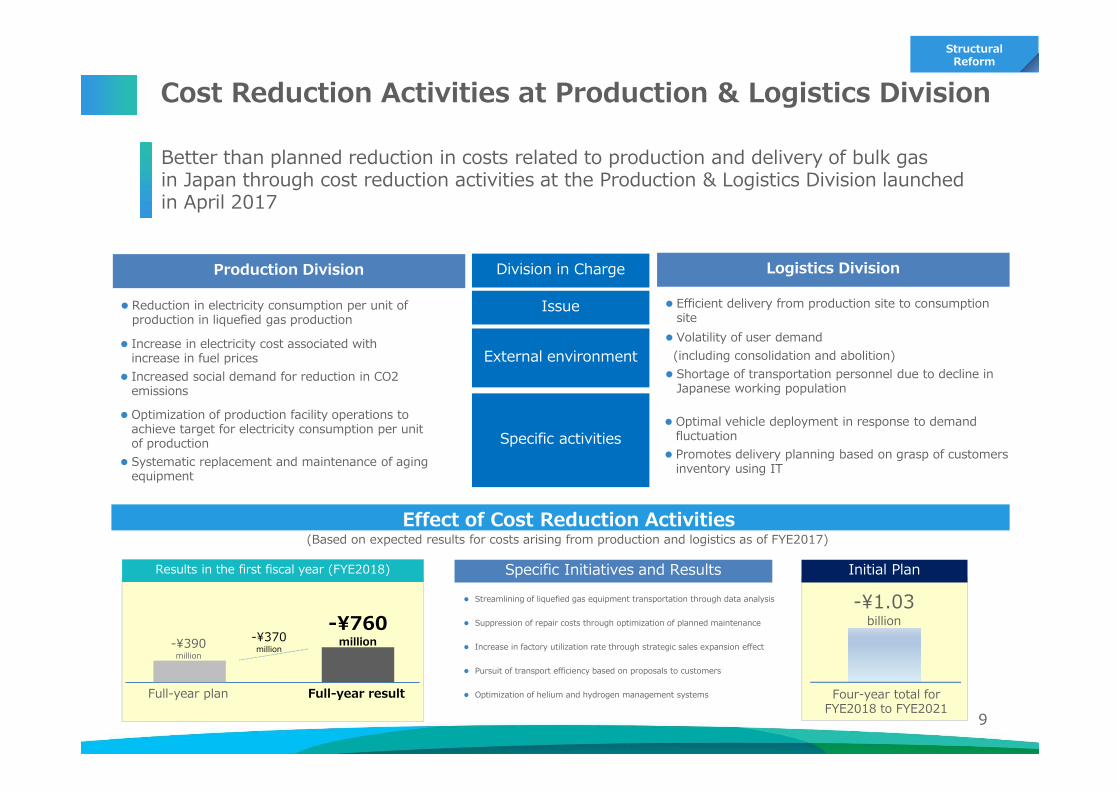
Cost Reduction Activities at Production & Logistics Division
Specific activities
Logistics Division
Issue
External environment
Better than planned reduction in costs related to production and delivery of bulk gas in Japan through cost reduction activities at the Production & Logistics Division launched in April 2017
Initial Plan
Effect of Cost Reduction Activities
Efficient delivery from production site to consumption site
Volatility of user demand
(including consolidation and abolition)
Shortage of transportation personnel due to decline in Japanese working population
Optimal vehicle deployment in response to demand fluctuation
Promotes delivery planning based on grasp of customers inventory using IT
Production Division
Reduction in electricity consumption per unit of production in liquefied gas production
Increase in electricity cost associated with increase in fuel prices
Increased social demand for reduction in CO2 emissions
Optimization of production facility operations to achieve target for electricity consumption per unit of production
Systematic replacement and maintenance of aging equipment
Division in Charge
Results in the first fiscal year (FYE2018)
-¥390 million
Full-year plan
Structural Reform
9
Full-year result
-¥760 million
-¥1.03 billion
(Based on expected results for costs arising from production and logistics as of FYE2017)
Four-year total for FYE2018 to FYE2021
-¥370 million
Streamlining of liquefied gas equipment transportation through data analysis
Suppression of repair costs through optimization of planned maintenance
Increase in factory utilization rate through strategic sales expansion effect
Pursuit of transport efficiency based on proposals to customers
Optimization of helium and hydrogen management systems
Specific Initiatives and Results

Expansion of On-site Business in Southeast AsiaGlobalization
Capture new on-site projects and establish a robust supply chain in the industrial gas markets of rapidly growing Vietnam and the Philippines
10
Vietnam Philippines
Southeast Asia
Hanoi
Manila
①ASU for foreign-affiliated metal manufacturers
②ASU for LSP
④ASU for foreign-affiliated
semiconductor manufacturers
Main supply customer
Foreign-affiliated metal manufacturers and chemical manufacturers
Completion Facility completion planned for middle–end of 2019
Investment objective
Build a stable revenue base in piped supply
Expand production capacity for air separation gas①
Long Son Petrochemicals (Thai petrochemical manufacturer)
稼動時期 2021 (planned)
Build a stable revenue base in piped supply
Expand production capacity for air separation gas②
Foreign-affiliated electronic component manufacturers
Unit 1: December 2017
Build a stable revenue base in piped supply
Expand production capacity for nitrogen gas③
③ASU for foreign-affiliated electronic
components manufacturers
Foreign-affiliated semiconductor manufacturers
Facility completion planned for second half of 2019
Strengthen supply system for semiconductor and electronic component manufacturers
Expand production capacity for nitrogen gas ④
*ASU: Air Separation Unit
Supplycustomer
Completion
Investment objective
Supplycustomer
Operation start
Investment objective
supply customer
Operation start
Investment objective

Acquisition of European Business
11
Aim to achieve the final-year targets for medium-term management plan Ortus Stage 2 and to progress further as a global industrial gas major.
Scope of the businesses to be acquired
The acquisition covers companies engaged in the industrial gas business of U.S. company Praxair in 12 European countries (including the carbon dioxide gas business) and companies engaged in helium-related businesses. The businesses acquired hold a market share of 16% throughout their market areas, with a scale comparable to the U.S. business which has been developed for over 30 years.
Post-merger integration(PMI) strategy
Consolidated management performance of the acquired businesses
The business is highly profitable including a certain scale in Bulk and Piping as well as a stable competitive environment in the European market
Net sales: €1,440 million (approx. ¥180.0 billion*)
Core operating income: €224 million (approx. ¥28.0 billion*)*Converted at the exchange rate of one Euro to ¥125
(FYE2021 forecast)
Strengthen Group-wide collaboration (across Japan, the U.S., Asia, and Europe) and governance
Strengthen the Customer Relationship Management through global business network of TNSC group
Optimize supply chain of strategic products
Significance of the acquisition
Acquired businesses with a certain scale in Europe, the world's second largest industrial gas market behind the U.S.
The businesses acquired are highly profitable, with a 16% share of their market areas* (internal estimate)
Acquired talented personnel, including the current top management team, and business platforms
*In U.K., Ireland, the Netherlands and France, the scope of the businesses acquired is limited only the carbon dioxide gas business.
Globalization

Acquisition of European Business – Business Plan
12
Establish Nippon Gases Euro-Holding S.L.U. in Spain as a regional headquarters for Europe and establish a governance system for the operating companies under it.
Business strategy (overview)
0
500
1,000
1,500
2,000
FYE2019* FYE2020 FYE2021 FYE2022 FYE2023 FYE2024
*FYE2019 is the cumulative total of four months from December 2018 to March 2019.
Net sales (Millions of euros)
Envisaging CAGR (compound annual growth rate) of approximately 3.8%
<Basic approach>・Entrust business management to the existing senior
management of the acquired companies and stably grow existing business in Europe
Business areas and assets held
Sweden
Norway
Denmark
GermanyNetherlands
Belgium
Italy
France
U.K.Ireland
Spain
Portugal
Globalization
・Leverage synergies (use the total capabilities of theGroup, develop strategic products), and plan to achieve CAGR of around 3.8% over the next five years

Acquisition of U.S. HyCO business
13
Based on the key strategy of “Innovation,” TNSC is aiming to expand the gas technology domain using M&As. TNSC carries forward the procedures of acquisition of the U.S. HyCObusiness from Germany-based Linde and strengthen its proposal capabilities for customers with enhancements to its product lineup.
Business model of the HyCO business
Separate hydrogen and carbon monoxide from feedstock such as natural gas using steam methane reforming (SMR) systems and supply it to the petroleum refining and petrochemical industries through pipelines, primarily for use in the desulfurization process.
SMR-type HyCO plants
On-site gas users
(Large usage volume)
On-site gas users
(Large usage volume)
Natural gas, etc.
Primarily petroleum refining and petrochemical industries
H2/CO
Supplied via pipeline(Conclude long-term supply contract)
In Japan, users in the petroleum refining and petrochemical industries internally produce and consume H2 and CO. Considering this business structure, industrial gas manufacturers have not entered this business.
Post-merger integration (PMI) strategy
Assets to be acquired
The acquisition covers SMR-type HyCO plants (five sites), pipelines, remote monitoring centers, supply agreements, operation technologies and human resources in the HyCO business currently undertaken by Germany-based Linde in the U.S.
Significance of the acquisition
Achieve full-scale entry into the HyCO business in the U.S.
Steadily generate strong earnings from on-site supply agreements for H2 and CO
Acquire resources that will facilitate efficient operation of the business
Strengthen the ability to offer proposals that will capture demand for new on-site projects in the U.S. (petroleum refining and petrochemicals, etc.)
Globalization

Ortus Stage 2
Medium-Term Management Plan
Ortus Stage 2
Revision of Numerical Targets

Preconditions and Definitions
15
Glossary Preconditions and Definitions in this Presentation
PPA(Purchase Price Allocation)
Allocation of the purchase price in an M&A transactionThe provisional result (pre-audit) of the PPA for the acquisition of the European business has been reflected in this numerical target revision. The purchase price has been allocated using the market value of property, plant and equipment (primarily ASUs) and intangible assets (mainly intangible assets related to customers), and so forth. The balance that cannot be allocated is treated as goodwill. The revised core operating income target includes depreciation and amortization expenses related to the property, plant and equipment and intangible assets evaluated at market value in the PPA.
Core operating income
Core operating income is calculated as operating income excluding certain gains and expenses attributable to non-recurring factors (non-recurring items*).*Nonrecurring items are costs of structural reform (cost for withdrawal or downsizing business operations and special retirement allowances), losses caused by disasters or serious accidents, and other gains and expenses (such as disposal of idling assets).
Hybrid finance
A form of debt financing that has features resembling equity, such as voluntary deferral of interest, extremely long-term redemption periods and subordination during liquidation or bankruptcy procedures.This kind of financing does not cause stock dilution, and a certain ratio of the funds procured in this way can be recognized as equity credit by rating agencies provided that certain conditions are met.
Equity-type debt The amount of debt procured by hybrid finance that has been recognize as equity credit by rating agencies.In this fund procurement, rating agencies have recognized equity credit for 50% of the procured amount.
Key performance indicators Calculations used in this presentation
ROCE (Return on capital employed) Core operating income / (outstanding interest-bearing debt + equity attributable to owners of parent)
Adjusted net interest-bearing debt (Interest-bearing debt – equity-type debt) – cash and cash equivalents
Adjusted net D/E ratio Adjusted interest-bearing debt / (equity attributable to owners of the parent + equity-type debt)
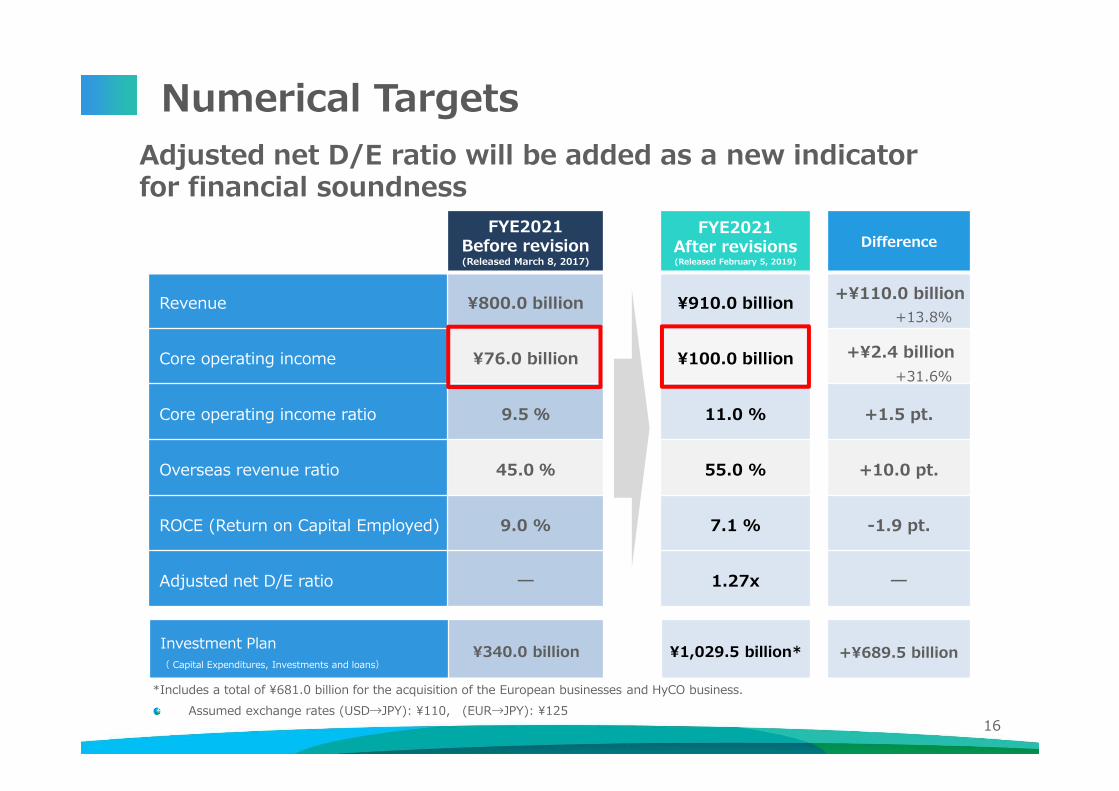
FYE2021Before revision(Released March 8, 2017)
FYE2021After revisions(Released February 5, 2019)
Difference
Revenue ¥800.0 billion ¥910.0 billion
Core operating income ¥76.0 billion ¥100.0 billion
Core operating income ratio 9.5 % 11.0 % +1.5 pt.
Overseas revenue ratio 45.0 % 55.0 % +10.0 pt.
ROCE (Return on Capital Employed) 9.0 % 7.1 % -1.9 pt.
Adjusted net D/E ratio ― 1.27x ―
Numerical Targets
16
+¥110.0 billion
+13.8%
+¥2.4 billion
+31.6%
Adjusted net D/E ratio will be added as a new indicator for financial soundness
Investment Plan( Capital Expenditures, Investments and loans)
¥340.0 billion ¥1,029.5 billion* +¥689.5 billion
*Includes a total of ¥681.0 billion for the acquisition of the European businesses and HyCO business.
Assumed exchange rates (USD→JPY): ¥110, (EUR→JPY): ¥125
FYE2021(Before revision)
FYE2021(After revision)
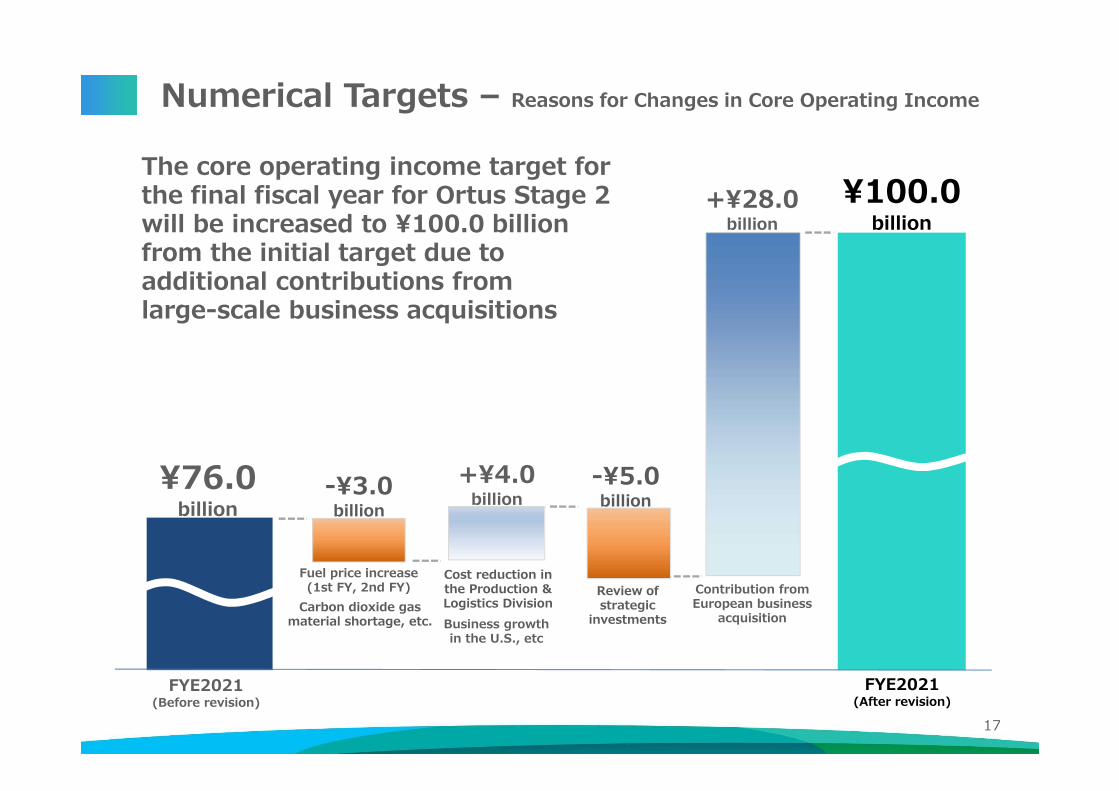
¥100.0 billion
¥76.0 billion
Numerical Targets – Reasons for Changes in Core Operating Income
Cost reduction in the Production & Logistics Division
17
Fuel price increase(1st FY, 2nd FY) Review of
strategic investments
The core operating income target for the final fiscal year for Ortus Stage 2 will be increased to ¥100.0 billion from the initial target due to additional contributions from large-scale business acquisitions
-¥3.0 billion
+¥4.0 billion
-¥5.0 billion
+¥28.0 billion
Carbon dioxide gasmaterial shortage, etc.
Contribution from European business
acquisitionBusiness growth in the U.S., etc

Numerical Targets – Numerical Targets by Segment
RevenueCore operating
incomeCore operating income ratio
Gas Business in Japan ¥380.0 billion ¥31.0 billion 8.2 %
Gas Business in the U.S. ¥205.0 billion ¥20.0 billion 9.8 %
Gas Business in Europe ¥180.0 billion ¥28.0 billion 15.6 %
Gas Business in Asia and Oceania ¥115.0 billion ¥13.5 billion 11.7 %
Thermos Business ¥30.0 billion ¥9.5 billion 31.7 %
Elimination or corporate ― -¥2.0 billion ―
Total ¥910.0 billion ¥100.0 billion 11.0 %
18
Gas Business in Europe has been newly established as a segment. Following segments numerical targets will be set for the fiscal year ending March 31, 2021.
19
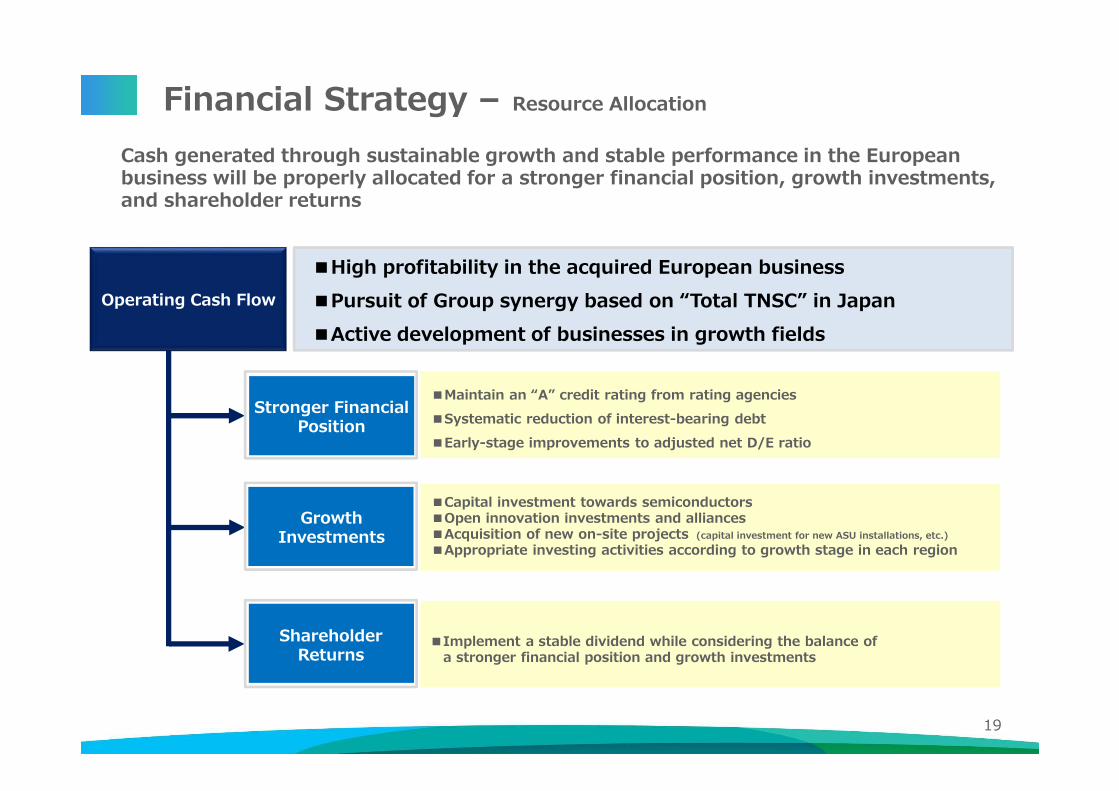
Financial Strategy – Resource Allocation
Cash generated through sustainable growth and stable performance in the European business will be properly allocated for a stronger financial position, growth investments, and shareholder returns
Operating Cash Flow
Stronger Financial Position
Growth Investments
Shareholder Returns
■Capital investment towards semiconductors■Open innovation investments and alliances■Acquisition of new on-site projects (capital investment for new ASU installations, etc.)
■Appropriate investing activities according to growth stage in each region
■Maintain an “A” credit rating from rating agencies
■Systematic reduction of interest-bearing debt
■Early-stage improvements to adjusted net D/E ratio
■High profitability in the acquired European business
■Pursuit of Group synergy based on “Total TNSC” in Japan
■Active development of businesses in growth fields
■Implement a stable dividend while considering the balance of a stronger financial position and growth investments

20
Revised Investment Plan (4-year plan starting from FYE2018)
Review the investment projects from the perspectives of profitability and efficiency,and implement it with strict and more careful section
Total
¥340.0 billion
Ordinary Investment
30%
Strategic Investment
70%
Initial plan
(¥238.0 billion)
(¥102.0 billion)
<Initial plan>
¥340.0 billion for investing activities
over 4 years*Operating cash flow target(4-year total): ¥325.0 billion
-¥70.0 billion
Reduction after review of initial plan
+¥22.0 billion
Investment in addition
to/outside of initial plan
Large-Scale Acquisition Investment
European business and
U.S. HyCObusiness
+¥681.0 billion
+¥56.5 billion
Capital investment at acquired businesses
Total
¥1,029.5 billionCapital Investment
at Acquired Businesses(¥56.5 billion)
Updated plan
Strategic Investment
(¥871.0 billion)
Ordinary Investment(¥102.0 billion)

▲ 50.0
0.0
50.0
100.0
Envisaged Stronger Financial Position – Forecast for Operating Cash Flow
Operating cash flow is expected to steadily increase due to high profitability and stable performance at the acquired businesses in addition to the sustainable growth of existing businesses
0.0
20.0
40.0
60.0
80.0
100.0
120.0
140.0
160.0
FYE2018
(Actual)
FYE2019
(Forecast)
FYE2020
(Projection)
FYE2021
(Projection)
FYE2022
(Assumed)
FYE2023
(Assumed)
FYE2024
(Assumed)
Operating cash flow
(¥ billion)
21
▲650.0
Free cash flows(¥ billion)
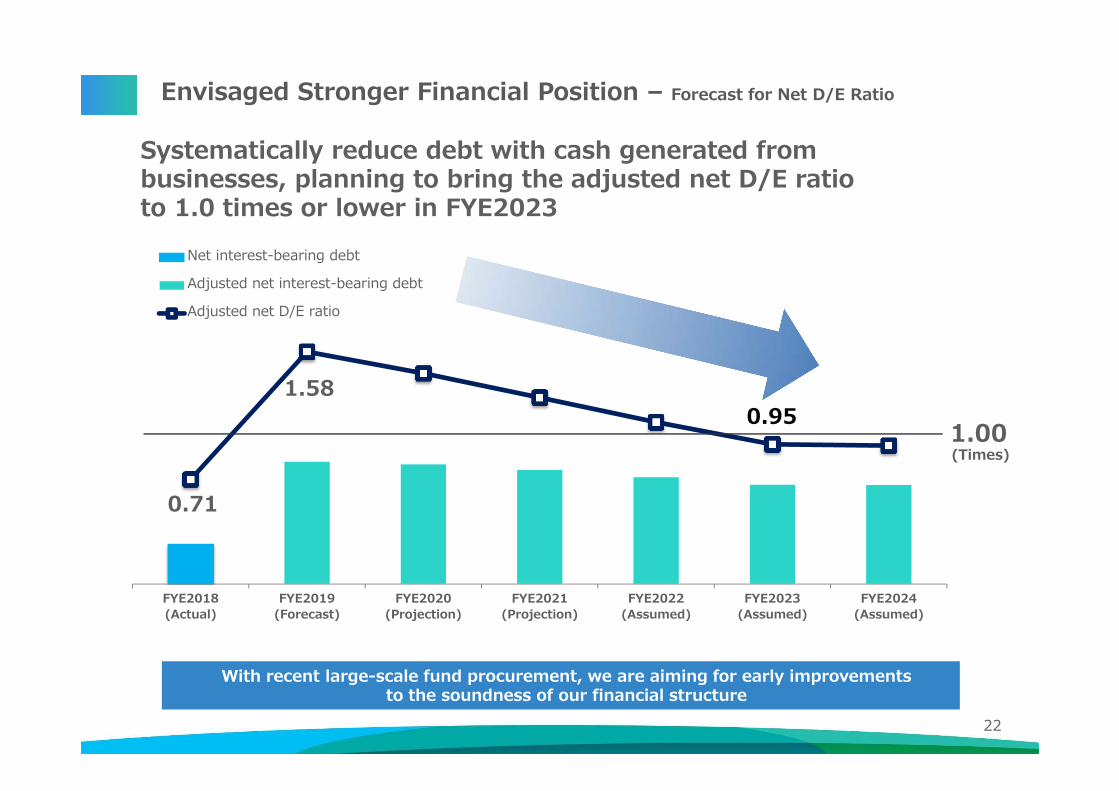
Envisaged Stronger Financial Position – Forecast for Net D/E Ratio
22
0.71
1.58 0.95
0.00
0.20
0.40
0.60
0.80
1.00
1.20
1.40
1.60
1.80
2.00
FYE2018(Actual)
FYE2019 (Forecast)
FYE2020 (Projection)
FYE2021 (Projection)
FYE2022 (Assumed)
FYE2023 (Assumed)
FYE2024 (Assumed)
Net interest-bearing debt
Adjusted net interest-bearing debt
Adjusted net D/E ratio
With recent large-scale fund procurement, we are aiming for early improvements to the soundness of our financial structure
Systematically reduce debt with cash generated from businesses, planning to bring the adjusted net D/E ratio to 1.0 times or lower in FYE2023
1.00(Times)

Thank you
Ortus Stage 2

Reminders
The information contained here is not disclosure information for
securities trading. The accuracy and completeness of this
information are not guaranteed.
The briefing session and this material describe future plans and
strategies, as well as forecasts and outlooks of business
performance. These plans and strategies, as well as forecasts and
outlooks, are made by Taiyo Nippon Sanso based on its judgments
and estimations made in accordance with the information
available at present. Actual performance will be subject to
changes caused by a variety of risks and uncertainties (such as
economic trends, market demand, exchange rates, taxation
systems and various other systems and institutions, but not
limited to them).
We wish to remind you, therefore, that the actual business
performance may differ from the forecasts and outlooks made at
this time. Please refrain from making investment judgments based
solely on this information.