emerging techniques and impact of human activities in
TRANSCRIPT
Emerging techniques and impact of human
activities in landslide risk management:
3D analysis and human induced landslides
Michel Jaboyedoff - Risk-group - Institute of Earth Sciences, University of Lausanne
GEOPOLIS – 3793 CH-1015 Lausanne – Switzerland ([email protected]; +41 79 752 35 15; www.unil.ch/risk/)
Nowadays landslide risk management is facing two important challenges. The first is to improve landslide predictability (hazard, early warning systems (EWS)). This is made possible thanks to the recent progresses in geosciences enabled by the new affordable technologies and computing power. The second challenge is to properly address the problem of landslides caused by the increasing impact of human on environment, especially in fast changing countries. In landslide science, the emergence of high resolution earth surface 3D imaging has played a major role by providing new viewpoints on the slope processes. This technique has improved landslide mapping, enabling to better characterize landslide structures and also to refine numerical modelling. Furthermore, the increasing number of permanent landslide monitoring systems (MS) provide new information about failure mechanisms. These systems can include InSAR, LiDAR, GPS, pore water gauges, rain gauges, inclinometers, etc. These integrated approaches have permitted to demonstrate that most of the mountainous areas are affected by landslides or large slope deformations. As an example, several studies have shown that catastrophic landslides had signs of precursory deformation visible on hi-resolution digital elevation model (HRDEM). Coupling MS and surface deformation analysis enables to characterize the processes that lead to failure, which is fundamental to improve hazard mapping and EWS implementation. With this approach, the mechanisms of failure of several rockslides have been refined (Eiger, Aknes, Randa, Turtle Mountain, etc.), but also of small rock failures (Seychilienne, Catalonia, etc.). Moreover, non-permanent deformations are now identified as potential sources of fatigue of the rock mass. For instance, thermal effect on shallow rock failure starts to be well documented in
-28-
Yosemite. Another example is the effect of groundwater table fluctuations on a large rock wall in Norway inducing cycles of deformation of a few millimetres of amplitude (demonstrated by InSAR). Similar analyses are also applied successfully to landslides in soils such as earthflows, like Super Sauze in France. Finally, passive seismic monitoring is also a new tool to forecast the reactivation of earthflows by monitoring the decrease of the surface wave velocity. All these new techniques are promising in order to improve landslide risk management, thanks to a better understanding of dynamic processes from landslide initiation (criterion for mapping) to failure forecast (basics for MS). But that understanding must also include the issues linked to landslides induced by human activities. This is critical considering the fast changes in land uses. In several contexts, anthropic activities are one of the major cause of landslides. Even if the causes are often bad engineering practices, several cases have demonstrated that slope failures can be caused by environmental changes that are not considered to be systematically leading to the modification of the slope profile, water circulations, etc. This means that landslide hazard assessment must clearly include the impact of past, present and future anthropic changes. Based on the work of K. Terzaghi, seven questions must be answered to tackle the potential impact of human on slope environment. To conclude, the challenges that face the landslide risk management are, in my opinion, linked to the possibility to develop a deeper understanding of the processes permitting a better detection of landslide prone areas and an improved forecast of failure or reactivation of landslides. In addition, any operation in slopes must take into account the full impact on the neighbouring environment in order to prevent human induced landslides.
-29-
ORIGINAL PAPER
Use of LIDAR in landslide investigations: a review
Michel Jaboyedoff • Thierry Oppikofer • Antonio Abellan •
Marc-Henri Derron • Alex Loye • Richard Metzger • Andrea Pedrazzini
Received: 12 February 2010 / Accepted: 24 September 2010 / Published online: 19 October 2010� The Author(s) 2010. This article is published with open access at Springerlink.com
Abstract This paper presents a short history of the appraisal of laser scanner technolo-
gies in geosciences used for imaging relief by high-resolution digital elevation models
(HRDEMs) or 3D models. A general overview of light detection and ranging (LIDAR)
techniques applied to landslides is given, followed by a review of different applications of
LIDAR for landslide, rockfall and debris-flow. These applications are classified as: (1)
Detection and characterization of mass movements; (2) Hazard assessment and suscepti-
bility mapping; (3) Modelling; (4) Monitoring. This review emphasizes how LIDAR-
derived HRDEMs can be used to investigate any type of landslides. It is clear that such
HRDEMs are not yet a common tool for landslides investigations, but this technique has
opened new domains of applications that still have to be developed.
Keywords Landslide � LIDAR � Laser scanner � High-resolution DEM � Topographyanalysis � Structural analysis
1 Introduction
Remote sensing techniques for landslides investigations are undergoing rapid develop-
ments. The possibility of acquiring 3D information of the terrain with high accuracy and
high spatial resolution is opening up new ways of investigating the landslide phenomena.
Recent advances in sensor electronics and data treatment make these techniques affordable.
The two major remote sensing techniques that are exponentially developing in landslides
investigation are interferometric synthetic aperture radar (InSAR) (Fruneau et al. 1996;
Colesanti et al. 2003; Squarzoni et al. 2003), and light detection and ranging (LIDAR)
(Carter et al. 2001; Slob et al. 2002; Haugerud et al. 2003; Slob and Hack 2004). InSAR
techniques are usually ground-based (Stow 1996; Tarchi et al. 2003) or satellite-based
M. Jaboyedoff (&) � A. Abellan � M.-H. Derron � A. Loye � R. Metzger � A. PedrazziniInstitute of Geomatics and Risk Analysis, University of Lausanne, 1015 Lausanne, Switzerlande-mail: [email protected]
T. OppikoferGeological Survey of Norway, 7491 Trondheim, Norway
123
Nat Hazards (2012) 61:5–28DOI 10.1007/s11069-010-9634-2
-30-
(Carnec et al. 1996; Singhroy 2009), and only rarely airborne. InSAR techniques are
mainly dedicated to the detection and the quantification of small displacements over large
areas. LIDAR (or laser scanning) provide high-resolution point clouds of the topography
and has several applications that range from mapping (Ardizzone et al. 2007; Jaboyedoff
et al. 2008a) to monitoring deformation (Gordon et al. 2001), landslides or rockfall dis-
placements (Teza et al. 2007; Oppikofer et al. 2008; Abellan et al. 2010) to landslide in
soils (Jaboyedoff et al. 2009a). The joint use of terrestrial laser scanning (TLS) and SAR
techniques may help to understand landslide phenomena, as is discussed in Teza et al.
(2008).
LIDAR is mainly used for landslide investigation to create accurate and precise high-
resolution digital elevation models (HRDEM) in raster grids or triangulated irregular
networks (TINs), which are 2.5D representations of the topography, or in true 3D point
clouds with a high density of information. This density mainly depends on the position of
the sensor: metric to decimetric resolution for airborne laser scanning (ALS) and centi-
metric to millimetric resolution for terrestrial laser scanning (TLS) (Shan and Toth 2008).
Helicopter-based ALS can give a higher resolution than aircraft-based ALS and especially
allows orientating the scanner in all directions (Vallet and Skaloud 2004).
The number of publications discussing the use of LIDAR in landslide studies has grown
considerably during the last decade (Derron and Jaboyedoff 2010). Main applications
range from mapping to monitoring and modelling slope mass movements. Two books were
recently published: ‘‘Topographic laser ranging and scanning’’, by Shan and Toth (2008)
and ‘‘Laser Scanning for the Environmental Sciences’’, by Heritage and Large (2009). The
former provides a comprehensive compilation of the principles and fundamentals of
LIDAR technologies, reflecting the state-of-the-art of all the physical aspects of the sensor
(components, calibration, waveform analysis, quality control of LIDAR data, filtering and
feature extraction techniques, etc.). Although some of the chapters may be slightly focused
on the geomatics field (and hence, out of the scope for the readers of this review), the first
three chapters by Petrie and Toth (2008) are an excellent basis for the understanding of
instrumental issues: Chapter 1 describes basic (and not so basic) principles of laser pro-
filing and scanning; Chapters 2 and 3 perform a detailed description of the main com-
mercial and research systems currently available on the market for aerial and terrestrial
LIDAR, respectively. As regards the book edited by Heritage and Large (2009), it provides
numerous LIDAR applications to environmental sciences, being of great value for
researches in the field of geomorphology, geostatistics, remote sensing and Geographic
Information Systems (GIS). The contributions can be mainly divided into mapping
(flooding areas, vegetation), geometrical aspects (study of geological outcrops and river
gravel bars) and monitoring (rocky and sandy coastal erosion, river dynamics, etc.).
Unfortunately, up to now there has been little effort to review the advances of LIDAR
applications on landslides. This paper tries to fill this gap.
2 Laser scanning and/or LIDAR techniques
2.1 Short overview about LIDAR techniques and rangefinder
The acronym LASER (or laser) stands for Light Amplification by Stimulated Emission of
Radiation. A laser is a device that produces and emits a beam (or a pulse series) of highly
collimated, directional, coherent and in-phase electromagnetic radiation. As shown below,
laser systems can be used for the acquisition of large amounts of 3D information of the
6 Nat Hazards (2012) 61:5–28
123
-31-
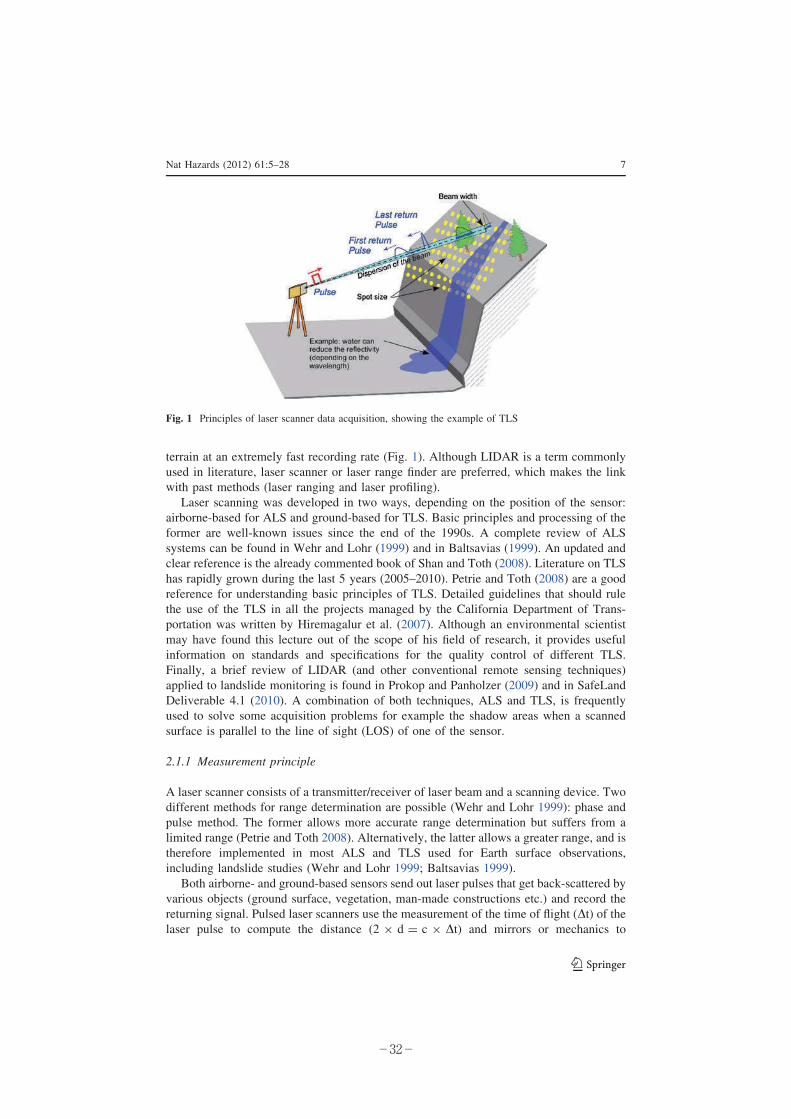
terrain at an extremely fast recording rate (Fig. 1). Although LIDAR is a term commonly
used in literature, laser scanner or laser range finder are preferred, which makes the link
with past methods (laser ranging and laser profiling).
Laser scanning was developed in two ways, depending on the position of the sensor:
airborne-based for ALS and ground-based for TLS. Basic principles and processing of the
former are well-known issues since the end of the 1990s. A complete review of ALS
systems can be found in Wehr and Lohr (1999) and in Baltsavias (1999). An updated and
clear reference is the already commented book of Shan and Toth (2008). Literature on TLS
has rapidly grown during the last 5 years (2005–2010). Petrie and Toth (2008) are a good
reference for understanding basic principles of TLS. Detailed guidelines that should rule
the use of the TLS in all the projects managed by the California Department of Trans-
portation was written by Hiremagalur et al. (2007). Although an environmental scientist
may have found this lecture out of the scope of his field of research, it provides useful
information on standards and specifications for the quality control of different TLS.
Finally, a brief review of LIDAR (and other conventional remote sensing techniques)
applied to landslide monitoring is found in Prokop and Panholzer (2009) and in SafeLand
Deliverable 4.1 (2010). A combination of both techniques, ALS and TLS, is frequently
used to solve some acquisition problems for example the shadow areas when a scanned
surface is parallel to the line of sight (LOS) of one of the sensor.
2.1.1 Measurement principle
A laser scanner consists of a transmitter/receiver of laser beam and a scanning device. Two
different methods for range determination are possible (Wehr and Lohr 1999): phase and
pulse method. The former allows more accurate range determination but suffers from a
limited range (Petrie and Toth 2008). Alternatively, the latter allows a greater range, and is
therefore implemented in most ALS and TLS used for Earth surface observations,
including landslide studies (Wehr and Lohr 1999; Baltsavias 1999).
Both airborne- and ground-based sensors send out laser pulses that get back-scattered by
various objects (ground surface, vegetation, man-made constructions etc.) and record the
returning signal. Pulsed laser scanners use the measurement of the time of flight (Dt) of thelaser pulse to compute the distance (2 9 d = c 9 Dt) and mirrors or mechanics to
Fig. 1 Principles of laser scanner data acquisition, showing the example of TLS
Nat Hazards (2012) 61:5–28 7
123
-32-
orientate the laser beam in a well-defined direction. Knowing this line of sight (LOS)
direction and the attitude of the device (pitch, roll and yaw) allows determining the
position Dx, Dy, Dz of a reflective surface relatively to the device. The range is measured
without any artificial reflectors over an area equal to the laser’s spot dimension (beam
width projected on the topography), which increases with distance due to the laser beam
divergence (Petrie and Toth 2008) (Fig. 1).
The absolute position of an ALS sensor is defined by a Global Positioning System
(GPS), and its attitude is recorded by an inertial system. Finally, the point cloud coordi-
nates are estimated (x ? Dx, y ? Dy, z ? Dy) with an accuracy of around 15 cm (1r) byusing ground control points (Habib 2008). In practice, the position and orientation (atti-
tude) of the TLS sensor are not defined precisely in the field, unless the TLS device is also
coupled with an inertial system and a GPS. This makes necessary a further georeferencing
of the TLS point cloud. This process is carried out by aligning the TLS point cloud, either
using a set of ground control points or using another already georeferenced point cloud.
2.1.2 Analysis of back-scattered laser pulses
Most ALS and a few of the TLS systems use the full waveform of the laser signal. The full
waveform of the back-scattered pulse includes some information on the properties of the
reflexive objects within the beam area. This allows for instance removing part of the
vegetation effect (Duong 2006; Harding 2008; Heritage and Large 2009). Alternatively,
range measurement using TLS can be undertaken without discriminating the full wave-
form, but recording several back-scattered pulses from one emitted pulse. This procedure
makes it possible to distinguish and to filter intermediate-range objects (vegetation, wires,
birds and other undesired points). For landslides applications, the last returned pulse is
usually the most relevant. Nevertheless, if the vegetation is too dense the laser beam will
not reach the ground, and direct visibility (LOS) between the TLS and the scanned surface
is of course necessary. However, these limitations are common with other remote sensing
techniques (surveying, radar and/or optical).
It must be said that one of the main issue in laser scanning is the removal of the
vegetation (Harding 2008) either by automatic methods or manually. If vegetation is dense
sometimes the DEM created from ALS data is not better than a standard resolution DEM
(approx. 25 m grid size) obtained from topographic maps.
2.1.3 Accuracy, resolution and point density
The typical accuracy of the laser instrument is ±1.5 cm, within maximum distances of
about 800–1,000 m (Manetti and Steinmann 2007). Nevertheless, the instrumental accu-
racy is usually lower in practical applications due to unfavourable conditions such as:
poorly reflecting or very rough surfaces, parallel incident angles, bad weather conditions
(rain or hot wind or fog), very bright ambient conditions, excessive range, etc.
Laser scanner’s resolution is a parameter that determines the level of detail that can be
observed in a point cloud. It is divided into range and angular (or spatial) resolution
(Kamerman 1993; Lichti and Jamtsho 2006): (a) Range resolution is the ability of a
rangefinder to resolve two objects on the same LOS; (b) Angular resolution is the ability to
resolve two objects on adjacent LOS. This parameter is governed by two variables:
sampling interval (also called point spacing, which is user defined) and laser beamwidth
(which depends on the distance and the instrument). The estimation of the TLS resolution
is usually misunderstood and commonly interpreted as equal to the point spacing, obviating
8 Nat Hazards (2012) 61:5–28
123
-33-
the influence of the laser beamwidth. Nevertheless, when sampling interval is lower than
the laser beamwidth, fine details are in fact blurred. A detailed explanation of this effect
can be found in Lichti and Jamtsho (2006). They proposed the use of the effective
instantaneous field of view (EIFOV) as a measurement of the resolution of the TLS. The
lower sampling interval proposed by these authors is 86% of the laser beamwidth.
For ALS, the point density usually ranges from 0.5 to 100 pts/m2, while for TLS it
ranges usually from 50 to 10,000 pts/m2. In addition to the position, the intensity of the
reflected signal is acquired. This parameter mainly depends on the beam wavelength, the
type of material (colours and roughness of the reflective surface), soil moisture and angle
of incidence (Ingensand 2006; Lichti 2007; Pesci et al. 2008; Voegtle et al. 2008).
The wavelength ranges between 500 and 1,700 nm (Wehr and Lohr 1999; Jaboyedoff
et al. 2009a). For TLS, the acquisition range increases usually with longer wavelengths,
from a few metres to 2,000 m if reflectivity of the surface is high (Jaboyedoff et al. 2009a).
2.1.4 Point cloud alignment
Alignment of the point cloud usually consists of a two-step process: a preliminary regis-
tration by a visual identification of homologous points and an optimization of the align-
ment using an Iterative Closest Points (ICP) procedure (Besl and McKay 1992; Chen and
Medioni 1992). Using this algorithm, the differences between points are iteratively reduced
by a minimization of a mean square cost function. Alternatively, the alignment over
discrete parts of the slope can be carried out using the Roto-Translation technique
described by different authors (Teza et al. 2007; Monserrat and Crosetto 2008; Oppikofer
et al. 2009).
2.2 Short historical overview
Early attempts to acquire Earth surface data sets by ALS were performed along profiles
using only an inertial system and other positioning technique for topographic mapping
(Miller 1965; Krabill et al. 1984) with devices developed for water depth measurement
(Hoge et al. 1980) or for altimetry purposes (Shepherd 1965). One of the first applications
in geosciences of ALS (i.e., using inertial system coupled with GPS) has been to evaluate
the topographical changes of the Greenland ice sheet (Krabill et al. 1995, 1999).
TLS appeared later than ALS at the end of the 1990s (Large and Heritage 2009). This
instrument is an evolution of the electronic distance meter (EDM) and of total station,
which benefits of the earlier ALS developments (many companies manufacturing ALS are
now also selling TLS). EDM was developed during the late 1950s and early 1960s
(Dallaire 1974). These instruments allow for a very accurate distance measurement.
Nevertheless, these one-dimensional measurements were not suitable for the measurement
of the 3D coordinates of single points (x, y, z). Furthermore, reflectors are usually required
(Bromhead et al. 1988). By contrast, TLS measurements include real 3D information (x, y,
z coordinates) plus intensity (I), and in some cases full waveform. In addition, TLS devices
are reflectorless (Petrie and Toth 2008) allowing for a broad coverage of the surveyed area.
The early tests for environmental application were made in the late 1990s and in the early
twenty-first century (Lichti et al. 2000).
A systematic bibliographic survey was carried out by Derron and Jaboyedoff (2010)
looking within the databases ISI Web of Knowledge and GEOREF. In this paper, the
growth of the yearly production of publications and citations related to LIDAR and geo-
sciences or landslide is analysed through logistic functions. The main outcome of this
Nat Hazards (2012) 61:5–28 9
123
-34-
analysis is that the community of geoscientists working with laser scanning techniques is
presently building an innovative and useful knowledge and that this fast development has
the potential to continue for the next 5–10 years.
3 Classification of the main applications
TLS and ALS can be used for different types of investigation, which can be subdivided in 4
types (Table 1): (1) Landslide detection and characterization; (2) Hazard assessment and
susceptibility mapping; (3) Modelling; (4) Monitoring. This classification may have
overlaps, but allows us to classify the main objectives of the research. Our classification is
based not only on the type of mass movements described by Cruden and Varnes (1996) but
also on the processes linked to these phenomena. The selected approach to study the mass
movement is strongly dependant on the scanned object: (1) we refer as ‘‘rockfalls’’ to all
the slope processes formed in rock slopes, from the detachment of the instability to the
propagation; (2) we refer as ‘‘landslides’’ to all the material that suffer large scale and slow
rate of deformation, in either soft, fine materials (soils) and/or weathered and weak rocky
material, including deep-seated gravitational slope deformation (DSGSD) (Agliardi et al.
2009); finally, (3) we refer as ‘‘debris-flows’’ to slope movements formed by debris type of
material, moving down the slope as a flow. This classification makes sense in terms of
LIDAR analysis, because the analyses of the geomorphic features are not necessarily scale
dependant. As an example, it can be impossible to distinguish a DSGSD from a classical
landslide only by inspecting a hillshade relief without knowing the scale.
Table 1 Classification of the different applications of LIDAR technologies in landslide studies
Landslide Rockfall Debris-flow
(1) Landslide detectionand characterization(In Sect. 4)
• Mapping of geomorphicfeatures
• Rock face imagingand characterization
• Calculatediscontinuityorientation
• Detection ofmobilizablevolumes
• Hydromorphiccharacterization
(2) Hazard assessmentand susceptibilitymapping (In Sect. 5)
• Mainly as support formapping
• Some attempts forsusceptibility andhazard mapping (notyet achieved)
• Input for mappinghazard based ongeomorphologicapproach
(3) Modelling(In Sect. 5)
• Classical modelling tools arenot able yet to handle huge3D information density
• HRDEM allow more accuratelandslide modelling byimproving their geometricalcharacterization
• High-resolution DEMfor trajectorymodelling
• Input for spreadingmodelling
(4) Monitoring(In Sect. 6)
• Monitoring of surfacedisplacements
• Volume budget
• Monitoring of surfacedisplacement
• Detection of pre-failure displacements(under development)
• Quantification ofrockfall activity(volumes)
• Sediment budget• Monitoring ofmorphologicchanges in channel
10 Nat Hazards (2012) 61:5–28
123
-35-
4 Detection and characterization of mass movements
4.1 Landslide
4.1.1 ALS
ALS permits an improvement in the landslide inventory mapping and more generally of
geological mapping (Borlat et al. 2007), by increasing the resolution of the landslide
contours, permitting to identify scarps and displaced material. Nevertheless, the same
conceptual methods to detect landslides are still usually employed (Soeters and Van
Westen 1996; Keaton and DeGraff 1996). The morphological features of the landslides
(e.g. scarps, mobilized material, foot) are easy to delineate based on hillshades of the
produced HRDEM (Carter et al. 2001; Haugerud et al. 2003; Ardizzone et al. 2007;
Jaboyedoff et al. 2008a; Corsini et al. 2009). This approach does not replace field inves-
tigations, but it changes the fieldwork methods, which become part of the validation
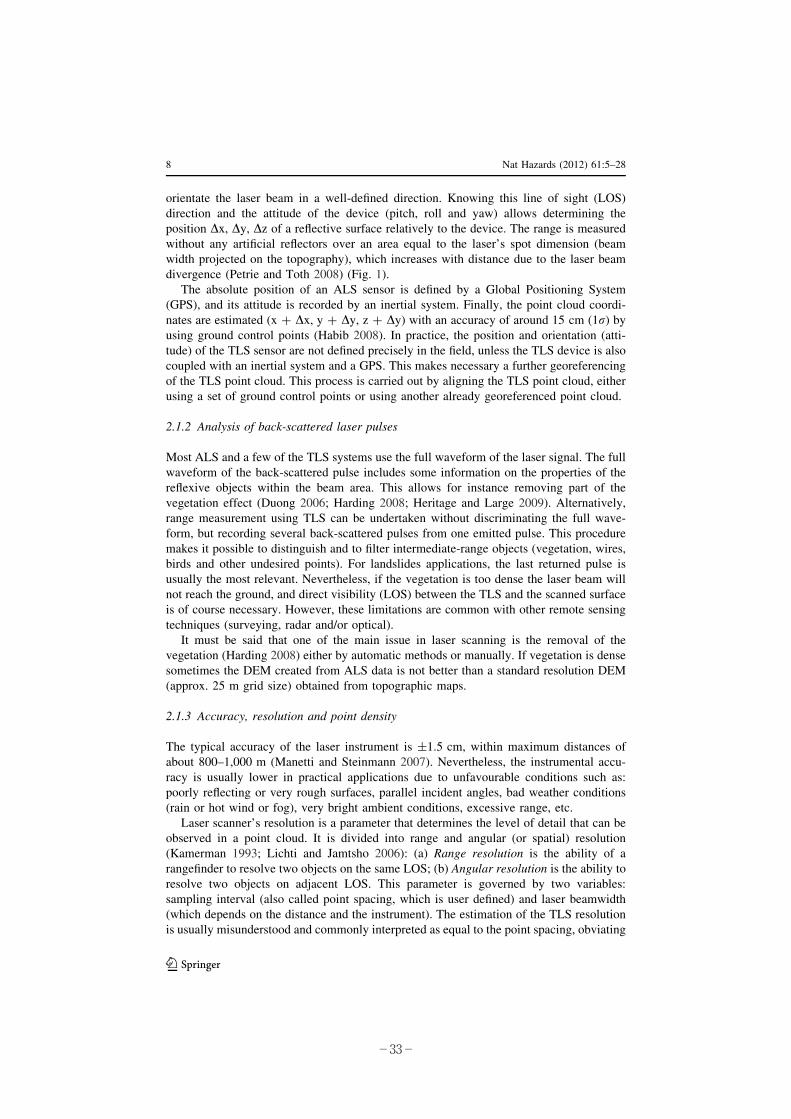
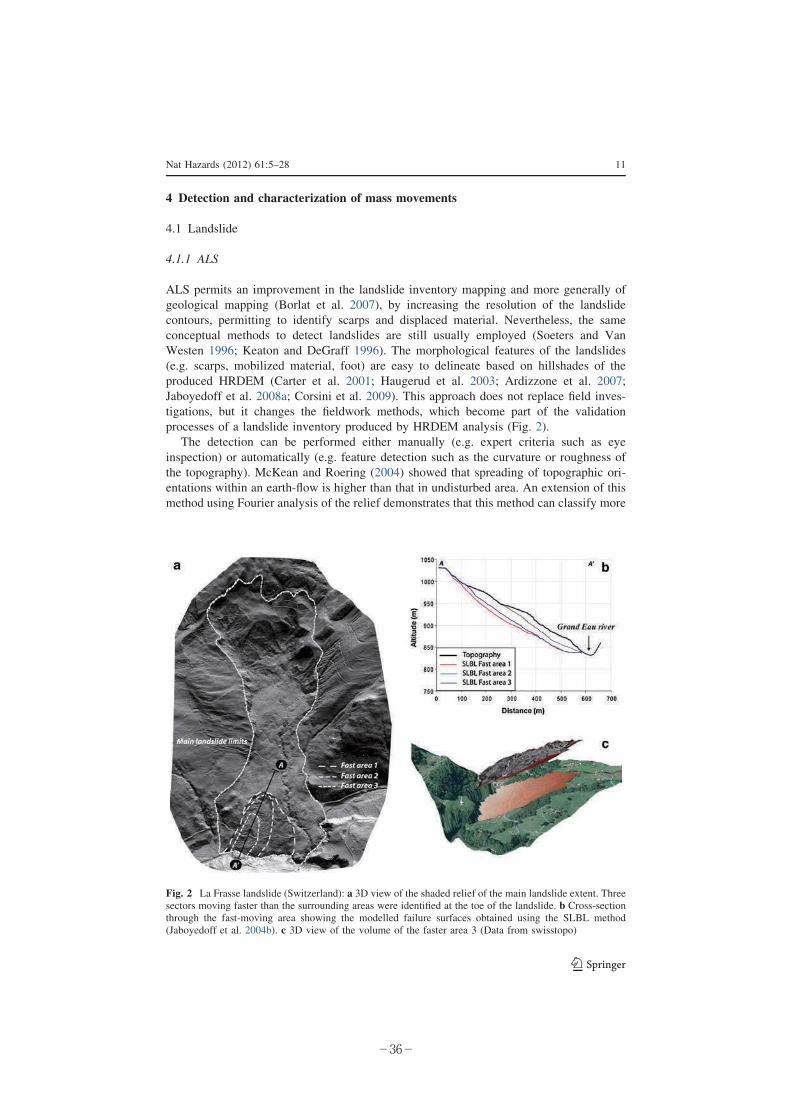
processes of a landslide inventory produced by HRDEM analysis (Fig. 2).
The detection can be performed either manually (e.g. expert criteria such as eye
inspection) or automatically (e.g. feature detection such as the curvature or roughness of
the topography). McKean and Roering (2004) showed that spreading of topographic ori-
entations within an earth-flow is higher than that in undisturbed area. An extension of this
method using Fourier analysis of the relief demonstrates that this method can classify more
Fig. 2 La Frasse landslide (Switzerland): a 3D view of the shaded relief of the main landslide extent. Threesectors moving faster than the surrounding areas were identified at the toe of the landslide. b Cross-sectionthrough the fast-moving area showing the modelled failure surfaces obtained using the SLBL method(Jaboyedoff et al. 2004b). c 3D view of the volume of the faster area 3 (Data from swisstopo)
Nat Hazards (2012) 61:5–28 11
123
-36-
than 80% of total area that has already suffered a landslide (or not) in western US (Booth
et al. 2009). Geomorphic criterion based on geostatistics (Glenn et al. 2006) succeeds in
differencing landslide activities. Nevertheless, such methods are not easy to apply due to
following reasons: (a) expert criteria are needed (interpretation of the results) and (b) the
presence of vegetation may degrade the DEM quality (Kasai et al. 2009). In addition, the
detailed morphology provided by HRDEM coupled with geologic information can allow
forecasting of the sensitive zones even if the triggering is human induced (Schulz 2007).
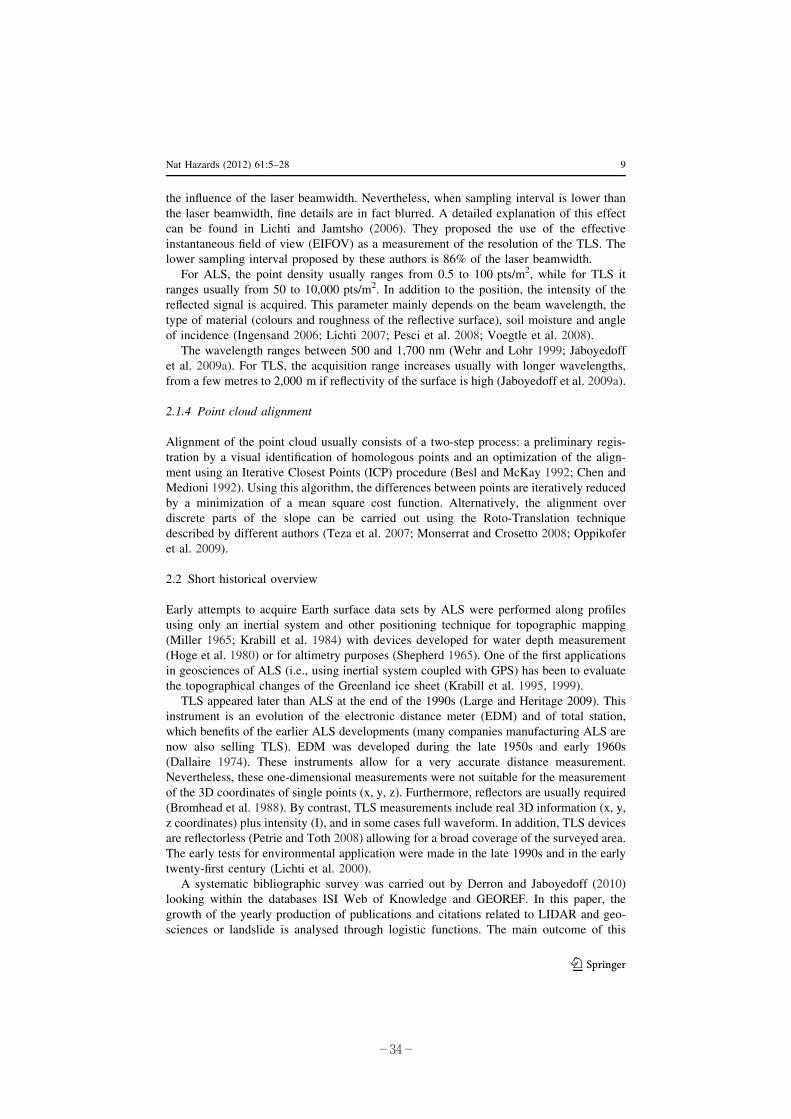
The interpretation of DSGSD is also improved by using HRDEM (Agliardi et al. 2009;
Oppikofer 2009; Corsini et al. 2009) especially because it permits a precise delineation of
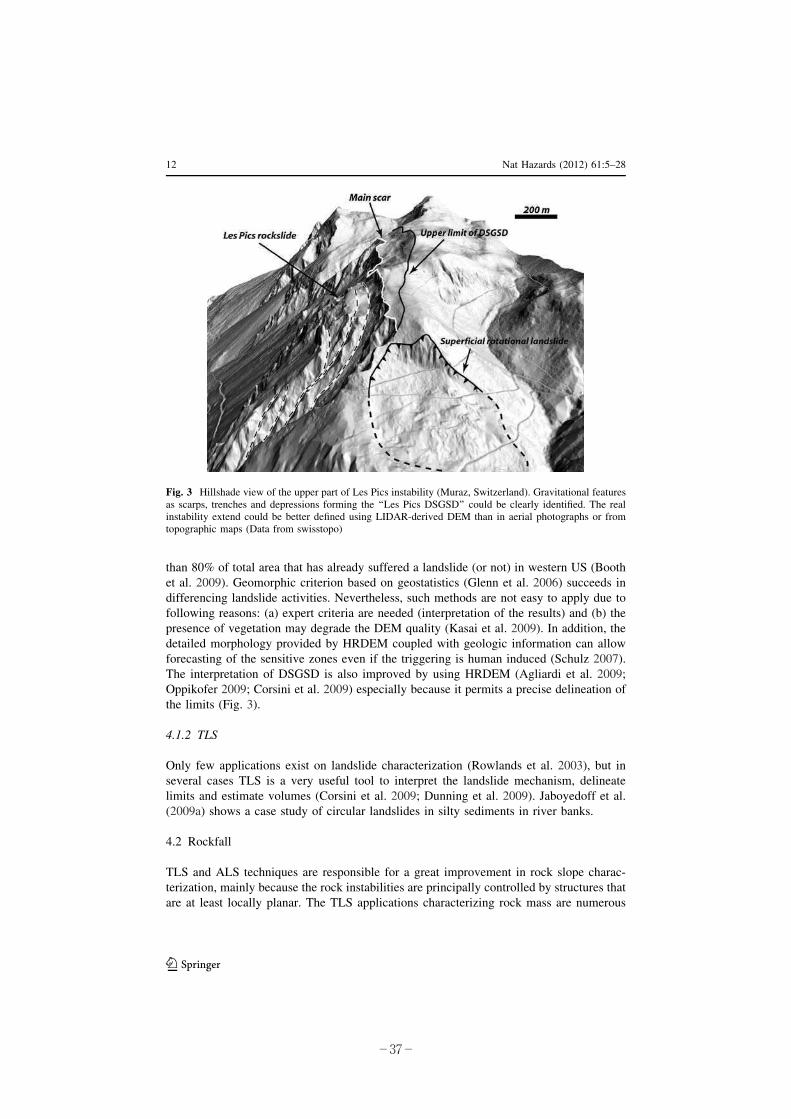
the limits (Fig. 3).
4.1.2 TLS
Only few applications exist on landslide characterization (Rowlands et al. 2003), but in
several cases TLS is a very useful tool to interpret the landslide mechanism, delineate
limits and estimate volumes (Corsini et al. 2009; Dunning et al. 2009). Jaboyedoff et al.
(2009a) shows a case study of circular landslides in silty sediments in river banks.
4.2 Rockfall
TLS and ALS techniques are responsible for a great improvement in rock slope charac-
terization, mainly because the rock instabilities are principally controlled by structures that
are at least locally planar. The TLS applications characterizing rock mass are numerous
Fig. 3 Hillshade view of the upper part of Les Pics instability (Muraz, Switzerland). Gravitational featuresas scarps, trenches and depressions forming the ‘‘Les Pics DSGSD’’ could be clearly identified. The realinstability extend could be better defined using LIDAR-derived DEM than in aerial photographs or fromtopographic maps (Data from swisstopo)
12 Nat Hazards (2012) 61:5–28
123
-37-
(Slob and Hack 2004; Jaboyedoff et al. 2007; Oppikofer et al. 2009; Sturzenegger and
Stead 2009; Armesto et al. 2009; Lato et al. 2009), but still quite rare for ALS-DEM.
4.2.1 ALS
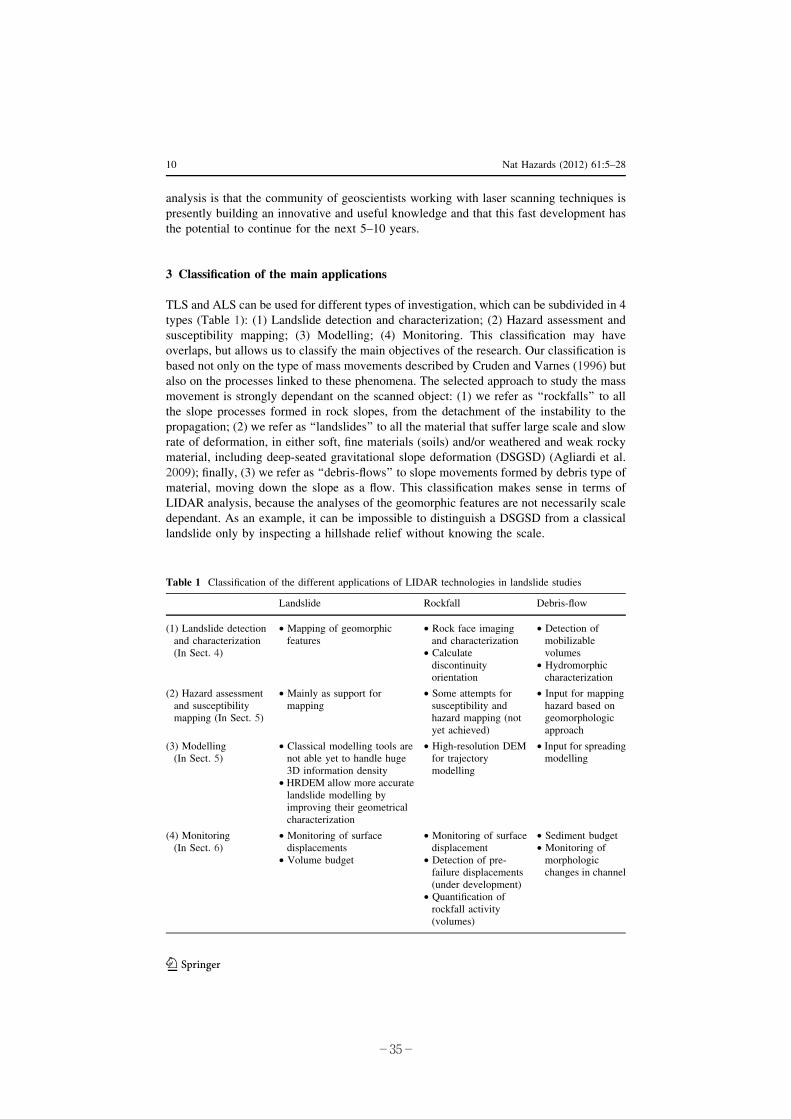
Structural analysis at regional scale are proposed using ALS-derived HRDEM using the
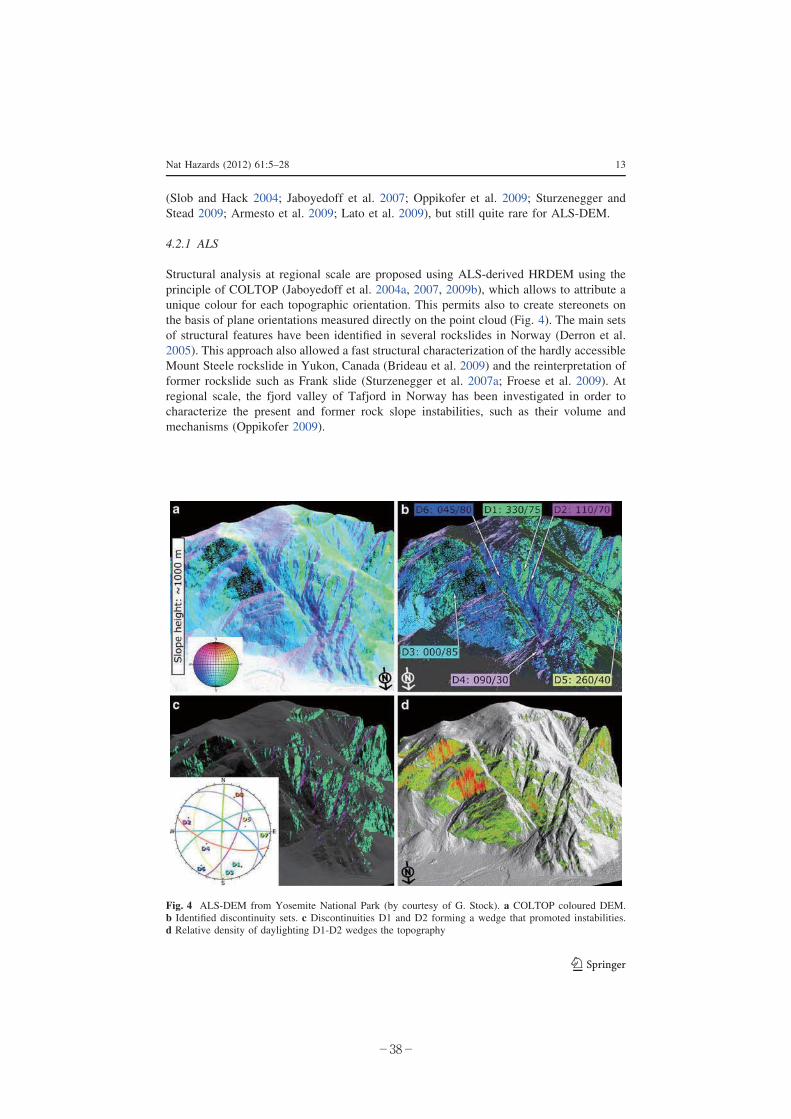
principle of COLTOP (Jaboyedoff et al. 2004a, 2007, 2009b), which allows to attribute a
unique colour for each topographic orientation. This permits also to create stereonets on
the basis of plane orientations measured directly on the point cloud (Fig. 4). The main sets
of structural features have been identified in several rockslides in Norway (Derron et al.
2005). This approach also allowed a fast structural characterization of the hardly accessible
Mount Steele rockslide in Yukon, Canada (Brideau et al. 2009) and the reinterpretation of
former rockslide such as Frank slide (Sturzenegger et al. 2007a; Froese et al. 2009). At
regional scale, the fjord valley of Tafjord in Norway has been investigated in order to
characterize the present and former rock slope instabilities, such as their volume and
mechanisms (Oppikofer 2009).
Fig. 4 ALS-DEM from Yosemite National Park (by courtesy of G. Stock). a COLTOP coloured DEM.b Identified discontinuity sets. c Discontinuities D1 and D2 forming a wedge that promoted instabilities.d Relative density of daylighting D1-D2 wedges the topography
Nat Hazards (2012) 61:5–28 13
123
-38-
4.2.2 TLS
TLS characterization of rock slopes are among the first applications using TLS for slope
mass movement, mainly to obtain accurate slope profile and discontinuity sets orientations
(Bornaz et al. 2002; Slob et al. 2002). A technical report of the US Department of
Transportation (Kemeny and Turner 2008) provides a brief introduction of the main
commercial hardware and softwares and best practices for fieldwork campaigns.
Several studies are proposing different ways to characterize discontinuity sets, which
can be mainly classified as (a) using fitting planes (Fernandez 2005; Abellan et al. 2006;
Oppikofer et al. 2008; Sturzenegger and Stead 2009), (b) using TIN surfaces as indicators
of the plane orientations (Feng et al. 2001; Slob et al. 2002). A description of the meth-
odology employed for rockmass characterization using the commercial software Split-FX
is provided in Kemeny and Post (2003) and Kemeny and Turner (2008). Several authors
(Lato et al. 2009; Abellan et al. accepted) have shown that there is an optimal number of
points for the point cloud to get reliable results depending on the precision of the device: a
sparse TIN suffers from smoothening over corners and edges, creating inaccuracies in
plane representation. On the other hand, a dense TIN is affected by data noise. (c) Other
techniques allow for the automatic delimitation of a set of neighbourhood points charac-
terized by the same normal vector. As a result, the calculation of the orientation of the
discontinuity planes is obtained. The COLTOP technique (Jaboyedoff et al. 2004a, 2007,
2009b; Derron et al. 2005) permits to visualize the orientation of each discontinuity set by
a unique colour, which makes the approach very similar to a field data acquisition
(COLTOP-3D, www.coltop3d.ch). The extracted data permit to analyse the rock instability
mechanisms (Janeras et al. 2004; Jaboyedoff et al. 2008b; Oppikofer et al. 2009).
Different authors have pointed out the existence of two types of biases in the determination
of the orientation of discontinuities (e.g. Sturzenegger and Stead 2009; Lato et al. 2009): (a)
scale bias, when discontinuity sets are smaller than the spatial resolution (point spacing) and
(b) orientation bias, when the incidence angle of a given data set influences the spatial
resolution, and hence, the number of poles in stereonet when doing automatic procedures.
Another area of application that is merging in rock slope characterization is the
roughness determination (Fardin et al. 2004; Haneberg 2007; Tatone and Grasselli 2009)
aimed to better quantify the well-known methods for rock mass rating systems (Romana
1993). Nevertheless, certain limitations are linked to the achievement of this aim, such as
the intrinsic instrumental accuracy, resolution and the influence of different scanner
positions on the final results (Sturzenegger et al. 2007b). Although these limitations, fur-
ther studies are necessary due to the great potential of such methods assuming self-
similarity hypothesis (Fardin et al. 2004).
4.3 Debris-flow
ALS-derived DEM gives an accurate topography and permits to identify morphologies that
are significant in order to characterize the past activity. To this end, morphometric indi-
cators such as roughness, and curvature of the slope are used (Staley et al. 2006; Cavalli
and Marchi 2008). This approach gives quite good results in discriminating the past debris-
flow activity (Cavalli and Marchi 2008) but presents some limitations (Staley et al. 2006).
The variograms inspection gives promising results for characterization of the landforms
(Trevisani et al. 2009).
TLS has also been used to assess limited sections of channels, allowing very detailed
mapping and section profiles evolution (Oppikofer 2009; Theules et al. 2009).
14 Nat Hazards (2012) 61:5–28
123
-39-
5 Hazard assessment, susceptibility mapping and modelling
5.1 Landslide
5.1.1 ALS
One of the earliest applications of ALS-DEM in landslide susceptibility mapping and
modelling is the work of Dietrich et al. (2001) (see also Montgomery et al. 2000). They
showed that a 1 m resolution ALS-DEM improved greatly the results of the model
SHALSTAB, an infinite slope stability model. One of the most achieved study of landslide
hazard assessment using ALS-DEM is the one made by the USGS on the Puget Sound area
(Washington state; Baum et al. 2005). In this study, field investigation is coupled with
HRDEM analysis and shallow landslide modelling using TRIGRS (Savage et al. 2003), a
sophisticated infinite slope model including transient infiltration. This study demonstrates
improvements provided by ALS-DEM for hazard mapping. Along the same line, Haneberg
et al. (2009) have shown convincing results for shallow landsliding, coupling an infinite
slope model with geomorphic characterizations using an ALS-DEM.
Of course, the traditional hazard mapping by field investigation is improved by ALS-
DEM, especially for inventories but also for characterizing the susceptibility using mor-
phometric indicators (Chigira et al. 2004; Haneberg et al. 2005; Jaboyedoff et al. 2008a).
We can also expect that it will soon possible to infer hazard by comparing several ALS-
DEM of different epochs. This was already proposed by Chigira et al. (2004) who
emphasized the possibility to use two inventories to assess hazard, but in their application
the first inventory was still produced by field work only.
The ALS-DEM allows a detailed delimitation of the landslides on the topographical
surface (van den Eeckhaut et al. 2007; Corsini et al. 2009). Using these limits and the
DEM, it is possible to infer the failure surface in 3D. For instance, the sloping base level
(SLBL) concept (Jaboyedoff et al. 2004b, 2009b) makes it possible to obtain very quickly a
planar or curved quadratic surface by using simple geometrical rules. For example, Fig. 2
shows La Frasse landslide in the Swiss Alps and the expected failure surface of a fast-
moving part.
5.1.2 TLS
TLS is mostly used for characterization or monitoring of landslides and not really for
hazard mapping. Nevertheless, TLS can greatly improve the site-specific modelling,
especially when the topography is changing and if only a poor DEM is available. For
example, a detailed slope profile extracted from a TLS-DEM has permitted to identify the
destabilized zone of an earth-flow using a standard Bishop analysis (Jaboyedoff et al.
2009c).
5.2 Rockfall
5.2.1 ALS
Regional rockfall hazard or susceptibility assessment from source area to rockfall propa-
gation using ALS-DEM is not yet implemented as a routine, although all the pieces of the
puzzle are present. The first issue is to locate the source areas. This is often performed at
Nat Hazards (2012) 61:5–28 15
123
-40-
regional scale using simple slope angle thresholds (Guzzetti et al. 2003; Frattini et al.
2008). But, as shown by Loye et al. (2009), more information can be potentially extracted
from the slope angle distribution. By decomposing the histogram of slope angles of an area
into Gaussian distributions, it is possible to identify the threshold above which the relief is
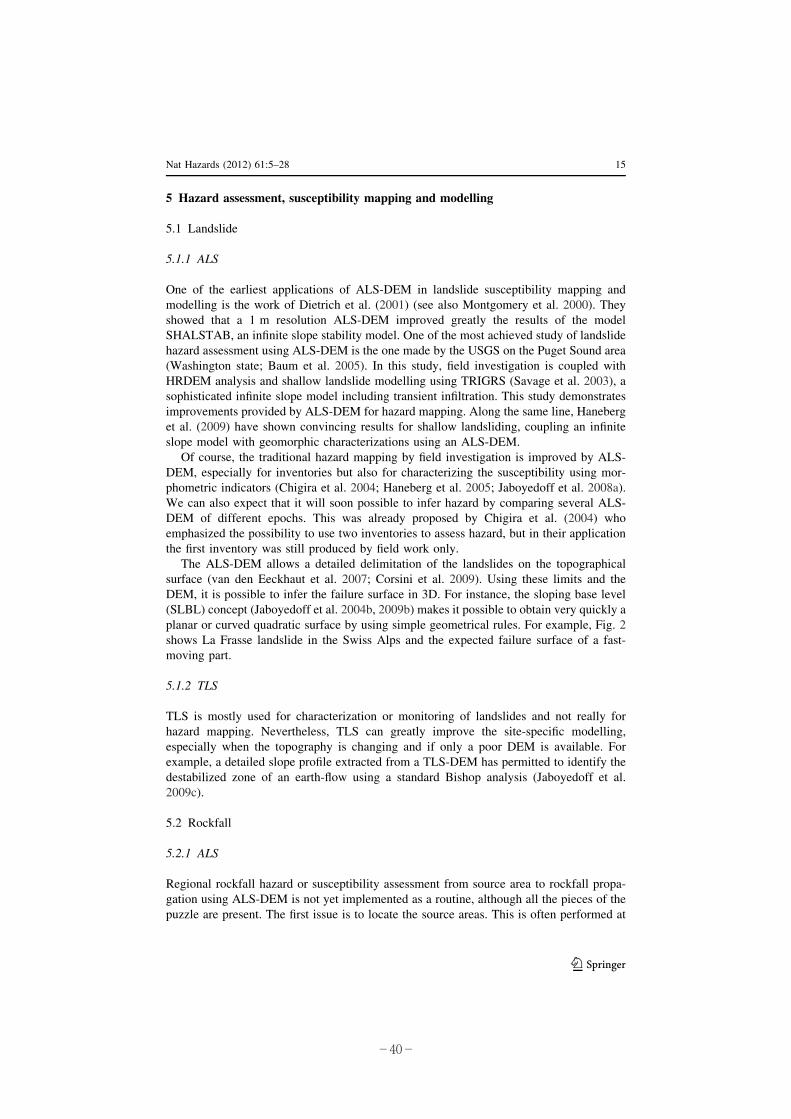
dominantly composed of cliffs (Fig. 5). This threshold depends on the type of bedrock, the
presence or absence of a soil cover and the DEM resolution (Loye et al. 2009). This
method makes it possible to discriminate efficiently the true cliffs from the one drawn on
topographic maps. In addition, as proposed by Gunther (2003) and Jaboyedoff et al.
(2004c), structural analysis performed on ALS-DEM (Fig. 4) can be the basis for kine-
matic test. As discussed in Janeras et al. (2004), the accuracy of the results is greatly
improved by using a HRDEM.
Hazard assessment requires often performing trajectographic modelling in order to
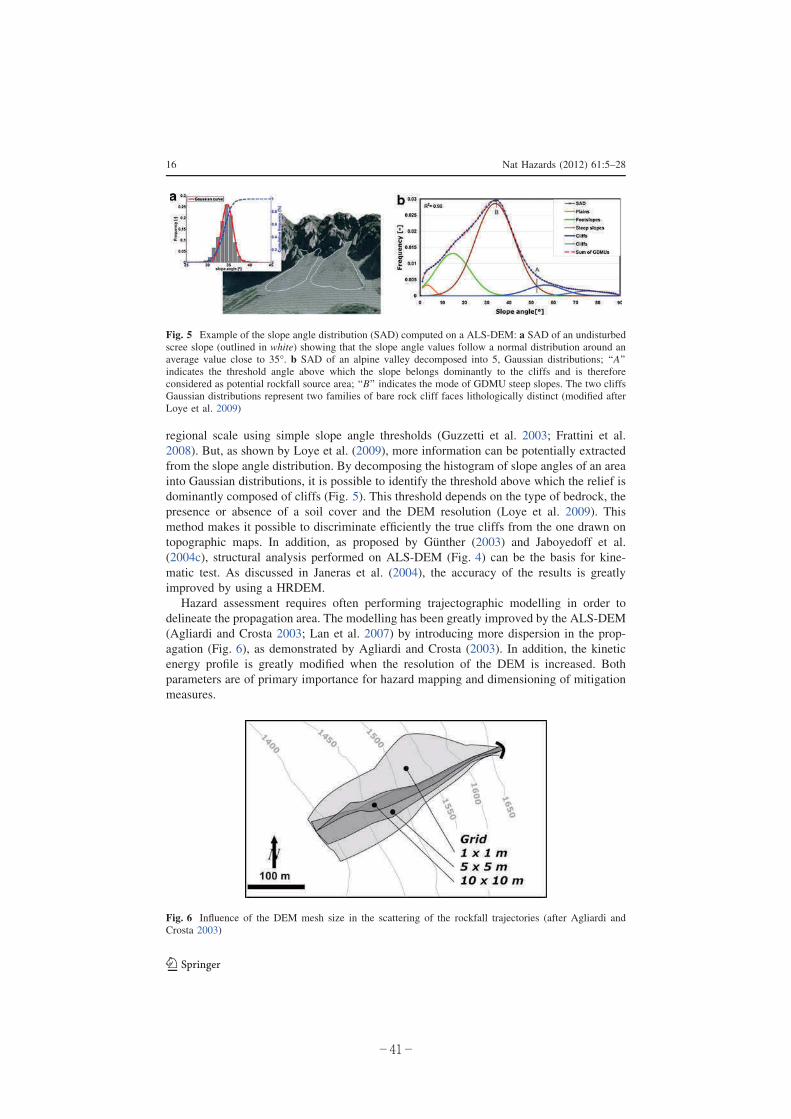
delineate the propagation area. The modelling has been greatly improved by the ALS-DEM
(Agliardi and Crosta 2003; Lan et al. 2007) by introducing more dispersion in the prop-
agation (Fig. 6), as demonstrated by Agliardi and Crosta (2003). In addition, the kinetic
energy profile is greatly modified when the resolution of the DEM is increased. Both
parameters are of primary importance for hazard mapping and dimensioning of mitigation
measures.
Fig. 5 Example of the slope angle distribution (SAD) computed on a ALS-DEM: a SAD of an undisturbedscree slope (outlined in white) showing that the slope angle values follow a normal distribution around anaverage value close to 35�. b SAD of an alpine valley decomposed into 5, Gaussian distributions; ‘‘A’’indicates the threshold angle above which the slope belongs dominantly to the cliffs and is thereforeconsidered as potential rockfall source area; ‘‘B’’ indicates the mode of GDMU steep slopes. The two cliffsGaussian distributions represent two families of bare rock cliff faces lithologically distinct (modified afterLoye et al. 2009)
Fig. 6 Influence of the DEM mesh size in the scattering of the rockfall trajectories (after Agliardi andCrosta 2003)
16 Nat Hazards (2012) 61:5–28
123
-41-
5.2.2 TLS
A great improvement in the rockfall hazard assessment is the monitoring of fallen blocks
from a cliff between two epochs or more (Rosser et al. 2005; Lim et al. 2006; Lato et al.
2009; Abellan et al. 2010; Pedrazzini et al. 2010). Indeed, such approaches allow for the
quantification of the magnitude and activity of rockfalls in a cliff. Rosser et al. (2007)
quantified the increase in rockfall activity some months previous to the occurrence of
larger events. Similarly, when this activity decreases, it may be inferred that the potential
instability becomes stabilized during a given period (Pedrazzini et al. 2010). In addition,
new methods of mobile terrestrial LIDAR along road cuts already produce detailed 3D
models that provide data for structural analysis. If such acquisitions are repeated over time,
they can be used to detect the most active areas (Lato et al. 2009).
5.3 Debris-flow
As suggested by different authors (e.g. Jakob 2005; Horton et al. 2008), process-based
modelling of debris-flows is a difficult task because of the complexity of the phenomenon
and the variability of controlling factors. Detailed topography (slope angle of channels as
well as the channel profile) together with the available channel material can be critical
parameters (Hungr 2005).
These are the major input from both ALS- and TLS-DEM, and they are critical to assess
properly the volumes that can be mobilized. Based on the topography curvature of ALS-
DEM and other properties, it is also possible to extract potential source areas for debris-
flows (Horton et al. 2008). The second improvement provided by ALS-DEM is the
possibility to improve the modelling of propagation, despite the fact that computing time is
very high if a full resolution ALS-DEM is used to compute the models on large areas.
Similarly to rockfall modelling, Stolz and Huggel (2008) have shown that the modelling of
debris-flows can be really improved by using HRDEM. Nevertheless, it must be empha-
sized that as a channel is a dynamic body and breakouts are always possible, a full
resolution approach can also be a pitfall for models. For instance road embankments on the
HRDEM are diverting flow, while in reality road bridges often exist to let the flow pass.
Nevertheless, ALS-derived HRDEM with reduced resolution (10 9 10 m) permits to
obtain very good results for propagation calculations at regional scale (Horton et al. 2008).
6 Monitoring
6.1 Landslide
Before the existence of remote sensing techniques such as LIDAR, RADAR and photo-
grammetry, landslide monitoring was based on single-point measurements, using either
GPS or total stations. But obtaining the complete field of displacements for the whole
landslide is of great help to understand landslide kinematics and failure mechanism
(Fig. 7). Laser scanning is nowadays a common tool for displacement monitoring even if
few published papers exists. The basic principle is the same for both ALS- and TLS-DEM,
requiring at least two epochs of HRDEM acquisition. Nevertheless, as monitoring requires
both high resolution and high precision data sets, most of the works have been done up to
now using TLS-derived HRDEMs. The results are either vectors between two points (or
common areas) or distances between two data sets (point to surface comparison) either in a
Nat Hazards (2012) 61:5–28 17
123
-42-
user-defined direction or as shortest distance (Hausdorff distance) between the two sur-
faces. This difference calculation allows for the computation of volume differences, as is
discussed by different authors (Bitelli et al. 2004; Chen et al. 2006; Corsini et al. 2007;
Teza et al. 2007; Dewitte et al. 2008; Jaboyedoff et al. 2009a; Prokop and Panholzer 2009;
Mueller and Loew 2009; Avian et al. 2009; Baldo et al. 2009).
The standard deviation of the measurements between two epochs can be quite high,
depending on multiple factors, such as the quality of the TLS data sets, the density of
points, the existence of vegetation, the roughness of the relief, the quality of the alignment
between the scans, the relative or absolute positions of the TLS and the variation of the
surface of the terrain between the two epochs. For instance, these values were not less than
5 cm at 100 m for Prokop and Panholzer (2009), or 3 cm for a 300 m range for Teza et al.
(2008). In our recent experiences, it is possible to compare TLS data sets acquired con-
secutively and reach values of the standard deviation of around 1 cm for close ranges (less
than 100 m) and high point densities. This is in agreement with the results obtained on the
‘‘fast’’ moving landslide of Super-Sauze (France) where it was possible to measure
velocities of 3.2 cm/day (Travelletti et al. 2008).
The low number of monitored landslides using ALS-derived HRDEM is due to the
lower precision of ALS compared to TLS (*15 cm vs.*1.5 cm). As a result, comparison
of such HRDEM requires a longer period between two acquisitions to obtain reliable
results. Nevertheless, using classical photogrammetry on ancient aerial photos, it is pos-
sible to obtain displacement maps simply comparing objects locations on the pictures and
on the ALS-DEM (Roering et al. 2009; Baldo et al. 2009).
6.2 Rockfall
Monitoring surface displacements in rock slopes is, in a way, simpler than in soil slopes
because the displacements can be considered as rigid body transformations (Teza et al.
2007; Monserrat and Crosetto 2008; Abellan et al. 2009; Oppikofer et al. 2009). As a
consequence, it is easier to identify and decompose the movements as a combination of
translations and rotations of different parts of the slope. A good example for monitoring
surface displacements is the huge slope displacements that occurred at the eastern flank of
the Eiger (Switzerland), which was moving by more than 70 cm/day during the parox-
ysmal activity (Oppikofer et al. 2008). The detailed displacement analysis using the rigid
body transformations of the upper part of the Aknes rockslide in Norway combined with
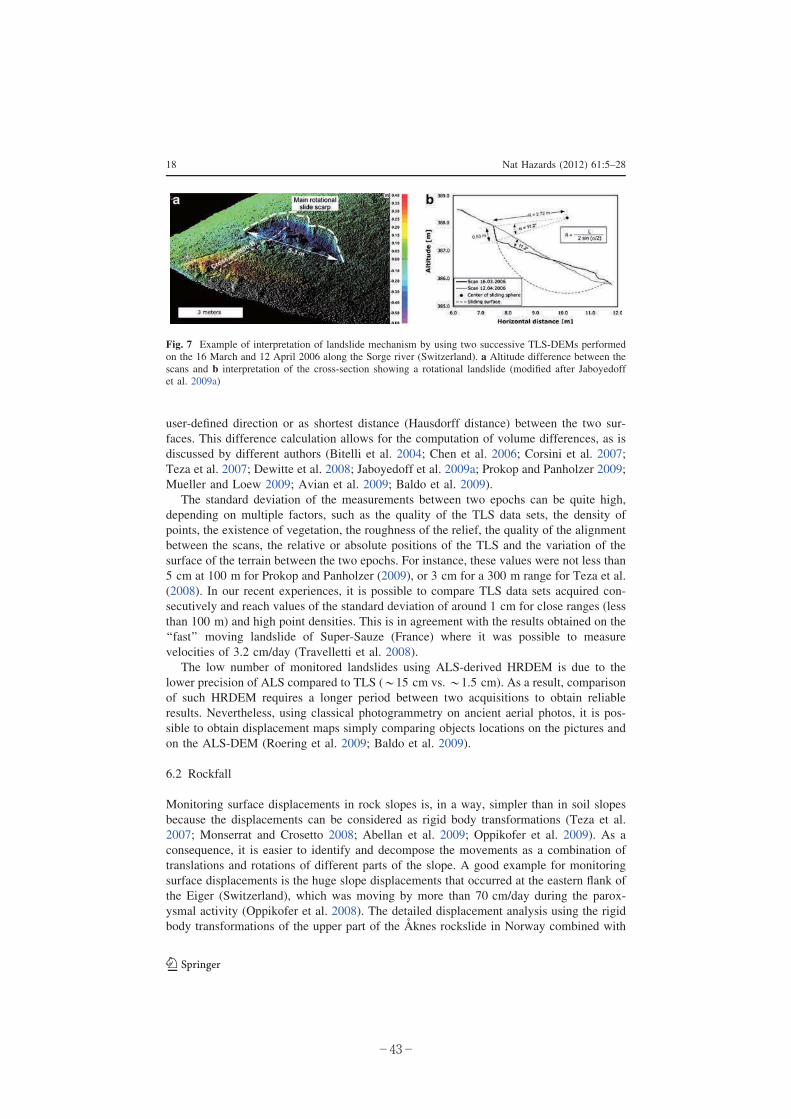
Fig. 7 Example of interpretation of landslide mechanism by using two successive TLS-DEMs performedon the 16 March and 12 April 2006 along the Sorge river (Switzerland). a Altitude difference between thescans and b interpretation of the cross-section showing a rotational landslide (modified after Jaboyedoffet al. 2009a)
18 Nat Hazards (2012) 61:5–28
123
-43-
detailed structural analysis allowed to derive the possible landslide mechanism (Oppikofer
et al. 2009). Recent developments improved this methodology by introducing Euler angles
to describe the rotational movement of the Cinque Torri rock towers in Italy (Viero et al.
2010).
Together with these monitoring results, the possibility to link spatial and temporal
prediction of rockfalls constitutes a great challenge for landslide monitoring. Indeed, two
different precursory indicators are currently being investigated: (1) the increase in rockfall
activity before the final collapse, shown by Rosser et al. (2007) for a hard rock cliff at the
coast of Staithes (UK); (2) the detection of precursory displacements is investigated for
large rockfalls (e.g. 125 cm/day preceding a 170,000 m3 partial collapse of the Eiger
rockslide, Oppikofer et al. 2008) and fragmental rockfalls (e.g. centimetric displacements
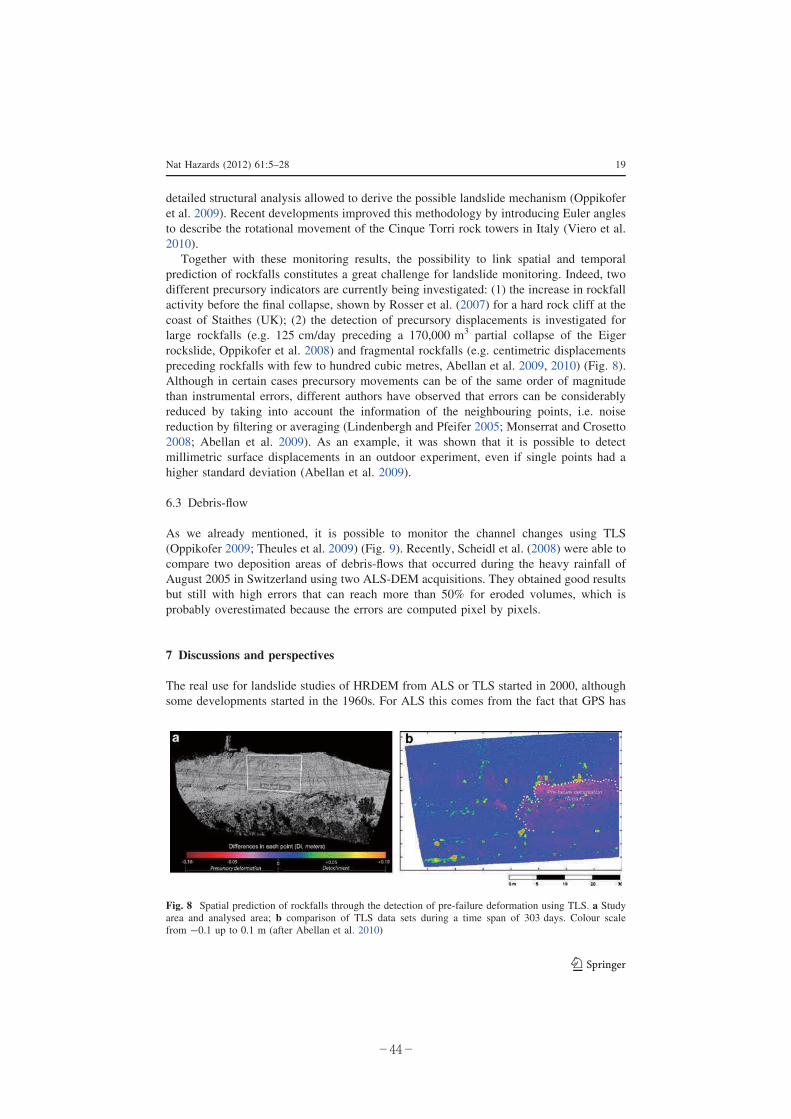
preceding rockfalls with few to hundred cubic metres, Abellan et al. 2009, 2010) (Fig. 8).
Although in certain cases precursory movements can be of the same order of magnitude
than instrumental errors, different authors have observed that errors can be considerably
reduced by taking into account the information of the neighbouring points, i.e. noise
reduction by filtering or averaging (Lindenbergh and Pfeifer 2005; Monserrat and Crosetto
2008; Abellan et al. 2009). As an example, it was shown that it is possible to detect
millimetric surface displacements in an outdoor experiment, even if single points had a
higher standard deviation (Abellan et al. 2009).
6.3 Debris-flow
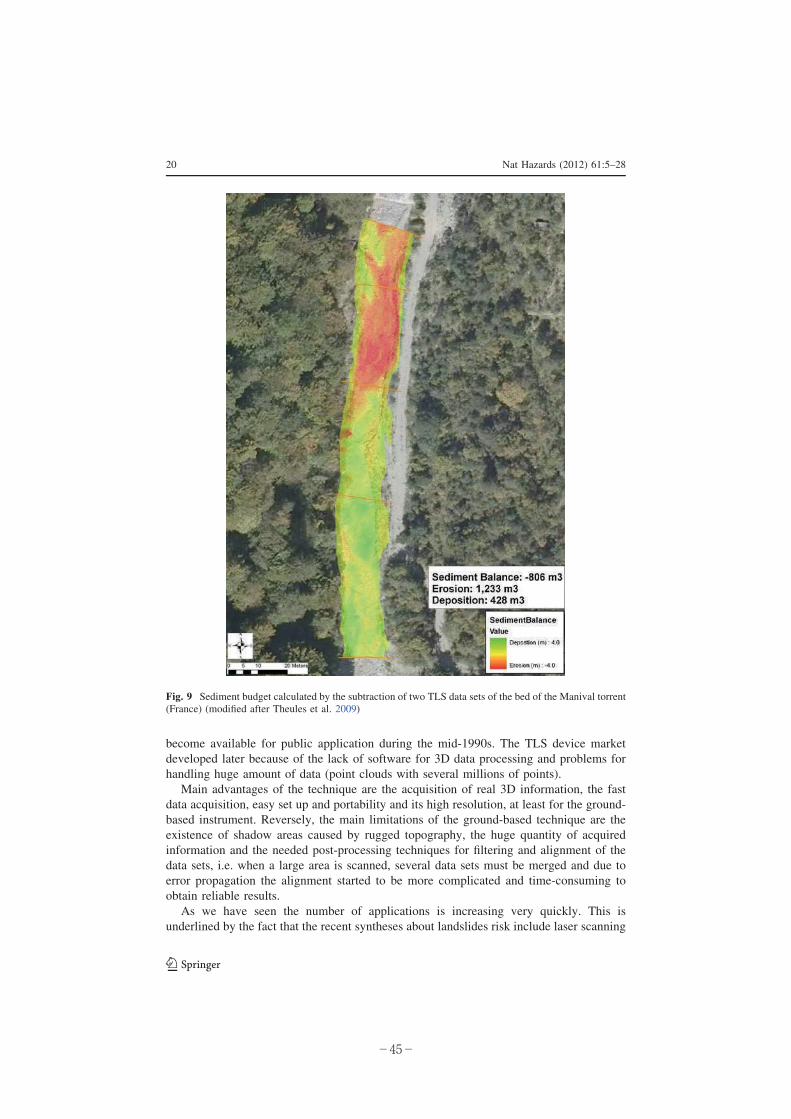
As we already mentioned, it is possible to monitor the channel changes using TLS
(Oppikofer 2009; Theules et al. 2009) (Fig. 9). Recently, Scheidl et al. (2008) were able to
compare two deposition areas of debris-flows that occurred during the heavy rainfall of
August 2005 in Switzerland using two ALS-DEM acquisitions. They obtained good results
but still with high errors that can reach more than 50% for eroded volumes, which is
probably overestimated because the errors are computed pixel by pixels.
7 Discussions and perspectives
The real use for landslide studies of HRDEM from ALS or TLS started in 2000, although
some developments started in the 1960s. For ALS this comes from the fact that GPS has
Fig. 8 Spatial prediction of rockfalls through the detection of pre-failure deformation using TLS. a Studyarea and analysed area; b comparison of TLS data sets during a time span of 303 days. Colour scalefrom -0.1 up to 0.1 m (after Abellan et al. 2010)
Nat Hazards (2012) 61:5–28 19
123
-44-
become available for public application during the mid-1990s. The TLS device market
developed later because of the lack of software for 3D data processing and problems for
handling huge amount of data (point clouds with several millions of points).
Main advantages of the technique are the acquisition of real 3D information, the fast
data acquisition, easy set up and portability and its high resolution, at least for the ground-
based instrument. Reversely, the main limitations of the ground-based technique are the
existence of shadow areas caused by rugged topography, the huge quantity of acquired
information and the needed post-processing techniques for filtering and alignment of the
data sets, i.e. when a large area is scanned, several data sets must be merged and due to
error propagation the alignment started to be more complicated and time-consuming to
obtain reliable results.
As we have seen the number of applications is increasing very quickly. This is
underlined by the fact that the recent syntheses about landslides risk include laser scanning
Fig. 9 Sediment budget calculated by the subtraction of two TLS data sets of the bed of the Manival torrent(France) (modified after Theules et al. 2009)
20 Nat Hazards (2012) 61:5–28
123
-45-
and HRDEM as important tools (Van Westen et al. 2006; Fell et al. 2008; Derron and
Jaboyedoff 2010). Figures including LIDAR images are presently published in papers
without any other information, which means that it is now considered as a routine method
demonstrative enough to be self-explanatory (Jibson 2006).
All the presented applications indicate that research has not yet well defined the limit of
the LIDAR techniques, without taking into account the future advances, especially
for monitoring purposes. It is clear that HRDEM is an inestimable support not only for
landslide mapping, but also for hazard assessment. The use of the full data quality for
modelling purposes is still not achieved.
LIDAR intensity provides some information on the material type, but it remains a
difficult task to discriminate different materials (e.g. lithologies) based on the laser
reflectivity because of the various causes of intensity variations. This has been applied with
good results to the classification of river bed at different epochs by identifying water–land
boundary (Hofle et al. 2009). Some research groups are now looking at further refinement
of LIDAR imaging coupled with other remote sensing techniques. LIDAR data sets
merged with RGB colours obtained from optical camera were tested on the Vesuvius crater
providing encouraging results but is still far from an operative one (Pesci et al. 2007,
2008). Coupled with LIDAR data sets, the hyperspectral camera permits to get additional
information on rock characteristics (Kurz et al. 2008).
One of the most promising advances is probably to analyse simultaneously InSAR
results and HRDEM. The problem is to obtain coherent results between LOS distance
changes from InSAR data and the 3D displacement vector extracted from LIDAR data. In
any case, the first results are already consistent for TLS (Teza et al. 2008) and for ALS
(Roering et al. 2009).
8 Conclusions
Above synthesis and considerations shows that HRDEM is increasingly being used in the
landslide community, becoming an essential tool for landslide risk management s.l. In a
few years, LIDAR sensors will probably be a standard tool for landslide analysis. Fol-
lowing the current trend, full coverage by ALS-DEM in most of the rich countries will be
reached within the next 10 years. As the technique is also progressing, more accurate and
precise ALS and TLS devices will appear, allowing for the generation of more accurate
DEM. In addition, the vertical cliffs will certainly be also better imaged by new equip-
ments, such as helicopter-based LIDAR sensors. Nevertheless, the huge amount of data
will remain a problem as the computers will need to be more powerful with increasing data
acquisition capacity as it is already the case with mobile LIDAR systems that have an
acquisition rate of up to 200 kHz.
The real challenge is to develop new methods to better take benefit from HRDEM.
Indeed a lot of new information can be extracted from such DEM that we not yet
contrived to do. Although great advances have been developed in geometrical aspects,
most of the conceptual models remain tied to the past. Could we combine these accurate
HRDEM with a better modelling of landslide mechanisms (including rockfalls and
debris-flows)? Is it possible to integrate surface measurements with early warning sys-
tems? The challenge for HRDEM exploitation is not only linked to landslide but also for
instance to the analysis of fracturing at the surface using HRDEM and its extrapolation
to underground.
Nat Hazards (2012) 61:5–28 21
123
-46-
Acknowledgments We are grateful to the National Swiss Foundation for Science project Number 200021-118105 and the EU project SafeLand (Grant Agreement No: 226479). We thank Dr. Greg Stock, geologist atYosemite National Park, for providing us LIDAR data and J. Theules from CEMAGREF (Grenoble, France)who provided us one figure for illustrating TLS and debris-flows. In addition we are grateful to MarieCharriere and Florian Humair for editing some parts of the texts. The three anonymous reviewers areacknowledged for their valuable comments that helped us to improve the manuscript.
Open Access This article is distributed under the terms of the Creative Commons Attribution Noncom-mercial License which permits any noncommercial use, distribution, and reproduction in any medium,provided the original author(s) and source are credited.
References
Abellan A, Vilaplana JM, Martinez J (2006) Application of a long-range terrestrial laser scanner to adetailed rockfall study at Vall de Nuria (Eastern Pyrenees, Spain). Eng Geol 88:136–148. doi:10.1016/j.enggeo.2006.09.012
Abellan A, Jaboyedoff M, Oppikofer T, Vilaplana JM (2009) Detection of millimetric deformation using aterrestrial laser scanner: experiment and application to rockfall event. Nat Hazards Earth Syst Sci9:365–372. doi:10.5194/nhess-9-365-2009
Abellan A, Vilaplana JM, Calvet J, Blanchard J (2010) Detection and spatial prediction of rockfalls bymeans of terrestrial laser scanning modelling. Geomorphology 119:162–171. doi:10.1016/j.geomorph.2010.03.016
Abellan A, Vilaplana JM, Calvet J, Garcia-Selles D, Asensio E (accepted) Rockfall monitoring by terrestriallaser scanning. Case study of the basaltic rock face at Castellfollit de la Roca (Catalonia, Spain). NatHazards Earth Syst Sci
Agliardi F, Crosta GB (2003) High resolution three-dimensional numerical modelling of rockfalls. Int JRock Mecha Mining Sci 40:455–471. doi:10.1016/S1365-1609(03)00021-2
Agliardi F, Crosta GB, Zanchi A, Ravazzi C (2009) Onset and timing of deep-seated gravitational slopedeformations in the eastern Alps, Italy. Geomorphology 103:113–129. doi:10.1016/j.geomorph.2007.09.015
Ardizzone F, Cardinali M, Galli M, Guzzetti F, Reichenbach P (2007) Identification and mapping of recentrainfall-induced landslides using elevation data collected by airborne Lidar. Nat Hazards Earth Syst Sci7:637–650. doi:10.5194/nhess-7-637-2007
Armesto J, Ordonez C, Alejano L, Arias P (2009) Terrestrial laser scanning used to determine the geometryof a granite boulder for stability analysis purposes. Geomorphology 106(3–4):271–277. doi:10.1016/j.geomorph.2008.11.005
Avian M, Kellerer-Pirklbauer A, Bauer A (2009) LiDAR for monitoring mass movements in permafrostenvironments at the cirque Hinteres Langtal, Austria, between 2000 and 2008. Nat Hazards Earth SystSci 9:1087–1094. doi:10.5194/nhess-9-1087-2009
Baldo M, Bicocchi C, Chiocchini U, Giordan D, Lollino G (2009) LiDAR monitoring of mass wastingprocesses: The Radicofani landslide, Province of Siena, Central Italy. Geomorphology 105:193–201.doi:10.1016/j.geomorph.2008.09.015
Baltsavias EP (1999) Airbone laser scanning: basic relations and formulas. ISPRS J Photogramm RemoteSens 54:199–214. doi:10.1016/S0924-2716(99)00015-5
Baum RL, Coe JA, Godt JW, Harp EL, Reid ME, Savage WZ, Schulz WH, Brien DL, Chleborad AF,McKenna JP, Michael JA (2005) Regional landslide-hazard assessment for Seattle, Washington, USA.Landslide 2:266–279. doi:10.1007/s10346-005-0023-y
Besl P, McKay N (1992) A method for registration of 3-D shapes. IEEE Trans Pattern Anal Mach Intell14:239–256. doi:10.1109/34.121791
Bitelli G, Dubbini M, Zanutta A (2004) Terrestrial laser scanning and digital photogrammetry techniques tomonitor landslide bodies. In: Proceedings of the XXth ISPRS congress, Istanbul, Turkey, CommissionV, WG V/2
Booth AM, Roering JJ, Perron JT (2009) Automated landslide mapping using spectral analysis and high-resolution topographic data: Puget Sound lowlands, Washington, and Portland Hills, Oregon. Geo-morphology 109:132–147. doi:10.1016/j.geomorph.2009.02.027
Borlat C, Epard JL, Jaboyedoff M (2007) Use of a laser-DTM for geological survey, structural interpretationand update of existing maps: example in the Jura Mountains (Switzerland). Geophys Res Abst 9:07424
22 Nat Hazards (2012) 61:5–28
123
-47-
Bornaz L, Lingua A, Rinaudo F (2002) Engineering and environmental applications of laser scannertechniques. Int Archi Photogramm Remote Sens 34(3B):40–43
Brideau MA, Yan M, Stead D (2009) The role of tectonic damage and brittle rock fracture in the devel-opment of large rock slope failures. Geomorphology 103:30–49. doi:10.1016/j.geomorph.2008.04.010
Bromhead EN, Curtis RD, Schofield W (1988) Observation and adjustment of a geodetic survey network formeasurement of landslide movement. In: Bonnard C, Balkema Publishers AA (eds) Proceedings of the5th international symposium on landslides. Lausanne, Switzerland, pp 383–386
Carnec C, Massonnet D, King C (1996) Two examples of the use of SAR interferometry on displacementfields of small spatial extent. Geophys Res Lett 23(24):3579–3582. doi:10.1029/96GL03042
Carter W, Shrestha R, Tuell D, Bloomquist D, Sartori M (2001) Airborne laser swath mapping shines newlight on earth’s topography. Eos, Trans, Am Geophys Union 82(46):549, 550, 555
Cavalli M, Marchi L (2008) Characterisation of the surface morphology of an alpine alluvial fan usingairborne LiDAR. Nat Hazards Earth Syst Sci 8:323–333. doi:10.5194/nhess-8-323-2008
Chen Y, Medioni G (1992) Object modelling by registration of multiple range images. Image Vis Comput10:145–155. doi:10.1016/0262-8856(92)90066-C
Chen RF, Chang KJ, Angelier J, Chan YC, Deffontaines B, Lee CT, Lin ML (2006) Topographical changesrevealed by high-resolution airborne LiDAR data: the 1999 Tsaoling landslide induced by the Chi-Chiearthquake. Eng Geol 88:160–172. doi:10.1016/j.enggeo.2006.09.008
Chigira M, Duan F, Yagi H, Furuya T (2004) Using an airbone laser scanner for the identification of shallowlandslides and susceptibility assessment in an area of ignimbrite overlain by permeable pyroclastics.Landslides 3:203–209. doi:10.1007/s10346-004-0029-x
Colesanti C, Ferretti A, Prati C, Rocca F (2003) Monitoring landslides and tectonic motions with thepermanent scatterers technique. Eng Geol 68:3–14. doi:10.1016/S0013-7952(02)00195-3
Corsini A, Borgatti L, Coren F, Vellico M (2007) Use of multitemporal airborne LiDAR surveys to analysepost-failure behaviour of earthslides. Can J Remote Sens 33(2):116–120
Corsini A, Cervi F, Daehne A, Ronchetti F (2009) Coupling geomorphic field observation and LIDARderivatives to map complex landslides. In: Malet JP, Remaıtre A, Bogaard T (eds) Landslides pro-cesses—from geomorphologic mapping to dynamic modeling, proceedings of the landslide processesconference, 6–7 February 2009, Strasbourg
Cruden DM, Varnes DJ (1996) Landslides investigation and mitigation, transportation research board. In:Turner AK, Schuster RL (eds) Landslide types and process, National Research Council, NationalAcademy Press, Special Report 247:36–75
Dallaire EE (1974) Electronic distance measuring revolution well under way. Civil Eng 44(10):66–71Derron MH, Jaboyedoff M (2010) Preface to the special issue. In: LIDAR and DEM techniques for
landslides monitoring and characterization. Nat Hazards Earth Syst Sci 10:1877–1879Derron MH, Blikra LH, Jaboyedoff M (2005) High resolution digital elevation model analysis for landslide
hazard assessment (Akerneset, Norway). In: Senneset K, Flaate K, Larsen JA (eds) Landslide andavalanches, ICFL, pp 101–106
Dewitte O, Jasselette J-C, Cornet Y, Van Den Eeckhaut M, Collignon A, Poesen J, Demoulin A (2008)Tracking landslide displacements by multi-temporal DTMs: a combined aerial stereophotogrammetricand LIDAR approach in western Belgium. Eng Geol 99:11–22. doi:10.1016/j.enggeo.2008.02.006
Dietrich WE, Bellugi D, Real de Asua R (2001) Validation of the shallow landslide model, SHALSTAB, forforest management. In: Wigmosta MS, Burges SJ (eds) Land use and watersheds: human influence onhydrology and geomorphology in urban and forest areas, Water Science and Application, 2:195–227
Dunning S, Massey C, Rosser N (2009) Structural and geomorphological features of landslides in theBhutan Himalaya derived from terrestrial laser scanning. Geomorphology 103:17–29. doi:10.1016/j.geomorph.2008.04.013
Duong H (2006) Full waveform analysis: Icesat laser data for land cover classification. In: ISPRS com-mission VII mid-term symposium ‘‘remote sensing: from pixels to processes’’, pp 30–35
Fardin N, Feng Q, Stephansson O (2004) Application of a new in situ 3D laser scanner to study the scaleeffect on the rock joint surface roughness. Int J Rock Mech Min Sci 41:329–335. doi:10.1016/S1365-1609(03)00111-4
Fell R, Corominas J, Bonnard C, Cascini L, Leroi E, Savage WZ (2008) Guidelines for landslide suscep-tibility, hazard and risk zoning for land use planning. Eng Geol 102:85–89. doi:10.1016/j.enggeo.2008.03.022
Feng Q, Sjogren P, Stephansson O, Jing L (2001) Measuring fracture orientation at exposed rock faces byusing a non-reflector total station. Eng Geol 59:133–146. doi:10.1016/S0013-7952(00)00070-3
Fernandez O (2005) Obtaining a best fitting plane through 3D georeferenced data. J Struct Geol 27:855–858.doi:10.1016/j.jsg.2004.12.004
Nat Hazards (2012) 61:5–28 23
123
-48-
Frattini P, Crosta G, Carrara A, Agliardi F (2008) Assessment of rockfall susceptibility by integratingstatistical and physically-based approaches. Geomorphology 94:419–437. doi:10.1016/j.geomorph.2006.10.037
Froese C, Moreno F, Jaboyedoff M, Cruden DM (2009) 25 years of movement monitoring on South Peak,Turtle Mountain: understanding the hazard. Can Geotech J 46:256–269. doi:10.1139/T08-121
Fruneau B, Achache J, Delacourt C (1996) Observation and modelling of the Saint-Etienne-de-Tineelandslide using SAR interferometry. Tectonophysics 265(3–4):181–190. doi:10.1016/S0040-1951(96)00047-9
Glenn NF, Streutker DR, Chadwick DJ, Thackray GD, Dorsch SJ (2006) Analysis of LiDAR-derivedtopographic information for characterizing and differentiating landslide morphology and activity.Geomorphology 73:131–148. doi:10.1016/j.geomorph.2005.07.006
Gordon S, Lichti D, Stewart M (2001) Application of a high-resolution, ground-based laser scanner fordeformation measurements. In: Proceedings of the 10th international FIG symposium on deformationmeasurements, Orange, California, USA, 19–22 March 2001, pp 23–32
Gunther A (2003) Slopemap: programs for automated mapping of geometrical and kinematical properties ofhard rock hill slopes. Comput Geosci 29(7):865–875. doi:10.1016/S0098-3004(03)00086-4
Guzzetti F, Reichenbach P, Wieczorek GF (2003) Rockfall hazards and risk assessment in the YosemiteValley, California, USA. Nat Hazards Earth Syst Sci 3:491–503. doi:10.5194/nhess-3-491-2003
Habib A (2008) Accuracy, quality assurance and quality control of LIDAR data, Chap 9. In: Shan J, TothCK (eds) Topographic laser ranging and scanning: principles and processing. CRC Press, Taylor &Francis, pp 269–294
Haneberg WC (2007) Directional roughness profiles from three-dimensional photogrammetric or laserscanner point clouds. In: Eberhardt E, Stead D, Morrison T (eds) Rock mechanics: meeting society’schallenges and demands. Proceedings of the 1st Canada—US rock mechanics symposium, Vancouver,Canada, May 27–31, 2007, Taylor & Francis, pp 101–106
Haneberg WC, Creighton AL, Medley EW, Jonas DA (2005) Use of LiDAR to assess slope hazards at theLihir gold mine, Papua New Guinea. In: Hungr O, Fell R, Couture R, Eberhardt E (eds) Proceedings ofthe international conference on landslide risk management. Vancouver, Taylor & Francis Group,Supplementary Volume (CD), Canada
Haneberg WC, Cole WF, Kasali G (2009) High-resolution lidar-based landslide hazard mapping andmodeling, UCSF Parnassus Campus; San Francisco, USA. Bull Eng Geol Environ 68:263–276. doi:10.1007/s10064-009-0204-3
Harding D (2008) Pulsed laser altimeter ranging techniques and implications for terrain mapping, Chap 5.In: Shan J, Toth CK (eds) Topographic laser ranging and scanning: principles and processing. CRCPress, Taylor & Francis, pp 173–194
Haugerud RA, Harding DJ, Johnson SY, Harless JL, Weaver CS, Sherrod BL (2003) High-resolution lidartopography of the Puget Lowland, Washington—A Bonanza for earth science. GSA Today 13:4–10
Heritage GL, Large ARG (2009) Laser scanning for the environmental sciences. Wiley-Blackwell, LondonHiremagalur J, Yen KS, Akin K, Bui T, Lasky, TA, Ravani B (2007) Creating standards and specifications
for the use of laser scanning in CalTrans projects. Technical report no F/CA/RI/2006/46, CaliforniaDepartment of Transportation, US (www.ahmct.ucdavis.edu/images/AHMCT_LidarFinalReport.pdf)
Hofle B, Vetter M, Pfeifer N, Mandlburger G, Stotter J (2009) Water surface mapping from airbone laserscanning using signal intensity and elevation data. Earth Surf Proc Land 34(12):1635–1649. doi:10.1002/esp.1853
Hoge FE, Swift RN, Frederick EB (1980) Water depth measurement using an airborne pulsed neon lasersystem. Appl Opt 19(6):871–883. doi:10.1364/AO.19.000871
Horton P, Jaboyedoff M, Bardou E (2008) Debris flow susceptibility mapping at a regional scale. In: Locat J,Perret D, Turmel D, Demers D, Leroueil S (eds) 4th Canadian conference on geohazards: from causesto management, Presse de l’Universite Laval, pp 399–406
Hungr O (2005) Classification and terminology. In: Jakob M, Hungr O (eds) Debris-flow hazards and relatedphenomena. Springer, Berlin/Heidelberg
Ingensand H (2006) Metrological aspects in terrestrial laser-scanning technology. In: Proceedings of the 3rdIAG/12th FIG symposium, Baden, Austria
Jaboyedoff M, Baillifard F, Couture R, Locat J, Locat P (2004a) New insight of geomorphology andlandslide prone area detection using DEM. In: Lacerda WA, Ehrlich M, Fontoura AB, Sayao A (eds)Landslides evaluation and stabilization. Balkema, pp 191–197
Jaboyedoff M, Baillifard F, Couture R, Locat J, Locat P (2004b) Toward preliminary hazard assessmentusing DEM topographic analysis and simple mechanical modeling by means of sloping local baselevel. In: Lacerda WA, Ehrlich M, Fontoura AB, Sayao A (eds) Landslides evaluation and stabiliza-tion. Balkema, pp 199–205
24 Nat Hazards (2012) 61:5–28
123
-49-
Jaboyedoff M, Baillifard F, Philipossian F, Rouiller JD (2004c) Assessing the fracture occurrence using the‘‘Weighted fracturing density’’: a step towards estimating rock instability hazard. Nat Hazards EarthSyst Sci 4:83–93. doi:10.5194/nhess-4-83-2004
Jaboyedoff M, Metzger R, Oppikofer T, Couture R, Derron MH, Locat J, Durmel D (2007) New insighttechniques to analyze rock-slope relief using DEM and 3D-imaging clouds points: COLTOP-3Dsoftware. In: Eberhardt E, Stead D, Morrison T (eds) Rock mechanics: meeting society’s challengesand demands. Taylor & Francis, London, pp 61–68
Jaboyedoff M, Pedrazzini A, Horton P, Loye A, Surace I (2008a) Preliminary slope mass movementssusceptibility mapping using LIDAR DEM. In: Proceedings of 61th Canadian geotechnical conference,pp 419–426
Jaboyedoff M, Oppikofer T, Minoia R, Locat J, Turmel D (2008b) Terrestrial LIDAR investigation of the2004 rockslide along Petit Champlain street, Quebec City (Quebec, Canada). In: Locat J, Perret D,Turmel D, Demers D, Leroueil S (eds) 4th Canadian conference on geohazards: from causes tomanagement. Presse de l’Universite Laval, pp 295–301
Jaboyedoff M, Oppikofer T, Locat A, Locat J, Turmel D, Robitaille D, Demers D, Locat P (2009a) Use ofground-based LIDAR for the analysis of retrogressive landslides in sensitive clay and of rotationallandslides in river banks. Can Geotech J 46:1379–1390. doi:10.1139/T09-073
Jaboyedoff M, Couture R, Locat P (2009b) Structural analysis of Turtle Mountain (Alberta) using digitalelevation model: toward a progressive failure. Geomorphology 103:5–16. doi:10.1016/j.geomorph.2008.04.012
Jaboyedoff M, Pedrazzini A, Loye A, Oppikofer T, Guell i Pons M (2009c) Earth flow in a complexgeological environment: the example of Pont Bourquin, Les Diablerets (Western Switzerland). In:Malet JP, Remaıtre A, Bogaard T (eds) Landslides processes—from geomorphologic mapping todynamic modeling, proceedings of the landslide processes conference, 6–7 February 2009, Strasbourg,France
Jakob M (2005) Debris-flow hazard analysis. In: Jakob M, Hungr O (eds) Debris-flow hazards and relatedphenomena. Springer, Berlin/Heidelberg
Janeras M, Navarro M, Arno G, Ruiz A, Kornus W, Talaya J, Barbera M, Lopez F (2004) LIDAR appli-cations to rock fall hazard assessment in Vall de Nuria. 4th ICA Mountain Cartography Workshop,30th September–2nd October 2004. Vall de Nuria, Catalonia, Spain
Jibson RW (2006) The 2005 La Conchita, California, landslide. Landslides 3:73–78. doi:10.1007/s10346-005-0011-2
Kamerman GW (1993) Laser radar (chapter 1). In: Fox CS (ed) The infrared and electro-optical systemshandbook. Infrared information analysis center. Ann Arbor, Michigan, pp 1–76
Kasai M, Ikeda M, Asahina T, Fujisawa K (2009) LiDAR-derived DEM evaluation of deep-seated land-slides in a steep and rocky region of Japan. Geomorphology 113:57–69. doi:10.1016/j.geomorph.2009.06.004
Keaton JR, DeGraff JV (1996) Surface observation and geologic mapping. In: Turner AK, Schuster RL (eds)Landslide types and process, National Research Council, National Academy Press, Special Report 247:178–230
Kemeny J, Post R (2003) Estimating three-dimensional rock discontinuity orientation from digital images offracture traces. Comput Geosci 29:65–77. doi:10.1016/S0098-3004(02)00106-1
Kemeny J, Turner K (2008) Ground based LIDAR. Rock slope Mapping and assessment. Technical report ofthe Central Federal Lands Highway Division US Department of Transportation FHWA-CFL/TD-08-006 (www.iaeg.info)
Krabill WB, Collins JG, Link LE, Swift RN, Butler ML (1984) Airbone laser topographic mapping results.Photogramm Eng Remote Sens 50(6):685–694
Krabill WB, Thomas RH, Martin CF, Swift RN, Frederick EB (1995) Accuracy of airbone laser altimetryover Greenland ice sheet. Int J Remote Sens 16(7):1211–1222. doi:10.1080/01431169508954472
Krabill WB, Frederick EB, Manizade S, Martin CF, Sonntag J, Swift RN, Thomas R, Wright W, Yungel J(1999) Rapid thinning of parts of the southern Greenland ice sheet. Science 283:1522–1524. doi:10.1126/science.283.5407.1522
Kurz TH, Buckley SJ, Howell JA, Schneider D (2008) Geological outcrop modeling and interpretation usingground based hyperspectral and laser scanning data fusion. Int Archi Photogramm Remote Sens37(B8):1229–1234
Lan H, Martin CD, Lim CH (2007) RockFall analyst: a GIS extension for three-dimensional and spatiallydistributed rockfall hazard modeling. Comput Geosci 33(2):262–279. doi:10.1016/j.cageo.2006.05.013
Lato M, Diederichs M, Hutchinson DJ, Harrap R (2009) Optimization of LiDAR scanning and processingfor automated structural evaluation of discontinuities in rockmasses. Int J Rock Mech Min Sci46:194–199. doi:10.1016/j.ijrmms.2008.04.007
Nat Hazards (2012) 61:5–28 25
123
-50-
Lichti DD (2007) Error modelling, calibration and analysis of an AM-CW terrestrial laser scanner system.ISPRS J Photogramm Remote Sens 61:307–324. doi:10.1016/j.isprsjprs.2006.10.004
Lichti DD, Jamtsho S (2006) Angular resolution of terrestrial laser scanners. Photogramm Rec 21:141–160.doi:10.1111/j.1477-9730.2006.00367.x
Lichti D, Stewart M, Tsakiri M, Snow A (2000) Benchmark tests on a three-dimensional laser scanningsystem. Geomat Res Australas 72:1–24
Lim M, Petley DN, Rosser NJ, Allison RJ, Long AJ, Pybus D (2006) Combined digital photogrammetry andtime-of-flight laser scanning for monitoring cliff evolution. Photogramm Rec 20:109–129. doi:10.1111/j.1477-9730.2005.00315.x
Lindenbergh R, Pfeifer N (2005) A statistical deformation analysis of two epochs of terrestrial laser data of alock. In: Proceedings of the 7th conference on optical 3D measurement techniques, Vienna, Austria,pp 61–70
Loye A, Jaboyedoff M, Pedrazzini A (2009) Identification of potential rockfall source areas at a regionalscale using a DEM-based geomorphometric analysis. Nat Hazards Earth Syst Sci 9:1643–1653. doi:10.5194/nhess-9-1643-2009
Manetti L, Steinmann G (2007) 3DeMoN ROBOVEC—integration of a new measuring instrument in anexisting generic remote monitoring platform. In: 7th international symposium on field measurements ingeomechanics, September 2007, Boston, MA, USA, pp 24–27
McKean J, Roering J (2004) Objective landslide detection and surface morphology mapping using high-resolution airborne laser altimetry. Geomorphology 57:331–351. doi:10.1016/S0169-555X(03)00164-8
Miller B (1965) Laser altimeter may aid photo mapping. Aviat Week Space Technol 88(13):60–64Monserrat O, Crosetto M (2008) Deformation measurement using terrestrial laser scanning data and least
squares 3D surface matching. ISPRS J Photogramm Remote Sens 63:142–154. doi:10.1016/j.isprsjprs.2007.07.008
Montgomery DR, Schmidt KM, Greenberg HM, Dietrich WE (2000) Forest clearing and regional land-sliding. Geology 28:311–314. doi:10.1130/0091-7613(2000)28\311:FCARL[2.0.CO;2
Mueller R, Loew S (2009) Predisposition and Cause of the Catastrophic Landslides of August 2005 inBrienz (Switzerland). Swiss J Geosci 102(2):331–344. doi:10.1007/s00015-009-1315-3
Oppikofer T (2009) Detection, analysis and monitoring of slope movements by high-resolution digitalelevation models. PhD Thesis, Institute of Geomatics and Analysis of Risks, Faculty of Geosciencesand Environment, University of Lausanne, Switzerland
Oppikofer T, Jaboyedoff M, Keusen HR (2008) Collapse at the eastern Eiger flank in the Swiss Alps. NatGeosci 1:531–535. doi:10.1038/ngeo258
Oppikofer T, Jaboyedoff M, Blikra L, Derron MH (2009) Characterization and monitoring of the Aknesrockslide using terrestrial laser scanning. Nat Hazards Earth Syst Sci 9:1643–1653. doi:10.5194/nhess-9-1003-2009
Pedrazzini A, Oppikofer T, Jaboyedoff M, Guell i Pons, M, Chantry R, Stampfli E (2010) Assessment ofrockslide and rockfall problems in an active quarry: case study of the Arvel quarry (western Swit-zerland). In: European rock mechanics symposium (EUROCK 2010), Lausanne, Switzerland. CRCPress, Leiden, pp 593–596
Pesci A, Loddo F, Conforti D (2007) The first terrestrial laser scanner application over Vesuvius: Highresolution model of a volcano crater. Int J Remote Sens 28(1):203–219. doi:10.1080/01431160500534473
Pesci A, Teza G, Ventura G (2008) Remote sensing of volcanic terrains by terrestrial laser scanner:preliminary reflectance and RGB implications for studying Vesuvius crater (Italy). Annals Geophys51:619–631
Petrie G, Toth CK (2008) I. Introduction to laser ranging, profiling and scanning, II. Airbone and spacebornelaser profiles and scanners, III. Terrestrial laser scanners (chapters 1 to 3). In: Shan J, Toth CK (eds)Topographic laser ranging and scanning: principles and processing, CRC Press, Taylor & Francis
Prokop A, Panholzer H (2009) Assessing the capability of terrestrial laser scanning for monitoring slowmoving landslides. Nat Hazards Earth Syst Sci 9:1921–1928. doi:10.5194/nhess-9-1921-2009
Roering JJ, Stimely LL, Mackey BH, Schmidt DA (2009) Using DInSAR airbone LIDAR, and archival airphotos to quantify landsliding and sediment transport. Geophys Res Lett 36:L19402. doi:10.1029/2009GL040374
Romana M (1993) A geomechanical classification for slopes: slope mass rating. In: Hudson JA (ed)Comprehensive rock engineering, vol 3. Pergamon Press, Oxford, pp 553–573
Rosser NJ, Petley DN, Lim M, Dunning SA, Allison RJ (2005) Terrestrial laser scanning for monitoring theprocess of hard rock coastal cliff erosion. Q J Eng Geol Hydrogeol 38:363–375. doi:10.1144/1470-9236/05-008
26 Nat Hazards (2012) 61:5–28
123
-51-
Rosser NJ, Lim N, Petley DN, Dunning S, Allison RJ (2007) Patterns of precursory rockfall prior to slopefailure. J Geophys Res 112(F4). doi:10.1029/2006JF000642
Rowlands KA, Jones LD, Whitworth M (2003) Landslide laser scanning: a new look at an old problem. Q JEng Geol Hydrogeol 36:155–157. doi:10.1144/1470-9236/2003-08
SafeLand deliverable 4.1 (2010) Review of techniques for landslide detection, fast characterization, rapidmapping and long-term monitoring. In: Michoud C, Abellan A, Derron M-H, Jaboyedoff M (eds)SafeLand European project. Available at http://www.safeland-fp7.eu
Savage WZ, Godt JW, Baum RL (2003) A model for spatially and temporal distributed shallow landslideinitiative by rainfall infiltration. In: Rickenmann D, Chen C (eds) Debris-flow hazards mitigation:mechanics, prediction, and assessment. Millpress, Rotterdam
Scheidl C, Rickenmann D, Chiari M (2008) The use of airborne LiDAR data for the analysis of debris flowevents in Switzerland. Nat Hazards Earth Syst Sci 8:1113–1127. doi:10.5194/nhess-8-1113-2008
Schulz WH (2007) Landslide susceptibility revealed by LIDAR imagery and historical records, Seattle,Washington. Eng Geol 89:67–87. doi:10.1016/j.enggeo.2006.09.019
Shan J, Toth K (2008) Topographic laser ranging and scanning: principles and processing. CRC Press,Taylor & Francis Group, LLC, UK
Shepherd EC (1965) Laser to watch height. New Scientist 1:33Singhroy V (2009) Satellite remote sensing applications for landslde detection and monitoring. In: Sassa K,
Canuti P (eds) Landslides—disaster risk reduction. Springer, Berlin/Heidelberg, pp 143–158Slob S, Hack R (2004) 3D terrestrial laser scanning as a new field measurement and monitoring technique.
In: Engineering geology for infrastructure planning in Europe: a European perspective, Lectures Notesin Earth Sciences, Springer, Berlin/Heidelberg, 104:179–189
Slob S, Hack H, Turner AK (2002) An approach to automate discontinuity measurements of rock faces usinglaser scanning techniques. In: Dinid da Gama C, Riberia e Sousa L (eds) Proceedings of ISRMEUROCK 2002, 25–28 November 2002, Funchal, Portugal, Sociedade Portuguesa de Geotecnia,pp 87–94
Soeters R, van Westen CJ (1996) Slope stability: recognition, analysis and zonation. In: Turner AK,Schuster RL (eds) Landslides investigation and mitigation, Transportation Research Board, NationalResearch Council, National Academy Press, Special Report 247:129–177
Squarzoni C, Delacourt C, Allemand P (2003) Nine years of spatial and temporal evolution of the La Valettelandslide observed by SAR interferometry. Eng Geol 68:53–66. doi:10.1016/S0013-7952(02)00198-9
Staley DM, Wasklewicz TA, Blaszczynski JS (2006) Surficial patterns of debris flow deposition on alluvialfans in Death Valley, CA using airborne laser swath mapping data. Geomorphology 74:152–163. doi:10.1016/j.geomorph.2005.07.014
Stolz A, Huggel C (2008) Debris flows in the Swiss National Park: the influence of different flow modelsand varying DEM grid size on modeling results. Landslides 5:311–319. doi:10.1007/s10346-008-0125-4
Stow R (1996) Application of SAR interferometry to the imaging and measurement of neotectonic move-ment applied to mining and other subsidence/downwarp modeling. In: Fringe 96 proceedings ESAworkshop on applications of ERS SAR interferometry, Zurich, Switzerland
Sturzenegger M, Stead D (2009) Quantifying discontinuity orientation and persistence on high mountainrock slopes and large landslides using terrestrial remote sensing techniques. Nat Hazards Earth Syst Sci9:267–287. doi:10.5194/nhess-9-267-2009
Sturzenegger M, Stead D, Froese C, Moreno F, Jaboyedoff M (2007a) Ground-based and airborne LiDARfor structure mapping of a large landslide: the Frank Slide. In: Eberhardt E, Stead D, Morrison T (eds)Rock mechanics: meeting society’s challenges and demands. Taylor & Francis, London, pp 925–932
Sturzenegger M, Yan M, Stead D, Elmo D (2007b) Application and limitations of ground-based laserscanning in rock slope characterization. In: Eberhardt E, Stead D, Morrison T (eds) Proceedings of thefirst Canadian US rock mechanics symposium. Taylor & Francis, London, pp 29–36
Tarchi D, Casagli N, Fanti R, Leva DD, Luzi G, Pasuto A, Pieraccini M, Silvano S (2003) Landslidemonitoring by using ground-based SAR interferometry: an example of application to the Tessinalandslide in Italy. Eng Geol 68:15–30. doi:10.1016/S0013-7952(02)00196-5
Tatone BS, Grasselli G (2009) A method to evaluate the three-dimensional roughness of fracture surfaces inbrittle geomaterials. Rev Sci Instrum 80(12). doi:10.1063/1.3266964
Teza G, Galgaro A, Zaltron N, Genevois R (2007) Terrestrial laser scanner to detect landslide displacementfields: a new approach. Int J Remote Sens 28:3425–3446. doi:10.1080/01431160601024234
Teza G, Pesci A, Genevois R, Galgaro A (2008) Characterization of landslide ground surface kinematicsfrom terrestrial laser scanning and strain field computation. Geomorphology 97:424–437. doi:10.1016/j.geomorph.2007.09.003
Nat Hazards (2012) 61:5–28 27
123
-52-
Theules JI, Loye A, Liebault F, Laigle D, Jaboyedoff M (2009) Sediment budget of a debris flow event inthe French Prealps. American Geophysical Union Fall Meeting 2009
Travelletti J, Oppikofer T, Delacourt C, Malet J, Jaboyedoff M (2008) Monitoring landslide displacementsduring a controlled rain experiment using a long-range terrestrial laser scanning (TLS). Int ArchiPhotogramm Remote Sens 37(B5):485–490
Trevisani S, Cavalli M, Marchi L (2009) Variogram maps from LiDAR data as fingerprints of surfacemorphology on scree slopes. Nat Hazards Earth Syst Sci 9:129–133. doi:10.5194/nhess-9-129-2009
Vallet J, Skaloud J (2004) Development and experiences with a fully-digital handheld mapping systemoperated from a helicopter. Int Archi Photogramm Remote Sens 35(B5):791–796
Van Den Eeckhaut M, Poesen J, Verstraeten G, Vanacker V, Nyssen J, Moeyersons J, van Beek LPH,Vandekerckhove L (2007) Use of LIDAR-derived images for mapping old landslides under forest.Earth Surf Proc Land 32:754–769. doi:10.1002/esp.1417
Van Westen CJ, Van Asch TWJ, Soeters R (2006) Landslide hazard and risk zonation—why is it still sodifficult? Bull Eng Geol Environ 65:67–184. doi:10.1007/s10064-005-0023-0
Viero A, Teza G, Massironi M, Jaboyedoff M, Galgaro A (2010) Laser scanning-based recognition ofrotational movements on a deep seated 2 gravitational instability: The Cinque Torri case (North-Eastern Italian Alps). Geomorphology 122:191–204. doi:10.1016/j.geomorph.2010.06.014
Voegtle T, Schwab I, Landes T (2008) Influences of different materials on the measurement of a TerrestrialLaser Scanner (TLS). In: Proceedings of the XXI congress, the international society for photogram-metry and remote sensing, ISPRS2008, vol XXXVII, Commission V, 3–11 July 2008, Beijing, China,pp 1061–1066
Wehr A, Lohr U (1999) Airborne laser scanning–an introduction and overview. ISPRS J PhotogrammRemote Sens 54:68–82. doi:10.1016/S0924-2716(99)00011-8
28 Nat Hazards (2012) 61:5–28
123
-53-