emerging techniques and technologies … techniques and technologies for large ... 700°c technology...
TRANSCRIPT
Final report
EMERGING TECHNIQUES AND TECHNOLOGIES FOR LARGE COMBUSTION PLANTS
UP TO 500 MWTH CAPACITY
EMTECH50-500 SUBGROUP FINAL REPORT
March 2012
This work was carried out for ADEME by Karlsruher Institut für Technologie (Michael HIETE and Simon SCHULTE-BEERBÜHL)
ADEME contact : Emmanuel FIANI Sustainable Production and Energy Division - ADEME (Angers)
UN-ECE Convention on Long-Range Transboundary Air PollutionExpert Group on Techno-Economic Issues

Any representation or reproduction of the contents herein, in whole or in part, without the consent of the author(s) or their assignees or successors, is illicit under the French Intellectual Property Code (article L 122-4) and constitutes an infringement of copyright sub-ject to penal sanctions. Authorized copying (article 122-5) is restricted to copies or reproductions for private use by the copier alone, excluding collective or group use, and to short citations and analyses integrated into works of a critical, pedagogical or informational nature, subject to compliance with the stipulations of articles L 122-10 – L 122-12 incl. of the Intellectual Property Code as regards reproduction by reprographic means.
3 Emerging techniques and technologies for large combustion plants up to 500 MWTH capacity
Summary
At its 28th Session, the Executive Body of the UN-ECE Geneva Convention on Long-Range Transboundary Air Pollution agreed on the 2011 work plan for the implementation of the Convention. Under “1.5 Techno-Economic Issues” item g) this work plan mandated the Expert Group on Techno-Economic Issues (EGTEI) to “Continue the work on emerging technologies for combustion plants with a capacity lower than 500 MWth” (ECE/EB.AIR/106/Add.2). Therefore, a subgroup was established within EGTEI to collect and validate information and data for emerging technologies relevant for large combustion plants (LCP) with a capacity lower than 500 MWth: the EmTech50-500 subgroup.
The EmTech50-500 work covered combustion plants from 50 MWth to 500 MWth, with a time horizon of 2030. Twenty-six technologies or techniques were thoroughly assessed by the subgroup. For each tech-nology/technique, a fact sheet was developed. Each fact sheet provides information on the potential the technology/technique might have before 2030, its research and implementation status, description of the technology, environmental benefits achieved, applicability, operational data, economic data, driving force for implementation, and reference literature used for developing the fact sheets.
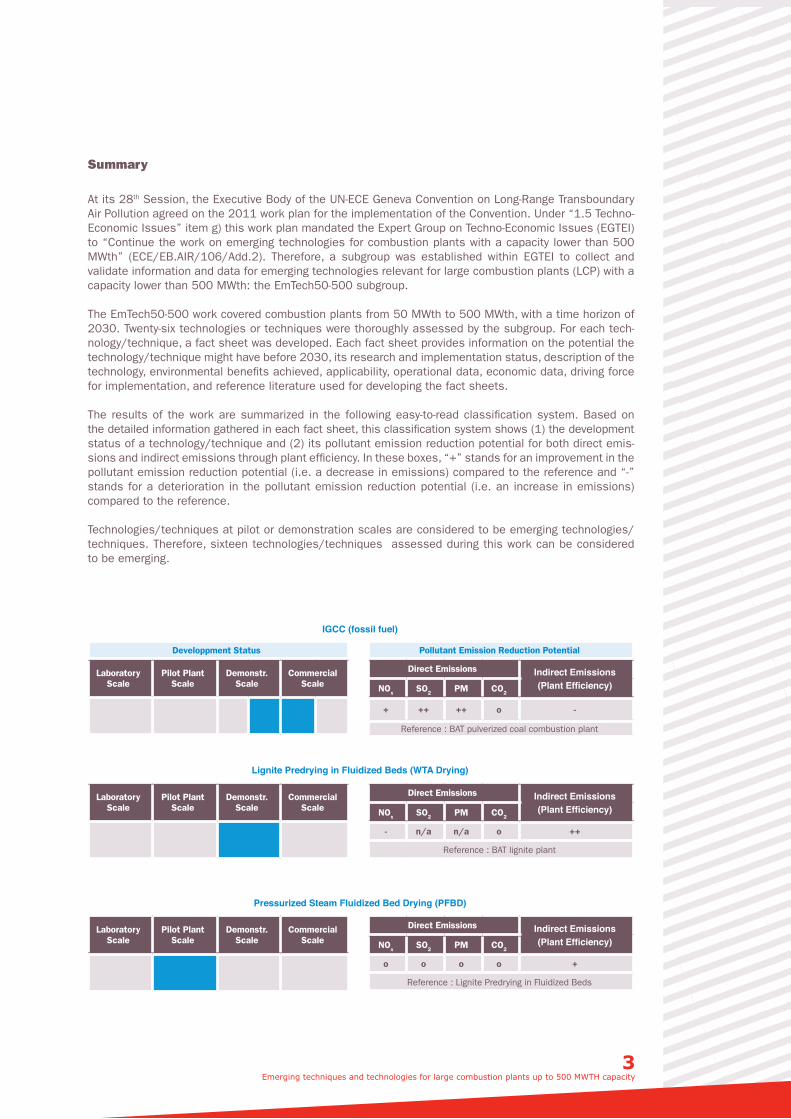
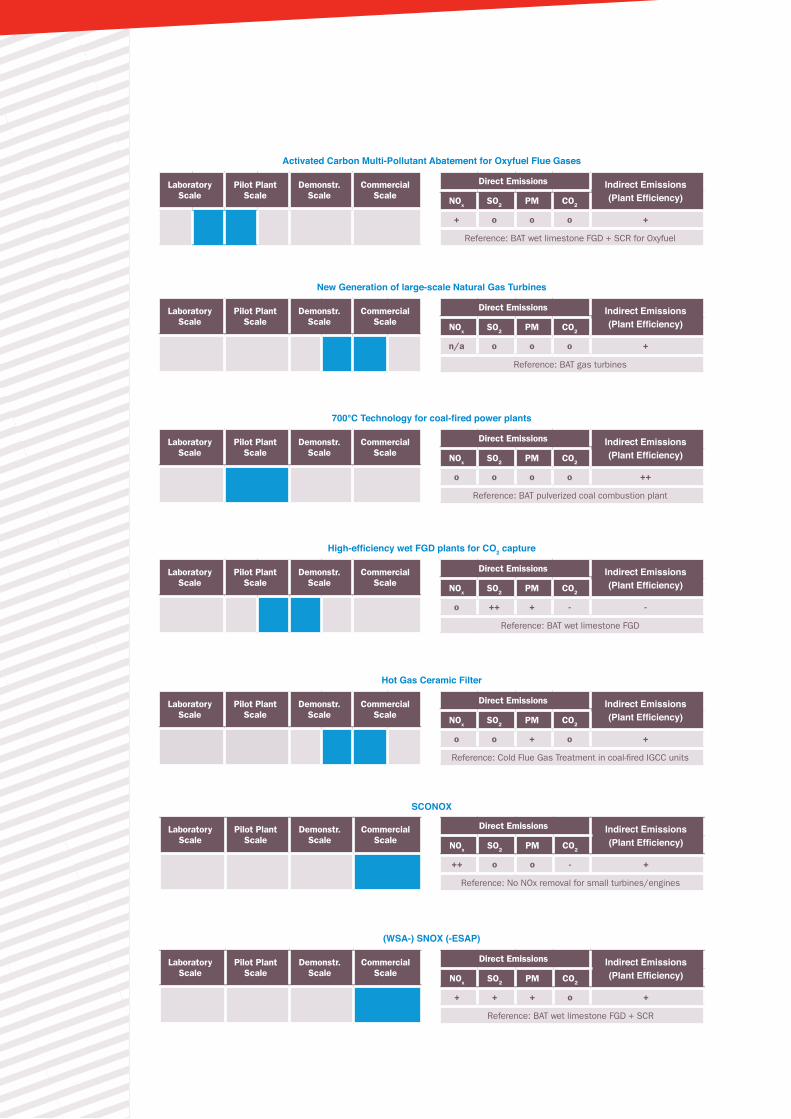
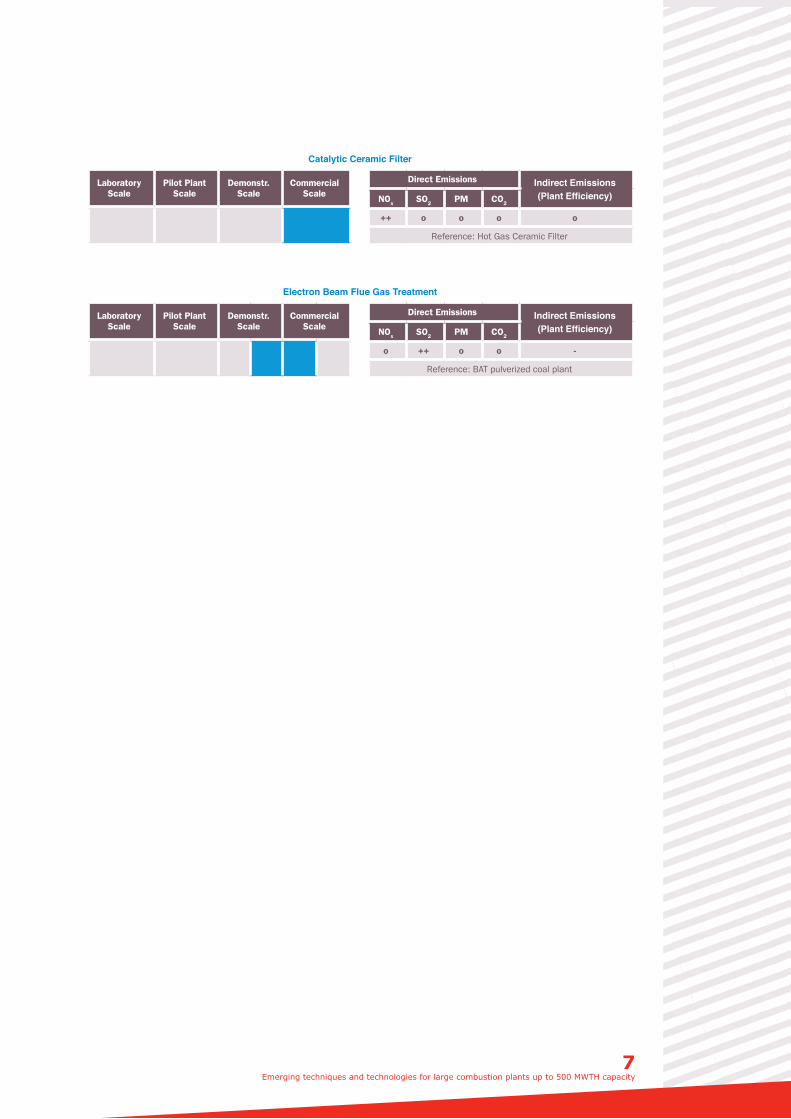
The results of the work are summarized in the following easy-to-read classification system. Based on the detailed information gathered in each fact sheet, this classification system shows (1) the development status of a technology/technique and (2) its pollutant emission reduction potential for both direct emis-sions and indirect emissions through plant efficiency. In these boxes, “+” stands for an improvement in the pollutant emission reduction potential (i.e. a decrease in emissions) compared to the reference and “-” stands for a deterioration in the pollutant emission reduction potential (i.e. an increase in emissions) compared to the reference.
Technologies/techniques at pilot or demonstration scales are considered to be emerging technologies/techniques. Therefore, sixteen technologies/techniques assessed during this work can be considered to be emerging.
IGCC (fossil fuel)
Lignite Predrying in Fluidized Beds (WTA Drying)
Developpment Status
Laboratory Scale
Pilot Plant Scale
Demonstr. Scale
Commercial Scale
Laboratory Scale
Pilot Plant Scale
Demonstr. Scale
Commercial Scale
Laboratory Scale
Pilot Plant Scale
Demonstr. Scale
Commercial Scale
Pollutant Emission Reduction Potential
Direct Emissions Indirect Emissions (Plant Efficiency)NOx SO2 PM CO2
+ ++ ++ o -
Reference : BAT pulverized coal combustion plant
Direct Emissions Indirect Emissions (Plant Efficiency)NOx SO2 PM CO2
- n/a n/a o ++
Reference : BAT lignite plant
Direct Emissions Indirect Emissions (Plant Efficiency)NOx SO2 PM CO2
o o o o +
Reference : Lignite Predrying in Fluidized Beds
Pressurized Steam Fluidized Bed Drying (PFBD)
Laboratory Scale
Pilot Plant Scale
Demonstr. Scale
Commercial Scale
Direct Emissions Indirect Emissions (Plant Efficiency)NOx SO2 PM CO2
+ ++ * + *
Reference : BAT pulverized coal combustion plant
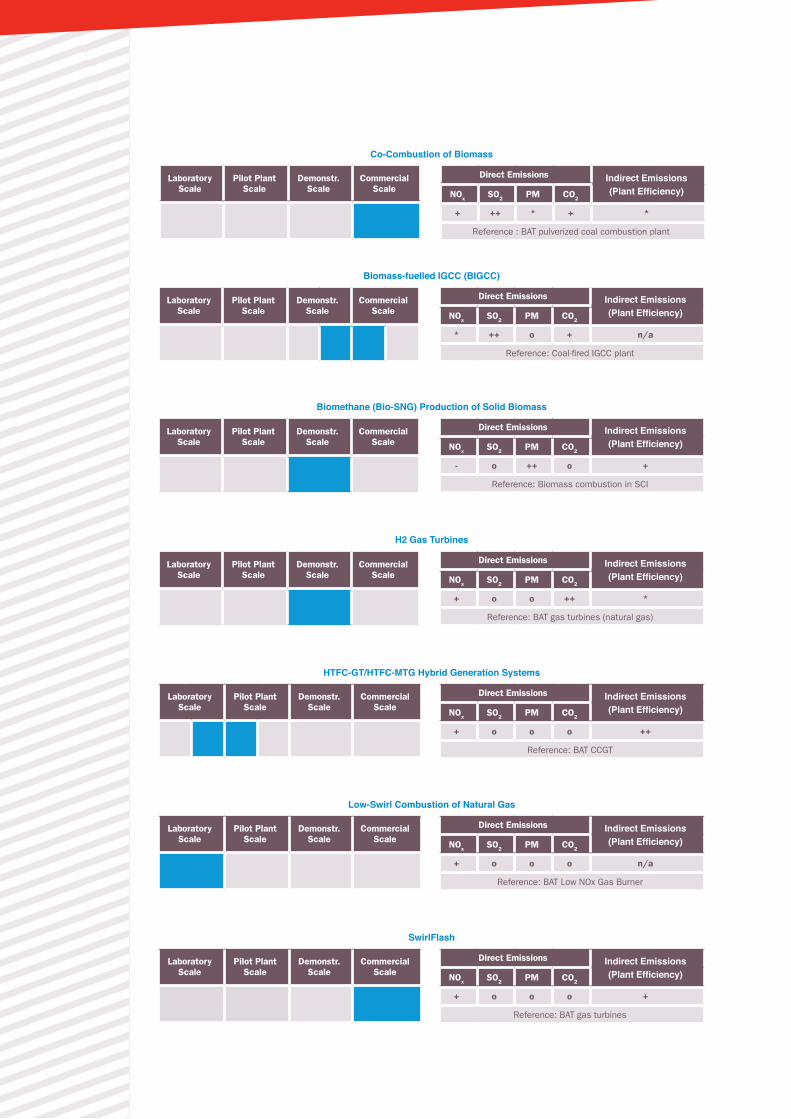
Co-Combustion of Biomass
Laboratory Scale
Pilot Plant Scale
Demonstr. Scale
Commercial Scale
Laboratory Scale
Pilot Plant Scale
Demonstr. Scale
Commercial Scale
Laboratory Scale
Pilot Plant Scale
Demonstr. Scale
Commercial Scale
Laboratory Scale
Pilot Plant Scale
Demonstr. Scale
Commercial Scale
Laboratory Scale
Pilot Plant Scale
Demonstr. Scale
Commercial Scale
Laboratory Scale
Pilot Plant Scale
Demonstr. Scale
Commercial Scale
Direct Emissions Indirect Emissions (Plant Efficiency)NOx SO2 PM CO2
* ++ o + n/a
Reference: Coal-fired IGCC plant
Direct Emissions Indirect Emissions (Plant Efficiency)NOx SO2 PM CO2
- o ++ o +
Reference: Biomass combustion in SCI
Direct Emissions Indirect Emissions (Plant Efficiency)NOx SO2 PM CO2
+ o o ++ *
Reference: BAT gas turbines (natural gas)
Direct Emissions Indirect Emissions (Plant Efficiency)NOx SO2 PM CO2
+ o o o ++
Reference: BAT CCGT
Direct Emissions Indirect Emissions (Plant Efficiency)NOx SO2 PM CO2
+ o o o n/a
Reference: BAT Low NOx Gas Burner
Direct Emissions Indirect Emissions (Plant Efficiency)NOx SO2 PM CO2
+ o o o +
Reference: BAT gas turbines
Biomass-fuelled IGCC (BIGCC)
Biomethane (Bio-SNG) Production of Solid Biomass
H2 Gas Turbines
HTFC-GT/HTFC-MTG Hybrid Generation Systems
Low-Swirl Combustion of Natural Gas
SwirlFlash
5 Emerging techniques and technologies for large combustion plants up to 500 MWTH capacity
Laboratory Scale
Pilot Plant Scale
Demonstr. Scale
Commercial Scale
Laboratory Scale
Pilot Plant Scale
Demonstr. Scale
Commercial Scale
Laboratory Scale
Pilot Plant Scale
Demonstr. Scale
Commercial Scale
Laboratory Scale
Pilot Plant Scale
Demonstr. Scale
Commercial Scale
Laboratory Scale
Pilot Plant Scale
Demonstr. Scale
Commercial Scale
Laboratory Scale
Pilot Plant Scale
Demonstr. Scale
Commercial Scale
Direct Emissions Indirect Emissions (Plant Efficiency)NOx SO2 PM CO2
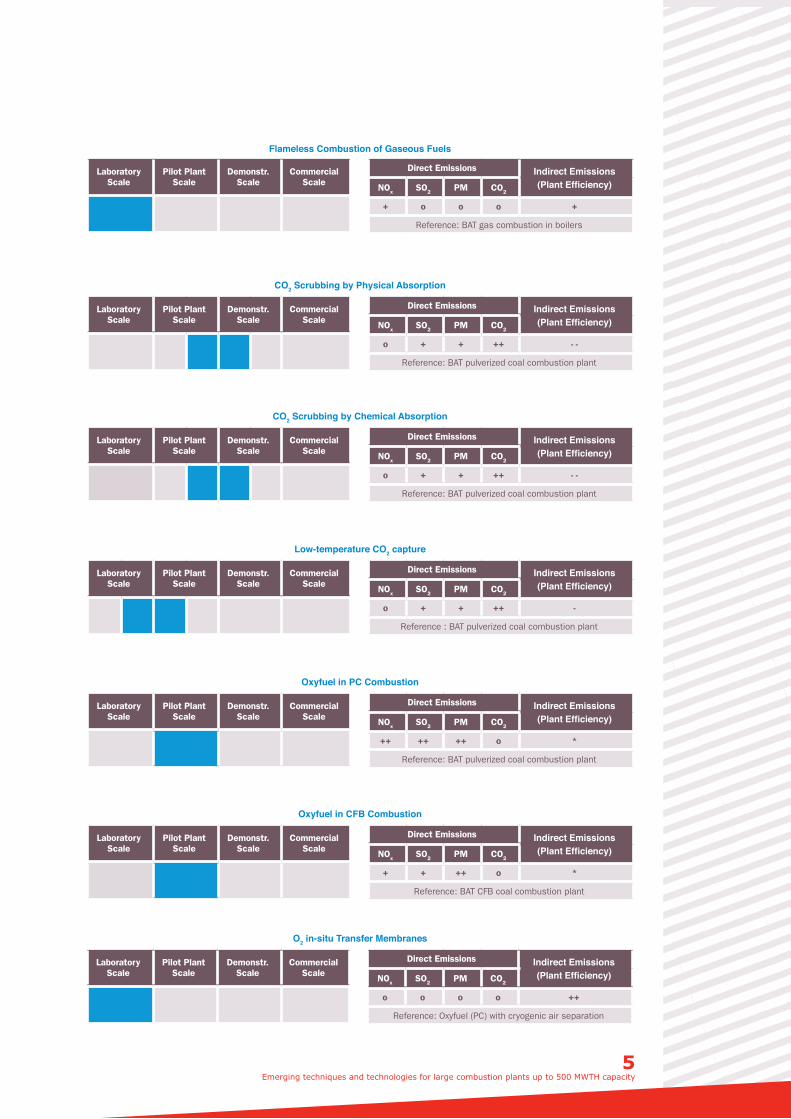
+ o o o +
Reference: BAT gas combustion in boilers
Direct Emissions Indirect Emissions (Plant Efficiency)NOx SO2 PM CO2
o + + ++ - -
Reference: BAT pulverized coal combustion plant
Direct Emissions Indirect Emissions (Plant Efficiency)NOx SO2 PM CO2
o + + ++ - -
Reference: BAT pulverized coal combustion plant
Direct Emissions Indirect Emissions (Plant Efficiency)NOx SO2 PM CO2
o + + ++ -
Reference : BAT pulverized coal combustion plant
Direct Emissions Indirect Emissions (Plant Efficiency)NOx SO2 PM CO2
++ ++ ++ o *
Reference: BAT pulverized coal combustion plant
Direct Emissions Indirect Emissions (Plant Efficiency)NOx SO2 PM CO2
+ + ++ o *
Reference: BAT CFB coal combustion plant
Flameless Combustion of Gaseous Fuels
CO2 Scrubbing by Physical Absorption
CO2 Scrubbing by Chemical Absorption
Low-temperature CO2 capture
Oxyfuel in PC Combustion
Oxyfuel in CFB Combustion
Laboratory Scale
Pilot Plant Scale
Demonstr. Scale
Commercial Scale
Direct Emissions Indirect Emissions (Plant Efficiency)NOx SO2 PM CO2
o o o o ++
Reference: Oxyfuel (PC) with cryogenic air separation
O2 in-situ Transfer Membranes
Laboratory Scale
Pilot Plant Scale
Demonstr. Scale
Commercial Scale
Laboratory Scale
Pilot Plant Scale
Demonstr. Scale
Commercial Scale
Laboratory Scale
Pilot Plant Scale
Demonstr. Scale
Commercial Scale
Laboratory Scale
Pilot Plant Scale
Demonstr. Scale
Commercial Scale
Laboratory Scale
Pilot Plant Scale
Demonstr. Scale
Commercial Scale
Direct Emissions Indirect Emissions (Plant Efficiency)NOx SO2 PM CO2
+ o o o +
Reference: BAT wet limestone FGD + SCR for Oxyfuel
Direct Emissions Indirect Emissions (Plant Efficiency)NOx SO2 PM CO2
n/a o o o +
Reference: BAT gas turbines
Direct Emissions Indirect Emissions (Plant Efficiency)NOx SO2 PM CO2
o o o o ++
Reference: BAT pulverized coal combustion plant
Direct Emissions Indirect Emissions (Plant Efficiency)NOx SO2 PM CO2
o ++ + - -
Reference: BAT wet limestone FGD
Direct Emissions Indirect Emissions (Plant Efficiency)NOx SO2 PM CO2
o o + o +
Reference: Cold Flue Gas Treatment in coal-fired IGCC units
Activated Carbon Multi-Pollutant Abatement for Oxyfuel Flue Gases
New Generation of large-scale Natural Gas Turbines
700°C Technology for coal-fired power plants
High-efficiency wet FGD plants for CO2 capture
Hot Gas Ceramic Filter
Laboratory Scale
Pilot Plant Scale
Demonstr. Scale
Commercial Scale
Laboratory Scale
Pilot Plant Scale
Demonstr. Scale
Commercial Scale
Direct Emissions Indirect Emissions (Plant Efficiency)NOx SO2 PM CO2
++ o o - +
Reference: No NOx removal for small turbines/engines
Direct Emissions Indirect Emissions (Plant Efficiency)NOx SO2 PM CO2
+ + + o +
Reference: BAT wet limestone FGD + SCR
SCONOX
(WSA-) SNOX (-ESAP)
7 Emerging techniques and technologies for large combustion plants up to 500 MWTH capacity
Laboratory Scale
Pilot Plant Scale
Demonstr. Scale
Commercial Scale
Laboratory Scale
Pilot Plant Scale
Demonstr. Scale
Commercial Scale
Direct Emissions Indirect Emissions (Plant Efficiency)NOx SO2 PM CO2
++ o o o o
Reference: Hot Gas Ceramic Filter
Direct Emissions Indirect Emissions (Plant Efficiency)NOx SO2 PM CO2
o ++ o o -
Reference: BAT pulverized coal plant
Catalytic Ceramic Filter
Electron Beam Flue Gas Treatment
Table of contents
Summary .....................................................................................................................................................3
Table of contents .......................................................................................................................................8
Abbreviations and Acronyms .................................................................................................................10
List of Figures ...........................................................................................................................................11
1. Introduction .............................................................................................................................12
1.1. Background and objectives .....................................................................................................12
1.2. Organization of work .................................................................................................................12
1.3. Technologies/techniques description approach .................................................................13
2. Scope of the Report .............................................................................................................15
2.1. Large combustion plants 50-500 MWth ...............................................................................15
2.2. Categories of assessed techniques and technologies .....................................................15
2.3. Future work .................................................................................................................................15
3. Solid Fossil Fuel Combustion Technologies .................................................................16
3.1. Integrated Gasification Combined Cycle (IGCC) ..................................................................16
3.2. Lignite predrying in fluidized beds (WTA drying) ..................................................................20
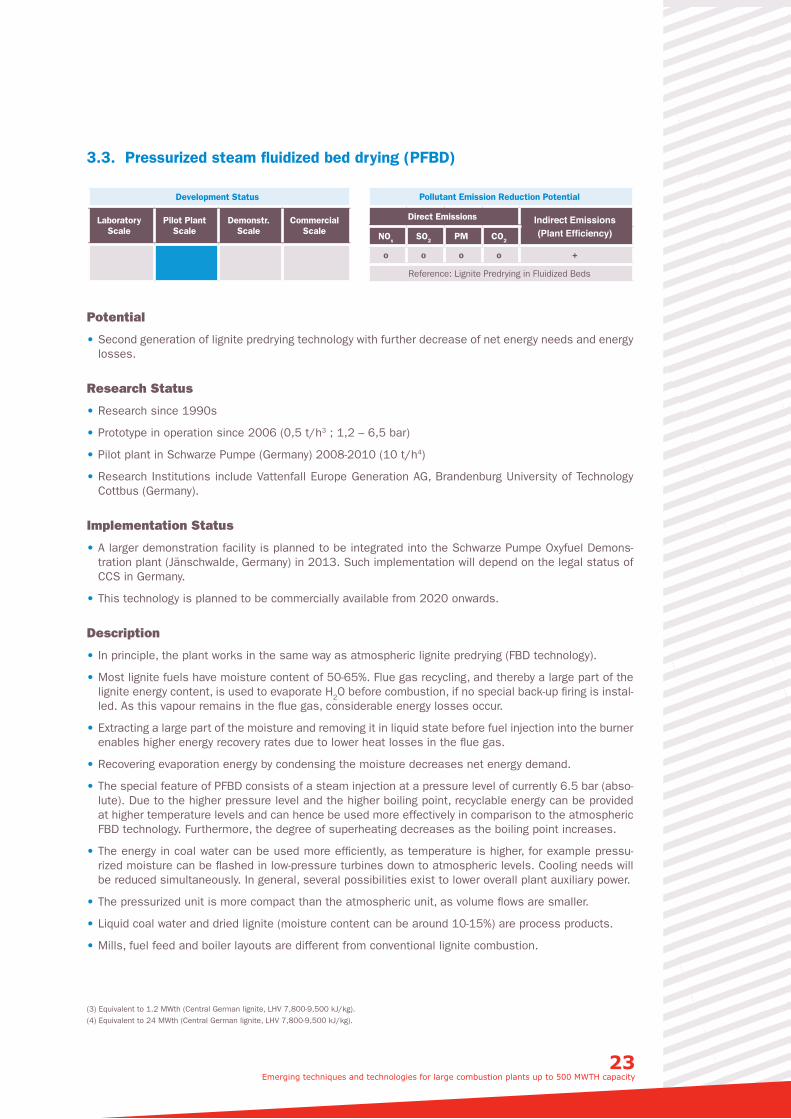
3.3. Pressurized steam fluidized bed drying (PFBD) ...................................................................23
4. Technologies for the Use of Biomass .............................................................................26
4.1. Types of biomass gasifiers – a short overview ...................................................................26
4.2. Co-combustion of biomass......................................................................................................27
4.3. Biomass-fuelled IGCC (BIGCC) ...............................................................................................29
4.4. Biomethane (Bio-SNG) production of solid biomass ..........................................................31
5. Gaseous Fuel Combustion Technologies.......................................................................34
5.1. H2 gas turbines ..........................................................................................................................33
5.2. HTFC-GT/HTFC-MTG hybrid generation systems .................................................................36
5.3. Low-swirl combustion of natural gas .....................................................................................39
5.4. Swirl Flash ..................................................................................................................................40
5.5. Flameless combustion of gaseous fuels .............................................................................42
6. CO2 Abatement Techniques and Technologies ............................................................46
6.1. CO2 scrubbing by physical absorption .................................................................................46
6.2. CO2 scrubbing by chemical absorption ................................................................................48
6.3. Low-temperature CO2 capture .................................................................................................51
6.4. Oxyfuel combustion ..................................................................................................................53
6.4.1. Oxyfuel in PC combustion ........................................................................................................53
6.4.2. Oxyfuel in CFB combustion......................................................................................................55
6.4.3. In-situ oxygen membranes for oxyfuel boilers .....................................................................57
6.4.4. Activated carbon multi-pollutant abatement technique for oxyfuel flue gases .............59
9 Emerging techniques and technologies for large combustion plants up to 500 MWTH capacity
7. Pollutant Reduction through High-Efficiency Technologies ...................................61
7.1. New generation of large-scale natural gas turbines ..........................................................61
7.2. 700°C technology in coal-fired power plants .......................................................................63
8. Mono-Pollutant Abatement Techniques .........................................................................65
8.1. High-efficiency wet FGD plants for CO2 capture ..................................................................65
8.2. Hot gas ceramic filters .............................................................................................................67
9. Multi-Pollutant Abatement Techniques ..........................................................................70
9.1. SCONOx (selective CO and NOx removal) .............................................................................70
9.2. (WSA-) SNOX (-ESAP) ................................................................................................................72
9.3 Catalytic ceramic bag filters ....................................................................................................75
9.4. Electron beam flue gas treatment .........................................................................................76
10. Techniques Which Have Not Been Considered ...........................................................78
Abbreviations and Acronyms
BAT Best Available Technique
BFB Bubbling Fluidized Bed
BRef Best Available Techniques Reference Document
CCS Carbon Capture and Storage
(FI/P) CFB (Fast Internal/Pressurized) Circulating Fluidized Bed
CHP Combined Heat and Power
DOE/NETL Department of Energy/National Energy Technology Laboratory
DLN Dry Low NOx
EB-FGT Electron Beam Flue Gas Treatment
EGTEI Expert Group on Techno-Economic Issues
ELV Emission Limit Value
EPA Environmental Protection Agency
ESP Electrostatic Precipitator
(P)FBD (Pressurized) Fluidized Bed Drying
FF Fabric Filter
FGD Flue Gas Desulphurization
(B)IGCC (Biomass) Integrated Gasification Combined Cycle
GT Gas Turbine
LCP Large Combustion Plant (> 50 MWth)
LHV/HHV Lower Heating Value/Higher Heating Value
LOI Loss on Ignition
LSI/HIS Low-swirl Injection/High-swirl Injection
LSC Low-swirl Combustion
MDEA Methyldiethanolamine
MEA Monoethanolamine
MCFC Molten Carbonate Fuel Cell
MTG Microturbine Generator
NMVOC Non-methane volatile organic compounds
OTM Oxygen Transfer Membrane
PC Pulverized Coal
PCC Post Combustion Capture of CO2
RTD FP Framework Programme for Research and Technological Development of the European Union
SCI Small Combustion Installations (< 50 MWth)
SCR Selective Catalytic Reduction of NOx
SNG Substitute Natural Gas
SOFC Solid Oxide Fuel Cell
11 Emerging techniques and technologies for large combustion plants up to 500 MWTH capacity
List of Figures
Figure 1: Technology classification system ......................................................................................................................13
Figure 2: Diagram of Tampa Electric IGCC unit (www.tampaelectric.com) .........................................................................17
Figure 3: Development of IGCC net plant efficiencies for coal-based plants without CCS (Karg, 2009) ............................19
Figure 4: Roadmap of specific CO2 emissions for lignite power plants (Klutz, 2010) ........................................................20
Figure 5: Schematic layout of a fluidized bed predrying concept (Klutz, 2010) ................................................................21
Figure 6: Scheme of a PFBD unit (www.braunkohletrocknung.de) ...................................................................................24
Figure 7: General process layout of a bio-methane production unit (v. d. Meijden et al., 2009) .......................................32
Figure 8: Development roadmap (Bradley and Fadok, Advanced Hydrogen Turbine Development Update, 2009) .............34
Figure 9: Envisaged process scheme of a 300 MW SOFC-GT plant (Samuelsen, 2004) ...................................................37
Figure 10: Comparison of low-swirl fuel injector to high-swirl fuel injector at a 7.7 MW «Taurus70» gas turbine
(Berkeley Lab, 2011). ......................................................................................................................................39
Figure 11: Typical picture of combustion occurring from a flameless burner (Stierlin, 2011) .............................................43
Figure 12: Classification of flameless combustion with regard to temperature and recirculation ratio [Kv]
(Milani and Wünning, 2001). ...........................................................................................................................43
Figure 13: NOx emission benchmark for varying air preheat temperatures (Milani and Wünning, 2001). ............................44
Figure 14: Process flowsheet of physical CO2 absorption unit and syngas preparation at Buggenum test facility
(Gnutek, 2010) ...............................................................................................................................................47
Figure 15: Scheme of chemical CO2 absorption unit (CO2CRC, 2011) ..............................................................................49
Figure 16: Oyxfuel/oxycombustion plant layout at Schwarze Pumpe, Germany (Anhede, 2009) .........................................54
Figure 17: El Bierzo oxyfuel test facility consisting of one PC and one CFB boiler (Fundación Ciudad de la Energia, 2009) 56
Figure 18: Layout of a 4-end concept (LHS) and 3-end concept (RHS) (Davidan, 2011) ...................................................58
Figure 19: Schematic layout of activated carbon absorption system (Shah, 2010) ............................................................59
Figure 20: Scheme of SGTS-8000H with its main new features (Fischer, 2008) ................................................................62
Figure 21: Possible setup of ESP and wet FGD for CCS use (Reissner and Meschgbiz, Flue Gas Desulphurization
as a Key Requirement of PCC) .........................................................................................................................66
Figure 22: Schematic ceramic filter tube module (Tri-Mer, 2011) ......................................................................................68
Figure 23: Emission reduction potential for varying inlet concentrations (Emera, 2009) ....................................................71
Figure 24: WSA-SNOX process layout of Schwechat Mineral Oil Refinery (Weigl, 2008) .....................................................73
Figure 25: WSA-SNOX unit at petcoke and HFO fired boilers in Gela, Italy (Schoubye, 2011) ............................................74
Figure 26: Construction principle of catalytically active ceramic filter tube (Tri-Mer, 2011) ................................................75
Figure 27: Process layout of an EB-FGT test facility (www.gec.jp) .......................................................................................77
Figure 28: EB-FGT engineering layout for the Sviloza plant, Bulgaria (Kim et al., 2009) .....................................................77
1. Introduction
i 1.1. Background and objectives
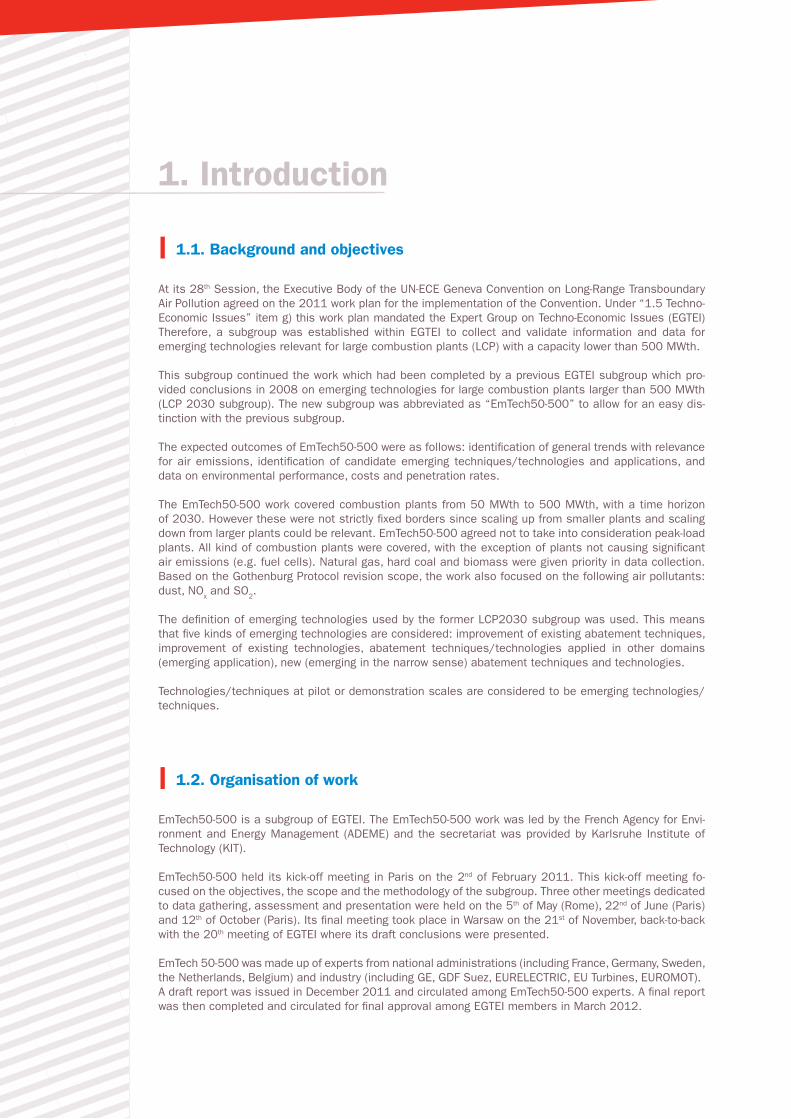
At its 28th Session, the Executive Body of the UN-ECE Geneva Convention on Long-Range Transboundary Air Pollution agreed on the 2011 work plan for the implementation of the Convention. Under “1.5 Techno-Economic Issues” item g) this work plan mandated the Expert Group on Techno-Economic Issues (EGTEI) Therefore, a subgroup was established within EGTEI to collect and validate information and data for emerging technologies relevant for large combustion plants (LCP) with a capacity lower than 500 MWth.
This subgroup continued the work which had been completed by a previous EGTEI subgroup which pro-vided conclusions in 2008 on emerging technologies for large combustion plants larger than 500 MWth (LCP 2030 subgroup). The new subgroup was abbreviated as “EmTech50-500” to allow for an easy dis-tinction with the previous subgroup.
The expected outcomes of EmTech50-500 were as follows: identification of general trends with relevance for air emissions, identification of candidate emerging techniques/technologies and applications, and data on environmental performance, costs and penetration rates.
The EmTech50-500 work covered combustion plants from 50 MWth to 500 MWth, with a time horizon of 2030. However these were not strictly fixed borders since scaling up from smaller plants and scaling down from larger plants could be relevant. EmTech50-500 agreed not to take into consideration peak-load plants. All kind of combustion plants were covered, with the exception of plants not causing significant air emissions (e.g. fuel cells). Natural gas, hard coal and biomass were given priority in data collection. Based on the Gothenburg Protocol revision scope, the work also focused on the following air pollutants: dust, NOx and SO2.
The definition of emerging technologies used by the former LCP2030 subgroup was used. This means that five kinds of emerging technologies are considered: improvement of existing abatement techniques, improvement of existing technologies, abatement techniques/technologies applied in other domains (emerging application), new (emerging in the narrow sense) abatement techniques and technologies.
Technologies/techniques at pilot or demonstration scales are considered to be emerging technologies/techniques.
i 1.2. Organisation of work
EmTech50-500 is a subgroup of EGTEI. The EmTech50-500 work was led by the French Agency for Envi-ronment and Energy Management (ADEME) and the secretariat was provided by Karlsruhe Institute of Technology (KIT).
EmTech50-500 held its kick-off meeting in Paris on the 2nd of February 2011. This kick-off meeting fo-cused on the objectives, the scope and the methodology of the subgroup. Three other meetings dedicated to data gathering, assessment and presentation were held on the 5th of May (Rome), 22nd of June (Paris) and 12th of October (Paris). Its final meeting took place in Warsaw on the 21st of November, back-to-back with the 20th meeting of EGTEI where its draft conclusions were presented.
EmTech 50-500 was made up of experts from national administrations (including France, Germany, Sweden, the Netherlands, Belgium) and industry (including GE, GDF Suez, EURELECTRIC, EU Turbines, EUROMOT).A draft report was issued in December 2011 and circulated among EmTech50-500 experts. A final report was then completed and circulated for final approval among EGTEI members in March 2012.
13 Emerging techniques and technologies for large combustion plants up to 500 MWTH capacity
i 1.3. Technologies/techniques description approach
Technology Classification System
As the objective of this report is to give an overview of a number of emerging techniques and technologies which are currently being developed, it was decided to use an easy-to-read description approach. Hence, a summary description in two boxes is used for each technology/technique. The content of these boxes is based on the detailed information gathered in each technology/technique fact sheet (see below).
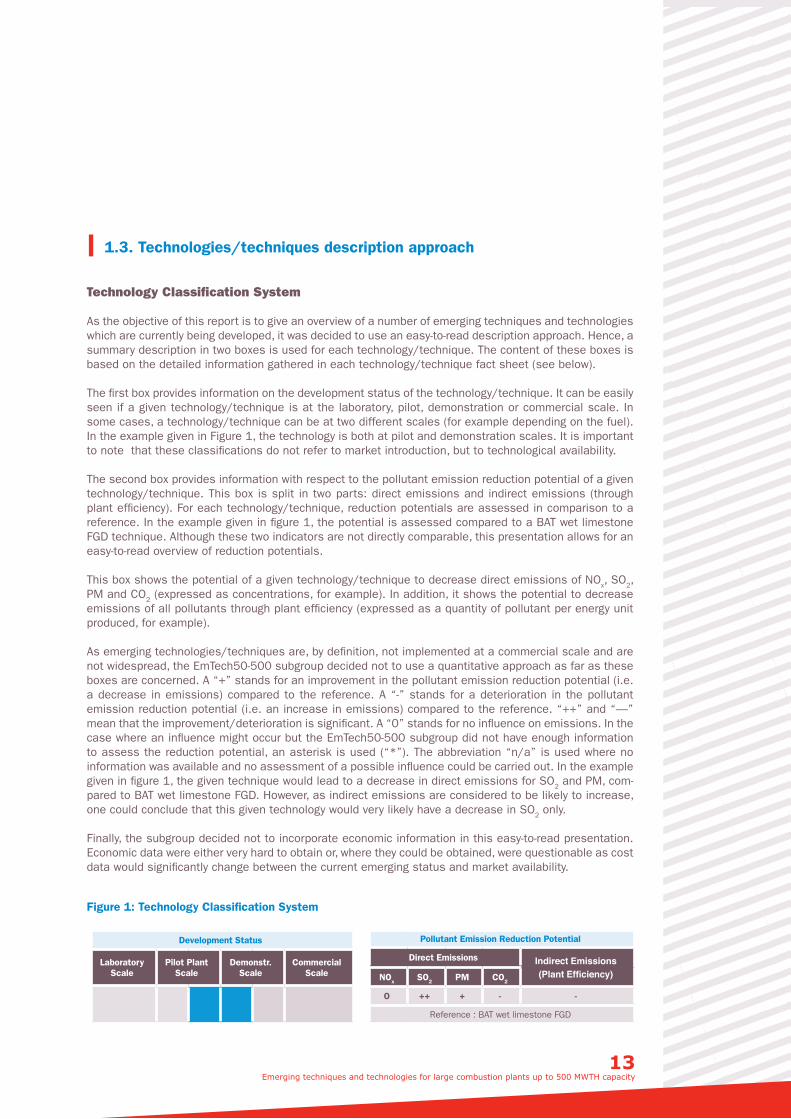
The first box provides information on the development status of the technology/technique. It can be easily seen if a given technology/technique is at the laboratory, pilot, demonstration or commercial scale. In some cases, a technology/technique can be at two different scales (for example depending on the fuel). In the example given in Figure 1, the technology is both at pilot and demonstration scales. It is important to note that these classifications do not refer to market introduction, but to technological availability.
The second box provides information with respect to the pollutant emission reduction potential of a given technology/technique. This box is split in two parts: direct emissions and indirect emissions (through plant efficiency). For each technology/technique, reduction potentials are assessed in comparison to a reference. In the example given in figure 1, the potential is assessed compared to a BAT wet limestone FGD technique. Although these two indicators are not directly comparable, this presentation allows for an easy-to-read overview of reduction potentials.
This box shows the potential of a given technology/technique to decrease direct emissions of NOx, SO2, PM and CO2 (expressed as concentrations, for example). In addition, it shows the potential to decrease emissions of all pollutants through plant efficiency (expressed as a quantity of pollutant per energy unit produced, for example).
As emerging technologies/techniques are, by definition, not implemented at a commercial scale and are not widespread, the EmTech50-500 subgroup decided not to use a quantitative approach as far as these boxes are concerned. A “+” stands for an improvement in the pollutant emission reduction potential (i.e. a decrease in emissions) compared to the reference. A “-” stands for a deterioration in the pollutant emission reduction potential (i.e. an increase in emissions) compared to the reference. “++” and “—” mean that the improvement/deterioration is significant. A “0” stands for no influence on emissions. In the case where an influence might occur but the EmTech50-500 subgroup did not have enough information to assess the reduction potential, an asterisk is used (“*”). The abbreviation “n/a” is used where no information was available and no assessment of a possible influence could be carried out. In the example given in figure 1, the given technique would lead to a decrease in direct emissions for SO2 and PM, com-pared to BAT wet limestone FGD. However, as indirect emissions are considered to be likely to increase, one could conclude that this given technology would very likely have a decrease in SO2 only.
Finally, the subgroup decided not to incorporate economic information in this easy-to-read presentation. Economic data were either very hard to obtain or, where they could be obtained, were questionable as cost data would significantly change between the current emerging status and market availability.
Figure 1: Technology Classification System
Development Status
Laboratory Scale
Pilot Plant Scale
Demonstr. Scale
Commercial Scale
Pollutant Emission Reduction Potential
Direct Emissions Indirect Emissions (Plant Efficiency)NOx SO2 PM CO2
O ++ + - -
Reference : BAT wet limestone FGD

Structure of Fact Sheets
EmTech50-500 decided to develop, for each thoroughly assessed technology/technique, a fact sheet based on the description approach used in the “techniques to consider in the determination of BAT” section of the Reference Document on Best Available Techniques (BRef), developed under the EU industrial emis-sions directive (IED). This means that each fact sheet is subdivided into:
• Description of the technique/technology
• Environmental benefits achieved, mainly for air pollutants and focusing on NOx, SO2, PM and CO2. Each section ends with a summary on the emission reduction potential for the priority pollutants considered in this work, which is the basis for the pollutant emission reduction potential classification.
• Applicability, dedicated to the 50-500 MWth range
• Operational data, where available
• Economics, where available
• Driving force for implementation, i.e. the reason why this technique/technology is in research and development
• Reference literature used for developing the fact sheets.
In addition to this BRef Structure, the EmTech50-500 subgroup decided to highlight the potential role a given technology/technique might play in the future and the status of research and implementation at the beginning of each fact sheet. The motivation for this decision was to clearly and explicitly give information on who does research and why, and what stage the participating institutions have currently reached. This information is the base from which development status boxes were elaborated.
15 Emerging techniques and technologies for large combustion plants up to 500 MWTH capacity
2. Scope of the report
i 2.1. Large combustion plants 50-500 MWth
As reported above, the mandate from the UN-ECE Geneva Convention Executive Body targeted LCPs with a capacity lower than 500 MWth. As the minimum size of combustion plants under the Gothenburg Protocol is 50 MWth, EmTech 50-500 chose this threshold as a lower boundary. However 50 and 500 MWth were not considered as strict borders in the framework of this work dedicated to emerging technologies within a 20-year timeframe.
Nevertheless, the assessment carried out by the subgroup took into consideration the following points. Technologies and plant concepts for installations of a few MWth to 20/30 MWth may strongly differ from installations in the range of 50-100 MWth, as the technical feasibility and the techno-economic balances significantly vary. As opposed to that, the main reason for technological changes between plants in the range of 400-500 MWth and of 1,000-1,500 MWth are usually of economic nature (economies of scale). Technologies, plant concepts and the emission situation are similar in many cases, so that the subgroup considered this upper boundary to be more flexible than the lower one.
i 2.2. Categories of assessed techniques and technologies
This report covers abatement techniques and plant technologies for plants combusting fossil fuels and biomass to produce heat and electricity. Nuclear plants as well as fuel cells, with the exception of hybrid plant concepts combining a gas turbine and fuel cells, are excluded.
The structure of this report is as follows. Combustion technologies for solid fossil fuels are described in chapter 3, technologies for biomass in chapter 4 and gaseous fuels in chapter 5. All techniques and technologies related to CO2 capture, i.e. pre- and post-combustion techniques as well as the oxyfuel technology are covered in chapter 6. The new generation of highly efficient large gas turbines as well as efficiency improvements obtained by changing the steam-cycle parameters are covered in a separate chapter on “Efficiency Increasing Technologies” (chapter 7). Mono-pollutant and multi-pollutant secondary abatement techniques for NOx, SO2 and PM are covered in chapters 8 and 9 respectively.
The subgroup chose not to assess several other techniques and technologies, because one or more of the following conditions prevailed:
(a) They were obviously still at laboratory scale and no emerging application could be foreseen before 2030 at large combustion plants.
(b) They clearly covered installations with thermal inputs far lower than 50 MWth and no application to the 50-500 MWth range could be foreseen before 2030.
(c) They did not cover the three priority pollutants (e.g. abatement techniques dedicated to Hg only).
(d) They were not explicitly designed for large combustion plants, but for other sectors, such as refineries or the steel industry.
(e) They pertained to techniques and technologies previously identified by related reports (e.g. the 2006 LCP BRef), but no information on additional development or research activities or on commercial implementation could be obtained by the subgroup.
These technologies/techniques are briefly reported in chapter 10.
i 2.3. Future work
This work is based on available data and information as well as on expert judgment. Therefore, although it aims at providing the most accurate and consensual results, it cannot be seen as completely exhaustive.
The EmTech50-500 subgroup recommends regular updates of both LCP2030 and EmTech50-500 assess-ments in order (1) to fill the current gaps in techno-economic data and (2) to re-assess the development status and the pollutant emission reduction potential of technologies/techniques within a few years.
3. Solid Fossil Fuel Combustion Technologies
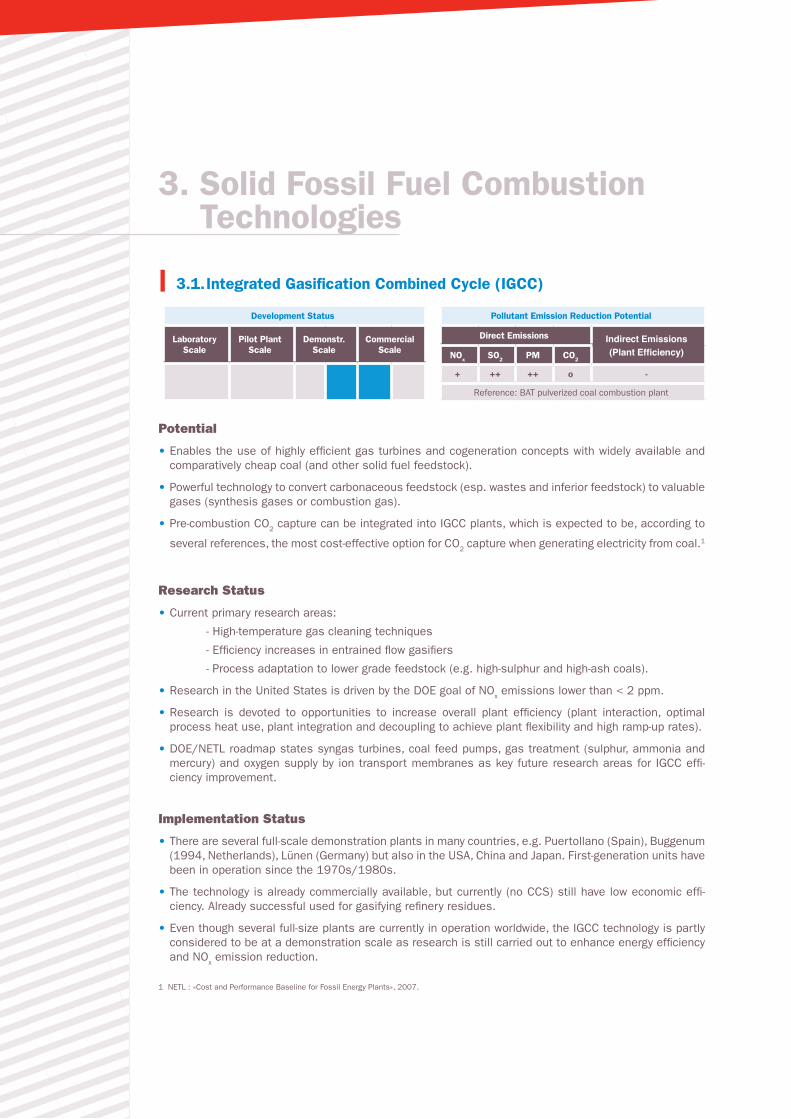
i 3.1. Integrated Gasification Combined Cycle (IGCC)
Development Status
Laboratory Scale
Pilot Plant Scale
Demonstr. Scale
Commercial Scale
Pollutant Emission Reduction Potential
Direct Emissions Indirect Emissions (Plant Efficiency)NOx SO2 PM CO2
+ ++ ++ o -
Reference: BAT pulverized coal combustion plant
Potential
• Enables the use of highly efficient gas turbines and cogeneration concepts with widely available and comparatively cheap coal (and other solid fuel feedstock).
• Powerful technology to convert carbonaceous feedstock (esp. wastes and inferior feedstock) to valuable gases (synthesis gases or combustion gas).
• Pre-combustion CO2 capture can be integrated into IGCC plants, which is expected to be, according to
several references, the most cost-effective option for CO2 capture when generating electricity from coal.1
Research Status
• Current primary research areas:
- High-temperature gas cleaning techniques
- Efficiency increases in entrained flow gasifiers
- Process adaptation to lower grade feedstock (e.g. high-sulphur and high-ash coals).
• Research in the United States is driven by the DOE goal of NOx emissions lower than < 2 ppm.
• Research is devoted to opportunities to increase overall plant efficiency (plant interaction, optimal process heat use, plant integration and decoupling to achieve plant flexibility and high ramp-up rates).
• DOE/NETL roadmap states syngas turbines, coal feed pumps, gas treatment (sulphur, ammonia and mercury) and oxygen supply by ion transport membranes as key future research areas for IGCC effi-ciency improvement.
Implementation Status
• There are several full-scale demonstration plants in many countries, e.g. Puertollano (Spain), Buggenum (1994, Netherlands), Lünen (Germany) but also in the USA, China and Japan. First-generation units have been in operation since the 1970s/1980s.
• The technology is already commercially available, but currently (no CCS) still have low economic effi-ciency. Already successful used for gasifying refinery residues.
• Even though several full-size plants are currently in operation worldwide, the IGCC technology is partly considered to be at a demonstration scale as research is still carried out to enhance energy efficiency and NOx emission reduction.
1 NETL : «Cost and Performance Baseline for Fossil Energy Plants», 2007.
17 Emerging techniques and technologies for large combustion plants up to 500 MWTH capacity
Description
• The coal-based IGCC power plants which have already been built in Europe were designed to target maximum overall net plant efficiency under the given fuel and site conditions and with the gas turbine technology available at the time of decision-making.
• Current gasification efficiency of approximately 80% is reached in most gasifier types. Various manufac-turers offer gasifiers for IGCC purposes, e.g.
- Chevron-Texaco (GE Energy),
- E-Gas (ConocoPhillips)
- Transport Reactor (KBR)
- SCGP (Shell)
- GSP/Noell (Siemens)
- PWR (Pratt and Whitney Rocketdyne)
- Prenflo (Uhde).
Oxygen-blown gasification, mostly in entrained-flow gasifiers, is selected for most existing plants. For gene-ral aspects of gasifier technologies, see the subchapter on biomass gasifiers.
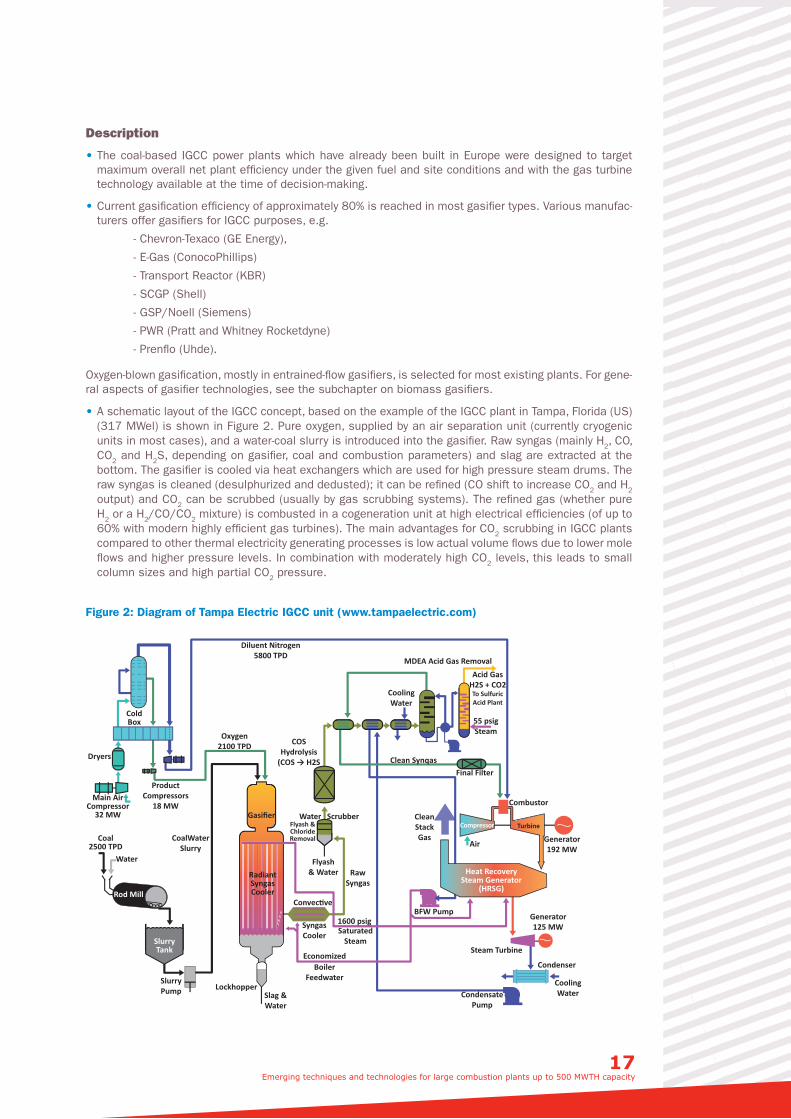
• A schematic layout of the IGCC concept, based on the example of the IGCC plant in Tampa, Florida (US)(317 MWel) is shown in Figure 2. Pure oxygen, supplied by an air separation unit (currently cryogenic units in most cases), and a water-coal slurry is introduced into the gasifier. Raw syngas (mainly H2, CO, CO2 and H2S, depending on gasifier, coal and combustion parameters) and slag are extracted at the bottom. The gasifier is cooled via heat exchangers which are used for high pressure steam drums. The raw syngas is cleaned (desulphurized and dedusted); it can be refined (CO shift to increase CO2 and H2 output) and CO2 can be scrubbed (usually by gas scrubbing systems). The refined gas (whether pure H2 or a H2/CO/CO2 mixture) is combusted in a cogeneration unit at high electrical efficiencies (of up to 60% with modern highly efficient gas turbines). The main advantages for CO2 scrubbing in IGCC plants compared to other thermal electricity generating processes is low actual volume flows due to lower mole flows and higher pressure levels. In combination with moderately high CO2 levels, this leads to small column sizes and high partial CO2 pressure.
Figure 2: Diagram of Tampa Electric IGCC unit (www.tampaelectric.com)
Schéma page 21
Diluent Nitrogen5800 TPD
MDEA Acid Gas Removal
CoolingWater
Acid GasH2S + CO2To SulfuricAcid Plant
Final FilterClean Synqas
Combustor
Air Generator192 MW
CleanStackGas
55 psigSteam
BFW Pump Generator125 MW
Steam Turbine
Condenser
CoolingWaterCondensate
Pump
COSHydrolysis
(COS → H2S
Water ScrubberFlyash &ChlorideRemoval
Flyash& Water Raw
Syngas
Convec�ve
SyngasCooler
1600 psigSaturated
Steam
EconomizedBoiler
Feedwater
Oxygen2100 TPD
Slag &Water
LockhopperSlurryPump
CoalWaterSlurry
ProductCompressors
18 MW
ColdBox
Dryers
Main AirCompressor
32 MW
Coal2500 TPD
Water
!
RadiantSyngasCooler
Gasifier
Rod Mill
SlurryTank
Compressor Turbine
Heat RecoverySteam Generator
(HRSG)
• Several companies and institutions carry out research under US DOE programs for an optimized low NOx combined cycle combustion without secondary NOx abatement (namely SCR), by controlling the CO-shift reaction. By controlling this reaction, gas quality can be normalized and gas diluted for flame tempera-ture control, and desired levels of energy density targeted– the main determinants for NOx formation in downstream combustion. The catalyst bed is fed with a fuel-rich fuel/gas mixture and cooled indirectly by the remaining combustion air, which mixes further downstream for turbine combustion.
• Desulphurisation is achieved by COS hydrogenation and H2S scrubbing (state-of-the-art process in coke oven gas treatment). Elemental sulphur (in Claus Units) or sulphuric acid can be produced with H2S.
• Generally, gas turbines for IGCC plants should be designed to fire high contents of hydrogen, depending on gasifier and CO2 capturing operations.
Environmental benefits achieved
• In general, emissions vary according to feedstock and plant units (gasification feedstock, gas cleaning techniques and gas turbine feedstock).
• Desulphurisation scrubbing can be highly efficient, leading to very low sulphur emissions (IGCC unit in Tianjin: abatement efficiency of > 99%). In general, emissions depend on feedstock and scrubbing efficiency.
• If CO2 scrubbing is installed, only H2 will be combusted, i.e. only water vapour is emitted by the cogene-ration process, if CO2 is captured for subsequent sequestration or other uses.
• Particle emissions are close to zero, as gas turbines require highly efficient particle abatement techniques
• Very low NOx emissions can be obtained (according to General Electric 2 ppm-vol. with hydrogen rich combustion gas) when in IGCC-CCS operation mode. IGCC plants using syngas fuel for the gas turbine can produce higher NOx emissions. US DOE/NETL calculate current emission levels at ELV level of 15 ppm-vol at 15% O2.
• Ability to use lower-grade feedstock while keeping the same low emission levels. In conventional units, low-grade fuels usually result in higher emissions.
• Summary Emission Reduction Potential: - PM: close to zero emissions - SO2: theoretically as low as zero emissions - NOx: emissions of 2-15 ppm-vol at 15% O2 possible (technically achievable for H2 turbines).
Applicability • As IGCC is a plant concept, this technology is better suited for new units.
• Currently, most manufacturers see the medium plant size (200-600 MWel) as a typical unit size.
• Powerful plant concept for operators who want to use various feedstocks, like - Petcoke - Coal/petcoke blends - Biomass co-feed - Liquid feedstocks.
Operational Data
• See Figure 3 for the mass streams and unit sizes of a 317 MWel IGCC plant.
• High process integration requires IGCC to work in steady-state operation, i.e. as baseload unit. DOE/NETL envisages future IGCC capacity factors of 90% (i.e. baseload operations).
• According to DOE/NETL, HHV efficiency (including gasification) in the USA is currently between 35 and 40% with a potential increase up to 46%.
19 Emerging techniques and technologies for large combustion plants up to 500 MWTH capacity
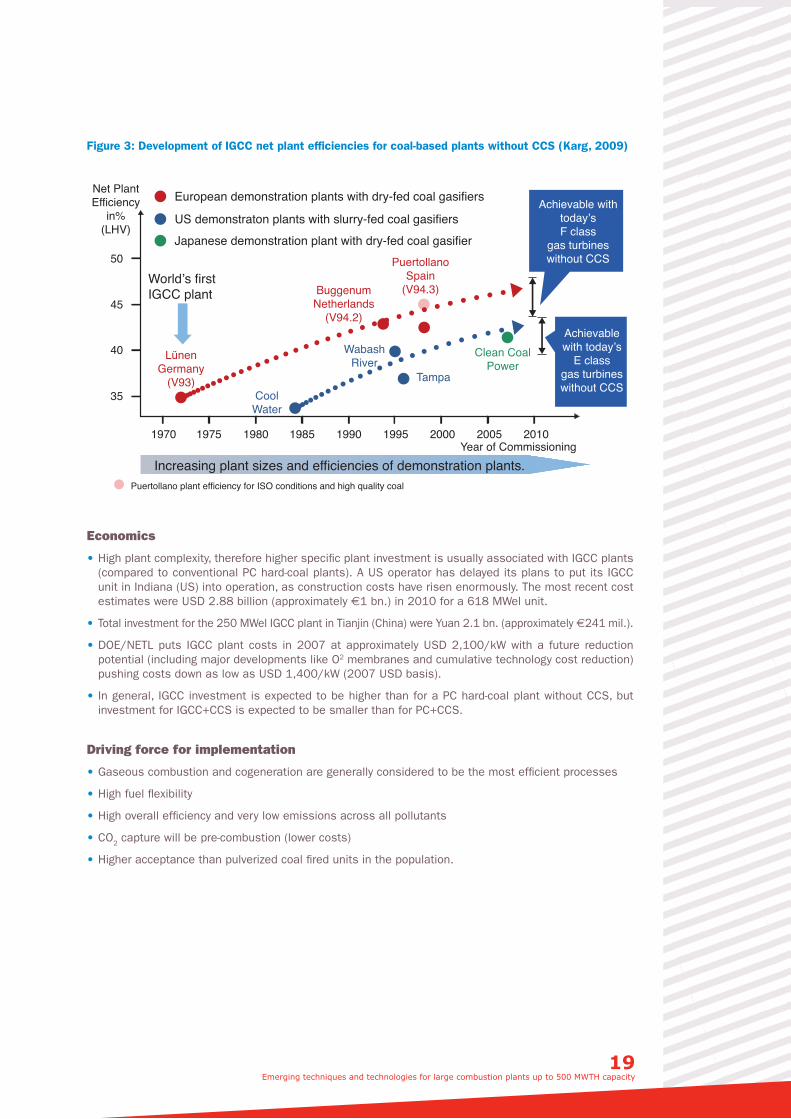
Figure 3: Development of IGCC net plant efficiencies for coal-based plants without CCS (Karg, 2009)
European demonstration plants with dry-fed coal gasifiers
US demonstraton plants with slurry-fed coal gasifiers Japanese demonstration plant with dry-fed coal gasifier
World’s firstIGCC plant
35
50
45
40
1970 1975 1980 1985 1990 1995 2000 2005 2010
Net PlantEfficiency
in%(LHV)
LünenGermany
(V93)
BuggenumNetherlands
(V94.2)
PuertollanoSpain
(V94.3)
CoolWater
WabashRiver
Tampa
Clean CoalPower
Achievable withtoday’sF class
gas turbineswithout CCS
Achievablewith today’s
E classgas turbineswithout CCS
Year of CommissioningIncreasing plant sizes and efficiencies of demonstration plants.
● Puertollano plant efficiency for ISO conditions and high quality coal !
Economics
• High plant complexity, therefore higher specific plant investment is usually associated with IGCC plants (compared to conventional PC hard-coal plants). A US operator has delayed its plans to put its IGCC unit in Indiana (US) into operation, as construction costs have risen enormously. The most recent cost estimates were USD 2.88 billion (approximately €1 bn.) in 2010 for a 618 MWel unit.
• Total investment for the 250 MWel IGCC plant in Tianjin (China) were Yuan 2.1 bn. (approximately €241 mil.).
• DOE/NETL puts IGCC plant costs in 2007 at approximately USD 2,100/kW with a future reduction potential (including major developments like O2 membranes and cumulative technology cost reduction) pushing costs down as low as USD 1,400/kW (2007 USD basis).
• In general, IGCC investment is expected to be higher than for a PC hard-coal plant without CCS, but investment for IGCC+CCS is expected to be smaller than for PC+CCS.
Driving force for implementation
• Gaseous combustion and cogeneration are generally considered to be the most efficient processes
• High fuel flexibility
• High overall efficiency and very low emissions across all pollutants
• CO2 capture will be pre-combustion (lower costs)
• Higher acceptance than pulverized coal fired units in the population.
Reference literature (selection)China Daily: “Clean coal power to go online in Tianjin”, published in China Daily, www.chinadaily.com.cn, 24.02.2010.
DOE/NETL: “Current and Future IGCC Technologies – Vol. 1”, DOE/NETL-Report-2008/1337, 2008.
DOE/NETL: “Cost and Performance Baseline for Fossil Energy plants”, 2007.
PowerMagazine: “Duke Energy, Indiana OUCC Cap Edwardsport IGCC Costs at 2.98 B”, published in Power Magazine, www.powermag.com, 22.09.2010.
Laster, R.: “Technical Progress Report: Catalytic Combustor for Fuel-Flexible Turbine”, Siemens Westin-ghouse Power Corp., available at www.netl.doe.gov, 2004.
Morehead, H.: “Siemens Gasification and IGCC Update”, presented at PowerGen International, USA, 2008.
Karg, J.: “IGCC experience and further developments to meet CCS market needs”, presented at Coal-Gen Europe, Poland, 2009.
Molière, M.: “Pre-combustion capture: A Powerful Concept Against long-range, Trans-boundary Pollution”, presented at EGTEI Emerging Techniques 50-500, Rome, 2011.
Smith, L.: “Topical Report of Ultra Low NOx Catalytic Combustion for IGCC Power Plants”, Precision Com-bustion Inc., available at www.netl.doe.gov, 2004.
Smith, L. et al. “Catalytic Combustion” in: “The Gas Turbine Handbook”, US DOE/NETL (eds.), available at: www.netl.doe.gov/technologies, 2006.Brochure “Gasification Technologies”, Uhde GmbH, available at www.uhde.eu.
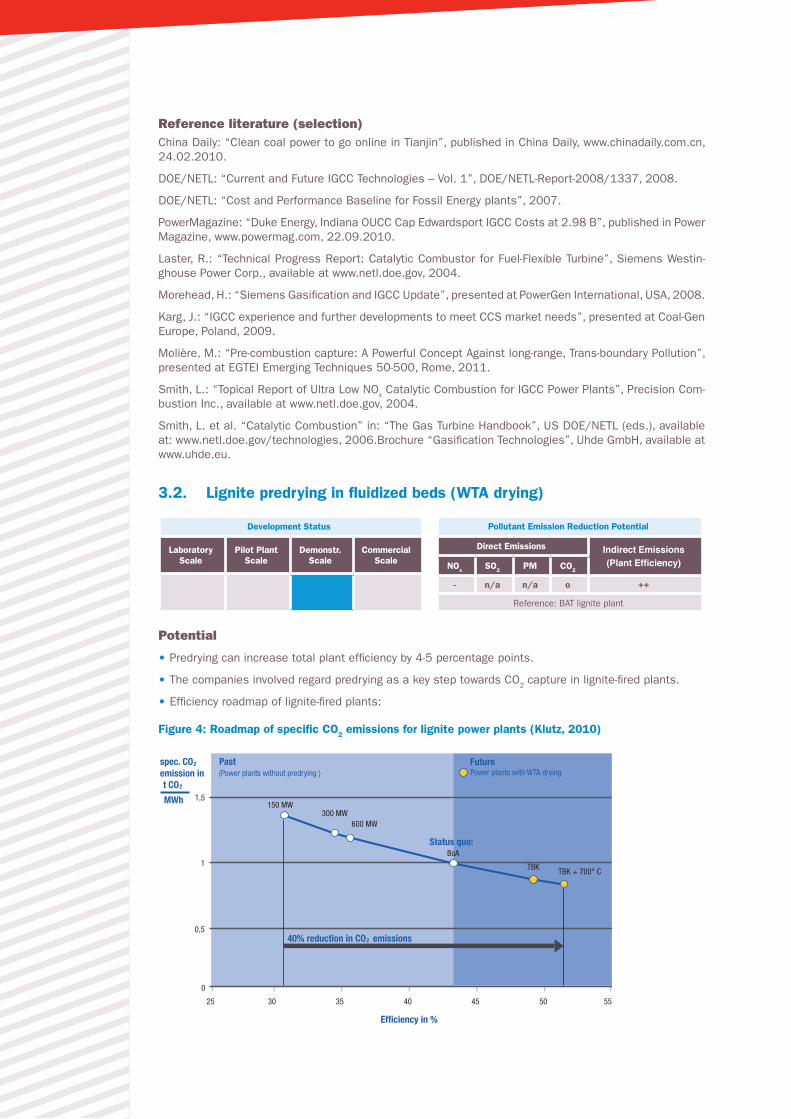
3.2. Lignite predrying in fluidized beds (WTA drying)
Development Status
Laboratory Scale
Pilot Plant Scale
Demonstr. Scale
Commercial Scale
Pollutant Emission Reduction Potential
Direct Emissions Indirect Emissions (Plant Efficiency)NOx SO2 PM CO2
- n/a n/a o ++
Reference: BAT lignite plant
Potential
• Predrying can increase total plant efficiency by 4-5 percentage points.
• The companies involved regard predrying as a key step towards CO2 capture in lignite-fired plants.
• Efficiency roadmap of lignite-fired plants:
Figure 4: Roadmap of specific CO2 emissions for lignite power plants (Klutz, 2010)
Pastspec. COemission in
Status quo:
Efficiency in %
t CO2
2
2
MWh
Future
40% reduction in CO emissions
(Power plants without predrying ) Power plants with WTA drying
25
1,5
1
150 MW300 MW
600 MW
BoA
TBK TBK + 700° C
0,5
0
30 35 40 45 50 55
21 Emerging techniques and technologies for large combustion plants up to 500 MWTH capacity
Research Status
• Prototype in operation since 2007, fed with lignite (approximately 525 MWth)2.
• Second generation of lignite predrying: predrying in pressurized fluidized beds (DDWT, see separate description).
• Research Institutions include RWE Power AG, University of Stuttgart, University of Cottbus.
Implementation Status
• Full-scale implementation into a plant concept planned for 2015.
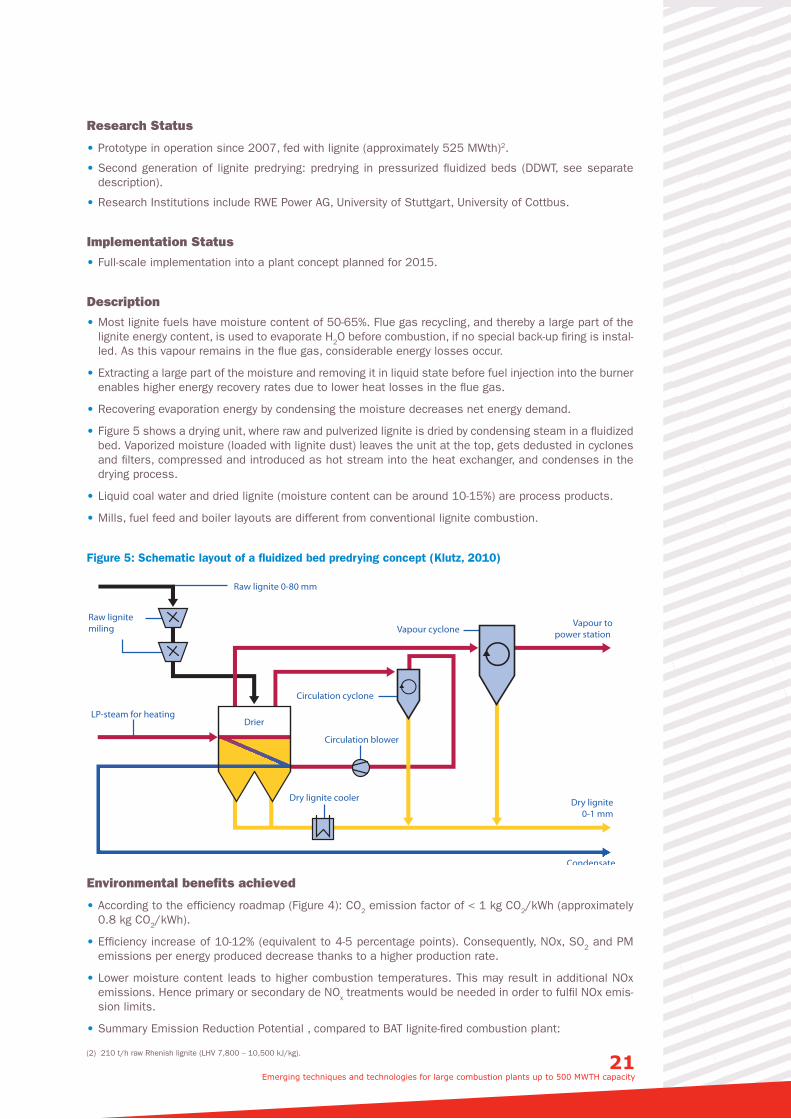
Description
• Most lignite fuels have moisture content of 50-65%. Flue gas recycling, and thereby a large part of the lignite energy content, is used to evaporate H2O before combustion, if no special back-up firing is instal-led. As this vapour remains in the flue gas, considerable energy losses occur.
• Extracting a large part of the moisture and removing it in liquid state before fuel injection into the burner enables higher energy recovery rates due to lower heat losses in the flue gas.
• Recovering evaporation energy by condensing the moisture decreases net energy demand.
• Figure 5 shows a drying unit, where raw and pulverized lignite is dried by condensing steam in a fluidized bed. Vaporized moisture (loaded with lignite dust) leaves the unit at the top, gets dedusted in cyclones and filters, compressed and introduced as hot stream into the heat exchanger, and condenses in the drying process.
• Liquid coal water and dried lignite (moisture content can be around 10-15%) are process products.
• Mills, fuel feed and boiler layouts are different from conventional lignite combustion.
Figure 5: Schematic layout of a fluidized bed predrying concept (Klutz, 2010)
Raw lignite 0-80 mm
Raw lignitemiling
LP-steam for heatingDrier
Vapour cycloneVapour to
power station
Circulation cyclone
Circulation blower
Dry lignite cooler Dry lignite0-1 mm
Condensate
Environmental benefits achieved
• According to the efficiency roadmap (Figure 4): CO2 emission factor of < 1 kg CO2/kWh (approximately 0.8 kg CO2/kWh).
• Efficiency increase of 10-12% (equivalent to 4-5 percentage points). Consequently, NOx, SO2 and PM emissions per energy produced decrease thanks to a higher production rate.
• Lower moisture content leads to higher combustion temperatures. This may result in additional NOx emissions. Hence primary or secondary de NOx treatments would be needed in order to fulfil NOx emis-sion limits.
• Summary Emission Reduction Potential , compared to BAT lignite-fired combustion plant:
(2) 210 t/h raw Rhenish lignite (LHV 7,800 – 10,500 kJ/kg).
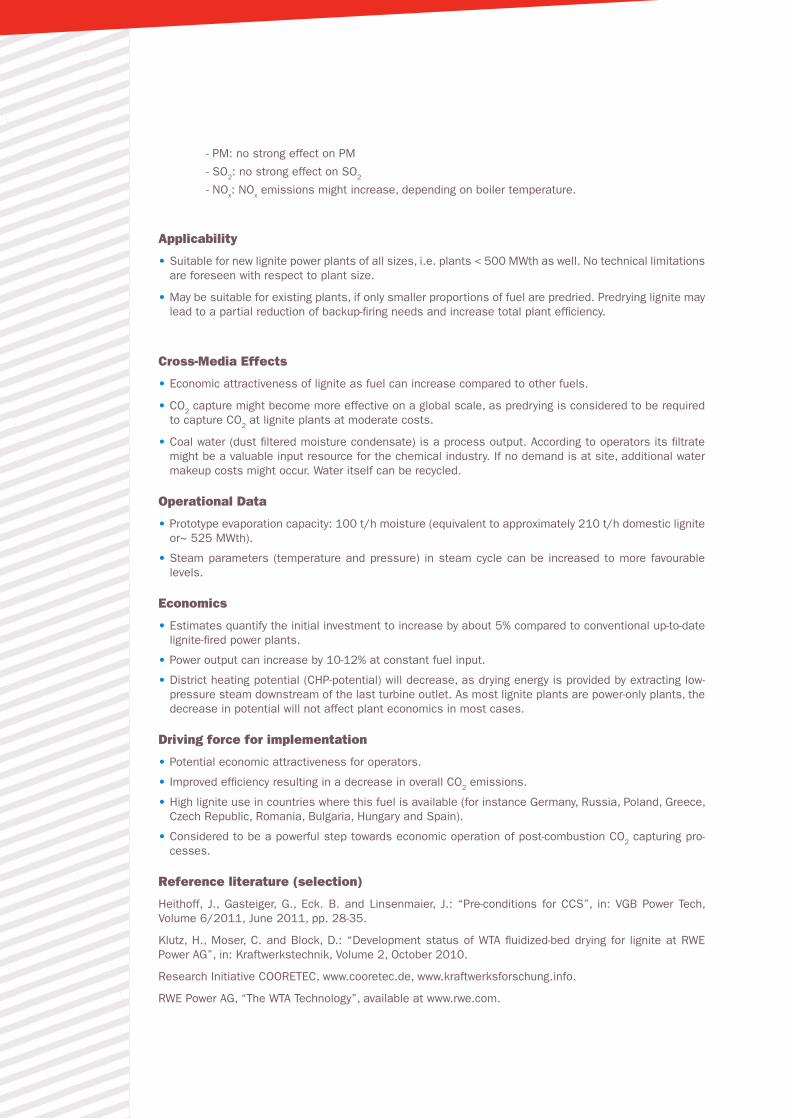
- PM: no strong effect on PM
- SO2: no strong effect on SO2
- NOx: NOx emissions might increase, depending on boiler temperature.
Applicability
• Suitable for new lignite power plants of all sizes, i.e. plants < 500 MWth as well. No technical limitations are foreseen with respect to plant size.
• May be suitable for existing plants, if only smaller proportions of fuel are predried. Predrying lignite may lead to a partial reduction of backup-firing needs and increase total plant efficiency.
Cross-Media Effects
• Economic attractiveness of lignite as fuel can increase compared to other fuels.
• CO2 capture might become more effective on a global scale, as predrying is considered to be required to capture CO2 at lignite plants at moderate costs.
• Coal water (dust filtered moisture condensate) is a process output. According to operators its filtrate might be a valuable input resource for the chemical industry. If no demand is at site, additional water makeup costs might occur. Water itself can be recycled.
Operational Data
• Prototype evaporation capacity: 100 t/h moisture (equivalent to approximately 210 t/h domestic lignite or~ 525 MWth).
• Steam parameters (temperature and pressure) in steam cycle can be increased to more favourable levels.
Economics
• Estimates quantify the initial investment to increase by about 5% compared to conventional up-to-date lignite-fired power plants.
• Power output can increase by 10-12% at constant fuel input.
• District heating potential (CHP-potential) will decrease, as drying energy is provided by extracting low-pressure steam downstream of the last turbine outlet. As most lignite plants are power-only plants, the decrease in potential will not affect plant economics in most cases.
Driving force for implementation
• Potential economic attractiveness for operators.
• Improved efficiency resulting in a decrease in overall CO2 emissions.
• High lignite use in countries where this fuel is available (for instance Germany, Russia, Poland, Greece, Czech Republic, Romania, Bulgaria, Hungary and Spain).
• Considered to be a powerful step towards economic operation of post-combustion CO2 capturing pro-cesses.
Reference literature (selection)
Heithoff, J., Gasteiger, G., Eck. B. and Linsenmaier, J.: “Pre-conditions for CCS”, in: VGB Power Tech, Volume 6/2011, June 2011, pp. 28-35.
Klutz, H., Moser, C. and Block, D.: “Development status of WTA fluidized-bed drying for lignite at RWE Power AG”, in: Kraftwerkstechnik, Volume 2, October 2010.
Research Initiative COORETEC, www.cooretec.de, www.kraftwerksforschung.info.
RWE Power AG, “The WTA Technology”, available at www.rwe.com.
23 Emerging techniques and technologies for large combustion plants up to 500 MWTH capacity
3.3. Pressurized steam fluidized bed drying (PFBD)
Development Status
Laboratory Scale
Pilot Plant Scale
Demonstr. Scale
Commercial Scale
Pollutant Emission Reduction Potential
Direct Emissions Indirect Emissions (Plant Efficiency)NOx SO2 PM CO2
o o o o +
Reference: Lignite Predrying in Fluidized Beds
Potential
• Second generation of lignite predrying technology with further decrease of net energy needs and energy losses.
Research Status
• Research since 1990s
• Prototype in operation since 2006 (0,5 t/h3 ; 1,2 – 6,5 bar)
• Pilot plant in Schwarze Pumpe (Germany) 2008-2010 (10 t/h4)
• Research Institutions include Vattenfall Europe Generation AG, Brandenburg University of Technology Cottbus (Germany).
Implementation Status
• A larger demonstration facility is planned to be integrated into the Schwarze Pumpe Oxyfuel Demons-tration plant (Jänschwalde, Germany) in 2013. Such implementation will depend on the legal status of CCS in Germany.
• This technology is planned to be commercially available from 2020 onwards.
Description
• In principle, the plant works in the same way as atmospheric lignite predrying (FBD technology).
• Most lignite fuels have moisture content of 50-65%. Flue gas recycling, and thereby a large part of the lignite energy content, is used to evaporate H2O before combustion, if no special back-up firing is instal-led. As this vapour remains in the flue gas, considerable energy losses occur.
• Extracting a large part of the moisture and removing it in liquid state before fuel injection into the burner enables higher energy recovery rates due to lower heat losses in the flue gas.
• Recovering evaporation energy by condensing the moisture decreases net energy demand.
• The special feature of PFBD consists of a steam injection at a pressure level of currently 6.5 bar (abso-lute). Due to the higher pressure level and the higher boiling point, recyclable energy can be provided at higher temperature levels and can hence be used more effectively in comparison to the atmospheric FBD technology. Furthermore, the degree of superheating decreases as the boiling point increases.
• The energy in coal water can be used more efficiently, as temperature is higher, for example pressu-rized moisture can be flashed in low-pressure turbines down to atmospheric levels. Cooling needs will be reduced simultaneously. In general, several possibilities exist to lower overall plant auxiliary power.
• The pressurized unit is more compact than the atmospheric unit, as volume flows are smaller.
• Liquid coal water and dried lignite (moisture content can be around 10-15%) are process products.
• Mills, fuel feed and boiler layouts are different from conventional lignite combustion.
(3) Equivalent to 1.2 MWth (Central German lignite, LHV 7,800-9,500 kJ/kg).(4) Equivalent to 24 MWth (Central German lignite, LHV 7,800-9,500 kJ/kg).
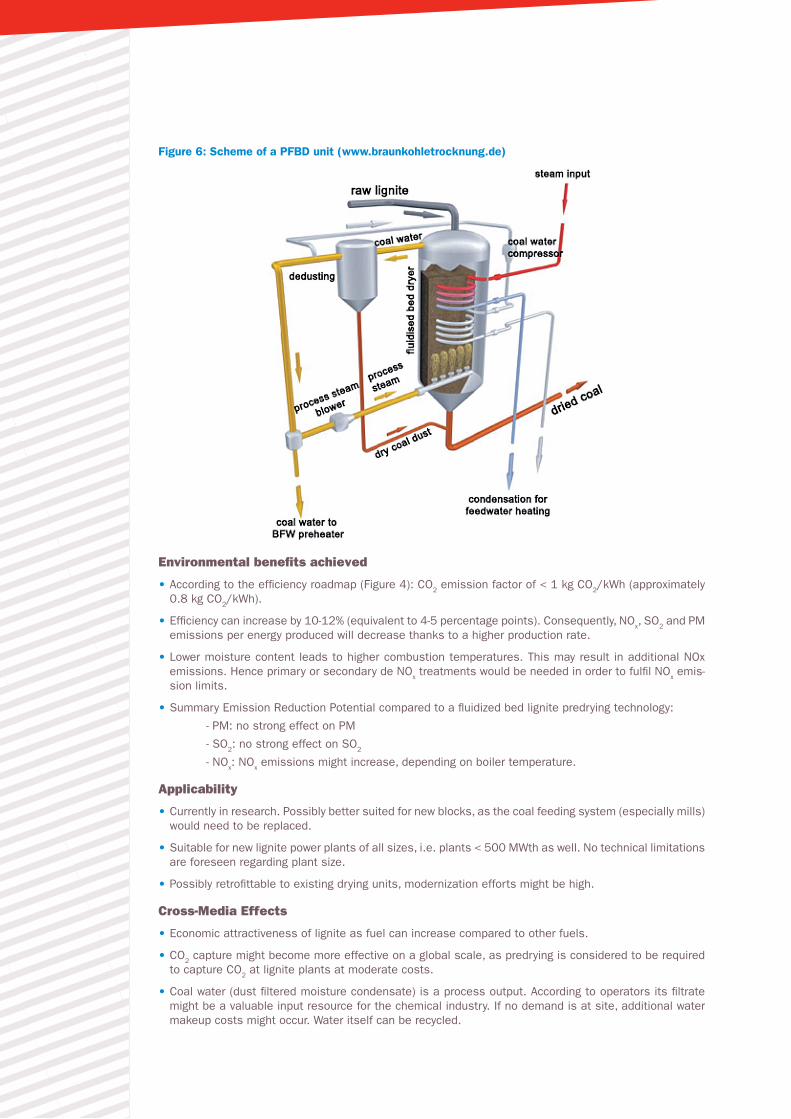
Figure 6: Scheme of a PFBD unit (www.braunkohletrocknung.de)
Environmental benefits achieved
• According to the efficiency roadmap (Figure 4): CO2 emission factor of < 1 kg CO2/kWh (approximately 0.8 kg CO2/kWh).
• Efficiency can increase by 10-12% (equivalent to 4-5 percentage points). Consequently, NOx, SO2 and PM emissions per energy produced will decrease thanks to a higher production rate.
• Lower moisture content leads to higher combustion temperatures. This may result in additional NOx emissions. Hence primary or secondary de NOx treatments would be needed in order to fulfil NOx emis-sion limits.
• Summary Emission Reduction Potential compared to a fluidized bed lignite predrying technology:
- PM: no strong effect on PM
- SO2: no strong effect on SO2
- NOx: NOx emissions might increase, depending on boiler temperature.
Applicability
• Currently in research. Possibly better suited for new blocks, as the coal feeding system (especially mills) would need to be replaced.
• Suitable for new lignite power plants of all sizes, i.e. plants < 500 MWth as well. No technical limitations are foreseen regarding plant size.
• Possibly retrofittable to existing drying units, modernization efforts might be high.
Cross-Media Effects
• Economic attractiveness of lignite as fuel can increase compared to other fuels.
• CO2 capture might become more effective on a global scale, as predrying is considered to be required to capture CO2 at lignite plants at moderate costs.
• Coal water (dust filtered moisture condensate) is a process output. According to operators its filtrate might be a valuable input resource for the chemical industry. If no demand is at site, additional water makeup costs might occur. Water itself can be recycled.
25 Emerging techniques and technologies for large combustion plants up to 500 MWTH capacity
Operational Data
• Smaller lignite grain sizes lead to lower velocity requirements of fluidization steam, therefore feed pump energy consumption depends on the lignite grain size.
• PFBD can increase the LHV of dried lignite from 8,500 (raw lignite) to 20,200 kJ/kg (dried lignite).
Economics
• Compared to the current state-of-the-art technology (net electrical efficiency of 43.6%), a boiler unit needs 3% more coal feedstock but produces approximately 8% more electricity, hence overall net elec-trical efficiency is expected to rise by roughly 5 percentage points.
• District heating potential (CHP potential) will decrease, as drying energy is provided by extracting low pressure steam downstream of the last turbine outlet (< 10 bar, depending on PFBD steam pressure level). As most lignite plants are power-only plants, the decrease in potential will not affect plant eco-nomics in most cases.
Driving force for implementation
• Potential economic attractiveness for operators
• Improved efficiency resulting in a decrease in overall CO2 emissions
• High lignite use in countries where lignite is available (for instance: Germany, Russia, Poland, Greece, Czech Republic, Romania, Bulgaria, Hungary and Spain)
• Considered to be a powerful step towards economic operation of post-combustion CO2 capturing pro-cesses.
Reference literature (selection)
For literature of first generation lignite predrying (FBD) see separate subchapter.
Altmann, H., Lindgren, G. and Burchhardt, U.: “Vattenfall’s CCS strategy”, in: VGB Power Tech, Volume 6/2011, June 2011, pp. 24-27.
Asegehegn, T., et al.: “The PSFBD process: a key technology for future lignite-fired power plants”, in: VGB Power Tech, Volume 6/2011, June 2011, pp. 84-91.
Heithoff, J., Gasteiger, G., Eck. B. and Linsenmaier, J.: “Pre-conditions for CCS”, in: VGB Power Tech, Volume 6/2011, June 2011, pp. 28-35.
Maier, J.: “Pre-Drying of Moist Fuels for Power Production”, Institute of Process Engineering and Power Plant Technology, final report of EU projects JOF3-CT97-0037 and ERBIC20-CT97-0046, 2000.
Lechner, S., Höhne, O., Krautz, H.J.: “Druckaufgeladene Dampfwirbelschicht-Trocknung (DDWT) von Braun-kohlen: Verfahrensoptimierung an der BTU-Versuchsanlage und Ergebnisse”, presented at: 41. Kraftwerks-technisches Kolloquium, Dresden, 2009.
Schierack, F., Krautz, H.J., Rombrecht, H.-B.: “Stand der Untersuchungen an der Versuchsanlage mit Zirku-lierender Druckwirbelschichtfeuerung der 2. Generation der BTU Cottbus”, presented at Drittes Druck-flamm-Seminar, Essen, 2002.
Research Initiative COORETEC, www.cooretec.de, www.kraftwerksforschung.info.
4. Technologies for the Use of Biomass
Worldwide, many countries are currently implementing policies aimed at reducing climate forcing effects by changing their electricity and heat generation infrastructure. Biomass, especially the combustion of biomass, usually plays a crucial role in this approach, as it can be stored and used in a way to allow for baseload operations and as it does not depend on intermittent external factors such as wind and sun.
Biomass feedstock generally consists of solid or solid-liquid products and can be or be turned into solid, liquid (bio-oil production) or gaseous fuels (fermentation, SNG production). Biomass feedstock cannot be sourced in the same way as coal, oil and natural gas, so that logistic aspects impede viable economic operation of very large combustion plants. Therefore biomass plants usually feature relatively small firing capacities, i.e. with thermal inputs lower than 500 MWth.
Some biofuels are even processed through very small combustion units. Especially plants for fermenta-tion and downstream combustion or Bio-SNG production from fermented feedstock are expected to stay in thermal input ranges far lower than 50 MWth, so that they are not covered by this report, even though they play an important role in several national energy concepts. The same argument applies to bio-oil or bio-slurry production and combustion in liquid state. In some countries, these concepts have been deve-loped and are currently used as replacement for heavy fuel oil and diesel firing plants, especially back-up plants, for example in Sweden; they are considered to be crucial when completely abandoning fossil fuels, even as back-up fuels5.
Solid biomass, mainly wood, straw, agricultural and animal wastes can be either combusted directly or gasified and afterwards combusted (whether in the form of synthesis gas or methane). Direct combustion in biomass-only plants, mainly in stokers and mainly in installations starting from several hundred kW to 200 MWth, has been in place for a long time in a number of countries within the UN-ECE and is not considered to be an emerging technology anymore, so that this report will not focus on direct combustion. Furthermore, biomass combustion technologies have already been assessed by an EGTEI subgroup dedi-cated to small combustion installations. The report of this subgroup was released in 20106. In contrast to plants relying only on biomass, co-firing biomass in large fossil-fuelled combustion plants started in the 1990s and its use has grown over the last ten years. Several countries and several plant operators have identified co-combustion as a measure to reduce fossil CO2 emissions using the existing infrastructure of coal combustion plants. Though already mentioned in the current LCP-BRef document, new insights into retrofit needs and operating experience, especially on effects on the flue gas cleaning equipment, have been acquired over the past years and are mentioned in this report’s fact sheets on biomass co-combustion.
Within the last years, more and more research teams have focused on gasifying biomass and using the gases produced in various ways. Biomass research centres all over the world, and especially in Austria, France, Germany, the Netherlands, Sweden, Switzerland and the United States are developing processes and operating demonstration plants, which produce hydrogen, synthetic gasoline and diesel (Fischer-Tropsch based BtL-fuels), methane or simply combustion gases. Under the lead of the Swedish Natur-vardsverket, a valuable study has been carried out in order to compare gasification devices and consider which concept would use biomass feedstock most efficiently7.
4.1. Types of biomass gasifiers – a short overview
Biomass gasification started by using gasifiers designed to process coal. In the research activities of the last 20-30 years on biomass gasification, many different types of gasifiers have been developed and optimized for the special needs of selected biomass types (straw, wood, biomass slurries, etc.) and gasi-fication products (BtL fuels, methane, combustion gas). The next paragraphs briefly summarize different types of gasifiers and gasification concepts. It is not the objective of this report to completely evaluate the market of biomass gasifiers, but rather to give a short overview on the variety of the market.
In general, gasification can be achieved in entrained flow, fluidized bed and allothermal/indirect gasifica-tion reactors. Depending on feedstock and targeted products, dry biomass or wet biomass slurries are fed into the reactor and gasified with oxygen (oxygen-blown systems), oxygen-enriched air or pure air (air-blown systems) and, if applicable, with steam. Different types of gasification systems, especially various
(5) See for example Sandgren, A. et al. :“Bio-oils and other bio fuels used in heat- and power generation”, 2010, SE EPA A08-830 Report No. 1132.(6) Nussbaumer, T.: Overview on Technologies for Biomass Combustion and Emission Levels of Particulate Matter, 2010, available at the EGTEI website.(7) Rodin, J. and Wennberg, O.: “Gasification for fuel production in large and small scale polygeneration plants”, 2010, SE EPA SYS08-824 Report No. 1150.
27 Emerging techniques and technologies for large combustion plants up to 500 MWTH capacity
types of circulating fluidized bed systems have been developed in the last decades for the special needs of different biomass feedstock and scope of operation. Wet slurries tend to be used in entrained flow gasification systems, whereas CFB units are mostly fed with dry biomass.
Gasification systems can be operated at atmospheric pressure or at a lower (~20 bar) or higher (~40-50 bar) levels of elevated pressure. Pressurized systems usually use pure oxygen to reduce compression needs and are chosen if at downstream units high pressure levels are needed, e. g. IGCC, H2 or BtL-pro-duction.
As most of these processes are outside of the scope of this report, or are mainly for electricity generation in installations far below 50 MWth, only bio-methane combustion is covered herein (see 4.4).
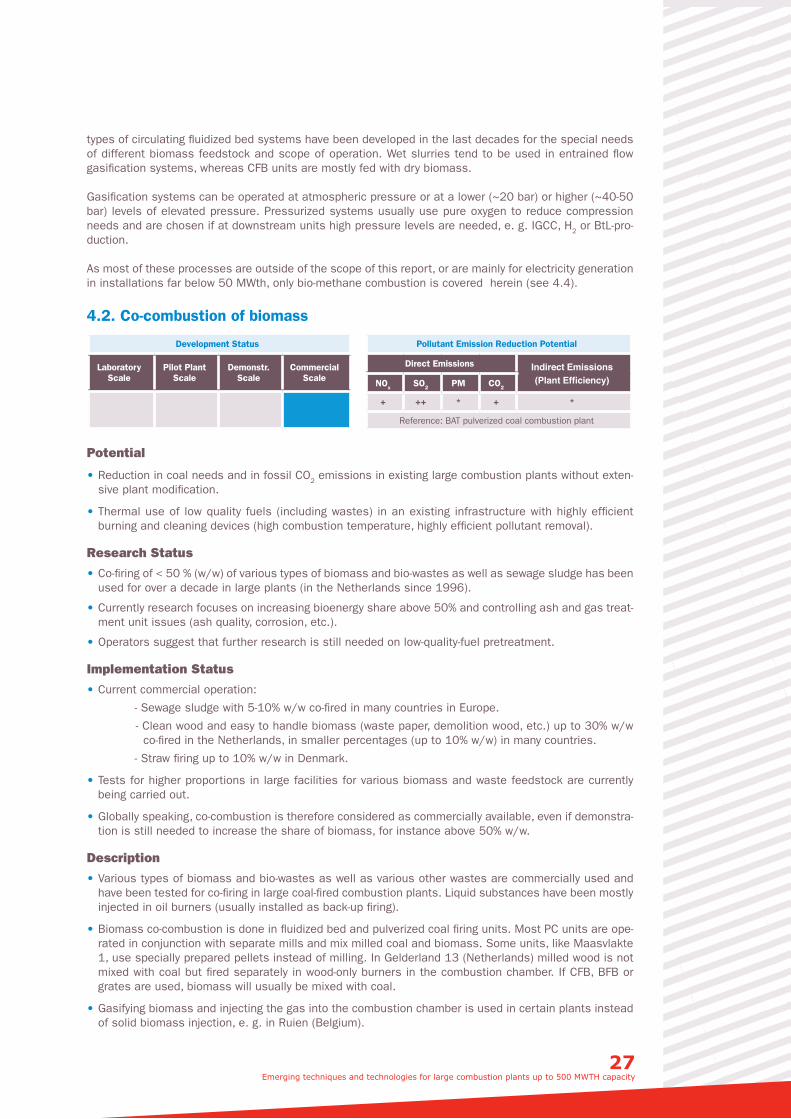
4.2. Co-combustion of biomass
Development Status
Laboratory Scale
Pilot Plant Scale
Demonstr. Scale
Commercial Scale
Pollutant Emission Reduction Potential
Direct Emissions Indirect Emissions (Plant Efficiency)NOx SO2 PM CO2
+ ++ * + *
Reference: BAT pulverized coal combustion plant
Potential
• Reduction in coal needs and in fossil CO2 emissions in existing large combustion plants without exten-sive plant modification.
• Thermal use of low quality fuels (including wastes) in an existing infrastructure with highly efficient burning and cleaning devices (high combustion temperature, highly efficient pollutant removal).
Research Status
• Co-firing of < 50 % (w/w) of various types of biomass and bio-wastes as well as sewage sludge has been used for over a decade in large plants (in the Netherlands since 1996).
• Currently research focuses on increasing bioenergy share above 50% and controlling ash and gas treat-ment unit issues (ash quality, corrosion, etc.).
• Operators suggest that further research is still needed on low-quality-fuel pretreatment.
Implementation Status
• Current commercial operation:
- Sewage sludge with 5-10% w/w co-fired in many countries in Europe.
- Clean wood and easy to handle biomass (waste paper, demolition wood, etc.) up to 30% w/w co-fired in the Netherlands, in smaller percentages (up to 10% w/w) in many countries.
- Straw firing up to 10% w/w in Denmark.
• Tests for higher proportions in large facilities for various biomass and waste feedstock are currently being carried out.
• Globally speaking, co-combustion is therefore considered as commercially available, even if demonstra-tion is still needed to increase the share of biomass, for instance above 50% w/w.
Description
• Various types of biomass and bio-wastes as well as various other wastes are commercially used and have been tested for co-firing in large coal-fired combustion plants. Liquid substances have been mostly injected in oil burners (usually installed as back-up firing).
• Biomass co-combustion is done in fluidized bed and pulverized coal firing units. Most PC units are ope-rated in conjunction with separate mills and mix milled coal and biomass. Some units, like Maasvlakte 1, use specially prepared pellets instead of milling. In Gelderland 13 (Netherlands) milled wood is not mixed with coal but fired separately in wood-only burners in the combustion chamber. If CFB, BFB or grates are used, biomass will usually be mixed with coal.
• Gasifying biomass and injecting the gas into the combustion chamber is used in certain plants instead of solid biomass injection, e. g. in Ruien (Belgium).
Environmental benefits achieved
• If wood is used, SO2 and PM baseline emissions are likely to decrease, as emission factors are lower than coal emission factors. As biomass co-firing influences ash characteristics, ESP efficiency can be affected.
• If biomass with high nitrogen content is fired, fuel-NOx rates will increase. Danish and Dutch experience showed a negative influence on SCR catalyst deactivation rates and therefore higher catalyst main-tenance costs (if NOx emissions are kept at the same level). However, thermal NOx rates are likely to decrease. According to the Danish experience, total NOx levels do not decrease significantly and vary depending on the fuel and plant operation and catalyst management.
• Fossil CO2 emissions will CO2 decrease.
• Summary Emission Reduction Potential, compared to a BAT PC combustion plant:
- PM: Overall baseline emissions will decrease, but effect on after-ESP/FF emission remains unclear. - SO2: Overall emissions will decrease, as the fuel sulphur content of biomass is very low. - NOx: Reduction in boiler outlet NOx emissions due to combustion temperature decrease.
Applicability
• In general, biomass co-firing may be applied at any plant size, for example to plants between 50 and 500 MWth.
• Up to now, co-firing has been mainly retrofitted to existing plants. Mill and pretreatment modifications are the main modifications to existing plants. Existing plant layout and process characteristics may limit the maximum co-firing level.
• If a new plant is designed taking into account biomass co-firing, overall process layout can be designed to fire higher proportions of biomass or improve biomass firing efficiency. Some large combustion plants currently in construction are already designed for efficient co-firing of biomass.
Cross-Media Effects
• Avedore 2 (Denmark) operators decided to inject coal fly ash into its wood-only unit to keep ash quality at a saleable level and SCR deactivation is low up to now. In 2011 the plant was modified to partially fire coal to substitute for ash injection. Operators consider the maximum wood proportion to be at 40-50%, if ash quality is kept within limits of current standards.
Operational Data
• Clean and waste wood co-firing of up to 25% w/w has not lowered ash quality beyond necessary stan-dards of the cement industry.
• Avedore 2 (Denmark) reported at its wood and coal co-firing plant a SCR catalyst deactivation rate of 25-30%/10,000 h of operation. Deactivation occurs mainly because of potassium-containing ashes and increased formation of ash layers on the catalyst surface.
• With respect to ash quality, reactive CaO, alkali and unburnt matter are biomass limiting factors.
• Studstup 4 (350 MWel coal plant in Denmark) has co-fired 10% w/w straw since 2002 and has reported almost constant LOI, reasonable ash quality and improved carbon burn-out. Straw operation is limited due to the wet character of the fuel (flame and combustion issues). Corrosion effects have been obser-ved at longer operations and at 20% straw co-firing. The main factor to take into account for corrosion issues is the S/Cl ratio.
• Operators still see co-firing limitations and research needs targeted to the following aspects: - drying capacity of the mill, if coal mills are used for milling biomass as well - flame stability - ash composition and saleability (bottom and fly ash) - alkali content (corrosion, fouling and slagging) - ESP performance - gypsum quality.
Economics
• Fuel preparation may require new process units or prepared fuels may need to be purchased. The main economic drivers for use are currently subsidy (e.g. in the Netherlands) and taxes (e.g. in Denmark) in the case of “clean” biomass (clean wood, straw, etc.) and cheap fuel prices in the case of waste and bio-waste (low quality bio-fuels).
• SCR catalyst management costs will increase with larger proportions of biomass co-firing, if emissions are to be kept unchanged.
29 Emerging techniques and technologies for large combustion plants up to 500 MWTH capacity
Driving force for implementation
• Using bio-wastes and renewable energy in large fossil-fuelled combustion facilities and thereby reducing their fossil CO2 emissions.
• Economic drivers: either due to subsidies or to taxes related to fossil fuels.
• Some countries are in the process of consulting stakeholders in order to assess the need to develop new legislation requiring biomass co-combustion (e.g. France).
Reference literature (selection)
Best Available Techniques Reference Document on Large Combustion Plants (LCP-BRef), Version July 2006, chapter 5.1.3.7. on “Co-firing of biomass and fossil fuels”.
Goldschmidt, B., Olson, H. and Lindström, E.: “„SCR in biomass and waste fuelled plants – Benchmarking of Swedish and European plants”, 2010, SE EPA A08-821 Report No. 1156.
Jouret, N., Helsen, L. and van den Bulck, E.: “Study of the wood gasifier at the power plant of Electrabel-Ruien”, presented at: European Combustion Meeting, 2005.
Kiel, J.: “Biomass co-firing in coal-fired power plants: status, trends and R&D needs”, at Bioenergy NoE Final Seminar, Brussels, 2009.
Lindberg, M.: “Challenges with emission control at Avedore unit 2 by firing wood pellets”, presented at Co-firing biomass with coal workshop, Drax, 2011.
Van Eijk, R. and te Winkel, H.: “Effects of co-firing on emissions and by-product quality”, presentation provided by KEMA, 2011.
European Biomass Industry Association: “Experiences in Europe and List of Biomass Co-firing plants”, available at www.eubia.org, 2011.
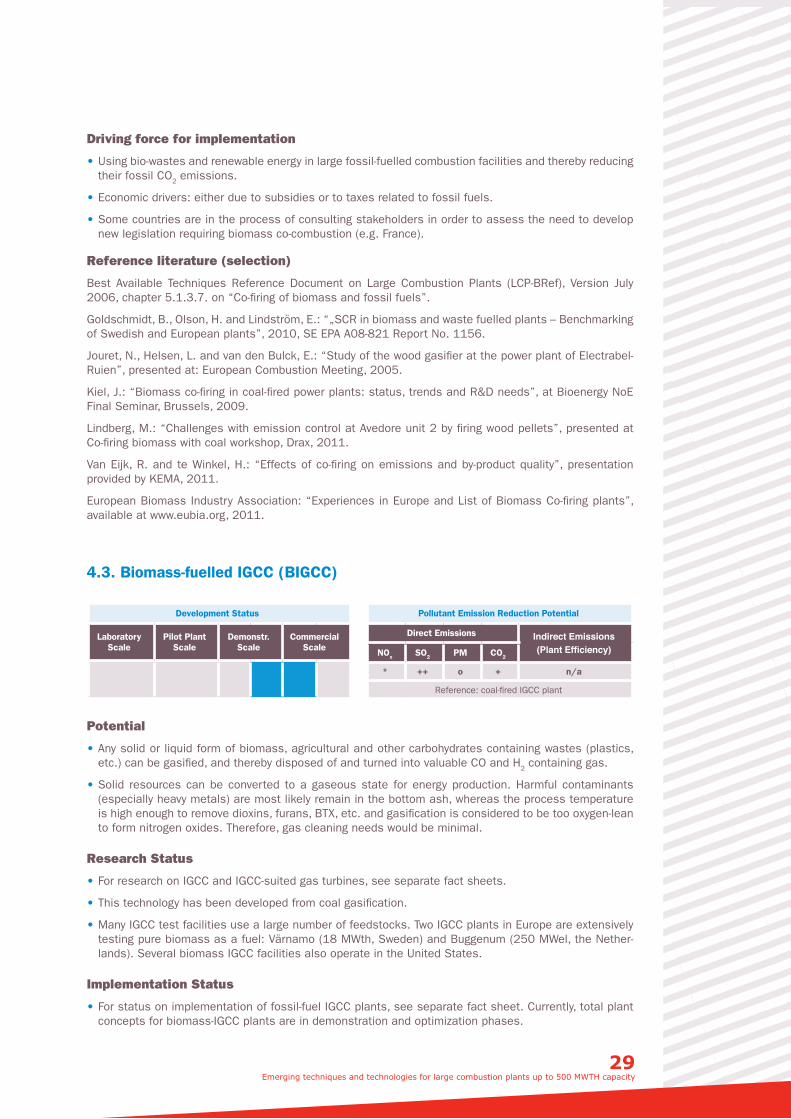
4.3. Biomass-fuelled IGCC (BIGCC)
Development Status
Laboratory Scale
Pilot Plant Scale
Demonstr. Scale
Commercial Scale
Pollutant Emission Reduction Potential
Direct Emissions Indirect Emissions (Plant Efficiency)NOx SO2 PM CO2
* ++ o + n/a
Reference: coal-fired IGCC plant
Potential
• Any solid or liquid form of biomass, agricultural and other carbohydrates containing wastes (plastics, etc.) can be gasified, and thereby disposed of and turned into valuable CO and H2 containing gas.
• Solid resources can be converted to a gaseous state for energy production. Harmful contaminants (especially heavy metals) are most likely remain in the bottom ash, whereas the process temperature is high enough to remove dioxins, furans, BTX, etc. and gasification is considered to be too oxygen-lean to form nitrogen oxides. Therefore, gas cleaning needs would be minimal.
Research Status
• For research on IGCC and IGCC-suited gas turbines, see separate fact sheets.
• This technology has been developed from coal gasification.
• Many IGCC test facilities use a large number of feedstocks. Two IGCC plants in Europe are extensively testing pure biomass as a fuel: Värnamo (18 MWth, Sweden) and Buggenum (250 MWel, the Nether-lands). Several biomass IGCC facilities also operate in the United States.
Implementation Status
• For status on implementation of fossil-fuel IGCC plants, see separate fact sheet. Currently, total plant concepts for biomass-IGCC plants are in demonstration and optimization phases.
Description
• In principle, biomass-fuelled IGCC is very similar to coal-fuelled IGCC. Two specific important aspects when using biomass are the following: a suitable gasifier and feedstock preparation/feeding. Specially designed gasifiers for certain biomass fuel types may exist or be developed with high efficiency for a certain application and might not be optimal for general use of varying feedstock.
• Pressure levels of gasifiers may vary between high pressure (20-30 bar) and atmospheric pressure.
• Entrained flow gasifiers and CFB including cyclone are used in biomass IGCC plants across Europe and the United States.
• In the case of CFB fuel needs to be dried, whereas most entrained flow gasifiers are fed by a fuel/water slurry.
• Biofuels which have been successfully tested include:
- Wood chips - Forest residue (bark, branches,…) - Saw dust and bark pellets - Willow (salix) - Straw - Refused Derived Fuel.
Environmental benefits achieved
• Tests have shown that emissions of hydrocarbons are very low and that emissions of dioxins are below detection levels even in the case of chlorine-rich fuels.
• As low temperatures are involved, CFB firing generates low thermal-NOx emissions. However, fuel-bound nitrogen is higher and fuel-NOx formation in the raw gas is higher in the case of biomass IGGC than in the case of fossil-fuel IGCC. Therefore NOx treatment after cogeneration units might be needed. In Värnamo tests have revealed NOx levels varying between 50 and 150 ppm-vol depending on wood types and up to 250 ppm-vol for straw. Plant operators suggest further research is needed to identify suitable deNOx technologies.
• PM emissions will be close to zero, as gas turbines require low PM inputs and therefore hot filters and water cleaning is usually implemented. Hydrocarbons are removed along with dust and tar cleanup.
• Most biomass does not have a high sulphur content. Chlorine and fluorine cleanup technologies will also remove sulphur compounds in the raw gases. Thus SO2 emissions are very likely to be negligible.
• Summary Emission Reduction Potential, compared to a coal-fired IGCC plant:
- PM: close to zero emissions, as for coal-fired IGCC plants
- SO2: theoretically, emissions would be lower than in the case of coal-fired IGCC plants
- NOx: it is uncertain whether emissions would be lower or higher than in the case of coal-fired IGCC. NOx emissions would depend on biomass characteristics and potential additional de NOx devices.
Applicability
• Biomass gasifiers should be retrofittable to most fossil IGCC plants.
• Plant size is most likely determined by biomass availability and should be, for techno-economic aspects regarding economies of scale and the electricity market, equivalent to IGCC size (most likely in between 200-600 MWel), if not limited by biomass availability.
Cross-Media Effects
• Solid residues (ash-like wastes) are generated as a gasification byproduct. Characteristics of those residues will depend on the biomass input.
• Water recycling/water treatment are likely to be needed, depending on plant configuration and local conditions.
Operational Data
• Värnamo (18 MWth input) reaches a total (CHP) efficiency of 83% (LHV) and a net electrical efficiency of 32% for wood chips.
• Product gases can be used as input in the chemical industry (BtL processes) as well.
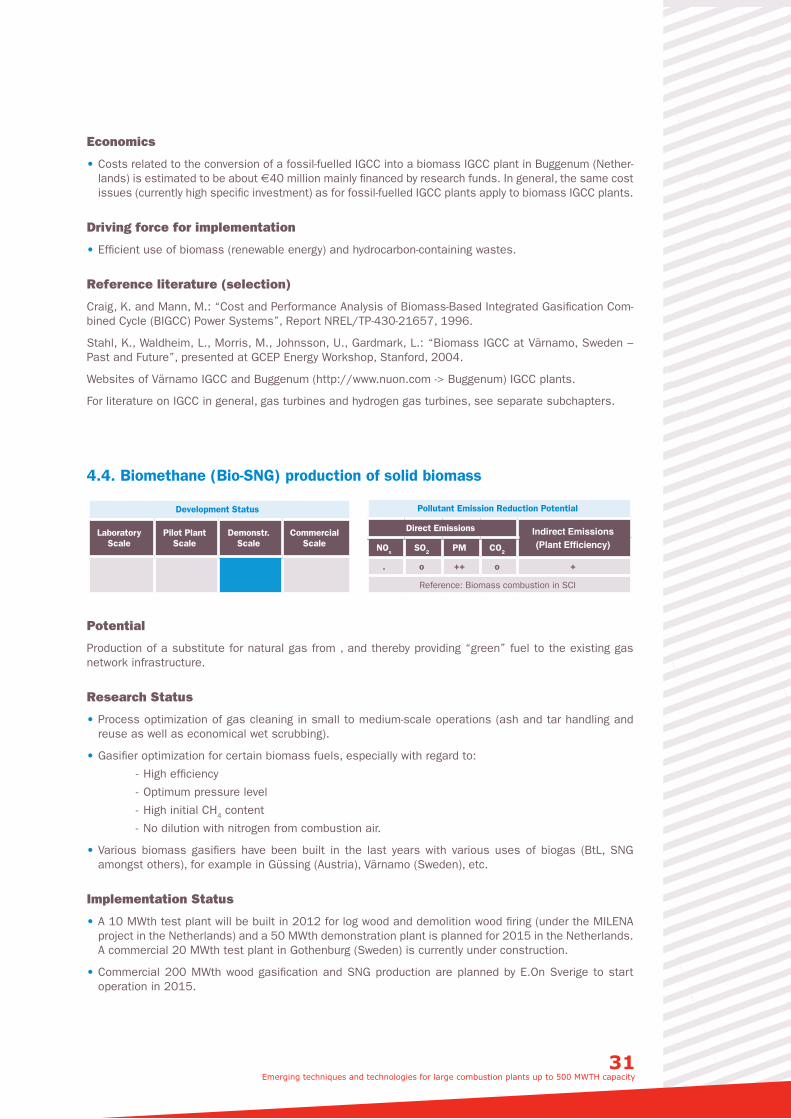
31 Emerging techniques and technologies for large combustion plants up to 500 MWTH capacity
Economics
• Costs related to the conversion of a fossil-fuelled IGCC into a biomass IGCC plant in Buggenum (Nether-lands) is estimated to be about €40 million mainly financed by research funds. In general, the same cost issues (currently high specific investment) as for fossil-fuelled IGCC plants apply to biomass IGCC plants.
Driving force for implementation
• Efficient use of biomass (renewable energy) and hydrocarbon-containing wastes.
Reference literature (selection)
Craig, K. and Mann, M.: “Cost and Performance Analysis of Biomass-Based Integrated Gasification Com-bined Cycle (BIGCC) Power Systems”, Report NREL/TP-430-21657, 1996.
Stahl, K., Waldheim, L., Morris, M., Johnsson, U., Gardmark, L.: “Biomass IGCC at Värnamo, Sweden – Past and Future”, presented at GCEP Energy Workshop, Stanford, 2004.
Websites of Värnamo IGCC and Buggenum (http://www.nuon.com -> Buggenum) IGCC plants.
For literature on IGCC in general, gas turbines and hydrogen gas turbines, see separate subchapters.
4.4. Biomethane (Bio-SNG) production of solid biomass
Development Status
Laboratory Scale
Pilot Plant Scale
Demonstr. Scale
Commercial Scale
Pollutant Emission Reduction Potential
Direct Emissions Indirect Emissions (Plant Efficiency)NOx SO2 PM CO2
. o ++ o +
Reference: Biomass combustion in SCI
Potential
Production of a substitute for natural gas from , and thereby providing “green” fuel to the existing gas network infrastructure.
Research Status
• Process optimization of gas cleaning in small to medium-scale operations (ash and tar handling and reuse as well as economical wet scrubbing).
• Gasifier optimization for certain biomass fuels, especially with regard to:
- High efficiency
- Optimum pressure level
- High initial CH4 content
- No dilution with nitrogen from combustion air.
• Various biomass gasifiers have been built in the last years with various uses of biogas (BtL, SNG amongst others), for example in Güssing (Austria), Värnamo (Sweden), etc.
Implementation Status
• A 10 MWth test plant will be built in 2012 for log wood and demolition wood firing (under the MILENA project in the Netherlands) and a 50 MWth demonstration plant is planned for 2015 in the Netherlands. A commercial 20 MWth test plant in Gothenburg (Sweden) is currently under construction.
• Commercial 200 MWth wood gasification and SNG production are planned by E.On Sverige to start operation in 2015.
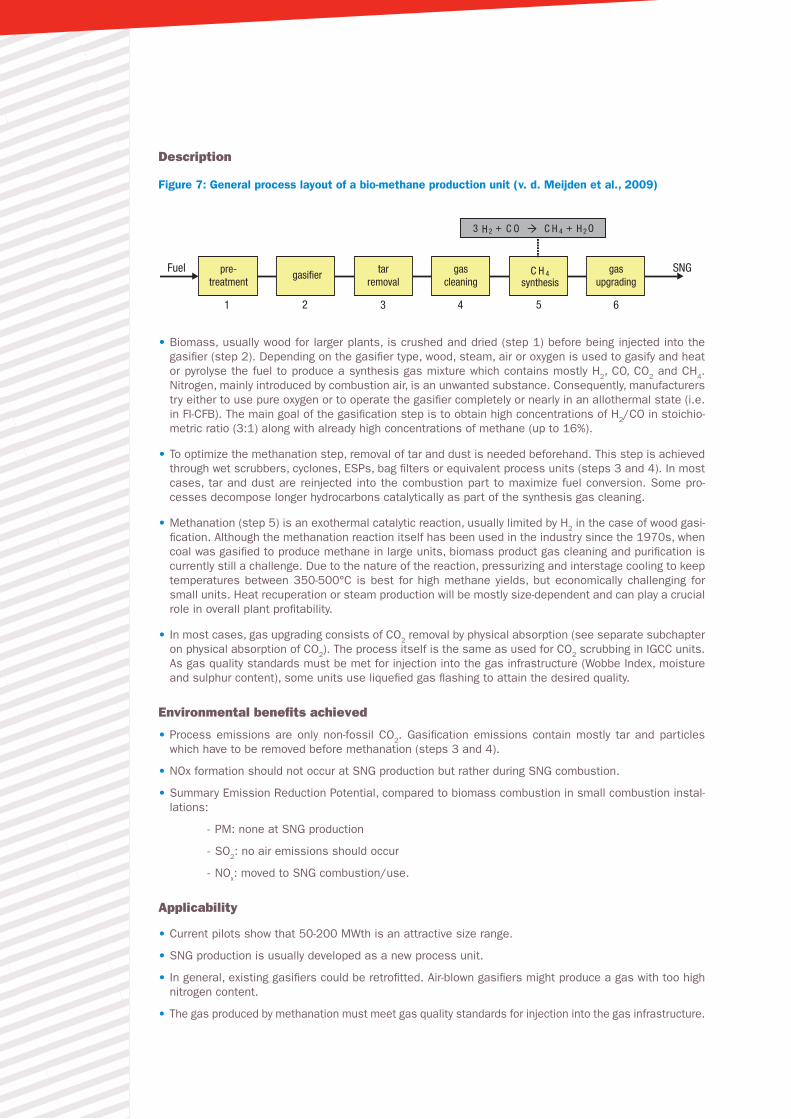
Description
Figure 7: General process layout of a bio-methane production unit (v. d. Meijden et al., 2009)
1 2 3 4 5 6
Fuel SNG
3 H H OC O C H2 4
C H 4
2+ +
synthesisgas
upgradingpre-
treatmentgasifier tar
removalgas
cleaning
• Biomass, usually wood for larger plants, is crushed and dried (step 1) before being injected into the gasifier (step 2). Depending on the gasifier type, wood, steam, air or oxygen is used to gasify and heat or pyrolyse the fuel to produce a synthesis gas mixture which contains mostly H2, CO, CO2 and CH4. Nitrogen, mainly introduced by combustion air, is an unwanted substance. Consequently, manufacturers try either to use pure oxygen or to operate the gasifier completely or nearly in an allothermal state (i.e. in FI-CFB). The main goal of the gasification step is to obtain high concentrations of H2/CO in stoichio-metric ratio (3:1) along with already high concentrations of methane (up to 16%).
• To optimize the methanation step, removal of tar and dust is needed beforehand. This step is achieved through wet scrubbers, cyclones, ESPs, bag filters or equivalent process units (steps 3 and 4). In most cases, tar and dust are reinjected into the combustion part to maximize fuel conversion. Some pro-cesses decompose longer hydrocarbons catalytically as part of the synthesis gas cleaning.
• Methanation (step 5) is an exothermal catalytic reaction, usually limited by H2 in the case of wood gasi-fication. Although the methanation reaction itself has been used in the industry since the 1970s, when coal was gasified to produce methane in large units, biomass product gas cleaning and purification is currently still a challenge. Due to the nature of the reaction, pressurizing and interstage cooling to keep temperatures between 350-500°C is best for high methane yields, but economically challenging for small units. Heat recuperation or steam production will be mostly size-dependent and can play a crucial role in overall plant profitability.
• In most cases, gas upgrading consists of CO2 removal by physical absorption (see separate subchapter on physical absorption of CO2). The process itself is the same as used for CO2 scrubbing in IGCC units. As gas quality standards must be met for injection into the gas infrastructure (Wobbe Index, moisture and sulphur content), some units use liquefied gas flashing to attain the desired quality.
Environmental benefits achieved
• Process emissions are only non-fossil CO2. Gasification emissions contain mostly tar and particles which have to be removed before methanation (steps 3 and 4).
• NOx formation should not occur at SNG production but rather during SNG combustion.
• Summary Emission Reduction Potential, compared to biomass combustion in small combustion instal-lations:
- PM: none at SNG production
- SO2: no air emissions should occur
- NOx: moved to SNG combustion/use.
Applicability
• Current pilots show that 50-200 MWth is an attractive size range.
• SNG production is usually developed as a new process unit.
• In general, existing gasifiers could be retrofitted. Air-blown gasifiers might produce a gas with too high nitrogen content.
• The gas produced by methanation must meet gas quality standards for injection into the gas infrastructure.
33 Emerging techniques and technologies for large combustion plants up to 500 MWTH capacity
Cross-Media Effects
• Solid gasification residues or, if burnt, ash residues and precipitates are byproducts, which might have to be disposed of or landfilled (as for ashes from any biomass combustion facility).
• Gas cleaning water may contain high concentrations of halogenides, acids and organic compounds, therefore water treatment might be needed. This depends on plant layout and the fuel used, and asso-ciated costs might be high, especially if fuels like demolition wood and treated wood are burnt.
Operational Data
• Carbon conversion rates can be as high as 80%, but depend strongly on gasification characteristics.
• Overall energy efficiency is mostly in the 55-70% range, depending on the fuel (firing needs and H2/CO ratio after gasification), heat recovery and process layout (process efficiency). The 1 MWth methanation test facility at Güssing (Austria) demonstrated an efficiency of 56% without heat recovery.
Economics
• Depending on the gasifier and fuel type, low conversion rates and high flue gas cleaning needs might hinder economic attractiveness.
• High investment issues, as for fossil-fuel-fired IGCC units.
Driving force for implementation
Provision of a fossil-free carbon natural gas substitute to be used in the existing infrastructure for present gas applications (heat, power, CHP from household scale to power plant scale).
Reference literature (selection)
Graf, F. and Bajohr, S.: “Erzeugung von SNG aus ligninreicher Biomasse”, Energie | Wasser-Praxis, Vol. 4/2009, pp. 10-16.
Guerrini O. et al.: “Towards a green natural gas efficient pathway through biomass gasification and metha-nation”, presented at: International Gas Research Conference, 2011, Seoul.
Perrin, M.: “Syngas for Today and Biomethane 2G for Tomorrow as Opportunities to Green the Gas Mar-ket”, presented at: International Gas Research Conference, 2011, Seoul.
v. d. Meijden, C. et al.: “Bioenergy II: Scale-Up of the Milena Biomass Gasification Process”, International Journal of Chemical Reaction Engineering, Vol. 7 (2009), A53.
v. d. Meijden, C. et al.: “Preparations for a 10 MWth Bio-CHP Demonstration based on the MILENA Gasi-fication Technology”, presented at the 18th European Biomass Conference and Exhibition, Lyon, 2010.
Bio‐SNG – Demonstration of the production and utilization of synthetic natural gas (SNG) from solid bio-fuels - Final Project Report -, available at www.dbfz.de, 2011.
E.On Gasification Development AB: “Biogas fran skogen”, brochure, available at www.eon.se, 2011.
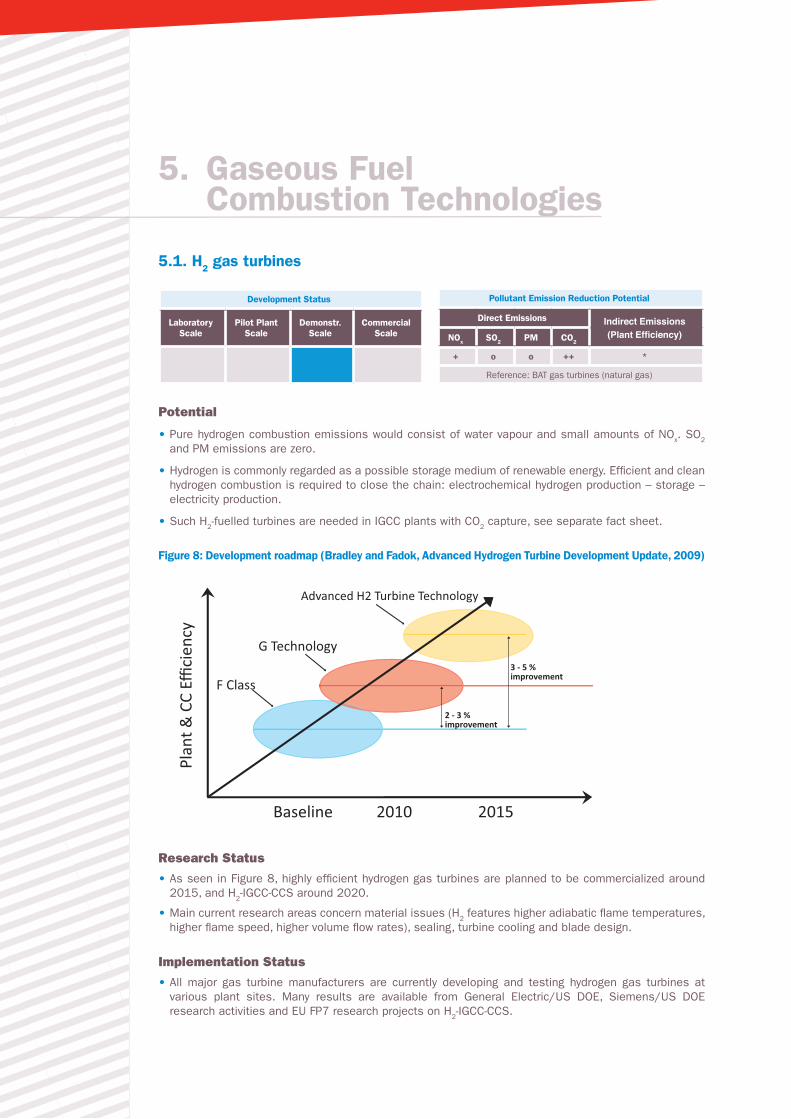
5. Gaseous Fuel Combustion Technologies
5.1. H2 gas turbines
Development Status
Laboratory Scale
Pilot Plant Scale
Demonstr. Scale
Commercial Scale
Pollutant Emission Reduction Potential
Direct Emissions Indirect Emissions (Plant Efficiency)NOx SO2 PM CO2
+ o o ++ *
Reference: BAT gas turbines (natural gas)
Potential
• Pure hydrogen combustion emissions would consist of water vapour and small amounts of NOx. SO2 and PM emissions are zero.
• Hydrogen is commonly regarded as a possible storage medium of renewable energy. Efficient and clean hydrogen combustion is required to close the chain: electrochemical hydrogen production – storage – electricity production.
• Such H2-fuelled turbines are needed in IGCC plants with CO2 capture, see separate fact sheet.
Figure 8: Development roadmap (Bradley and Fadok, Advanced Hydrogen Turbine Development Update, 2009)
Baseline 2010 2015
Plan
t & C
C Effi
cien
cy
Advanced H2 Turbine Technology
G Technology
F Class 3 - 5 %improvement
2 - 3 %improvement
!
Schéma page 42
Research Status
• As seen in Figure 8, highly efficient hydrogen gas turbines are planned to be commercialized around 2015, and H2-IGCC-CCS around 2020.
• Main current research areas concern material issues (H2 features higher adiabatic flame temperatures, higher flame speed, higher volume flow rates), sealing, turbine cooling and blade design.
Implementation Status
• All major gas turbine manufacturers are currently developing and testing hydrogen gas turbines at various plant sites. Many results are available from General Electric/US DOE, Siemens/US DOE research activities and EU FP7 research projects on H2-IGCC-CCS.
35 Emerging techniques and technologies for large combustion plants up to 500 MWTH capacity
Description
• Gas turbines, which are able to use pure hydrogen as a fuel or can shift between hydrogen-rich synthe-sis gas and pure hydrogen.
• Current research and development is based on natural gas/syngas f-class and g-class turbine techno-logies (up to 39% efficiency and up to 300 MWel), which are modified to fire hydrogen-rich or hydrogen-only gas.
• In comparison to fuelling with methane or natural gas, the adiabatic flame temperature increases, there-fore the combustion chamber, the injection ports and the turbine blades need to be improved. Further-more, as the flame speed and specific flue gas volume increase, turbine layout needs to be changed in order to achieve maximum efficiencies.
Environmental benefits achieved
• When pure H2 is used, only NOx emissions occur. According to manufacturers, NOx emissions as low as 2 ppm-vol (15% O2) can be currently reached by diffusion flame combustion plus dilution or by reducing the combustion temperatures. In consequence, efficiency decreases in these cases.
• According to manufacturers, SOx and PM emissions would be close to zero. Therefore, no flue gas cleaning would be required and no subsequent residues (disposable filtered dusts, gypsum, etc) would be generated.
• Summary Emission Reduction Potential, compared to a BAT natural gas-fuelled gas turbine:
- PM: emissions would be close to zero, which is similar to BAT natural gas-fuelled gas turbines.
- SO2: emissions would be close to zero, which is similar to BAT natural gas-fuelled gas turbines.
- NOx: 2 ppm-vol is considered as a reachable target, which would be lower than NOx emissions from BAT natural gas-fuelled gas turbines.
Applicability
• This technology is mainly developed for IGCC applications, i.e. for plants of total size mainly in the range of 200-600 MWel.
• Retrofits are considered to be technically easy as simple turbine exchange and cast house modifi-cations would be needed. However, it is important to highlight the fact that site specific issues are important in such cases, since the following parameters must be taken into account to reach the above-mentioned emission targets: air intake system, feedstock pre-cleaning techniques, feedstock make-up, generator shaft, turbine housing.
• If retrofitted in combination with a fuel switch from CH4 to H2, infrastructure for H2 supply/H2 buffer tanks have to be constructed.
Cross-Media Effects
• If precleaning of gas is needed, abatement techniques will influence cross-media effects (e.g. shifting to the water media if wet scrubbing is used).
Operational Data
• Baseline efficiencies for current f-class turbines are: natural gas8/syngas9: 37-40%.
• According to Figure 8, efficiency for hydrogen turbines might exceed f-class turbines by 3-5 percentage points around 2015.
Economics
• Higher efficiencies of gas turbines and of the total powertrain would lead to smaller IGCC plant size (especially the gasifier size).
• IGCC investment even with H2 turbines is still regarded to be very high. Nevertheless, highly efficient hydrogen gas turbines are regarded as one of the most important drivers to fulfil the goal of lowering IGCC investment by 20-30%.
(8) Approximately 38% (HHV). Source: Anderson, R.: “GE Perspectives – Advanced IGCC / Hydrogen Gas Turbine Development”, presented at UTSR, 2010.(9) 39,5% (HHV) on unspecified syngas. Source: Bradley, T. and Fadok, J.: “Advanced Hydrogen Turbine Development Update”, presented at ASME Turbo Expo,
Orlando, 2009.
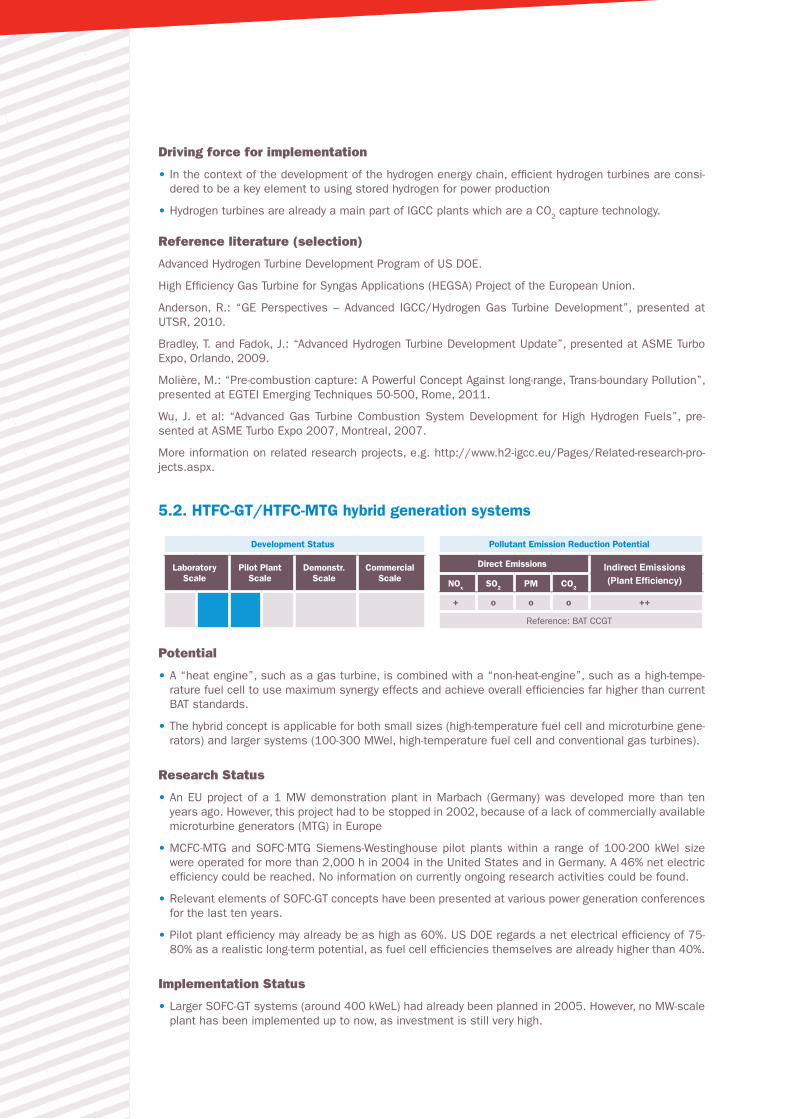
Driving force for implementation
• In the context of the development of the hydrogen energy chain, efficient hydrogen turbines are consi-dered to be a key element to using stored hydrogen for power production
• Hydrogen turbines are already a main part of IGCC plants which are a CO2 capture technology.
Reference literature (selection)
Advanced Hydrogen Turbine Development Program of US DOE.
High Efficiency Gas Turbine for Syngas Applications (HEGSA) Project of the European Union.
Anderson, R.: “GE Perspectives – Advanced IGCC/Hydrogen Gas Turbine Development”, presented at UTSR, 2010.
Bradley, T. and Fadok, J.: “Advanced Hydrogen Turbine Development Update”, presented at ASME Turbo Expo, Orlando, 2009.
Molière, M.: “Pre-combustion capture: A Powerful Concept Against long-range, Trans-boundary Pollution”, presented at EGTEI Emerging Techniques 50-500, Rome, 2011.
Wu, J. et al: “Advanced Gas Turbine Combustion System Development for High Hydrogen Fuels”, pre-sented at ASME Turbo Expo 2007, Montreal, 2007.
More information on related research projects, e.g. http://www.h2-igcc.eu/Pages/Related-research-pro-jects.aspx.
5.2. HTFC-GT/HTFC-MTG hybrid generation systems
Development Status
Laboratory Scale
Pilot Plant Scale
Demonstr. Scale
Commercial Scale
Pollutant Emission Reduction Potential
Direct Emissions Indirect Emissions (Plant Efficiency)NOx SO2 PM CO2
+ o o o ++
Reference: BAT CCGT
Potential
• A “heat engine”, such as a gas turbine, is combined with a “non-heat-engine”, such as a high-tempe-rature fuel cell to use maximum synergy effects and achieve overall efficiencies far higher than current BAT standards.
• The hybrid concept is applicable for both small sizes (high-temperature fuel cell and microturbine gene-rators) and larger systems (100-300 MWel, high-temperature fuel cell and conventional gas turbines).
Research Status
• An EU project of a 1 MW demonstration plant in Marbach (Germany) was developed more than ten years ago. However, this project had to be stopped in 2002, because of a lack of commercially available microturbine generators (MTG) in Europe
• MCFC-MTG and SOFC-MTG Siemens-Westinghouse pilot plants within a range of 100-200 kWel size were operated for more than 2,000 h in 2004 in the United States and in Germany. A 46% net electric efficiency could be reached. No information on currently ongoing research activities could be found.
• Relevant elements of SOFC-GT concepts have been presented at various power generation conferences for the last ten years.
• Pilot plant efficiency may already be as high as 60%. US DOE regards a net electrical efficiency of 75-80% as a realistic long-term potential, as fuel cell efficiencies themselves are already higher than 40%.
Implementation Status
• Larger SOFC-GT systems (around 400 kWeL) had already been planned in 2005. However, no MW-scale plant has been implemented up to now, as investment is still very high.
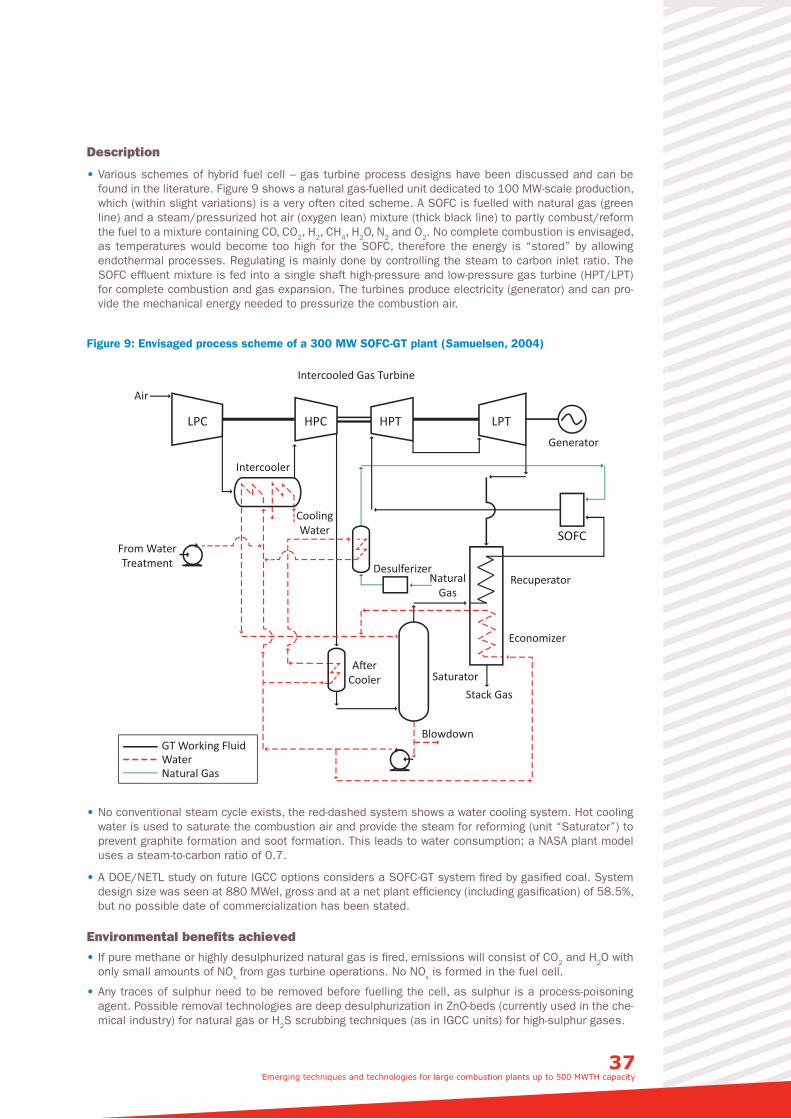
37 Emerging techniques and technologies for large combustion plants up to 500 MWTH capacity
Description
• Various schemes of hybrid fuel cell – gas turbine process designs have been discussed and can be found in the literature. Figure 9 shows a natural gas-fuelled unit dedicated to 100 MW-scale production, which (within slight variations) is a very often cited scheme. A SOFC is fuelled with natural gas (green line) and a steam/pressurized hot air (oxygen lean) mixture (thick black line) to partly combust/reform the fuel to a mixture containing CO, CO2, H2, CH4, H2O, N2 and O2. No complete combustion is envisaged, as temperatures would become too high for the SOFC, therefore the energy is “stored” by allowing endothermal processes. Regulating is mainly done by controlling the steam to carbon inlet ratio. The SOFC effluent mixture is fed into a single shaft high-pressure and low-pressure gas turbine (HPT/LPT) for complete combustion and gas expansion. The turbines produce electricity (generator) and can pro-vide the mechanical energy needed to pressurize the combustion air.
Figure 9: Envisaged process scheme of a 300 MW SOFC-GT plant (Samuelsen, 2004)
GT Working FluidWaterNatural Gas
Air
Intercooled Gas Turbine
Generator
Recuperator
Economizer
Stack GasSaturator
Blowdown
NaturalGas
Desulferizer
A�erCooler
CoolingWater
Intercooler
From WaterTreatment
LPC HPC HPT LPT
SOFC
!
Schéma page 46
• No conventional steam cycle exists, the red-dashed system shows a water cooling system. Hot cooling water is used to saturate the combustion air and provide the steam for reforming (unit “Saturator”) to prevent graphite formation and soot formation. This leads to water consumption; a NASA plant model uses a steam-to-carbon ratio of 0.7.
• A DOE/NETL study on future IGCC options considers a SOFC-GT system fired by gasified coal. System design size was seen at 880 MWel, gross and at a net plant efficiency (including gasification) of 58.5%, but no possible date of commercialization has been stated.
Environmental benefits achieved
• If pure methane or highly desulphurized natural gas is fired, emissions will consist of CO2 and H2O with only small amounts of NOx from gas turbine operations. No NOx is formed in the fuel cell.
• Any traces of sulphur need to be removed before fuelling the cell, as sulphur is a process-poisoning agent. Possible removal technologies are deep desulphurization in ZnO-beds (currently used in the che-mical industry) for natural gas or H2S scrubbing techniques (as in IGCC units) for high-sulphur gases.
• Summary Emission Reduction Potential, compared to a BAT combined-cycle gas turbine:
- PM: emissions would be close to zero, as for BAT CCGT
- SO2: emissions would be close to zero, as for BAT CCGT
- NOx: Very low emissions are expected, lower than in the case of BAT CCGT.
Applicability
• As HTFC-GT/HTFC-MTG are based on a completely new plant concept, these apply to new plants and not existing ones.
• This hybrid technology is considered to be applicable from < 1 MWel upwards to at least 300 MWel. US DOE carried out calculations based on examples of 880 MWel output capacity.
Cross-Media Effects
• Fresh water consumption might be high, if flue gas vapour is not recycled.
Operational Data
• Pressurization levels currently used can vary significantly.
• Current test plant efficiencies of fuel cells can be as high as 55-60% for simple cycle operations. Ove-rall net efficiency depends on the method of combustion air compression and the oxygen production method (if coal is chosen or oxygen used instead of air).
• DOE/NETL sees HTFC/GT or HTFC/MTG as the combustion technology with the highest net electrical efficiencies across all relevant size classes up to 900 MWel and its future electrical efficiency potential at 75-80% for LCP applications.
Economics
• Plant operation costs are expected to be very low, as high efficiency is expected along with low fuel costs and no flue gas cleaning needs.
• DOE/NETL suggests a ratio of approximately USD 550 /kW (2007) for investment in the fuel cell. EU research projects of 2001/2002 have set a future SOFC/MTG investment target of €1,200-1,500/kW.
• Currently, investment is considered to be too high for economic operation.
Driving force for implementation
• The opportunity to generate electricity at high efficiency and with near zero pollutant emissions.
• One single concept for centralized and decentralized power production.
Reference literature (selection)
Appenzeller, K.: “1 MW SOFC – hybrid fuel cell/micro-turbine system”, information fact sheet of the EU FP5 project “Demonstration of a MWel Class Power System using High Temperature Fuel Cells (SOFC) combined with Micro-Turbine Generators (1MWSOFC)”.
DOE/NETL: “Current and Future IGCC Technologies – Vol. 1”, DOE/NETL-Report-2008/1337, 2008.
Samuelsen, S.: “Fuel Cell/Gas Turbine Hybrid Systems”, presented at ASME International Gas Turbine Institute, 2004.
Steffen, C., Freeh, J. and Larosiliere, L.: “Solid Oxide Fuel Cell/Gas Turbine Hybrid Cycle Technology for Auxiliary Aerospace Power”, presented at Turbo Expo, Reno, 2005.
Veyo, S.: “Tubular SOFC Hybrid Power Systems”, presented at: “3rd DOE/UN International Conference and Workshop on Hybrid Power Systems, Newport Beach, 2003.
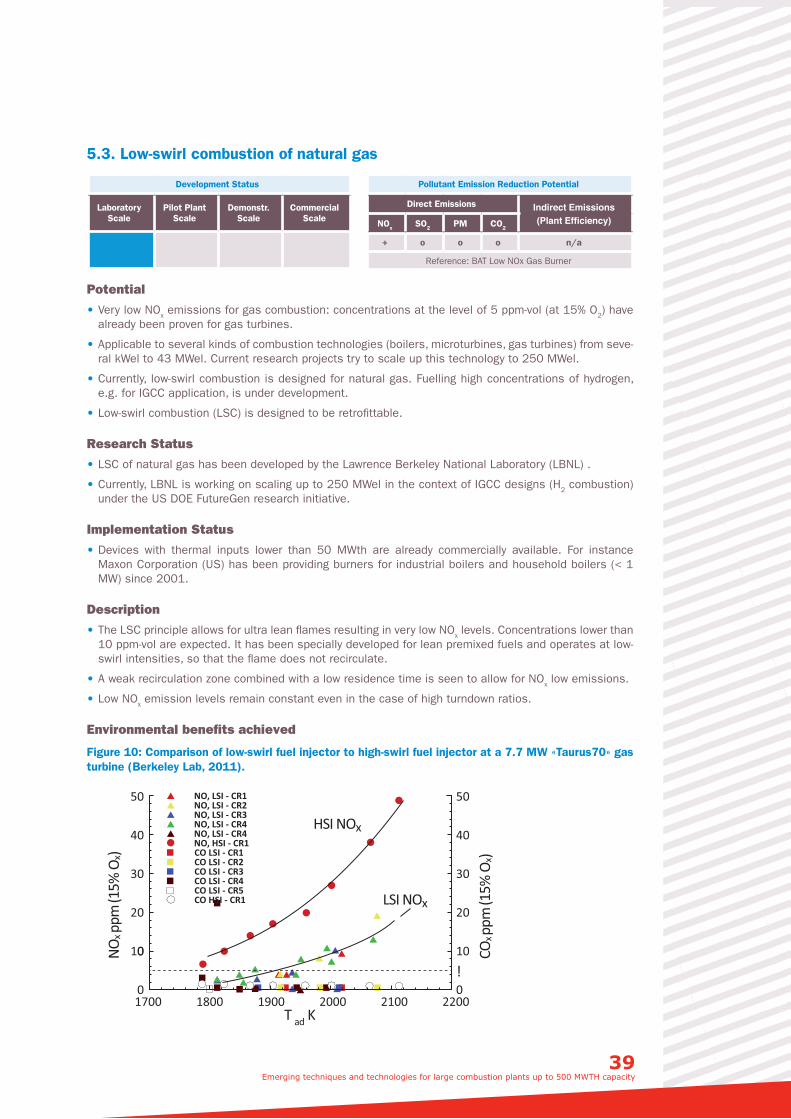
39 Emerging techniques and technologies for large combustion plants up to 500 MWTH capacity
5.3. Low-swirl combustion of natural gas
Development Status
Laboratory Scale
Pilot Plant Scale
Demonstr. Scale
Commercial Scale
Pollutant Emission Reduction Potential
Direct Emissions Indirect Emissions (Plant Efficiency)NOx SO2 PM CO2
+ o o o n/a
Reference: BAT Low NOx Gas Burner
Potential
• Very low NOx emissions for gas combustion: concentrations at the level of 5 ppm-vol (at 15% O2) have already been proven for gas turbines.
• Applicable to several kinds of combustion technologies (boilers, microturbines, gas turbines) from seve-ral kWel to 43 MWel. Current research projects try to scale up this technology to 250 MWel.
• Currently, low-swirl combustion is designed for natural gas. Fuelling high concentrations of hydrogen, e.g. for IGCC application, is under development.
• Low-swirl combustion (LSC) is designed to be retrofittable.
Research Status
• LSC of natural gas has been developed by the Lawrence Berkeley National Laboratory (LBNL) .
• Currently, LBNL is working on scaling up to 250 MWel in the context of IGCC designs (H2 combustion) under the US DOE FutureGen research initiative.
Implementation Status
• Devices with thermal inputs lower than 50 MWth are already commercially available. For instance Maxon Corporation (US) has been providing burners for industrial boilers and household boilers (< 1 MW) since 2001.
Description
• The LSC principle allows for ultra lean flames resulting in very low NOx levels. Concentrations lower than 10 ppm-vol are expected. It has been specially developed for lean premixed fuels and operates at low-swirl intensities, so that the flame does not recirculate.
• A weak recirculation zone combined with a low residence time is seen to allow for NOx low emissions.
• Low NOx emission levels remain constant even in the case of high turndown ratios.
Environmental benefits achieved
Figure 10: Comparison of low-swirl fuel injector to high-swirl fuel injector at a 7.7 MW «Taurus70» gas turbine (Berkeley Lab, 2011).
0
010
20
30
40
50
0
10
20
30
40
50
1700 1800 1900 2000 2100 2200T ad K
NOx p
pm (1
5% O
x)
COx p
pm (1
5% O
x)
HSI NOx
LSI NOx
!
• Figure 10 compares NOx emissions in the case of a natural-gas-fired turbine with conventional high swirl (HSI) in the one hand and retrofitted low swirl injection (LSI) in the other hand. This scheme is related to a 7.7 MWel gas turbine. Regarding the LSI technology, NOx emissions at standard operating conditions were lower than 5 ppm-vol (at 15% O2).
• The licensee Maxon sees emissions of natural gas combustion for its products (up to 35 MWel) below 9 ppm (mostly between 4-7 ppm at 3% O2).
• Berkeley Laboratories see the US DOE future goal of IGCC operation with less than 2 ppm NOx emis-sions at high hydrogen rates achievable with low-swirl combustion technology.
• Though residence time is reduced, CO emission levels are supposed to decrease, as turbulence in the centre of the flame is reduced, leading to full combustion.
• Summary Emission Reduction Potential, compared to a BAT low-NOx gas burner:
- PM: PM emissions are seen to remain close to zero
- SO2: in the case of natural gas, emissions are expected to be very low, as for BAT low-NOx burners
- NOx: 2 ppm-vol is considered as a long-term goal.
Applicability
• Applicability to plants with thermal outputs lower than 50 MWel has been proven. Current developments could extend the range up to 250 MWel.
• The LSC is designed to be retrofittable, as fuel injectors are the main part to be replaced. No more information is available with regard to other substantial modifications which could be needed.
• Currently applicable to boilers and gas turbines using lean premixed combustion of natural gas. Applica-bility is currently being extended to fuels with a high hydrogen content (with an aim to fire up to 90% H2).
Operational Data
• No performance data could be obtained. Low CO emissions suggest that a high combustion efficiency is achieved.
Driving force for implementation
• Very low NOx emissions through primary measures only.
Reference literature (selection)
Johnson, M. R. et al.: “A comparison of the flowfields and emissions of high-swirl injectors and low-swirl injectors for lean premixed gas turbines”, in: Proceedings of the Combustion Institute, 30 (2005) Issue 2, pp. 2867-2874.
Cheng, Robert: “Fundamental Issues of Lean Premixed H2/air Combustion for Gas Turbine Development”, presented at: DOE/EPRI Workshop on H2 Combustion in Gas Turbines, 2007.
Cheng, Robert et al.: “Laboratory Investigations on Low-Swirl Injectors for IGCC Combustion Turbines”, presented at ICEPAG 2008, 2008.
Berkeley Lab., Technology Information of the Lawrence Berkeley National Laboratory on Ultra-Clean Low Swirl Combustion, http://eetd.lbl.gov/l2m2/lowswirl.html, accessed on 10.10.2011.
5.4 Swirl Flash
Development Status
Laboratory Scale
Pilot Plant Scale
Demonstr. Scale
Commercial Scale
Pollutant Emission Reduction Potential
Direct Emissions Indirect Emissions (Plant Efficiency)NOx SO2 PM CO2
+ o o o +
Reference: BAT gas turbines
41 Emerging techniques and technologies for large combustion plants up to 500 MWTH capacity
Potential • Primary wet compression water injection technology allowing for low NOx emissions (down to 10-60 mg/Nm³).
• Costs are claimed to be low.
Research Status
• No information could be obtained.
Implementation Status
• Demonstration facility at Amer Power Station, Geertruidenberg (Netherlands) since 2002.
Description
• Hot pressurized water (130 bar, 180°C) is injected at the inlet of the air compressor, forming droplets of 2-3 μm, which are immediately evaporated. Fast evaporation minimizes compressor blade contact to avoid blade erosion and to stabilize compressor operating characteristics. Water injection and evapo-ration lead to a quasi-isothermal compression and a simultaneous decrease in outlet temperature, i.e. lower mechanical compression needs. Higher H2O concentrations lead to lower stoichiometric adiabatic flame temperatures, resulting in less thermal NOx being formed.
• Pressurization and preheating water aids fast atomization.
• Installation of pressurized water injection banks at the compressor gas inlet is needed, but necessary gas turbine modifications are claimed to be not substantial.
• Upstream water evaporation is unnecessary. Only pressurization is needed, as water instead of steam is needed. Deionized water must be used.
Environmental benefits achieved
• NOx emissions of 10-60 mg/Nm³ are achievable without secondary measures such as SCR and, accor-ding to the manufacturer, negligible CO rates have been shown.
• NOx reduction at DLN gas turbines can be up to 20%, and at conventional no-DLN turbines up to 40%, according to the licensee.
• Summary Emission Reduction Potential, compared to BAT gas turbines:
- PM: no change is expected
- SO2: no change is expected
- NOx: 10-60 mg/Nm³ is considered as a possibly achievable level, which is slightly lower than current BAT associated emission levels under the European IED.
Applicability
• Swirl Flash technology is designed for retrofitting existing gas turbines of theoretically every size.
Cross-Media Effects
• Water consumption, up to 2% m/m of flue gas, if needed.
Operational Data • For constant operations, fuel input increases slightly and overall electricity output of the gas turbine rises, for instance up to 10-15% (2 percentage points), where a DLN, steam or water injection system has been previously implemented.
Economics • Van Liere et al. claim NOx abatement costs of €1,680/t, but detailed information on investment and operating costs is not provided.
• Retrofitting costs are likely to be fairly low compared to measures related to the combustion section.
• Main operating costs are heat (for heating water up to 180°C) and energy for water deionization and pressurization.
• Plant efficiency increase is expected to outweigh Swirl Flash operating costs.
Driving force for implementation
• Need to reduce NOx emissions without implementing secondary measures (namely SCR).
Reference literature (selection)
Van Liere, J., Laagland, G. and Meijer, C.: “Retrofit of gas turbines by SwirlFlash over-spray”, available at www.max-boost.co.uk, accessed on 20.09.2011.
Technology owner Stork Thermeq: www.stork-thermeq.nl.
5.5. Flameless combustion of gaseous fuels
Development Status
Laboratory Scale
Pilot Plant Scale
Demonstr. Scale
Commercial Scale
Pollutant Emission Reduction Potential
Direct Emissions Indirect Emissions (Plant Efficiency)NOx SO2 PM CO2
+ o o o +
Reference: BAT gas combustion in boilers
Potential
• A primary very low NOx technique for the combustion of gaseous fuels, with no need for additional secondary measures.
• Higher combustion efficiency than conventional burners is foreseen.
• Very low NOx technology which would suitable for existing plants, allowing longer lifetime for the retro-fitted equipment.
Research Status
• The concept of flameless combustion was introduced in the 1980s to 1990s for industrial furnace applications where temperatures are significantly higher (> 1,000°C) than the ones found in combus-tion plants.
• Current research activities carried out by GDF Suez (France) based on simulation and lab scale testing (including flame stability, “flame” detection for safety issues, cost estimations, modelling tools), focus on the adaptation to gas-fired boilers where temperatures are lower than 1,000°C.
Implementation Status
• Burners using high gas recirculation to achieve flameless combustion are commercially available for industrial furnace applications. For example, this technology is already implemented to supply heat for a galvanizing line in a stainless steel production facility, and had its first commercial demonstration in the early 1990s.
• All major manufacturers of burners for boilers are developing and testing low NOX burners, but very low NOX levels are guaranteed only for new plants. Currently, there is no known flameless combustion technology implemented on industrial natural gas boilers.
Description
• Flameless combustion is achieved by dilution of reactants thanks to strong burnt gas recirculation.
• Originally, flameless combustion aimed to combust gases at temperatures above self-ignition (~850°C) and simultaneously achieve very low NOx emission levels and high heating efficiency.
• Modern low NOx burners for boilers can produce high levels of CO when single-digit NOx emissions are achieved. Flameless is a combustion regime exempt from the NOx–CO pairing.
• The name “flameless combustion” comes from the fact there is no visible flame in high-temperature furnaces (see Figure 11). In that configuration, radiative heat fluxes from the wall prevent the front flame from being seen.
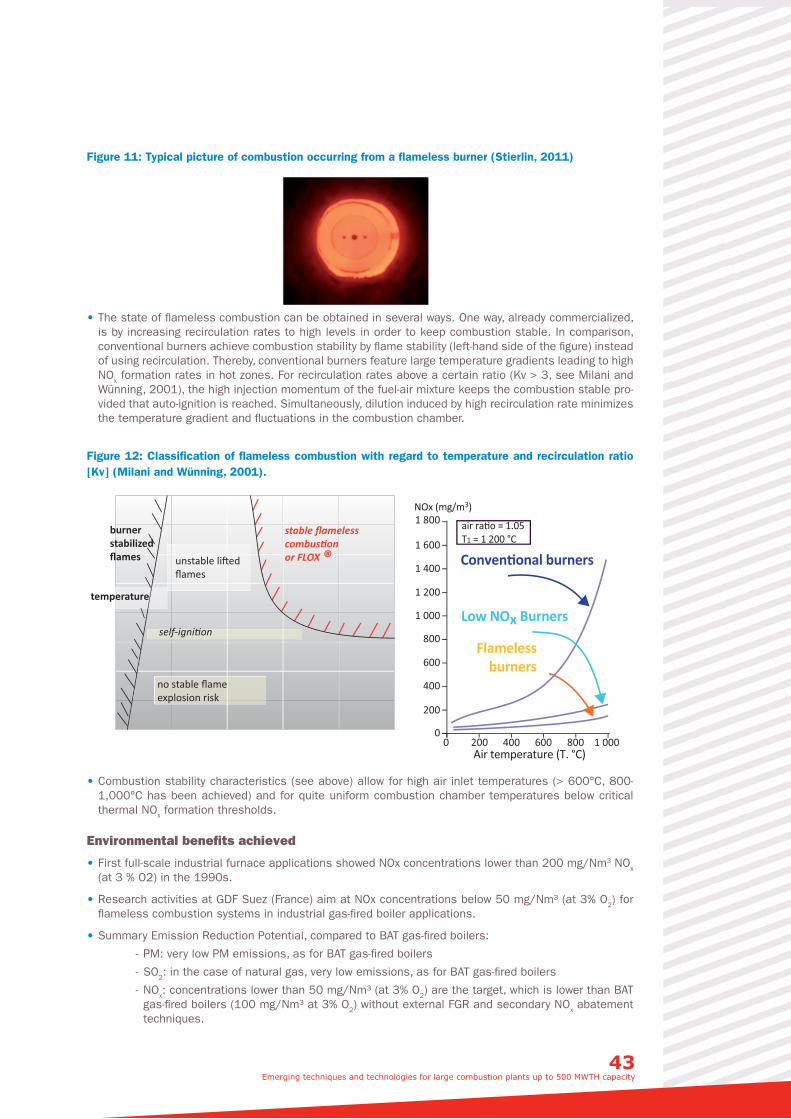
43 Emerging techniques and technologies for large combustion plants up to 500 MWTH capacity
Figure 11: Typical picture of combustion occurring from a flameless burner (Stierlin, 2011)
• The state of flameless combustion can be obtained in several ways. One way, already commercialized, is by increasing recirculation rates to high levels in order to keep combustion stable. In comparison, conventional burners achieve combustion stability by flame stability (left-hand side of the figure) instead of using recirculation. Thereby, conventional burners feature large temperature gradients leading to high NOx formation rates in hot zones. For recirculation rates above a certain ratio (Kv > 3, see Milani and Wünning, 2001), the high injection momentum of the fuel-air mixture keeps the combustion stable pro-vided that auto-ignition is reached. Simultaneously, dilution induced by high recirculation rate minimizes the temperature gradient and fluctuations in the combustion chamber.
Figure 12: Classification of flameless combustion with regard to temperature and recirculation ratio [Kv] (Milani and Wünning, 2001).
00 200 400 600 800 1 000
200
400
600
800
1 000
1 200
1 400
1 600
1 800
Conven�onal burners
Low NOx Burners
Flamelessburners
Air temperature (T. °C)
NOx (mg/m3)
air ra�o = 1.05T1 = 1 200 °C
!
unstable li�edflames
burnerstabilizedflames
temperature
self-igni�on
no stable flameexplosion risk
stable flamelesscombus�onor FLOX ®
Schéma page 55
• Combustion stability characteristics (see above) allow for high air inlet temperatures (> 600°C, 800-1,000°C has been achieved) and for quite uniform combustion chamber temperatures below critical thermal NOx formation thresholds.
Environmental benefits achieved
• First full-scale industrial furnace applications showed NOx concentrations lower than 200 mg/Nm3 NOx (at 3 % O2) in the 1990s.
• Research activities at GDF Suez (France) aim at NOx concentrations below 50 mg/Nm³ (at 3% O2) for flameless combustion systems in industrial gas-fired boiler applications.
• Summary Emission Reduction Potential, compared to BAT gas-fired boilers:
- PM: very low PM emissions, as for BAT gas-fired boilers
- SO2: in the case of natural gas, very low emissions, as for BAT gas-fired boilers
- NOx: concentrations lower than 50 mg/Nm³ (at 3% O2) are the target, which is lower than BAT gas-fired boilers (100 mg/Nm³ at 3% O2) without external FGR and secondary NOx abatement techniques.
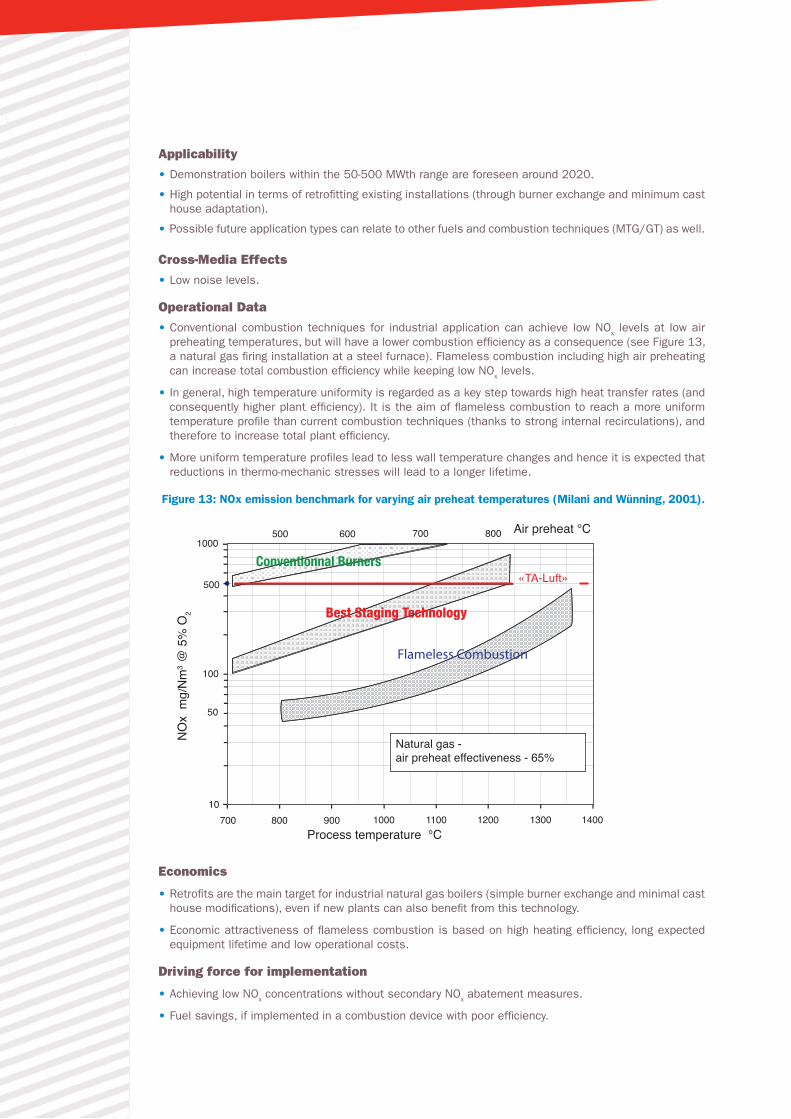
Applicability
• Demonstration boilers within the 50-500 MWth range are foreseen around 2020.
• High potential in terms of retrofitting existing installations (through burner exchange and minimum cast house adaptation).
• Possible future application types can relate to other fuels and combustion techniques (MTG/GT) as well.
Cross-Media Effects
• Low noise levels.
Operational Data
• Conventional combustion techniques for industrial application can achieve low NOx levels at low air preheating temperatures, but will have a lower combustion efficiency as a consequence (see Figure 13, a natural gas firing installation at a steel furnace). Flameless combustion including high air preheating can increase total combustion efficiency while keeping low NOx levels.
• In general, high temperature uniformity is regarded as a key step towards high heat transfer rates (and consequently higher plant efficiency). It is the aim of flameless combustion to reach a more uniform temperature profile than current combustion techniques (thanks to strong internal recirculations), and therefore to increase total plant efficiency.
• More uniform temperature profiles lead to less wall temperature changes and hence it is expected that reductions in thermo-mechanic stresses will lead to a longer lifetime.
Figure 13: NOx emission benchmark for varying air preheat temperatures (Milani and Wünning, 2001).
500
500
100
50
10
1000600
700 800
700 800
900 1000
Natural gas -air preheat effectiveness - 65%
1100 1200 1300 1400
Air preheat °C
Conventionnal Burners
Best Staging Technology
Flameless Combustion
«TA-Luft»
Process temperature °C
NO
x m
g/N
m3 @
5%
O2
Economics
• Retrofits are the main target for industrial natural gas boilers (simple burner exchange and minimal cast house modifications), even if new plants can also benefit from this technology.
• Economic attractiveness of flameless combustion is based on high heating efficiency, long expected equipment lifetime and low operational costs.
Driving force for implementation
• Achieving low NOx concentrations without secondary NOx abatement measures.
• Fuel savings, if implemented in a combustion device with poor efficiency.
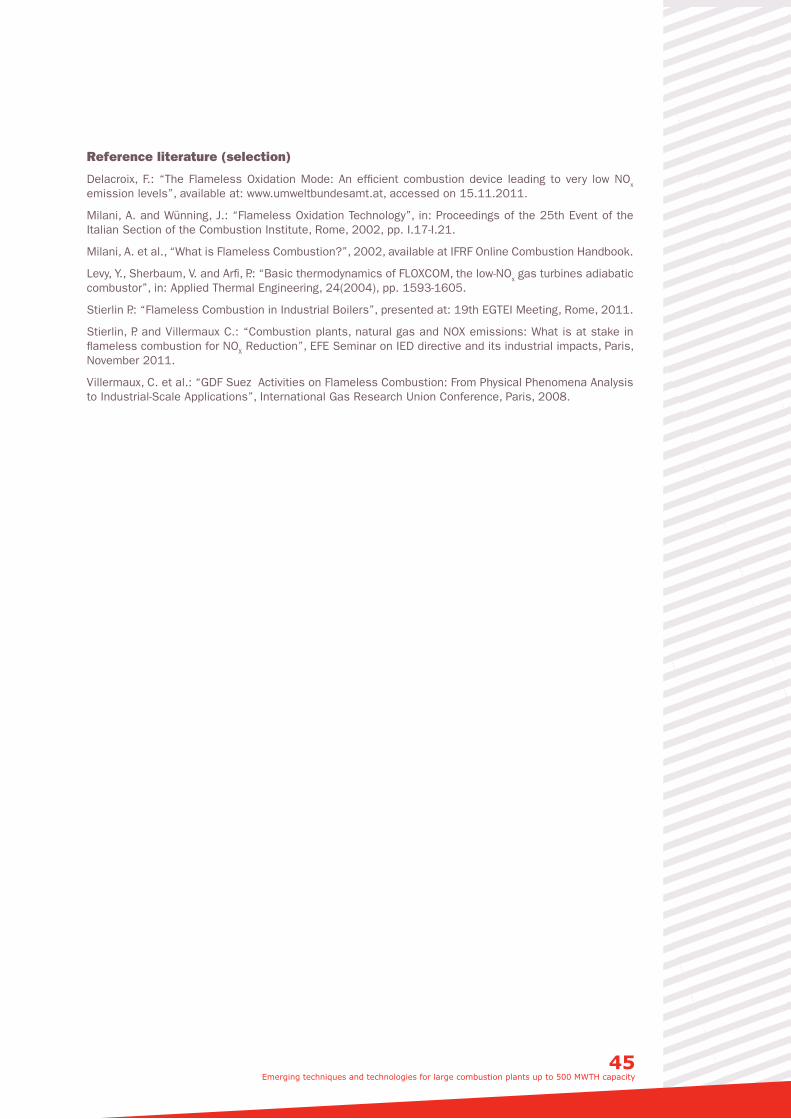
45 Emerging techniques and technologies for large combustion plants up to 500 MWTH capacity
Reference literature (selection)
Delacroix, F.: “The Flameless Oxidation Mode: An efficient combustion device leading to very low NOx emission levels”, available at: www.umweltbundesamt.at, accessed on 15.11.2011.
Milani, A. and Wünning, J.: “Flameless Oxidation Technology”, in: Proceedings of the 25th Event of the Italian Section of the Combustion Institute, Rome, 2002, pp. I.17-I.21.
Milani, A. et al., “What is Flameless Combustion?”, 2002, available at IFRF Online Combustion Handbook.
Levy, Y., Sherbaum, V. and Arfi, P.: “Basic thermodynamics of FLOXCOM, the low-NOx gas turbines adiabatic combustor”, in: Applied Thermal Engineering, 24(2004), pp. 1593-1605.
Stierlin P.: “Flameless Combustion in Industrial Boilers”, presented at: 19th EGTEI Meeting, Rome, 2011.
Stierlin, P. and Villermaux C.: “Combustion plants, natural gas and NOX emissions: What is at stake in flameless combustion for NOX Reduction”, EFE Seminar on IED directive and its industrial impacts, Paris, November 2011.
Villermaux, C. et al.: “GDF Suez Activities on Flameless Combustion: From Physical Phenomena Analysis to Industrial-Scale Applications”, International Gas Research Union Conference, Paris, 2008.
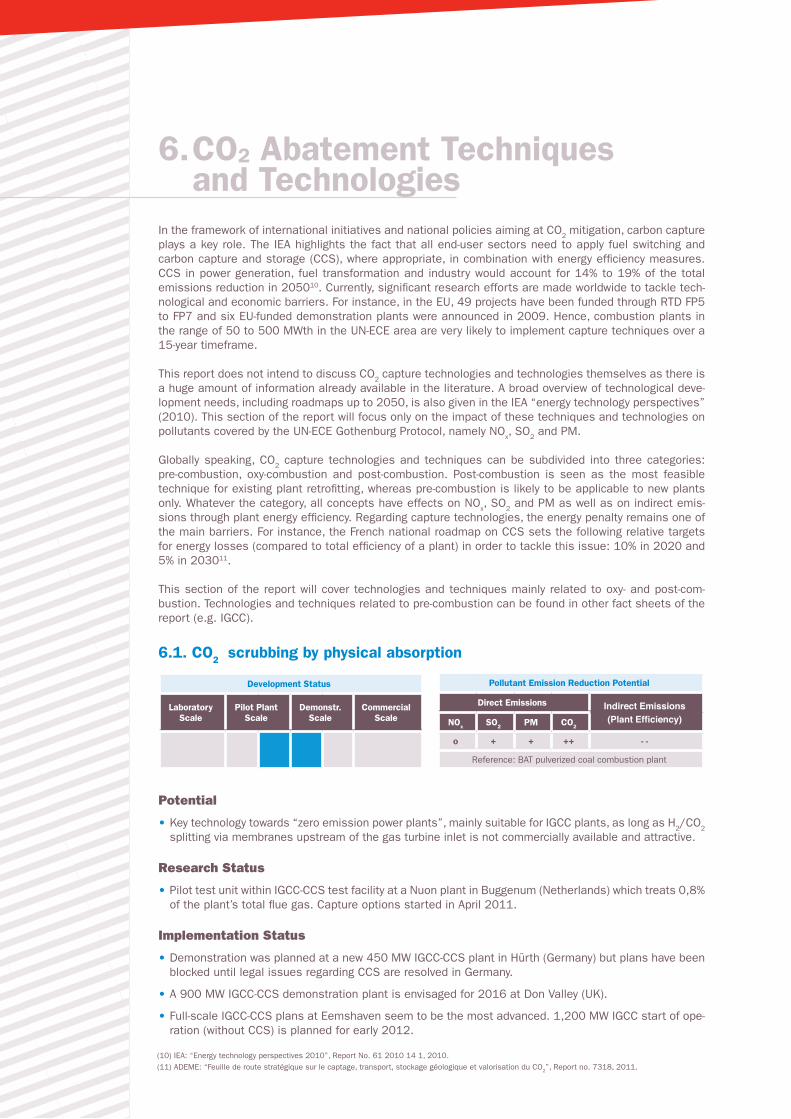
6. CO2 Abatement Techniques and Technologies
In the framework of international initiatives and national policies aiming at CO2 mitigation, carbon capture plays a key role. The IEA highlights the fact that all end-user sectors need to apply fuel switching and carbon capture and storage (CCS), where appropriate, in combination with energy efficiency measures. CCS in power generation, fuel transformation and industry would account for 14% to 19% of the total emissions reduction in 205010. Currently, significant research efforts are made worldwide to tackle tech-nological and economic barriers. For instance, in the EU, 49 projects have been funded through RTD FP5 to FP7 and six EU-funded demonstration plants were announced in 2009. Hence, combustion plants in the range of 50 to 500 MWth in the UN-ECE area are very likely to implement capture techniques over a 15-year timeframe.
This report does not intend to discuss CO2 capture technologies and technologies themselves as there is a huge amount of information already available in the literature. A broad overview of technological deve-lopment needs, including roadmaps up to 2050, is also given in the IEA “energy technology perspectives” (2010). This section of the report will focus only on the impact of these techniques and technologies on pollutants covered by the UN-ECE Gothenburg Protocol, namely NOx, SO2 and PM.
Globally speaking, CO2 capture technologies and techniques can be subdivided into three categories: pre-combustion, oxy-combustion and post-combustion. Post-combustion is seen as the most feasible technique for existing plant retrofitting, whereas pre-combustion is likely to be applicable to new plants only. Whatever the category, all concepts have effects on NOx, SO2 and PM as well as on indirect emis-sions through plant energy efficiency. Regarding capture technologies, the energy penalty remains one of the main barriers. For instance, the French national roadmap on CCS sets the following relative targets for energy losses (compared to total efficiency of a plant) in order to tackle this issue: 10% in 2020 and 5% in 203011.
This section of the report will cover technologies and techniques mainly related to oxy- and post-com-bustion. Technologies and techniques related to pre-combustion can be found in other fact sheets of the report (e.g. IGCC).
6.1. CO2 scrubbing by physical absorption
Development Status
Laboratory Scale
Pilot Plant Scale
Demonstr. Scale
Commercial Scale
Pollutant Emission Reduction Potential
Direct Emissions Indirect Emissions (Plant Efficiency)NOx SO2 PM CO2
o + + ++ - -
Reference: BAT pulverized coal combustion plant
Potential
• Key technology towards “zero emission power plants”, mainly suitable for IGCC plants, as long as H2/CO2 splitting via membranes upstream of the gas turbine inlet is not commercially available and attractive.
Research Status
• Pilot test unit within IGCC-CCS test facility at a Nuon plant in Buggenum (Netherlands) which treats 0,8% of the plant’s total flue gas. Capture options started in April 2011.
Implementation Status
• Demonstration was planned at a new 450 MW IGCC-CCS plant in Hürth (Germany) but plans have been blocked until legal issues regarding CCS are resolved in Germany.
• A 900 MW IGCC-CCS demonstration plant is envisaged for 2016 at Don Valley (UK).
• Full-scale IGCC-CCS plans at Eemshaven seem to be the most advanced. 1,200 MW IGCC start of ope-ration (without CCS) is planned for early 2012.
(10) IEA: “Energy technology perspectives 2010”, Report No. 61 2010 14 1, 2010.(11) ADEME: “Feuille de route stratégique sur le captage, transport, stockage géologique et valorisation du CO2”, Report no. 7318, 2011.
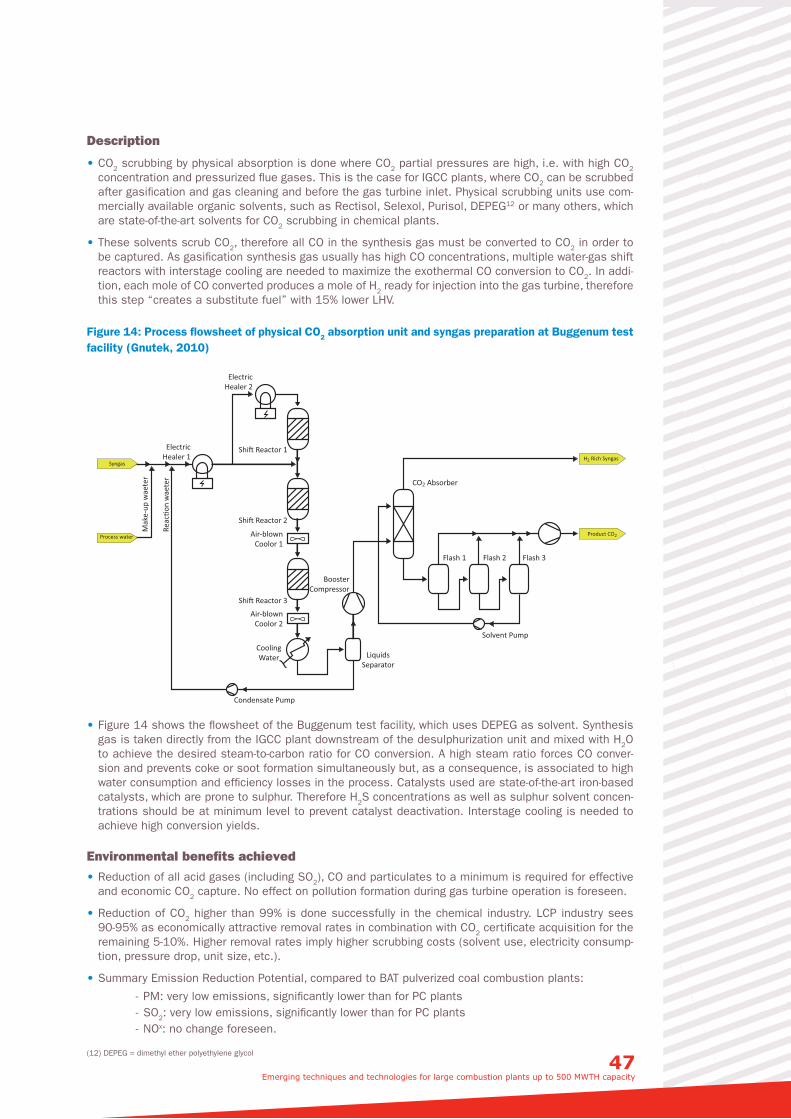
47 Emerging techniques and technologies for large combustion plants up to 500 MWTH capacity
Description
• CO2 scrubbing by physical absorption is done where CO2 partial pressures are high, i.e. with high CO2 concentration and pressurized flue gases. This is the case for IGCC plants, where CO2 can be scrubbed after gasification and gas cleaning and before the gas turbine inlet. Physical scrubbing units use com-mercially available organic solvents, such as Rectisol, Selexol, Purisol, DEPEG12 or many others, which are state-of-the-art solvents for CO2 scrubbing in chemical plants.
• These solvents scrub CO2, therefore all CO in the synthesis gas must be converted to CO2 in order to be captured. As gasification synthesis gas usually has high CO concentrations, multiple water-gas shift reactors with interstage cooling are needed to maximize the exothermal CO conversion to CO2. In addi-tion, each mole of CO converted produces a mole of H2 ready for injection into the gas turbine, therefore this step “creates a substitute fuel” with 15% lower LHV.
Figure 14: Process flowsheet of physical CO2 absorption unit and syngas preparation at Buggenum test facility (Gnutek, 2010)
ElectricHealer 2
ElectricHealer 1
Shi� Reactor 1
Shi� Reactor 2
Shi� Reactor 3
Flash 1 Flash 2 Flash 3
Solvent Pump
LiquidsSeparator
BoosterCompressor
Air-blownCoolor 1
Air-blownCoolor 2
CoolingWater
Condensate Pump
CO2 Absorber
Mak
e-up
wae
ter
Reac
�on
wae
ter
Product CO2
SyngasH2 Rich Syngas
Process water
Schéma page 60
• Figure 14 shows the flowsheet of the Buggenum test facility, which uses DEPEG as solvent. Synthesis gas is taken directly from the IGCC plant downstream of the desulphurization unit and mixed with H2O to achieve the desired steam-to-carbon ratio for CO conversion. A high steam ratio forces CO conver-sion and prevents coke or soot formation simultaneously but, as a consequence, is associated to high water consumption and efficiency losses in the process. Catalysts used are state-of-the-art iron-based catalysts, which are prone to sulphur. Therefore H2S concentrations as well as sulphur solvent concen-trations should be at minimum level to prevent catalyst deactivation. Interstage cooling is needed to achieve high conversion yields.
Environmental benefits achieved
• Reduction of all acid gases (including SO2), CO and particulates to a minimum is required for effective and economic CO2 capture. No effect on pollution formation during gas turbine operation is foreseen.
• Reduction of CO2 higher than 99% is done successfully in the chemical industry. LCP industry sees 90-95% as economically attractive removal rates in combination with CO2 certificate acquisition for the remaining 5-10%. Higher removal rates imply higher scrubbing costs (solvent use, electricity consump-tion, pressure drop, unit size, etc.).
• Summary Emission Reduction Potential, compared to BAT pulverized coal combustion plants:
- PM: very low emissions, significantly lower than for PC plants - SO2: very low emissions, significantly lower than for PC plants - NOx: no change foreseen.
(12) DEPEG = dimethyl ether polyethylene glycol
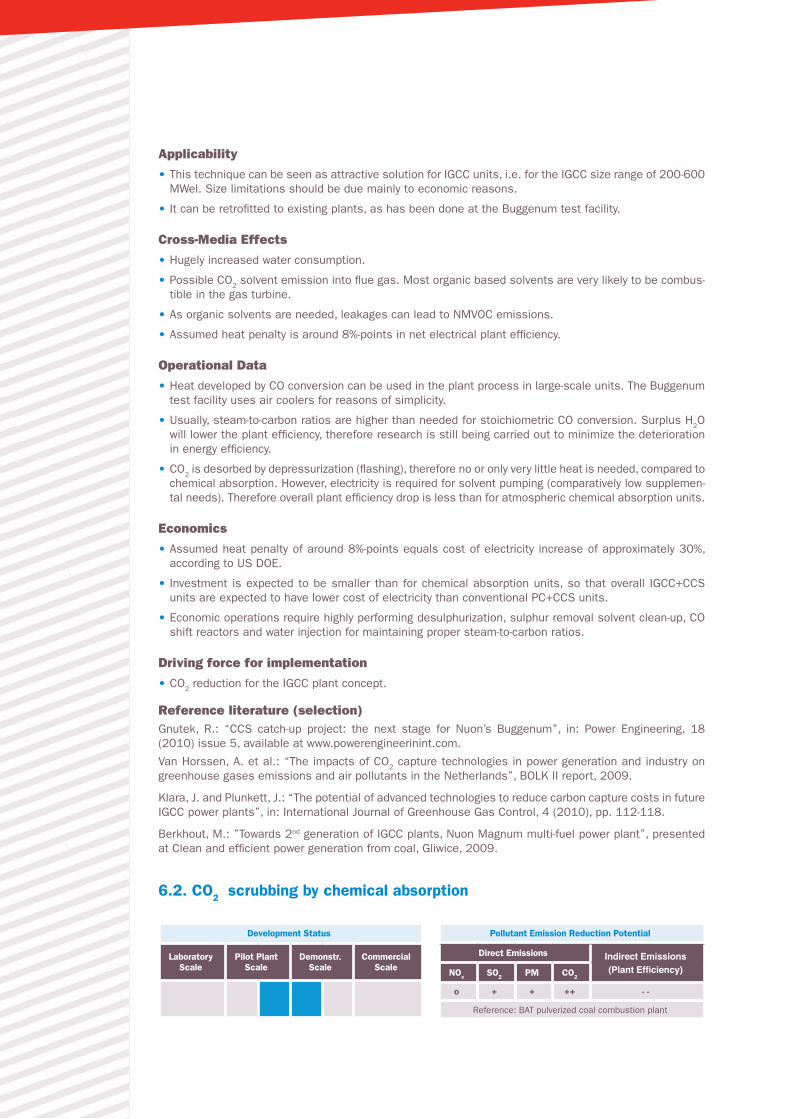
Applicability
• This technique can be seen as attractive solution for IGCC units, i.e. for the IGCC size range of 200-600 MWel. Size limitations should be due mainly to economic reasons.
• It can be retrofitted to existing plants, as has been done at the Buggenum test facility.
Cross-Media Effects
• Hugely increased water consumption.
• Possible CO2 solvent emission into flue gas. Most organic based solvents are very likely to be combus-tible in the gas turbine.
• As organic solvents are needed, leakages can lead to NMVOC emissions.
• Assumed heat penalty is around 8%-points in net electrical plant efficiency.
Operational Data
• Heat developed by CO conversion can be used in the plant process in large-scale units. The Buggenum test facility uses air coolers for reasons of simplicity.
• Usually, steam-to-carbon ratios are higher than needed for stoichiometric CO conversion. Surplus H2O will lower the plant efficiency, therefore research is still being carried out to minimize the deterioration in energy efficiency.
• CO2 is desorbed by depressurization (flashing), therefore no or only very little heat is needed, compared to chemical absorption. However, electricity is required for solvent pumping (comparatively low supplemen-tal needs). Therefore overall plant efficiency drop is less than for atmospheric chemical absorption units.
Economics
• Assumed heat penalty of around 8%-points equals cost of electricity increase of approximately 30%, according to US DOE.
• Investment is expected to be smaller than for chemical absorption units, so that overall IGCC+CCS units are expected to have lower cost of electricity than conventional PC+CCS units.
• Economic operations require highly performing desulphurization, sulphur removal solvent clean-up, CO shift reactors and water injection for maintaining proper steam-to-carbon ratios.
Driving force for implementation
• CO2 reduction for the IGCC plant concept.
Reference literature (selection)Gnutek, R.: “CCS catch-up project: the next stage for Nuon’s Buggenum”, in: Power Engineering, 18 (2010) issue 5, available at www.powerengineerinint.com.
Van Horssen, A. et al.: “The impacts of CO2 capture technologies in power generation and industry on greenhouse gases emissions and air pollutants in the Netherlands”, BOLK II report, 2009.
Klara, J. and Plunkett, J.: “The potential of advanced technologies to reduce carbon capture costs in future IGCC power plants”, in: International Journal of Greenhouse Gas Control, 4 (2010), pp. 112-118.
Berkhout, M.: ”Towards 2nd generation of IGCC plants, Nuon Magnum multi-fuel power plant”, presented at Clean and efficient power generation from coal, Gliwice, 2009.
6.2. CO2 scrubbing by chemical absorption
Development Status
Laboratory Scale
Pilot Plant Scale
Demonstr. Scale
Commercial Scale
Pollutant Emission Reduction Potential
Direct Emissions Indirect Emissions (Plant Efficiency)NOx SO2 PM CO2
o + + ++ - -
Reference: BAT pulverized coal combustion plant
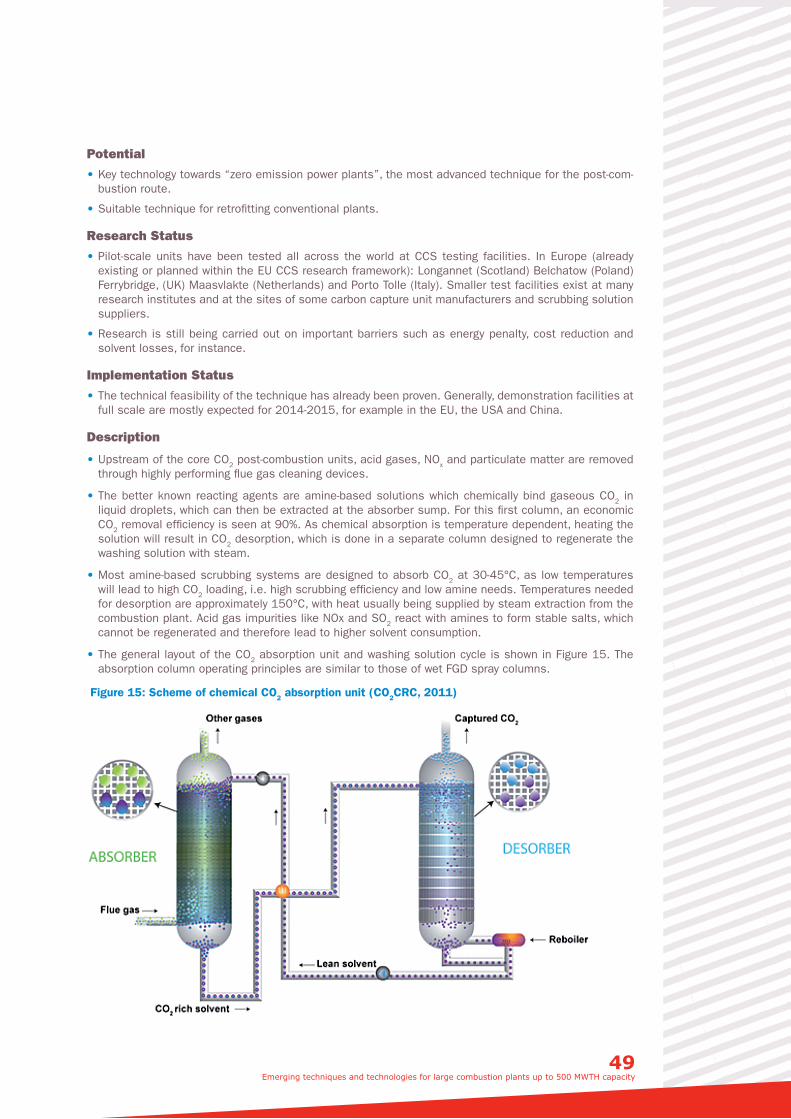
49 Emerging techniques and technologies for large combustion plants up to 500 MWTH capacity
Potential
• Key technology towards “zero emission power plants”, the most advanced technique for the post-com-bustion route.
• Suitable technique for retrofitting conventional plants.
Research Status
• Pilot-scale units have been tested all across the world at CCS testing facilities. In Europe (already existing or planned within the EU CCS research framework): Longannet (Scotland) Belchatow (Poland) Ferrybridge, (UK) Maasvlakte (Netherlands) and Porto Tolle (Italy). Smaller test facilities exist at many research institutes and at the sites of some carbon capture unit manufacturers and scrubbing solution suppliers.
• Research is still being carried out on important barriers such as energy penalty, cost reduction and solvent losses, for instance.
Implementation Status
• The technical feasibility of the technique has already been proven. Generally, demonstration facilities at full scale are mostly expected for 2014-2015, for example in the EU, the USA and China.
Description
• Upstream of the core CO2 post-combustion units, acid gases, NOx and particulate matter are removed through highly performing flue gas cleaning devices.
• The better known reacting agents are amine-based solutions which chemically bind gaseous CO2 in liquid droplets, which can then be extracted at the absorber sump. For this first column, an economic CO2 removal efficiency is seen at 90%. As chemical absorption is temperature dependent, heating the solution will result in CO2 desorption, which is done in a separate column designed to regenerate the washing solution with steam.
• Most amine-based scrubbing systems are designed to absorb CO2 at 30-45°C, as low temperatures will lead to high CO2 loading, i.e. high scrubbing efficiency and low amine needs. Temperatures needed for desorption are approximately 150°C, with heat usually being supplied by steam extraction from the combustion plant. Acid gas impurities like NOx and SO2 react with amines to form stable salts, which cannot be regenerated and therefore lead to higher solvent consumption.
• The general layout of the CO2 absorption unit and washing solution cycle is shown in Figure 15. The absorption column operating principles are similar to those of wet FGD spray columns.
Figure 15: Scheme of chemical CO2 absorption unit (CO2CRC, 2011)
• Instead of using amines, other reacting agents are currently developed and tested, such as carbonate-based solutions. These carbonates can absorb at higher and desorb at lower temperatures, i.e. would need less energy input as well as require less cooling. Testing of carbonate solutions is still at the laboratory and mini-pilot-plant scale.
Environmental benefits achieved • Removal of all acid gases and particulates to a minimum is required for effective and economic CO2 capture. Reduction of 90% CO2 is feasible, current pilot plants operate with average absorption rates of 75%. Higher removal rates imply higher scrubbing costs (solvent use, electricity consumption, pressure drop, unit size, etc.).
• PM and SO2 have to be reduced to far lower levels than currently required by European legislation and the future Industrial Emissions Directive. In terms of CO2 absorbing efficiency in amines, NOx does not seem to be as major an issue as SO2, though NOx and amines still form salts.
• Summary Emission Reduction Potential, compared to a BAT pulverized coal combustion plant:
- PM: close to zero emissions possible and required (< 3 mg/Nm³ required for economic rea-sons), which is lower than BAT pulverized coal combustion.
- SO2: Very low emissions possible and required (10-20 mg/Nm³ seems to be economically attractive), which is lower than for BAT pulverized coal combustion.
- NOx: No change is foreseen.
Applicability
• Current demonstration-scale chemical absorption techniques are implemented in existing plants. This technique is therefore seen as retrofittable, from a technical point of view.
• Plants would need to be “CCS-ready”, i.e. reach low SO2 and PM levels, as well as provide space, etc. for CO2 columns. For detailed issues on the definition “CCS-ready”, see discussion in the literature and current legislation in some areas within the UN-ECE.
• Techno-economic applicability needs to be proven first at LCPs with thermal inputs higher than 500 MWth.
• Economic operations require high levels of desulphurization and PM removal.
Cross-Media Effects
• Solvent emissions in flue gas may occur and represent an issue. Either amines directly or ammonia, as a product of amine decomposition, could be taken into consideration for environmental reasons. For instance, in Norway, public discussion on the health effect of amine emissions is currently occurring, as several aromatic amine complexes formed by degradation of MDEA and others are classified as carcinogenic substances (especially nitrosamines)13.
• Keeping power production at a constant level will lead to an increase in fossil fuel consumption of approximately 1/3.
• Net plant efficiency drop may be as high as 11-13 percentage points due to pressure drop, electricity and heat consumption. Heat consumption rates vary according to the exact type of CO2-amine com-plexes formed. Indirect emissions of NOx, SO2 and PM are likely to be significant due to reduced plant efficiency.
Operational Data
• Economic operations require high levels of desulphurization and PM removal.
• Stoichiometric ratios above 1.6-2 are currently used.
• The pressure drop of a unit reaches approximately 50-80 mbar.
• Currently, amine solutions contain mainly MEA or a MDEA/MEA mixture with a total amine concentration of roughly 30-40%.
Economics
• The assumed heat penalty of around 11-13% points equals an increase in electricity costs of more than 30%; US DOE expects up to 63%. Figures vary widely and sometimes reach levels of up to 91% (IPCC). Operating costs depend on optimum amine use, starting from injection and mixing issues and extending to exact composition (for stoichiometric ratio and regeneration energy needs).
• Investment is expected to be high.
(13) See for example: Research Project “CO2 and Amines Screening Study”, herein: Knudsen, S.; Karl, M. and Randall, S.: “Amine Emissions to Air During Carbon Capture”, NILU Report No. N-108068, 2009 or Stangeland, A. and Shao, R.: “Amines Used in CO2 Capture – Health and Environmental Impacts”, Bellona Foundation Report under the Zero Emissions Fossil Fuel Power Plants Programme, 2009.
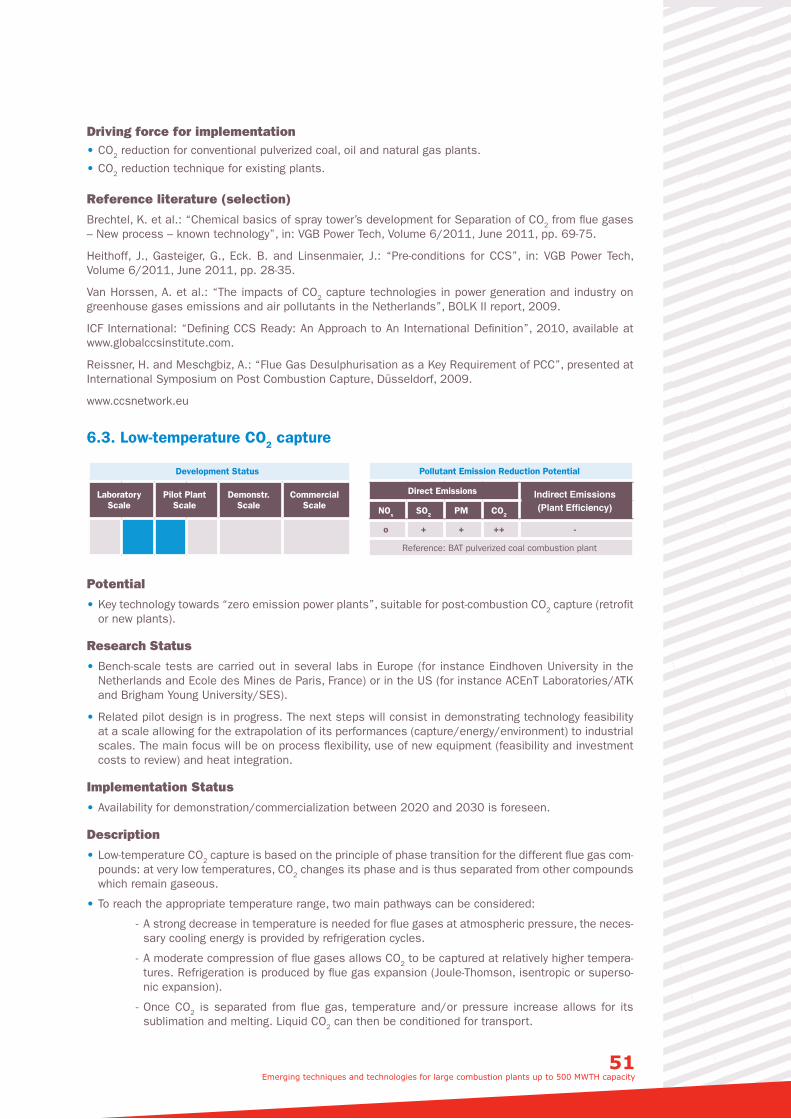
51 Emerging techniques and technologies for large combustion plants up to 500 MWTH capacity
Driving force for implementation • CO2 reduction for conventional pulverized coal, oil and natural gas plants.
• CO2 reduction technique for existing plants.
Reference literature (selection)
Brechtel, K. et al.: “Chemical basics of spray tower’s development for Separation of CO2 from flue gases – New process – known technology”, in: VGB Power Tech, Volume 6/2011, June 2011, pp. 69-75.
Heithoff, J., Gasteiger, G., Eck. B. and Linsenmaier, J.: “Pre-conditions for CCS”, in: VGB Power Tech, Volume 6/2011, June 2011, pp. 28-35.
Van Horssen, A. et al.: “The impacts of CO2 capture technologies in power generation and industry on greenhouse gases emissions and air pollutants in the Netherlands”, BOLK II report, 2009.
ICF International: “Defining CCS Ready: An Approach to An International Definition”, 2010, available at www.globalccsinstitute.com.
Reissner, H. and Meschgbiz, A.: “Flue Gas Desulphurisation as a Key Requirement of PCC”, presented at International Symposium on Post Combustion Capture, Düsseldorf, 2009.
www.ccsnetwork.eu
6.3. Low-temperature CO2 capture
Development Status
Laboratory Scale
Pilot Plant Scale
Demonstr. Scale
Commercial Scale
Pollutant Emission Reduction Potential
Direct Emissions Indirect Emissions (Plant Efficiency)NOx SO2 PM CO2
o + + ++ -
Reference: BAT pulverized coal combustion plant
Potential
• Key technology towards “zero emission power plants”, suitable for post-combustion CO2 capture (retrofit or new plants).
Research Status
• Bench-scale tests are carried out in several labs in Europe (for instance Eindhoven University in the Netherlands and Ecole des Mines de Paris, France) or in the US (for instance ACEnT Laboratories/ATK and Brigham Young University/SES).
• Related pilot design is in progress. The next steps will consist in demonstrating technology feasibility at a scale allowing for the extrapolation of its performances (capture/energy/environment) to industrial scales. The main focus will be on process flexibility, use of new equipment (feasibility and investment costs to review) and heat integration.
Implementation Status
• Availability for demonstration/commercialization between 2020 and 2030 is foreseen.
Description
• Low-temperature CO2 capture is based on the principle of phase transition for the different flue gas com-pounds: at very low temperatures, CO2 changes its phase and is thus separated from other compounds which remain gaseous.
• To reach the appropriate temperature range, two main pathways can be considered:
- A strong decrease in temperature is needed for flue gases at atmospheric pressure, the neces-sary cooling energy is provided by refrigeration cycles.
- A moderate compression of flue gases allows CO2 to be captured at relatively higher tempera-tures. Refrigeration is produced by flue gas expansion (Joule-Thomson, isentropic or superso-nic expansion).
- Once CO2 is separated from flue gas, temperature and/or pressure increase allows for its sublimation and melting. Liquid CO2 can then be conditioned for transport.
Environmental benefits achieved
• Low-temperature CO2 capture relies on mechanical cycles; it does not require the use of chemicals (or only small amounts in some cases) and produces no waste. Therefore the risks of unmanaged and costly leakages and of unexpected emissions in treated flue gases are very limited.
• CO2 capture rates above 99% may be achieved without significant increase in energy consumption. Furthermore, high-purity CO2 is obtained.
• Summary Emission Reduction Potential, compared to BAT pulverized coal combustion:
- PM: very low emissions
- SO2: very low emissions
- NOx: No direct effect.
Applicability
• This technique is considered to be applicable to both existing and new plants.
• The commercial-scale plant is not foreseen before 2020.
• Since only electricity is needed, low-temperature CO2 capture technology operations are nearly inde-pendent of the power plant itself, i.e. retrofits are very likely to be technically possible at most plants.
Cross-Media Effects
• No information could be obtained.
Operational Data
• Very limited energy penalty is reported for low-temperature capture. Energy consumption is only due to refrigeration cycles and possible moderate flue gas compression; depending on the technologies, 0.5 to 1.4 GJel/t captured CO2 are reported. The potential for optimization prospects and heat integration enhancement is still significant.
• Low-temperature capture technologies rely on physical processes, which are familiar to plant operators.
• Such technology can be seen as an integrated solution.
Economics
• Increase in levelized cost of electricity may be as low as 35% according to technology developers.
Driving force for implementation
• CO2 reduction for existing and new coal plants.
Reference literature
ZEP Recommendations for Research to Support the Deployment of CCS in Europe Beyond 2020, available at http://www.zeroemissionsplatform.eu/downloads/487.html.
Tuinier, M.J.; van Sint Annaland, M.; Kramer, G.J. and Kuipers, J.A.M.: “Cryogenic CO2 Capture Using Dynamically Operated Packed Beds”, in: Chemical Engineering Science, Volume 65, Issue 1 (2010), pp. 114-119.
Clodic, D et al: “CO2 Capture by Anti-Sublimation - Thermo-Economic Process Evaluation”, presented at the 4th Annual Conference on Carbon & Sequestration, 2–5 May 2005, USA.
Balepin, V. and Castrogiovanni, A.: “A high Efficiency Inertial CO2 Extraction System”, available at http://arpa-e.energy.gov/LinkClick.aspx?fileticket=85IQlGTruiQ%3d&tabid=277.
N.n.: “Cryogenic Carbon Capture Technology”, in: Carbon Capture Journal, July/August 2009, available at http://www.sustainablees.com/CCCtechpage.html.
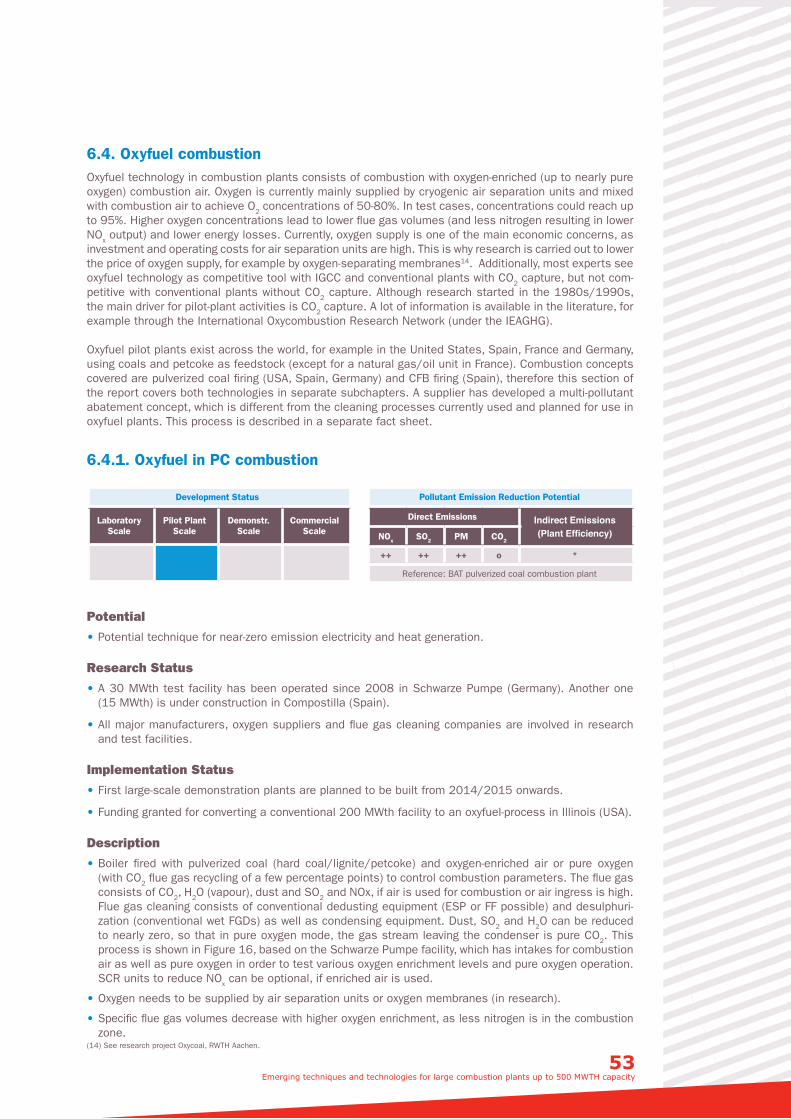
53 Emerging techniques and technologies for large combustion plants up to 500 MWTH capacity
6.4. Oxyfuel combustionOxyfuel technology in combustion plants consists of combustion with oxygen-enriched (up to nearly pure oxygen) combustion air. Oxygen is currently mainly supplied by cryogenic air separation units and mixed with combustion air to achieve O2 concentrations of 50-80%. In test cases, concentrations could reach up to 95%. Higher oxygen concentrations lead to lower flue gas volumes (and less nitrogen resulting in lower NOx output) and lower energy losses. Currently, oxygen supply is one of the main economic concerns, as investment and operating costs for air separation units are high. This is why research is carried out to lower the price of oxygen supply, for example by oxygen-separating membranes14. Additionally, most experts see oxyfuel technology as competitive tool with IGCC and conventional plants with CO2 capture, but not com-petitive with conventional plants without CO2 capture. Although research started in the 1980s/1990s, the main driver for pilot-plant activities is CO2 capture. A lot of information is available in the literature, for example through the International Oxycombustion Research Network (under the IEAGHG).
Oxyfuel pilot plants exist across the world, for example in the United States, Spain, France and Germany, using coals and petcoke as feedstock (except for a natural gas/oil unit in France). Combustion concepts covered are pulverized coal firing (USA, Spain, Germany) and CFB firing (Spain), therefore this section of the report covers both technologies in separate subchapters. A supplier has developed a multi-pollutant abatement concept, which is different from the cleaning processes currently used and planned for use in oxyfuel plants. This process is described in a separate fact sheet.
6.4.1. Oxyfuel in PC combustion
Development Status
Laboratory Scale
Pilot Plant Scale
Demonstr. Scale
Commercial Scale
Pollutant Emission Reduction Potential
Direct Emissions Indirect Emissions (Plant Efficiency)NOx SO2 PM CO2
++ ++ ++ o *
Reference: BAT pulverized coal combustion plant
Potential
• Potential technique for near-zero emission electricity and heat generation.
Research Status
• A 30 MWth test facility has been operated since 2008 in Schwarze Pumpe (Germany). Another one (15 MWth) is under construction in Compostilla (Spain).
• All major manufacturers, oxygen suppliers and flue gas cleaning companies are involved in research and test facilities.
Implementation Status
• First large-scale demonstration plants are planned to be built from 2014/2015 onwards.
• Funding granted for converting a conventional 200 MWth facility to an oxyfuel-process in Illinois (USA).
Description
• Boiler fired with pulverized coal (hard coal/lignite/petcoke) and oxygen-enriched air or pure oxygen (with CO2 flue gas recycling of a few percentage points) to control combustion parameters. The flue gas consists of CO2, H2O (vapour), dust and SO2 and NOx, if air is used for combustion or air ingress is high. Flue gas cleaning consists of conventional dedusting equipment (ESP or FF possible) and desulphuri-zation (conventional wet FGDs) as well as condensing equipment. Dust, SO2 and H2O can be reduced to nearly zero, so that in pure oxygen mode, the gas stream leaving the condenser is pure CO2. This process is shown in Figure 16, based on the Schwarze Pumpe facility, which has intakes for combustion air as well as pure oxygen in order to test various oxygen enrichment levels and pure oxygen operation. SCR units to reduce NOx can be optional, if enriched air is used.
• Oxygen needs to be supplied by air separation units or oxygen membranes (in research).
• Specific flue gas volumes decrease with higher oxygen enrichment, as less nitrogen is in the combustion zone.
(14) See research project Oxycoal, RWTH Aachen.
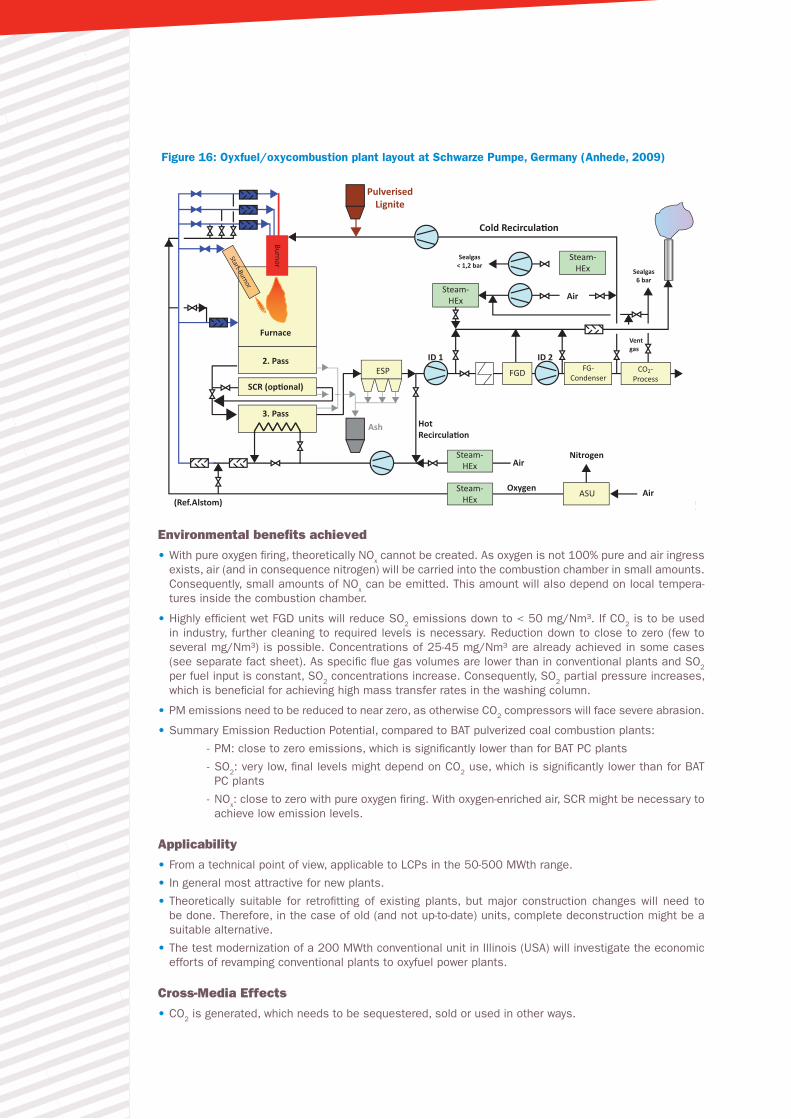
Figure 16: Oyxfuel/oxycombustion plant layout at Schwarze Pumpe, Germany (Anhede, 2009)
Cold Recircula�on
Sealgas6 bar
Sealgas< 1,2 bar
Ventgas
Air
Air
Air
ID 1 ID 2
Nitrogen
Oxygen
HotRecircula�on
(Ref.Alstom)ASU
Steam-HEx
Steam-HEx
Steam-HEx
Steam-HEx
ESP FGD FG-Condenser
CO2-Process
Furnace
2. Pass
3. Pass
SCR (op�onal)
Burnor
Start-Burnor
PulverisedLignite
!
Ash
Schéma page 69
Environmental benefits achieved
• With pure oxygen firing, theoretically NOx cannot be created. As oxygen is not 100% pure and air ingress exists, air (and in consequence nitrogen) will be carried into the combustion chamber in small amounts. Consequently, small amounts of NOx can be emitted. This amount will also depend on local tempera-tures inside the combustion chamber.
• Highly efficient wet FGD units will reduce SO2 emissions down to < 50 mg/Nm³. If CO2 is to be used in industry, further cleaning to required levels is necessary. Reduction down to close to zero (few to several mg/Nm³) is possible. Concentrations of 25-45 mg/Nm³ are already achieved in some cases (see separate fact sheet). As specific flue gas volumes are lower than in conventional plants and SO2 per fuel input is constant, SO2 concentrations increase. Consequently, SO2 partial pressure increases, which is beneficial for achieving high mass transfer rates in the washing column.
• PM emissions need to be reduced to near zero, as otherwise CO2 compressors will face severe abrasion.
• Summary Emission Reduction Potential, compared to BAT pulverized coal combustion plants:
- PM: close to zero emissions, which is significantly lower than for BAT PC plants
- SO2: very low, final levels might depend on CO2 use, which is significantly lower than for BAT PC plants
- NOx: close to zero with pure oxygen firing. With oxygen-enriched air, SCR might be necessary to achieve low emission levels.
Applicability
• From a technical point of view, applicable to LCPs in the 50-500 MWth range.
• In general most attractive for new plants.
• Theoretically suitable for retrofitting of existing plants, but major construction changes will need to be done. Therefore, in the case of old (and not up-to-date) units, complete deconstruction might be a suitable alternative.
• The test modernization of a 200 MWth conventional unit in Illinois (USA) will investigate the economic efforts of revamping conventional plants to oxyfuel power plants.
Cross-Media Effects
• CO2 is generated, which needs to be sequestered, sold or used in other ways.
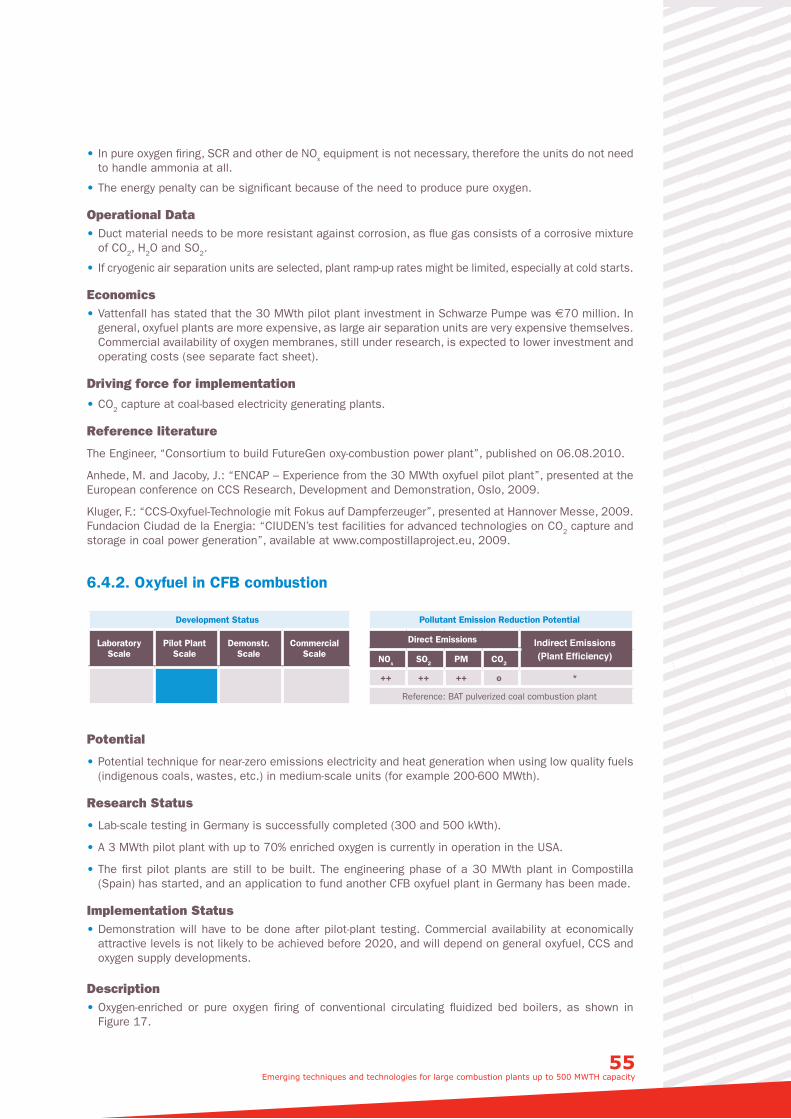
55 Emerging techniques and technologies for large combustion plants up to 500 MWTH capacity
• In pure oxygen firing, SCR and other de NOx equipment is not necessary, therefore the units do not need to handle ammonia at all.
• The energy penalty can be significant because of the need to produce pure oxygen.
Operational Data • Duct material needs to be more resistant against corrosion, as flue gas consists of a corrosive mixture of CO2, H2O and SO2.
• If cryogenic air separation units are selected, plant ramp-up rates might be limited, especially at cold starts.
Economics • Vattenfall has stated that the 30 MWth pilot plant investment in Schwarze Pumpe was €70 million. In general, oxyfuel plants are more expensive, as large air separation units are very expensive themselves. Commercial availability of oxygen membranes, still under research, is expected to lower investment and operating costs (see separate fact sheet).
Driving force for implementation
• CO2 capture at coal-based electricity generating plants.
Reference literature
The Engineer, “Consortium to build FutureGen oxy-combustion power plant”, published on 06.08.2010.
Anhede, M. and Jacoby, J.: “ENCAP – Experience from the 30 MWth oxyfuel pilot plant”, presented at the European conference on CCS Research, Development and Demonstration, Oslo, 2009.
Kluger, F.: “CCS-Oxyfuel-Technologie mit Fokus auf Dampferzeuger”, presented at Hannover Messe, 2009.Fundacion Ciudad de la Energia: “CIUDEN’s test facilities for advanced technologies on CO2 capture and storage in coal power generation”, available at www.compostillaproject.eu, 2009.
6.4.2. Oxyfuel in CFB combustion
Development Status
Laboratory Scale
Pilot Plant Scale
Demonstr. Scale
Commercial Scale
Pollutant Emission Reduction Potential
Direct Emissions Indirect Emissions (Plant Efficiency)NOx SO2 PM CO2
++ ++ ++ o *
Reference: BAT pulverized coal combustion plant
Potential
• Potential technique for near-zero emissions electricity and heat generation when using low quality fuels (indigenous coals, wastes, etc.) in medium-scale units (for example 200-600 MWth).
Research Status
• Lab-scale testing in Germany is successfully completed (300 and 500 kWth).
• A 3 MWth pilot plant with up to 70% enriched oxygen is currently in operation in the USA.
• The first pilot plants are still to be built. The engineering phase of a 30 MWth plant in Compostilla (Spain) has started, and an application to fund another CFB oxyfuel plant in Germany has been made.
Implementation Status • Demonstration will have to be done after pilot-plant testing. Commercial availability at economically attractive levels is not likely to be achieved before 2020, and will depend on general oxyfuel, CCS and oxygen supply developments.
Description • Oxygen-enriched or pure oxygen firing of conventional circulating fluidized bed boilers, as shown in Figure 17.
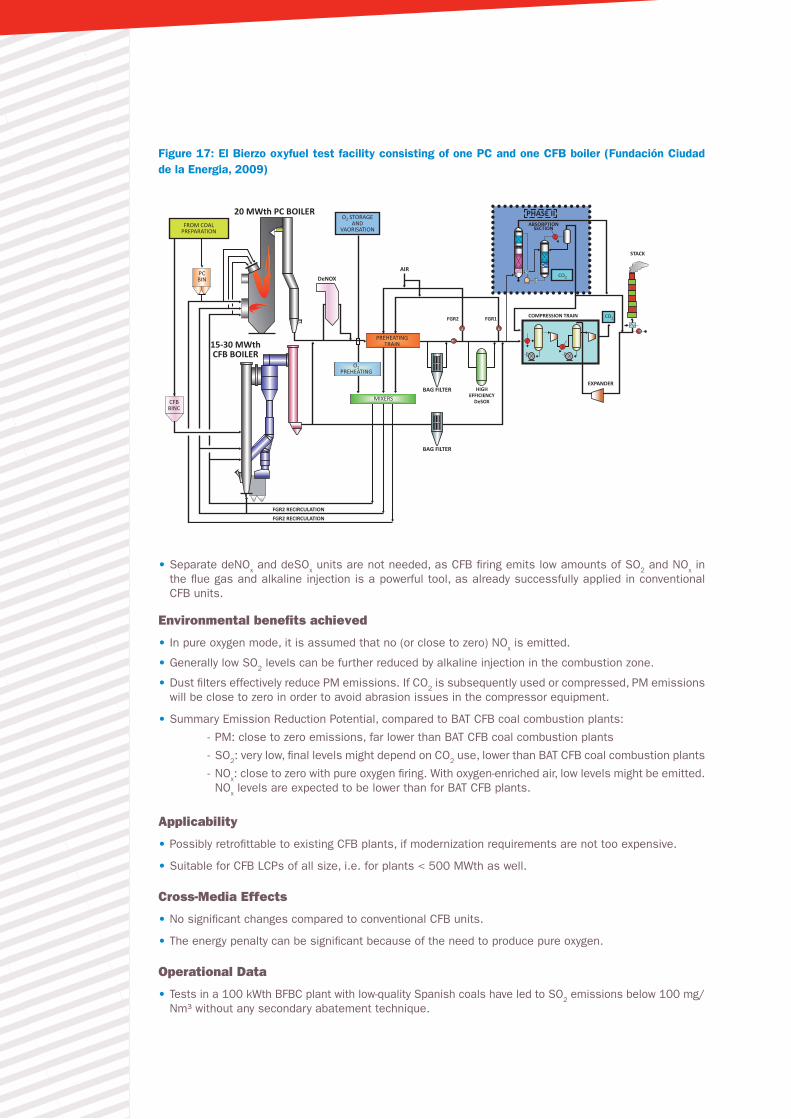
Figure 17: El Bierzo oxyfuel test facility consisting of one PC and one CFB boiler (Fundación Ciudad de la Energia, 2009)
ABSORPTIONSECTION
COMPRESSION TRAINFGR1 FGR2
HIGHEFFICIENCY
DeSOX
BAG FILTER
BAG FILTER
AIRDeNOX
FGR2 RECIRCULATIONFGR2 RECIRCULATION
EXPANDER
STACK
PHASE IIO2 STORAGEAND
VAORISATION
PREHEATINGTRAIN
O2PREHEATING
MIXERSCFBBINC
PCBIN
FROM COALPREPARATION
15-30 MWthCFB BOILER
20 MWth PC BOILER
CO2
CO2
Schéma page 72
• Separate deNOx and deSOx units are not needed, as CFB firing emits low amounts of SO2 and NOx in the flue gas and alkaline injection is a powerful tool, as already successfully applied in conventional CFB units.
Environmental benefits achieved
• In pure oxygen mode, it is assumed that no (or close to zero) NOx is emitted.
• Generally low SO2 levels can be further reduced by alkaline injection in the combustion zone.
• Dust filters effectively reduce PM emissions. If CO2 is subsequently used or compressed, PM emissions will be close to zero in order to avoid abrasion issues in the compressor equipment.
• Summary Emission Reduction Potential, compared to BAT CFB coal combustion plants:
- PM: close to zero emissions, far lower than BAT CFB coal combustion plants
- SO2: very low, final levels might depend on CO2 use, lower than BAT CFB coal combustion plants
- NOx: close to zero with pure oxygen firing. With oxygen-enriched air, low levels might be emitted. NOx levels are expected to be lower than for BAT CFB plants.
Applicability
• Possibly retrofittable to existing CFB plants, if modernization requirements are not too expensive.
• Suitable for CFB LCPs of all size, i.e. for plants < 500 MWth as well.
Cross-Media Effects
• No significant changes compared to conventional CFB units.
• The energy penalty can be significant because of the need to produce pure oxygen.
Operational Data
• Tests in a 100 kWth BFBC plant with low-quality Spanish coals have led to SO2 emissions below 100 mg/Nm³ without any secondary abatement technique.
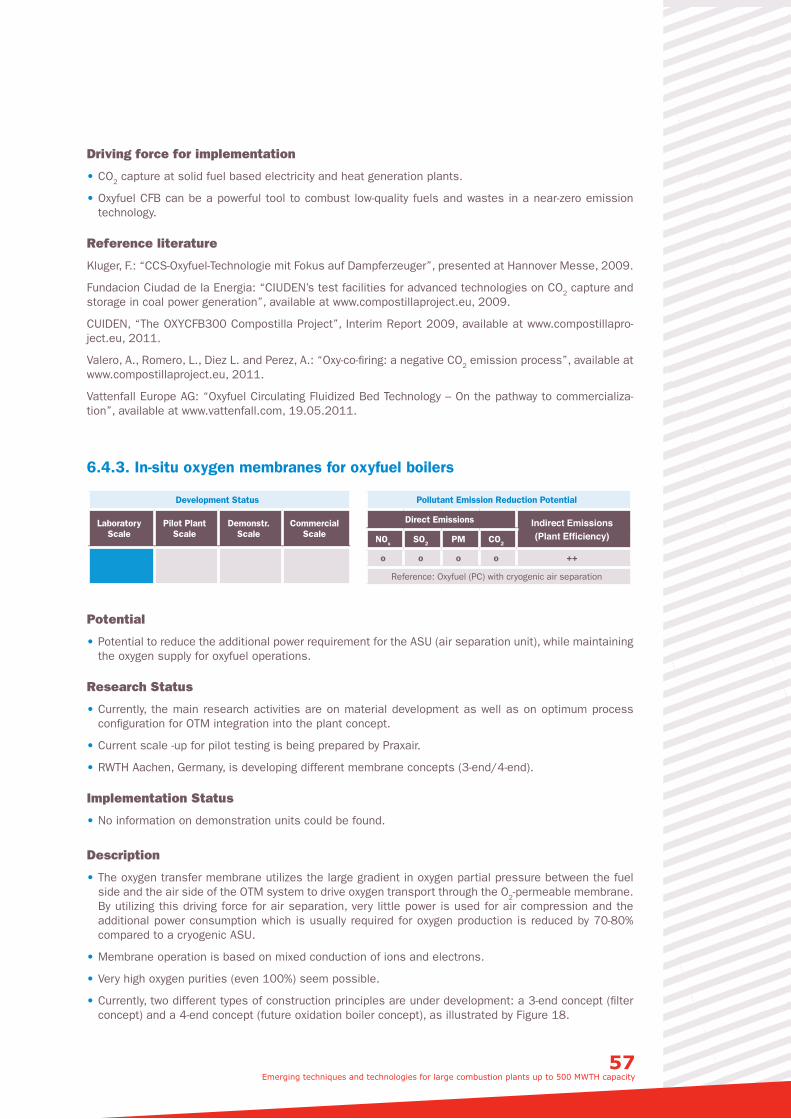
57 Emerging techniques and technologies for large combustion plants up to 500 MWTH capacity
Driving force for implementation
• CO2 capture at solid fuel based electricity and heat generation plants.
• Oxyfuel CFB can be a powerful tool to combust low-quality fuels and wastes in a near-zero emission technology.
Reference literature
Kluger, F.: “CCS-Oxyfuel-Technologie mit Fokus auf Dampferzeuger”, presented at Hannover Messe, 2009.
Fundacion Ciudad de la Energia: “CIUDEN’s test facilities for advanced technologies on CO2 capture and storage in coal power generation”, available at www.compostillaproject.eu, 2009.
CUIDEN, “The OXYCFB300 Compostilla Project”, Interim Report 2009, available at www.compostillapro-ject.eu, 2011.
Valero, A., Romero, L., Diez L. and Perez, A.: “Oxy-co-firing: a negative CO2 emission process”, available at www.compostillaproject.eu, 2011.
Vattenfall Europe AG: “Oxyfuel Circulating Fluidized Bed Technology – On the pathway to commercializa-tion”, available at www.vattenfall.com, 19.05.2011.
6.4.3. In-situ oxygen membranes for oxyfuel boilers
Development Status
Laboratory Scale
Pilot Plant Scale
Demonstr. Scale
Commercial Scale
Pollutant Emission Reduction Potential
Direct Emissions Indirect Emissions (Plant Efficiency)NOx SO2 PM CO2
o o o o ++
Reference: Oxyfuel (PC) with cryogenic air separation
Potential
• Potential to reduce the additional power requirement for the ASU (air separation unit), while maintaining the oxygen supply for oxyfuel operations.
Research Status
• Currently, the main research activities are on material development as well as on optimum process configuration for OTM integration into the plant concept.
• Current scale -up for pilot testing is being prepared by Praxair.
• RWTH Aachen, Germany, is developing different membrane concepts (3-end/4-end).
Implementation Status
• No information on demonstration units could be found.
Description
• The oxygen transfer membrane utilizes the large gradient in oxygen partial pressure between the fuel side and the air side of the OTM system to drive oxygen transport through the O2-permeable membrane. By utilizing this driving force for air separation, very little power is used for air compression and the additional power consumption which is usually required for oxygen production is reduced by 70-80% compared to a cryogenic ASU.
• Membrane operation is based on mixed conduction of ions and electrons.
• Very high oxygen purities (even 100%) seem possible.
• Currently, two different types of construction principles are under development: a 3-end concept (filter concept) and a 4-end concept (future oxidation boiler concept), as illustrated by Figure 18.
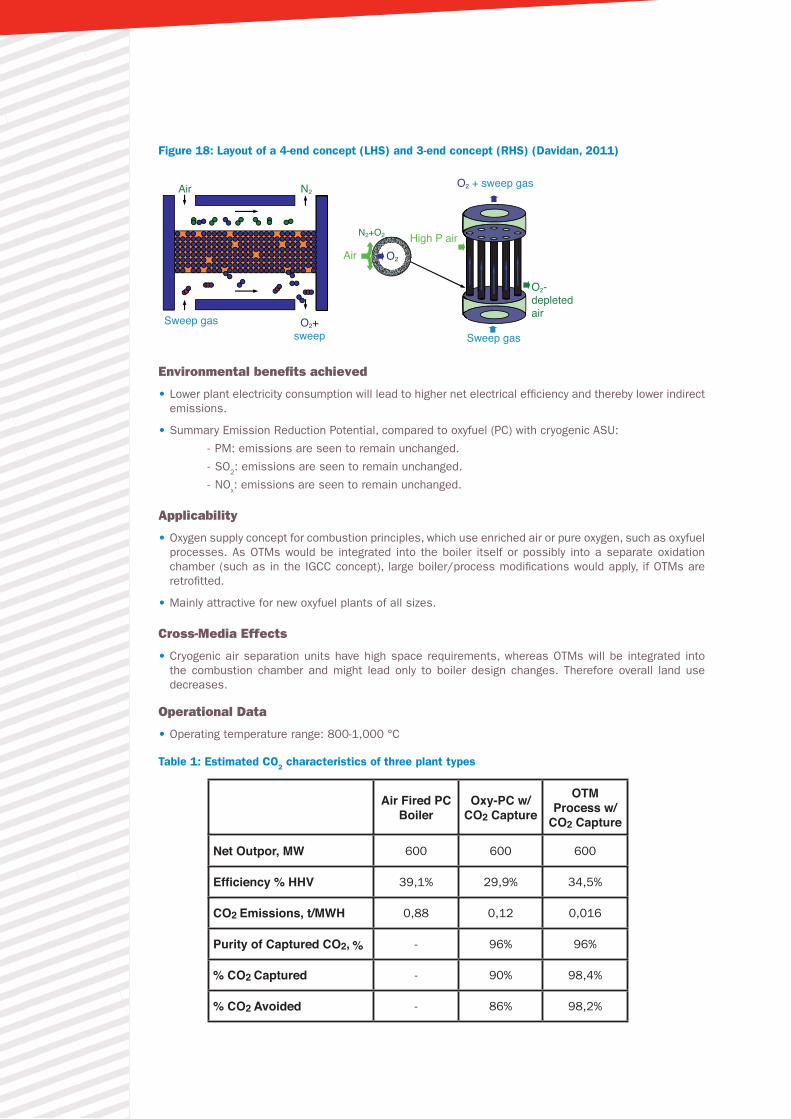
Figure 18: Layout of a 4-end concept (LHS) and 3-end concept (RHS) (Davidan, 2011)
Air
AirHigh P air
N2
N2+O2
Sweep gasSweep gas
O2 + sweep gas
O2-depletedair
O2+sweep
!
O2
Environmental benefits achieved
• Lower plant electricity consumption will lead to higher net electrical efficiency and thereby lower indirect emissions.
• Summary Emission Reduction Potential, compared to oxyfuel (PC) with cryogenic ASU:
- PM: emissions are seen to remain unchanged.
- SO2: emissions are seen to remain unchanged.
- NOx: emissions are seen to remain unchanged.
Applicability
• Oxygen supply concept for combustion principles, which use enriched air or pure oxygen, such as oxyfuel processes. As OTMs would be integrated into the boiler itself or possibly into a separate oxidation chamber (such as in the IGCC concept), large boiler/process modifications would apply, if OTMs are retrofitted.
• Mainly attractive for new oxyfuel plants of all sizes.
Cross-Media Effects
• Cryogenic air separation units have high space requirements, whereas OTMs will be integrated into the combustion chamber and might lead only to boiler design changes. Therefore overall land use decreases.
Operational Data
• Operating temperature range: 800-1,000 °C
Table 1: Estimated CO2 characteristics of three plant types
Air Fired PCBoiler
Oxy-PC w/CO2 Capture
OTMProcess w/
CO2 Capture
Net Outpor, MW 600 600 600
Efficiency % HHV 39,1% 29,9% 34,5%
CO2 Emissions, t/MWH 0,88 0,12 0,016
Purity of Captured CO2, % - 96% 96%
% CO2 Captured - 90% 98,4%
% CO2 Avoided - 86% 98,2%
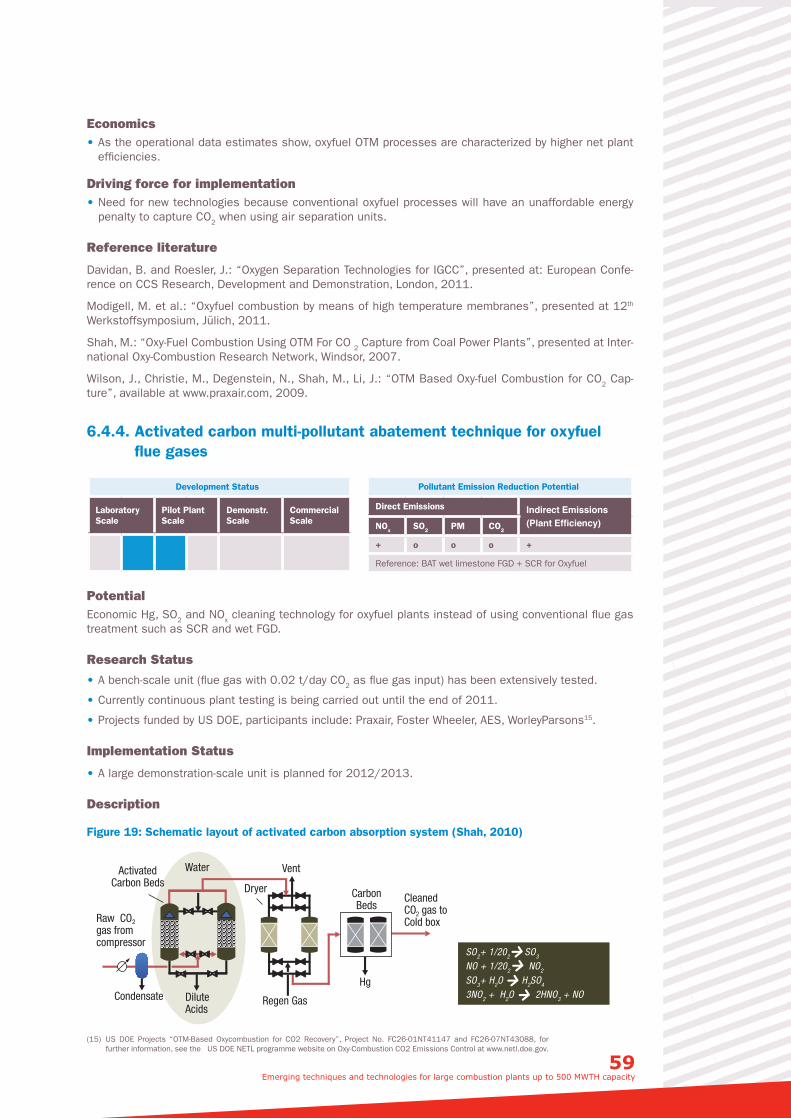
59 Emerging techniques and technologies for large combustion plants up to 500 MWTH capacity
Economics • As the operational data estimates show, oxyfuel OTM processes are characterized by higher net plant efficiencies.
Driving force for implementation • Need for new technologies because conventional oxyfuel processes will have an unaffordable energy penalty to capture CO2 when using air separation units.
Reference literature
Davidan, B. and Roesler, J.: “Oxygen Separation Technologies for IGCC”, presented at: European Confe-rence on CCS Research, Development and Demonstration, London, 2011.
Modigell, M. et al.: “Oxyfuel combustion by means of high temperature membranes”, presented at 12th
Werkstoffsymposium, Jülich, 2011.
Shah, M.: “Oxy-Fuel Combustion Using OTM For CO 2 Capture from Coal Power Plants”, presented at Inter-national Oxy-Combustion Research Network, Windsor, 2007.
Wilson, J., Christie, M., Degenstein, N., Shah, M., Li, J.: “OTM Based Oxy-fuel Combustion for CO2 Cap-ture”, available at www.praxair.com, 2009.
6.4.4. Activated carbon multi-pollutant abatement technique for oxyfuel flue gases
Development Status
Laboratory Scale
Pilot Plant Scale
Demonstr. Scale
Commercial Scale
Pollutant Emission Reduction Potential
Direct Emissions Indirect Emissions (Plant Efficiency)NOx SO2 PM CO2
+ o o o +
Reference: BAT wet limestone FGD + SCR for Oxyfuel
PotentialEconomic Hg, SO2 and NOx cleaning technology for oxyfuel plants instead of using conventional flue gas treatment such as SCR and wet FGD.
Research Status
• A bench-scale unit (flue gas with 0.02 t/day CO2 as flue gas input) has been extensively tested.
• Currently continuous plant testing is being carried out until the end of 2011.
• Projects funded by US DOE, participants include: Praxair, Foster Wheeler, AES, WorleyParsons15.
Implementation Status
• A large demonstration-scale unit is planned for 2012/2013.
Description
Figure 19: Schematic layout of activated carbon absorption system (Shah, 2010)
Water
Hg
Dryer
Vent
Regen GasDiluteAcids
Raw CO gas fromcompressor
CarbonBeds
CleanedCO gas toCold box
ActivatedCarbon Beds
22
SO2+ 1/202 SO3
NO + 1/202 NO2
SO3+ H2O H2SO4
3NO2 + H2O 2HNO3 + NOCondensate
(15) US DOE Projects “OTM-Based Oxycombustion for CO2 Recovery”, Project No. FC26-01NT41147 and FC26-07NT43088, for further information, see the US DOE NETL programme website on Oxy-Combustion CO2 Emissions Control at www.netl.doe.gov.
• Activated carbon beds are used for adsorbing and oxidizing adsorbed SO2 and NO to generate SO3
and NO2. Parallel reactors are needed, as regeneration is done by water washing and bed drying when bed adsorption performance decreases. Carbon beds are used for mercury removal. Product gas is a flue gas containing low SO2, low NOx and enriched CO2, which is fed into a cold box for CO2 separation. Vent gases are split up into off gas and recycle gas. Overall CO2 reduction will depend on air ingress (otherwise N2 concentration would increase in the recycling loop), 95% (10% air ingress) to >99% (2% air ingress) CO2 capture can be achieved.
• The process needs only H2O as a washing solution and oxygen as an oxidant, which can be supplied by the oxyfuel air separation unit. As NOx amounts are small compared to combustion oxygen needs, the additional air separation unit size can be very small. The process operates at close to room tempera-ture (< 100°C) and under pressure (25-35 bar). Heat losses are small, but energy is required for com-pression (usually from atmospheric pressure flue gas). A pressurized oxyfuel combustion would reduce energy needed for compression and would lead to additional plant energy consumption.
Environmental benefits achieved
• Mercury removal.
• Simultaneous SO2 and NOx removal to a very high extent (shown in tests > 96% NOx and > 99% SO2).
• Product gas is CO2 in a purity ready for compression and storage.
• Summary Emission Reduction Potential, compared to BAT wet limestone FGD + SCR for oxyfuel:
- PM: emissions are seen to remain unchanged
- SO2: emissions are seen to remain unchanged
- NOx: emissions are seen to be lower.
Applicability
• Suitable for oxyfuel plants of all sizes as an alternative to conventional flue gas cleaning.
Cross-Media Effects
• Dilute acids may be purified to be saleable as sulphuric acid and nitric acid products.
Operational Data
• Overall power plant efficiency drop is approximately 10%.
• Very high NOx removal rates compared to SCR.
• High SO2 removal rates, probably comparable to high-efficiency oxyfuel wet limestone FGD scrubbing.
• > 90% Hg removal in tests.
Economics
• Project team claims that CO2 capture costs are USD1-3 lower than in conventional oxyfuel CO2 purifica-tion processes.
• Project team claims capital cost advantages compared to conventional process.
Driving force for implementation
• Economic alternative to conventional gas cleaning in oxyfuel plants.
• CO2 capture at solid fuel based electricity and heat generation.
Reference literatureShah, M. et al.: “Near Zero Emissions Oxy-combustion Flue Gas Purification”, presented at 2010 NETL CO2 Capture Technology Meeting, Pittsburgh, 2010.
61 Emerging techniques and technologies for large combustion plants up to 500 MWTH capacity
7. Pollutant Reduction through High-Efficiency Technologies
In this chapter, two emerging technologies are described. These technologies would not have significant direct impacts on air emissions (NOx, SO2, PM and CO2). However, the EmTech50-500 group decided to assess them and to incorporate them into this report as they are likely to afford major improvements in terms of energy efficiency before 2020. Therefore, the following two emerging technologies would allow for a decrease in emissions per unit of energy produced.
7.1. New generation of large-scale natural gas turbines
Development Status
Laboratory Scale
Pilot Plant Scale
Demonstr. Scale
Commercial Scale
Pollutant Emission Reduction Potential
Direct Emissions Indirect Emissions (Plant Efficiency)NOx SO2 PM CO2
n/a o o o +
Reference: BAT gas turbines
Potential
• High-efficiency gas turbines are seen as a key step towards a highly efficient use of gaseous fuels for combined cycle power generation plants. With the help of high-efficiency gas turbines, combined cycle units can achieve electrical efficiencies of more than 60%.
Research Status
• The main research on high-efficiency gas turbines is focused on general operating conditions (reducing efficiency losses) and materials issues (enhancing resistance to temperature and pressure), as an ongoing development of existing products.
Implementation Status
• Siemens has been testing its 340 MWel 50 Hz H-class turbine since 2008 in block 4 of Irsching (Ger-many). This combined cycle unit (578 MWel) has reached an efficiency of 60.75%. Commercial opera-tions started in 2011.
• General Electric has started its H-system with approximately 60% net electrical efficiency in a cogene-ration unit at a first commercial unit in Tokyo (Japan) in 2008. Both 50 Hz and 60 Hz types have been developed.
• Mitsubishi plans to release its 60 Hz “J-series” product in 2011. This product is claimed to reach effi-ciencies higher than 60% net electrical efficiency in combined cycles.
• Alstom’s next-generation KA26 turbines for combined cycle plants (> 500 MWel) have been tested since 2008 and are in full plant tests in 2011. This turbine generation covers both single and multi-shaft devices, with a future electrical efficiency potential higher than 61% (in combined cycle).
Description
Figure 20 shows a scheme of such a high-efficiency gas turbine with its main features. Such turbine gene-ration differs from previous ones by the type of turbine cooling, as it uses air (and not steam) cooling. The determinants for improved efficiency operations are the following: fuel premixing and injection, combus-tion temperature (materials issues) and low losses through leakage minimization.
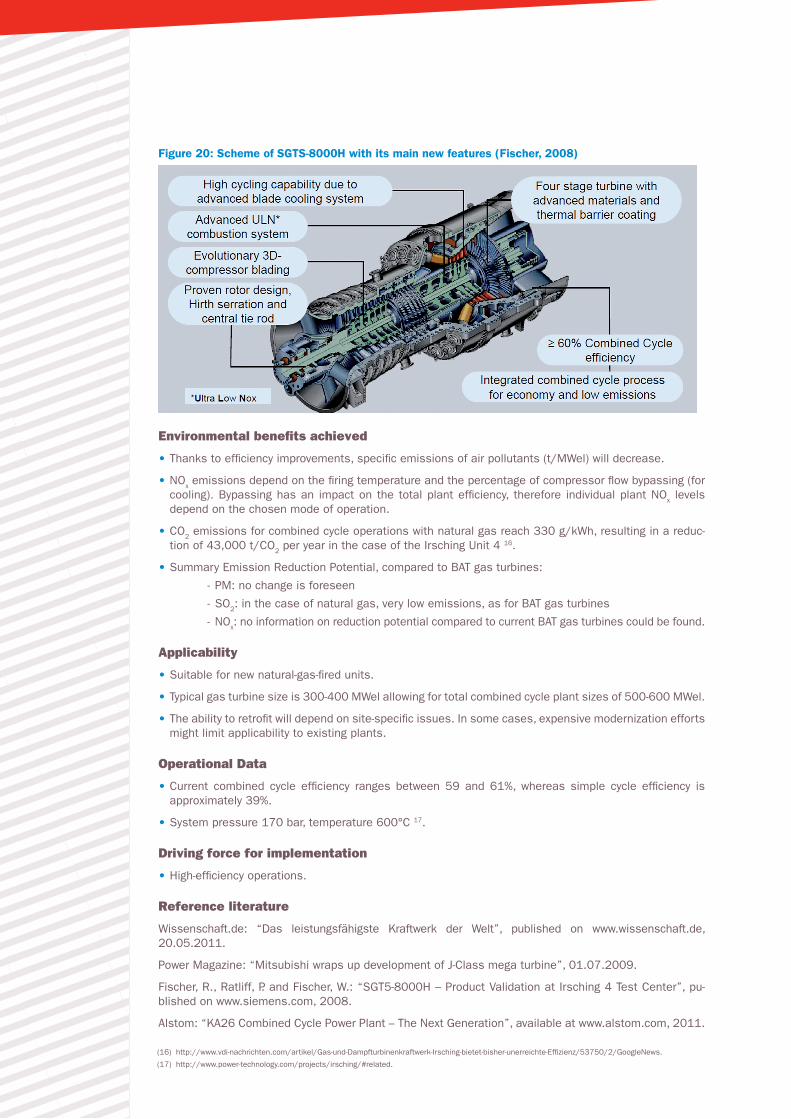
Figure 20: Scheme of SGTS-8000H with its main new features (Fischer, 2008)
Environmental benefits achieved
• Thanks to efficiency improvements, specific emissions of air pollutants (t/MWel) will decrease.
• NOx emissions depend on the firing temperature and the percentage of compressor flow bypassing (for cooling). Bypassing has an impact on the total plant efficiency, therefore individual plant NOx levels depend on the chosen mode of operation.
• CO2 emissions for combined cycle operations with natural gas reach 330 g/kWh, resulting in a reduc-tion of 43,000 t/CO2 per year in the case of the Irsching Unit 4 16.
• Summary Emission Reduction Potential, compared to BAT gas turbines:
- PM: no change is foreseen
- SO2: in the case of natural gas, very low emissions, as for BAT gas turbines
- NOx: no information on reduction potential compared to current BAT gas turbines could be found.
Applicability
• Suitable for new natural-gas-fired units.
• Typical gas turbine size is 300-400 MWel allowing for total combined cycle plant sizes of 500-600 MWel.
• The ability to retrofit will depend on site-specific issues. In some cases, expensive modernization efforts might limit applicability to existing plants.
Operational Data
• Current combined cycle efficiency ranges between 59 and 61%, whereas simple cycle efficiency is approximately 39%.
• System pressure 170 bar, temperature 600°C 17.
Driving force for implementation
• High-efficiency operations.
Reference literature
Wissenschaft.de: “Das leistungsfähigste Kraftwerk der Welt”, published on www.wissenschaft.de, 20.05.2011.
Power Magazine: “Mitsubishi wraps up development of J-Class mega turbine”, 01.07.2009.
Fischer, R., Ratliff, P. and Fischer, W.: “SGT5-8000H – Product Validation at Irsching 4 Test Center”, pu-blished on www.siemens.com, 2008.
Alstom: “KA26 Combined Cycle Power Plant – The Next Generation”, available at www.alstom.com, 2011.
(17) http://www.power-technology.com/projects/irsching/#related.
(16) http://www.vdi-nachrichten.com/artikel/Gas-und-Dampfturbinenkraftwerk-Irsching-bietet-bisher-unerreichte-Effizienz/53750/2/GoogleNews.
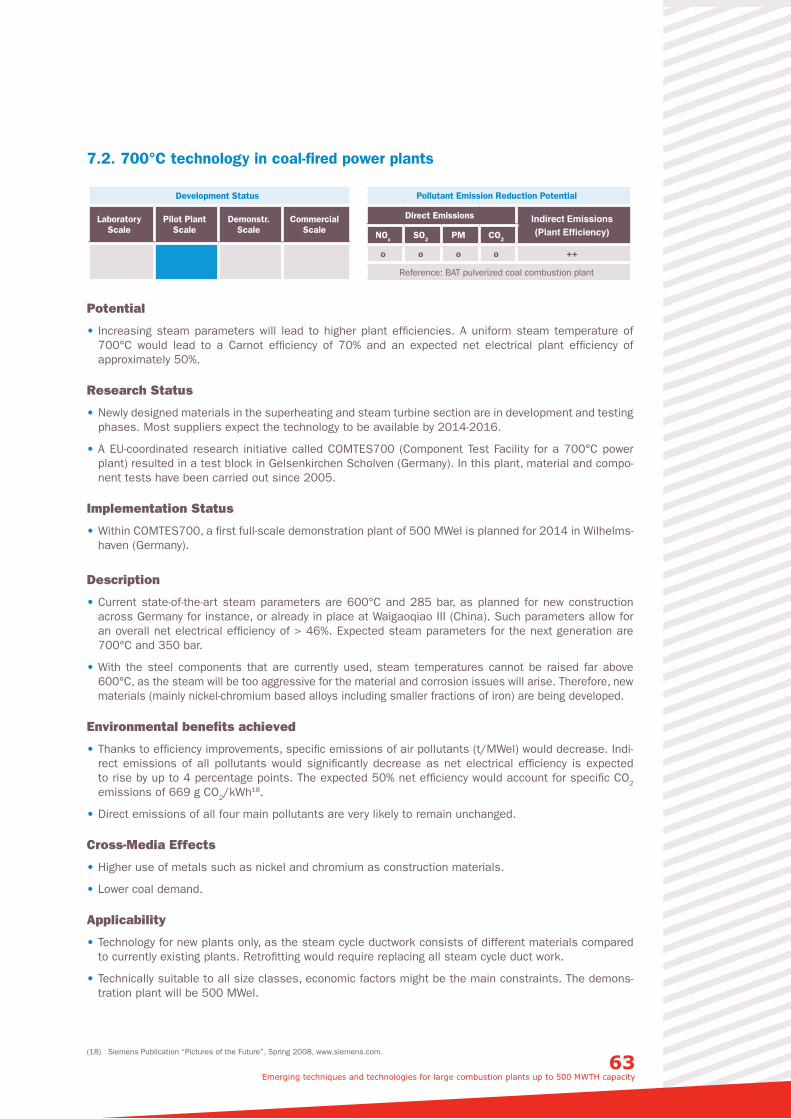
63 Emerging techniques and technologies for large combustion plants up to 500 MWTH capacity
7.2. 700°C technology in coal-fired power plants
Development Status
Laboratory Scale
Pilot Plant Scale
Demonstr. Scale
Commercial Scale
Pollutant Emission Reduction Potential
Direct Emissions Indirect Emissions (Plant Efficiency)NOx SO2 PM CO2
o o o o ++
Reference: BAT pulverized coal combustion plant
Potential
• Increasing steam parameters will lead to higher plant efficiencies. A uniform steam temperature of 700°C would lead to a Carnot efficiency of 70% and an expected net electrical plant efficiency of approximately 50%.
Research Status
• Newly designed materials in the superheating and steam turbine section are in development and testing phases. Most suppliers expect the technology to be available by 2014-2016.
• A EU-coordinated research initiative called COMTES700 (Component Test Facility for a 700°C power plant) resulted in a test block in Gelsenkirchen Scholven (Germany). In this plant, material and compo-nent tests have been carried out since 2005.
Implementation Status
• Within COMTES700, a first full-scale demonstration plant of 500 MWel is planned for 2014 in Wilhelms-haven (Germany).
Description
• Current state-of-the-art steam parameters are 600°C and 285 bar, as planned for new construction across Germany for instance, or already in place at Waigaoqiao III (China). Such parameters allow for an overall net electrical efficiency of > 46%. Expected steam parameters for the next generation are 700°C and 350 bar.
• With the steel components that are currently used, steam temperatures cannot be raised far above 600°C, as the steam will be too aggressive for the material and corrosion issues will arise. Therefore, new materials (mainly nickel-chromium based alloys including smaller fractions of iron) are being developed.
Environmental benefits achieved
• Thanks to efficiency improvements, specific emissions of air pollutants (t/MWel) would decrease. Indi-rect emissions of all pollutants would significantly decrease as net electrical efficiency is expected to rise by up to 4 percentage points. The expected 50% net efficiency would account for specific CO2 emissions of 669 g CO2/kWh18.
• Direct emissions of all four main pollutants are very likely to remain unchanged.
Cross-Media Effects
• Higher use of metals such as nickel and chromium as construction materials.
• Lower coal demand.
Applicability
• Technology for new plants only, as the steam cycle ductwork consists of different materials compared to currently existing plants. Retrofitting would require replacing all steam cycle duct work.
• Technically suitable to all size classes, economic factors might be the main constraints. The demons-tration plant will be 500 MWel.
(18) Siemens Publication “Pictures of the Future”, Spring 2008, www.siemens.com.
Operational Data
• The steam cycle schematic overview of the test facility at Gelsenkirchen Scholven, which operates at 705°C but only at 205 bar, as the host power plant turbomachinery equipment is not designed for 350 bar.
Economics
• Net efficiency increase of up to 4 percentage points compared with current best available 46% net efficiency power plants.
• Higher investment, as nickel and chromium are more expensive materials than currently used steel-based alloys. In 2008, price levels for the necessary alloys were higher by a factor of up to 5.
Driving force for implementation
• High-efficiency conventional coal-fired power plants for CO2 reduction and efficient use of coal.
Reference literature
Siemens Publication “Pictures of the Future”, Spring 2008, www.siemens.com.
COMTES700 Project Website www.comtes.org.
VGB Power Tech, Pre-Engineering Study “NRW Power Plant 700°C”.
COORETEC Working Group 2 “Coal-fired steam power plants with maximum efficiencies”, www.cooretec.de.
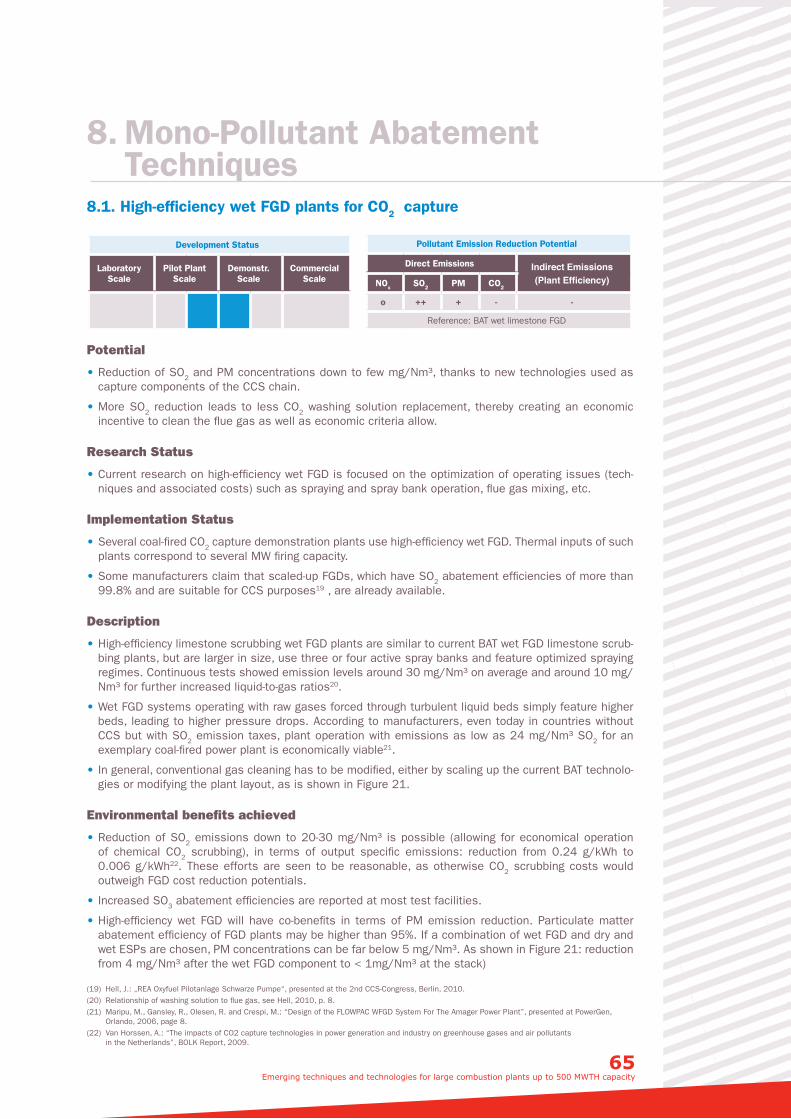
65 Emerging techniques and technologies for large combustion plants up to 500 MWTH capacity
8. Mono-Pollutant Abatement Techniques
8.1. High-efficiency wet FGD plants for CO2 capture
Development Status
Laboratory Scale
Pilot Plant Scale
Demonstr. Scale
Commercial Scale
Pollutant Emission Reduction Potential
Direct Emissions Indirect Emissions (Plant Efficiency)NOx SO2 PM CO2
o ++ + - -
Reference: BAT wet limestone FGD
Potential
• Reduction of SO2 and PM concentrations down to few mg/Nm³, thanks to new technologies used as capture components of the CCS chain.
• More SO2 reduction leads to less CO2 washing solution replacement, thereby creating an economic incentive to clean the flue gas as well as economic criteria allow.
Research Status
• Current research on high-efficiency wet FGD is focused on the optimization of operating issues (tech-niques and associated costs) such as spraying and spray bank operation, flue gas mixing, etc.
Implementation Status
• Several coal-fired CO2 capture demonstration plants use high-efficiency wet FGD. Thermal inputs of such plants correspond to several MW firing capacity.
• Some manufacturers claim that scaled-up FGDs, which have SO2 abatement efficiencies of more than 99.8% and are suitable for CCS purposes19 , are already available.
Description
• High-efficiency limestone scrubbing wet FGD plants are similar to current BAT wet FGD limestone scrub-bing plants, but are larger in size, use three or four active spray banks and feature optimized spraying regimes. Continuous tests showed emission levels around 30 mg/Nm³ on average and around 10 mg/Nm³ for further increased liquid-to-gas ratios20.
• Wet FGD systems operating with raw gases forced through turbulent liquid beds simply feature higher beds, leading to higher pressure drops. According to manufacturers, even today in countries without CCS but with SO2 emission taxes, plant operation with emissions as low as 24 mg/Nm³ SO2 for an exemplary coal-fired power plant is economically viable21.
• In general, conventional gas cleaning has to be modified, either by scaling up the current BAT technolo-gies or modifying the plant layout, as is shown in Figure 21.
Environmental benefits achieved
• Reduction of SO2 emissions down to 20-30 mg/Nm³ is possible (allowing for economical operation of chemical CO2 scrubbing), in terms of output specific emissions: reduction from 0.24 g/kWh to 0.006 g/kWh22. These efforts are seen to be reasonable, as otherwise CO2 scrubbing costs would outweigh FGD cost reduction potentials.
• Increased SO3 abatement efficiencies are reported at most test facilities.
• High-efficiency wet FGD will have co-benefits in terms of PM emission reduction. Particulate matter abatement efficiency of FGD plants may be higher than 95%. If a combination of wet FGD and dry and wet ESPs are chosen, PM concentrations can be far below 5 mg/Nm³. As shown in Figure 21: reduction from 4 mg/Nm³ after the wet FGD component to < 1mg/Nm³ at the stack)
(19) Hell, J.: „REA Oxyfuel Pilotanlage Schwarze Pumpe“, presented at the 2nd CCS-Congress, Berlin, 2010.(20) Relationship of washing solution to flue gas, see Hell, 2010, p. 8.(21) Maripu, M., Gansley, R., Olesen, R. and Crespi, M.: “Design of the FLOWPAC WFGD System For The Amager Power Plant”, presented at PowerGen,
Orlando, 2006, page 8.(22) Van Horssen, A.: “The impacts of CO2 capture technologies in power generation and industry on greenhouse gases and air pollutants
in the Netherlands”, BOLK Report, 2009.
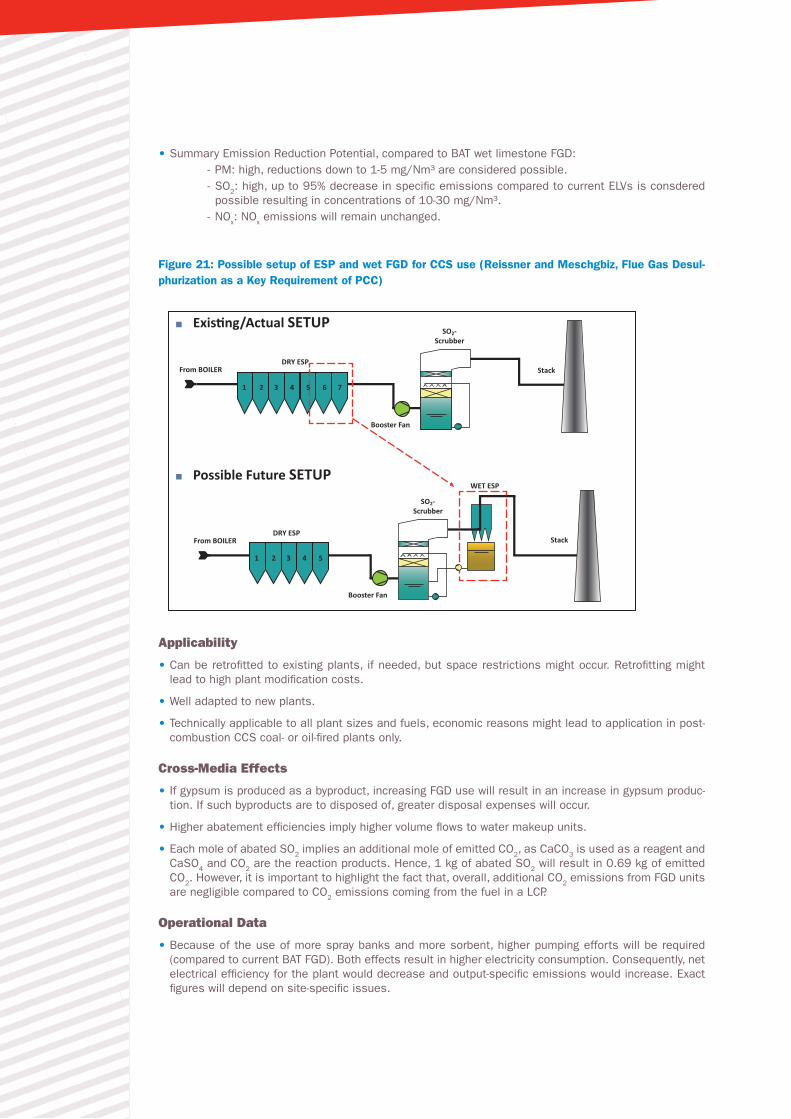
• Summary Emission Reduction Potential, compared to BAT wet limestone FGD: - PM: high, reductions down to 1-5 mg/Nm³ are considered possible. - SO2: high, up to 95% decrease in specific emissions compared to current ELVs is consdered possible resulting in concentrations of 10-30 mg/Nm³.
- NOx: NOx emissions will remain unchanged.
Figure 21: Possible setup of ESP and wet FGD for CCS use (Reissner and Meschgbiz, Flue Gas Desul-phurization as a Key Requirement of PCC)
Schéma page 85
1 2 3 4 5
1 2 3 4 5
6 7
DRY ESPFrom BOILER
DRY ESPFrom BOILER
Booster Fan
Booster Fan
SO2-Scrubber
SO2-Scrubber
WET ESP
Stack
Stack
■ Exis�ng/Actual SETUP
■ Possible Future SETUP
Applicability
• Can be retrofitted to existing plants, if needed, but space restrictions might occur. Retrofitting might lead to high plant modification costs.
• Well adapted to new plants.
• Technically applicable to all plant sizes and fuels, economic reasons might lead to application in post-combustion CCS coal- or oil-fired plants only.
Cross-Media Effects
• If gypsum is produced as a byproduct, increasing FGD use will result in an increase in gypsum produc-tion. If such byproducts are to disposed of, greater disposal expenses will occur.
• Higher abatement efficiencies imply higher volume flows to water makeup units.
• Each mole of abated SO2 implies an additional mole of emitted CO2, as CaCO3 is used as a reagent and CaSO4 and CO2 are the reaction products. Hence, 1 kg of abated SO2 will result in 0.69 kg of emitted CO2. However, it is important to highlight the fact that, overall, additional CO2 emissions from FGD units are negligible compared to CO2 emissions coming from the fuel in a LCP.
Operational Data
• Because of the use of more spray banks and more sorbent, higher pumping efforts will be required (compared to current BAT FGD). Both effects result in higher electricity consumption. Consequently, net electrical efficiency for the plant would decrease and output-specific emissions would increase. Exact figures will depend on site-specific issues.
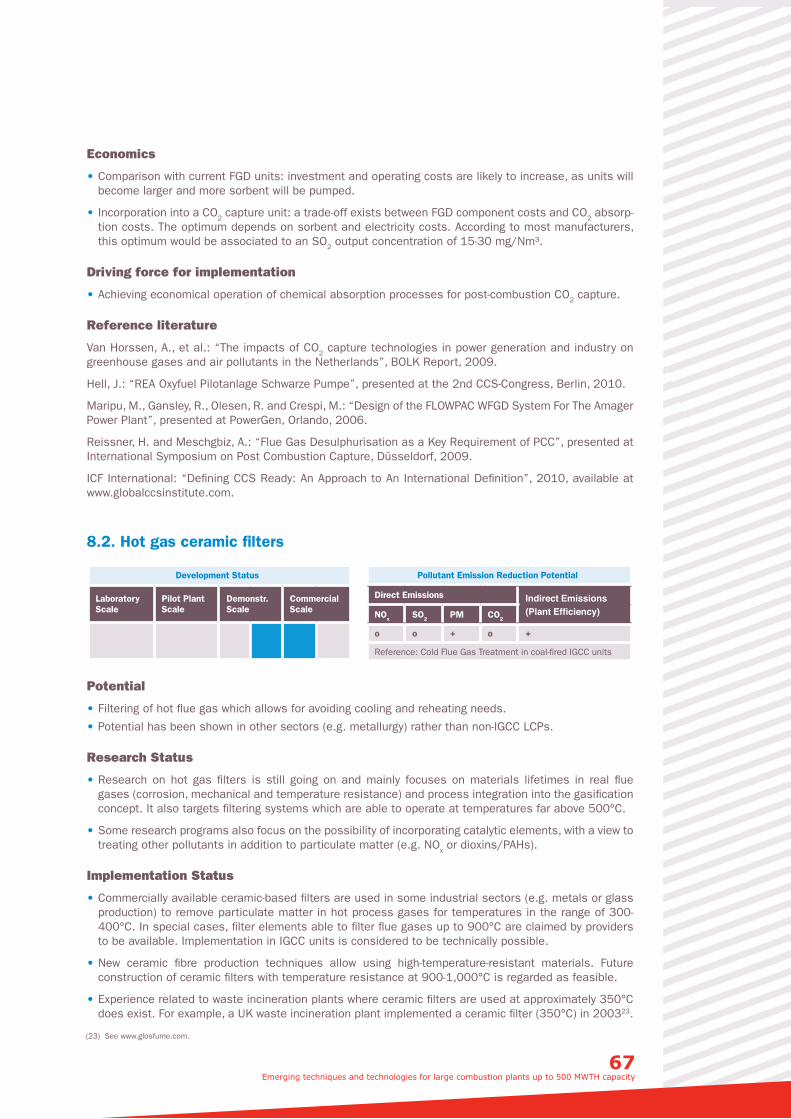
67 Emerging techniques and technologies for large combustion plants up to 500 MWTH capacity
Economics
• Comparison with current FGD units: investment and operating costs are likely to increase, as units will become larger and more sorbent will be pumped.
• Incorporation into a CO2 capture unit: a trade-off exists between FGD component costs and CO2 absorp-tion costs. The optimum depends on sorbent and electricity costs. According to most manufacturers, this optimum would be associated to an SO2 output concentration of 15-30 mg/Nm³.
Driving force for implementation
• Achieving economical operation of chemical absorption processes for post-combustion CO2 capture.
Reference literature
Van Horssen, A., et al.: “The impacts of CO2 capture technologies in power generation and industry on greenhouse gases and air pollutants in the Netherlands”, BOLK Report, 2009.
Hell, J.: “REA Oxyfuel Pilotanlage Schwarze Pumpe”, presented at the 2nd CCS-Congress, Berlin, 2010.
Maripu, M., Gansley, R., Olesen, R. and Crespi, M.: “Design of the FLOWPAC WFGD System For The Amager Power Plant”, presented at PowerGen, Orlando, 2006.
Reissner, H. and Meschgbiz, A.: “Flue Gas Desulphurisation as a Key Requirement of PCC”, presented at International Symposium on Post Combustion Capture, Düsseldorf, 2009.
ICF International: “Defining CCS Ready: An Approach to An International Definition”, 2010, available at www.globalccsinstitute.com.
8.2. Hot gas ceramic filters
Development Status
Laboratory Scale
Pilot Plant Scale
Demonstr. Scale
Commercial Scale
Pollutant Emission Reduction Potential
Direct Emissions Indirect Emissions (Plant Efficiency)NOx SO2 PM CO2
o o + o +
Reference: Cold Flue Gas Treatment in coal-fired IGCC units
Potential
• Filtering of hot flue gas which allows for avoiding cooling and reheating needs.
• Potential has been shown in other sectors (e.g. metallurgy) rather than non-IGCC LCPs.
Research Status
• Research on hot gas filters is still going on and mainly focuses on materials lifetimes in real flue gases (corrosion, mechanical and temperature resistance) and process integration into the gasification concept. It also targets filtering systems which are able to operate at temperatures far above 500°C.
• Some research programs also focus on the possibility of incorporating catalytic elements, with a view to treating other pollutants in addition to particulate matter (e.g. NOx or dioxins/PAHs).
Implementation Status
• Commercially available ceramic-based filters are used in some industrial sectors (e.g. metals or glass production) to remove particulate matter in hot process gases for temperatures in the range of 300-400°C. In special cases, filter elements able to filter flue gases up to 900°C are claimed by providers to be available. Implementation in IGCC units is considered to be technically possible.
• New ceramic fibre production techniques allow using high-temperature-resistant materials. Future construction of ceramic filters with temperature resistance at 900-1,000°C is regarded as feasible.
• Experience related to waste incineration plants where ceramic filters are used at approximately 350°C does exist. For example, a UK waste incineration plant implemented a ceramic filter (350°C) in 200323.
(23) See www.glosfume.com.
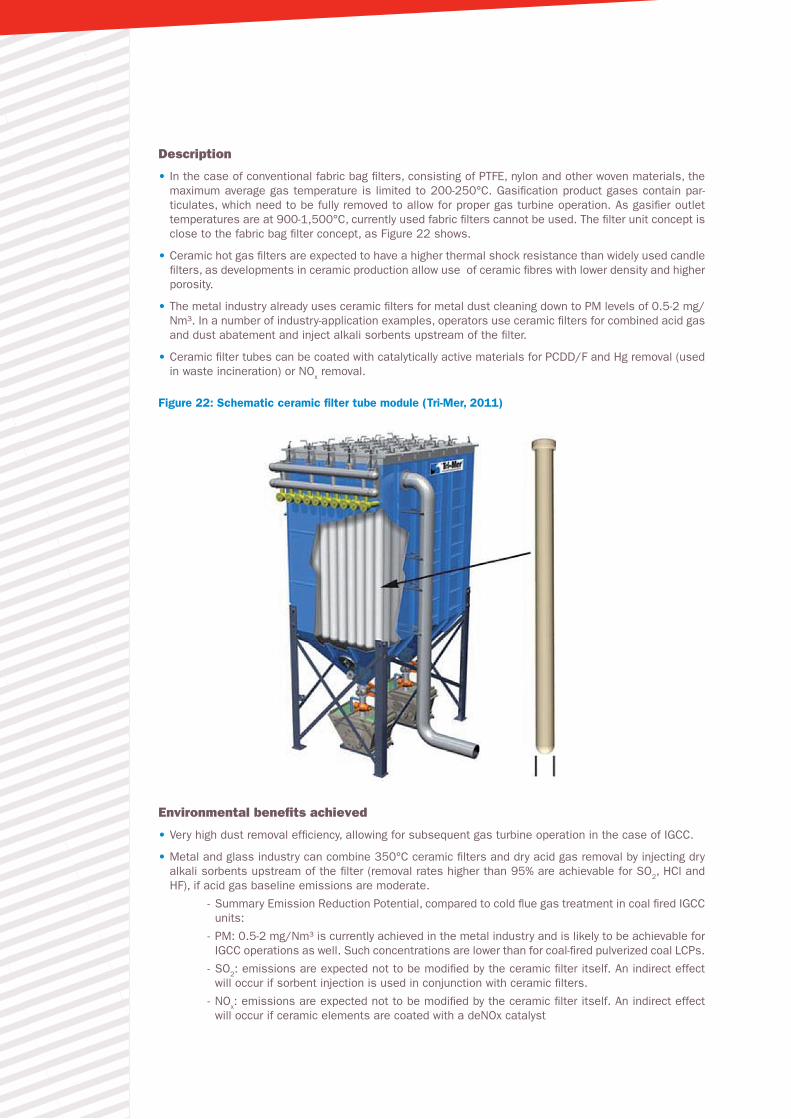
Description
• In the case of conventional fabric bag filters, consisting of PTFE, nylon and other woven materials, the maximum average gas temperature is limited to 200-250°C. Gasification product gases contain par-ticulates, which need to be fully removed to allow for proper gas turbine operation. As gasifier outlet temperatures are at 900-1,500°C, currently used fabric filters cannot be used. The filter unit concept is close to the fabric bag filter concept, as Figure 22 shows.
• Ceramic hot gas filters are expected to have a higher thermal shock resistance than widely used candle filters, as developments in ceramic production allow use of ceramic fibres with lower density and higher porosity.
• The metal industry already uses ceramic filters for metal dust cleaning down to PM levels of 0.5-2 mg/Nm³. In a number of industry-application examples, operators use ceramic filters for combined acid gas and dust abatement and inject alkali sorbents upstream of the filter.
• Ceramic filter tubes can be coated with catalytically active materials for PCDD/F and Hg removal (used in waste incineration) or NOx removal.
Figure 22: Schematic ceramic filter tube module (Tri-Mer, 2011)
Environmental benefits achieved
• Very high dust removal efficiency, allowing for subsequent gas turbine operation in the case of IGCC.
• Metal and glass industry can combine 350°C ceramic filters and dry acid gas removal by injecting dry alkali sorbents upstream of the filter (removal rates higher than 95% are achievable for SO2, HCl and HF), if acid gas baseline emissions are moderate.
- Summary Emission Reduction Potential, compared to cold flue gas treatment in coal fired IGCC units:
- PM: 0.5-2 mg/Nm³ is currently achieved in the metal industry and is likely to be achievable for IGCC operations as well. Such concentrations are lower than for coal-fired pulverized coal LCPs.
- SO2: emissions are expected not to be modified by the ceramic filter itself. An indirect effect will occur if sorbent injection is used in conjunction with ceramic filters.
- NOx: emissions are expected not to be modified by the ceramic filter itself. An indirect effect will occur if ceramic elements are coated with a deNOx catalyst
69 Emerging techniques and technologies for large combustion plants up to 500 MWTH capacity
Applicability
• Hot gas ceramic filters are likely to be applicable for different kinds of 50-500 MWth LCPs before 2020.
Operational Data
• Materials used are sintered metal-ceramic fibres, usually containing silicates, alumino-silicates or alu-minides, but variations in materials do exist for special operations. Iron metal bases can be sensitive to H2S and can lead to ceramic cracking, therefore coal-based IGCC operations mostly choose alumino-silicates as material bases.
• Moderate pressure drops due to high porosity compared to candle filters.
Economics
• Ceramic bags are proven to be more expensive than fabric bags. Nevertheless, an increase in total IGCC plant efficiency can be expected and can outweigh this drawback.
Driving force for implementation
• Key technology for efficient hot flue gas treatment.
Reference literature (selection)
NETL: “Development of Improved Metallic Hot Gas Filters for IGCC and PFBC Systems”, DOE/NETL re-search project report, available at www.netl.doe.gov, accessed on 19.09.2011.
Caldo, product information on ceramic hot gas filters, available at www.caldo.com, accessed on 19.09.2011.
Glosfume, product information on high temperature ceramic air filtration, available at www.glosfume.com, accessed on 19.09.2011.
Tri-Mer, product information on UltraTemp ceramic filter systems, available at www.tri-mer.com, accessed on 19.09.2011.
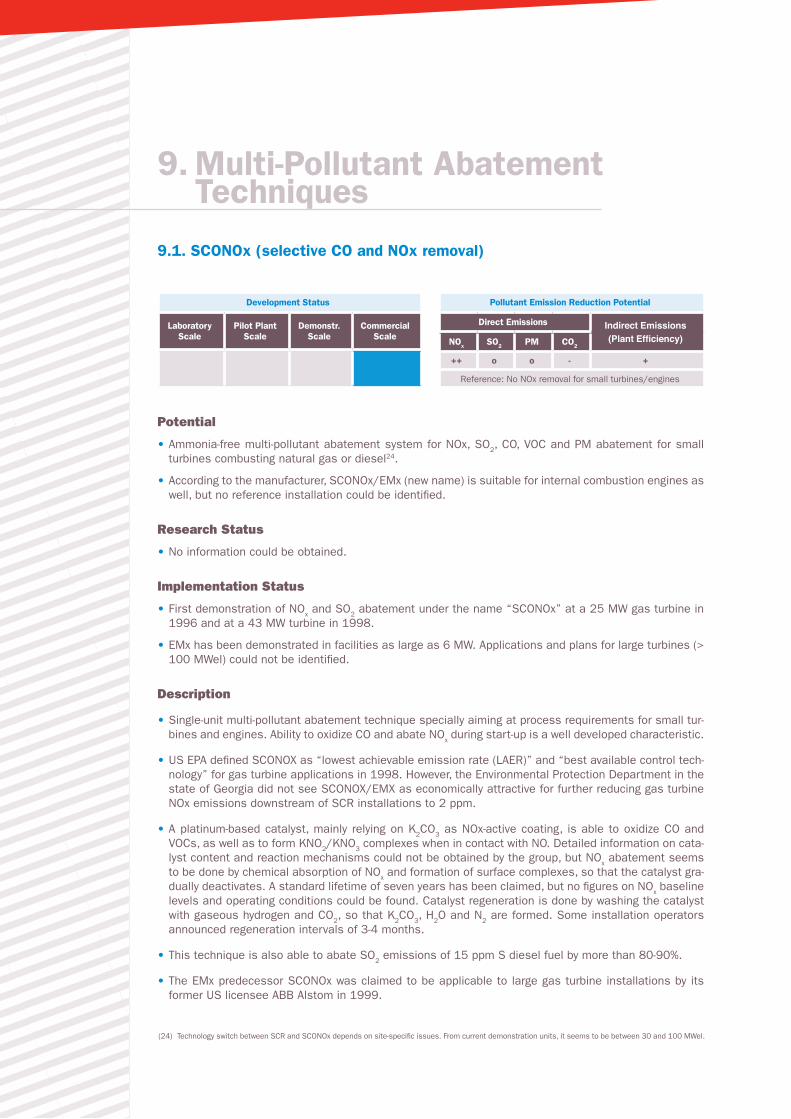
9. Multi-Pollutant Abatement Techniques
9.1. SCONOx (selective CO and NOx removal)
Development Status
Laboratory Scale
Pilot Plant Scale
Demonstr. Scale
Commercial Scale
Pollutant Emission Reduction Potential
Direct Emissions Indirect Emissions (Plant Efficiency)NOx SO2 PM CO2
++ o o - +
Reference: No NOx removal for small turbines/engines
Potential
• Ammonia-free multi-pollutant abatement system for NOx, SO2, CO, VOC and PM abatement for small turbines combusting natural gas or diesel24.
• According to the manufacturer, SCONOx/EMx (new name) is suitable for internal combustion engines as well, but no reference installation could be identified.
Research Status
• No information could be obtained.
Implementation Status
• First demonstration of NOx and SO2 abatement under the name “SCONOx” at a 25 MW gas turbine in 1996 and at a 43 MW turbine in 1998.
• EMx has been demonstrated in facilities as large as 6 MW. Applications and plans for large turbines (> 100 MWel) could not be identified.
Description
• Single-unit multi-pollutant abatement technique specially aiming at process requirements for small tur-bines and engines. Ability to oxidize CO and abate NOx during start-up is a well developed characteristic.
• US EPA defined SCONOX as “lowest achievable emission rate (LAER)” and “best available control tech-nology” for gas turbine applications in 1998. However, the Environmental Protection Department in the state of Georgia did not see SCONOX/EMX as economically attractive for further reducing gas turbine NOx emissions downstream of SCR installations to 2 ppm.
• A platinum-based catalyst, mainly relying on K2CO3 as NOx-active coating, is able to oxidize CO and VOCs, as well as to form KNO2/KNO3 complexes when in contact with NO. Detailed information on cata-lyst content and reaction mechanisms could not be obtained by the group, but NOx abatement seems to be done by chemical absorption of NOx and formation of surface complexes, so that the catalyst gra-dually deactivates. A standard lifetime of seven years has been claimed, but no figures on NOx baseline levels and operating conditions could be found. Catalyst regeneration is done by washing the catalyst with gaseous hydrogen and CO2, so that K2CO3, H2O and N2 are formed. Some installation operators announced regeneration intervals of 3-4 months.
• This technique is also able to abate SO2 emissions of 15 ppm S diesel fuel by more than 80-90%.
• The EMx predecessor SCONOx was claimed to be applicable to large gas turbine installations by its former US licensee ABB Alstom in 1999.
(24) Technology switch between SCR and SCONOx depends on site-specific issues. From current demonstration units, it seems to be between 30 and 100 MWel.
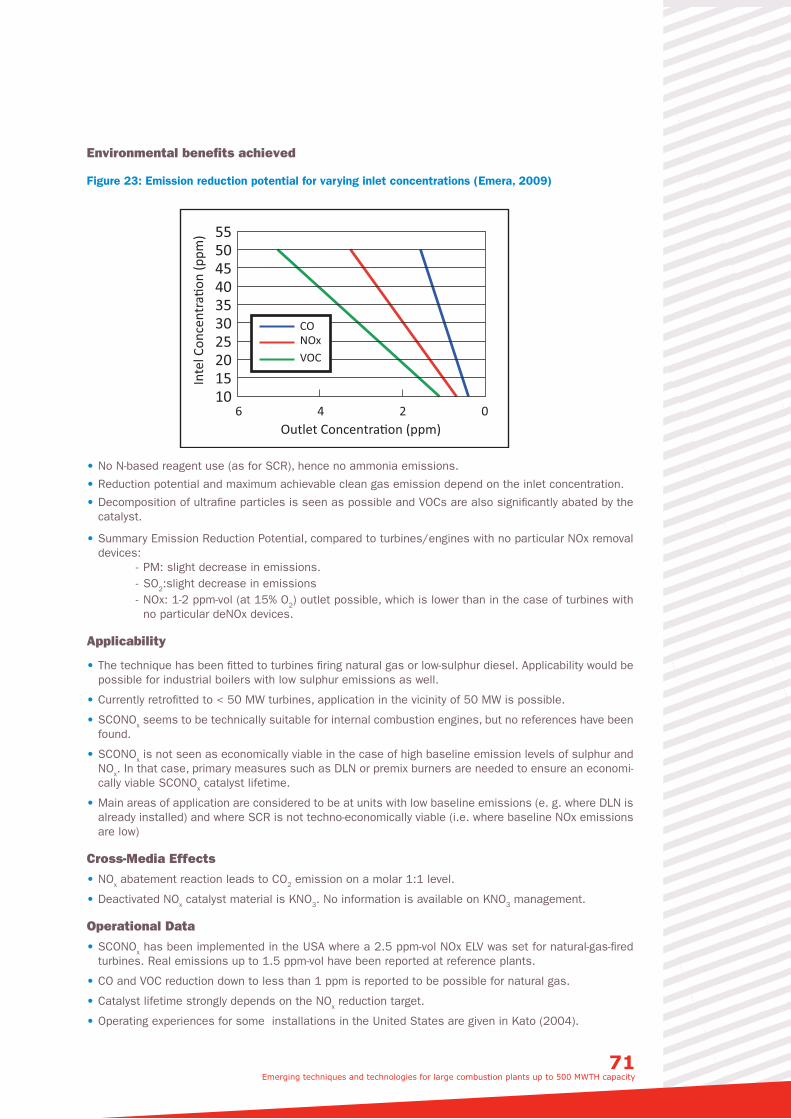
71 Emerging techniques and technologies for large combustion plants up to 500 MWTH capacity
Environmental benefits achieved
Figure 23: Emission reduction potential for varying inlet concentrations (Emera, 2009)
10152025303540455055
0246Outlet Concentra�on (ppm)
Inte
l Con
cent
ra�o
n (p
pm)
CONOxVOC
Schéma page 91
• No N-based reagent use (as for SCR), hence no ammonia emissions.
• Reduction potential and maximum achievable clean gas emission depend on the inlet concentration.
• Decomposition of ultrafine particles is seen as possible and VOCs are also significantly abated by the catalyst.
• Summary Emission Reduction Potential, compared to turbines/engines with no particular NOx removal devices:
- PM: slight decrease in emissions. - SO2:slight decrease in emissions - NOx: 1-2 ppm-vol (at 15% O2) outlet possible, which is lower than in the case of turbines with no particular deNOx devices.
Applicability
• The technique has been fitted to turbines firing natural gas or low-sulphur diesel. Applicability would be possible for industrial boilers with low sulphur emissions as well.
• Currently retrofitted to < 50 MW turbines, application in the vicinity of 50 MW is possible.
• SCONOx seems to be technically suitable for internal combustion engines, but no references have been found.
• SCONOx is not seen as economically viable in the case of high baseline emission levels of sulphur and NOx. In that case, primary measures such as DLN or premix burners are needed to ensure an economi-cally viable SCONOx catalyst lifetime.
• Main areas of application are considered to be at units with low baseline emissions (e. g. where DLN is already installed) and where SCR is not techno-economically viable (i.e. where baseline NOx emissions are low)
Cross-Media Effects
• NOx abatement reaction leads to CO2 emission on a molar 1:1 level.
• Deactivated NOx catalyst material is KNO3. No information is available on KNO3 management.
Operational Data
• SCONOx has been implemented in the USA where a 2.5 ppm-vol NOx ELV was set for natural-gas-fired turbines. Real emissions up to 1.5 ppm-vol have been reported at reference plants.
• CO and VOC reduction down to less than 1 ppm is reported to be possible for natural gas.
• Catalyst lifetime strongly depends on the NOx reduction target.
• Operating experiences for some installations in the United States are given in Kato (2004).
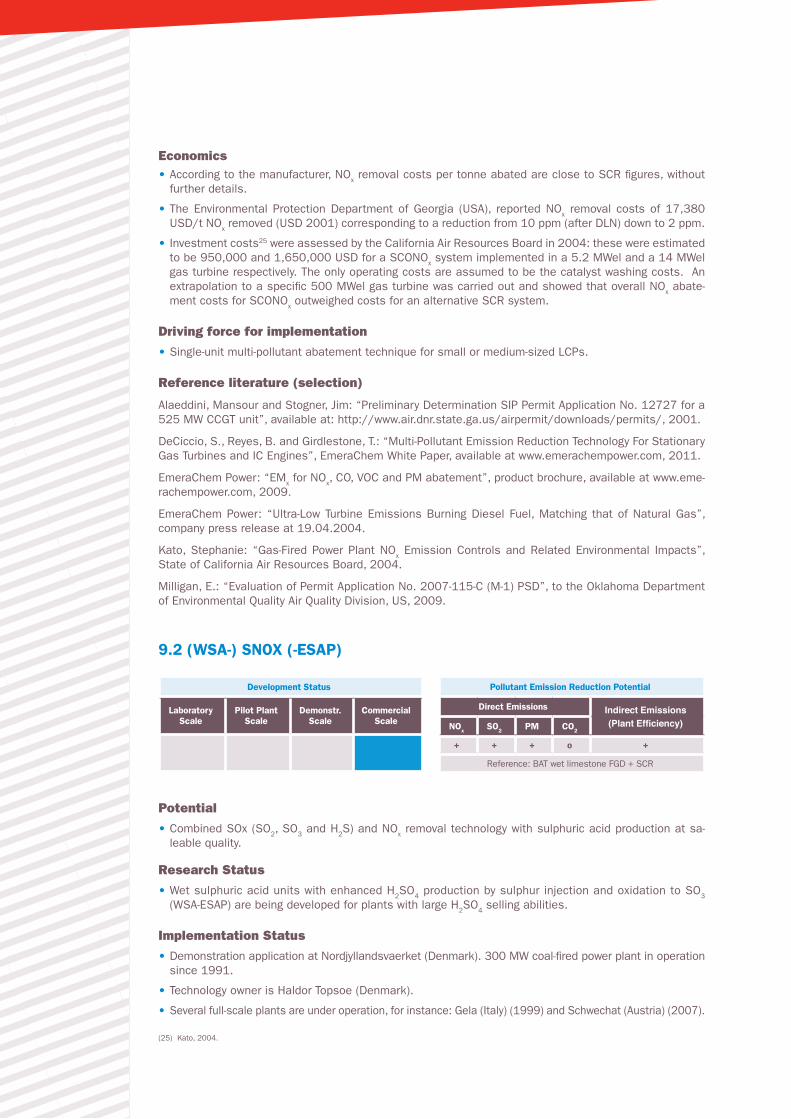
Economics • According to the manufacturer, NOx removal costs per tonne abated are close to SCR figures, without further details.
• The Environmental Protection Department of Georgia (USA), reported NOx removal costs of 17,380 USD/t NOx removed (USD 2001) corresponding to a reduction from 10 ppm (after DLN) down to 2 ppm.
• Investment costs25 were assessed by the California Air Resources Board in 2004: these were estimated to be 950,000 and 1,650,000 USD for a SCONOx system implemented in a 5.2 MWel and a 14 MWel gas turbine respectively. The only operating costs are assumed to be the catalyst washing costs. An extrapolation to a specific 500 MWel gas turbine was carried out and showed that overall NOx abate-ment costs for SCONOx outweighed costs for an alternative SCR system.
Driving force for implementation
• Single-unit multi-pollutant abatement technique for small or medium-sized LCPs.
Reference literature (selection)
Alaeddini, Mansour and Stogner, Jim: “Preliminary Determination SIP Permit Application No. 12727 for a 525 MW CCGT unit”, available at: http://www.air.dnr.state.ga.us/airpermit/downloads/permits/, 2001.
DeCiccio, S., Reyes, B. and Girdlestone, T.: “Multi-Pollutant Emission Reduction Technology For Stationary Gas Turbines and IC Engines”, EmeraChem White Paper, available at www.emerachempower.com, 2011.
EmeraChem Power: “EMx for NOx, CO, VOC and PM abatement”, product brochure, available at www.eme-rachempower.com, 2009.
EmeraChem Power: “Ultra-Low Turbine Emissions Burning Diesel Fuel, Matching that of Natural Gas”, company press release at 19.04.2004.
Kato, Stephanie: “Gas-Fired Power Plant NOx Emission Controls and Related Environmental Impacts”, State of California Air Resources Board, 2004.
Milligan, E.: “Evaluation of Permit Application No. 2007-115-C (M-1) PSD”, to the Oklahoma Department of Environmental Quality Air Quality Division, US, 2009.
9.2 (WSA-) SNOX (-ESAP)
Development Status
Laboratory Scale
Pilot Plant Scale
Demonstr. Scale
Commercial Scale
Pollutant Emission Reduction Potential
Direct Emissions Indirect Emissions (Plant Efficiency)NOx SO2 PM CO2
+ + + o +
Reference: BAT wet limestone FGD + SCR
Potential
• Combined SOx (SO2, SO3 and H2S) and NOx removal technology with sulphuric acid production at sa-leable quality.
Research Status
• Wet sulphuric acid units with enhanced H2SO4 production by sulphur injection and oxidation to SO3
(WSA-ESAP) are being developed for plants with large H2SO4 selling abilities.
Implementation Status
• Demonstration application at Nordjyllandsvaerket (Denmark). 300 MW coal-fired power plant in operation since 1991.
• Technology owner is Haldor Topsoe (Denmark).
• Several full-scale plants are under operation, for instance: Gela (Italy) (1999) and Schwechat (Austria) (2007).
(25) Kato, 2004.
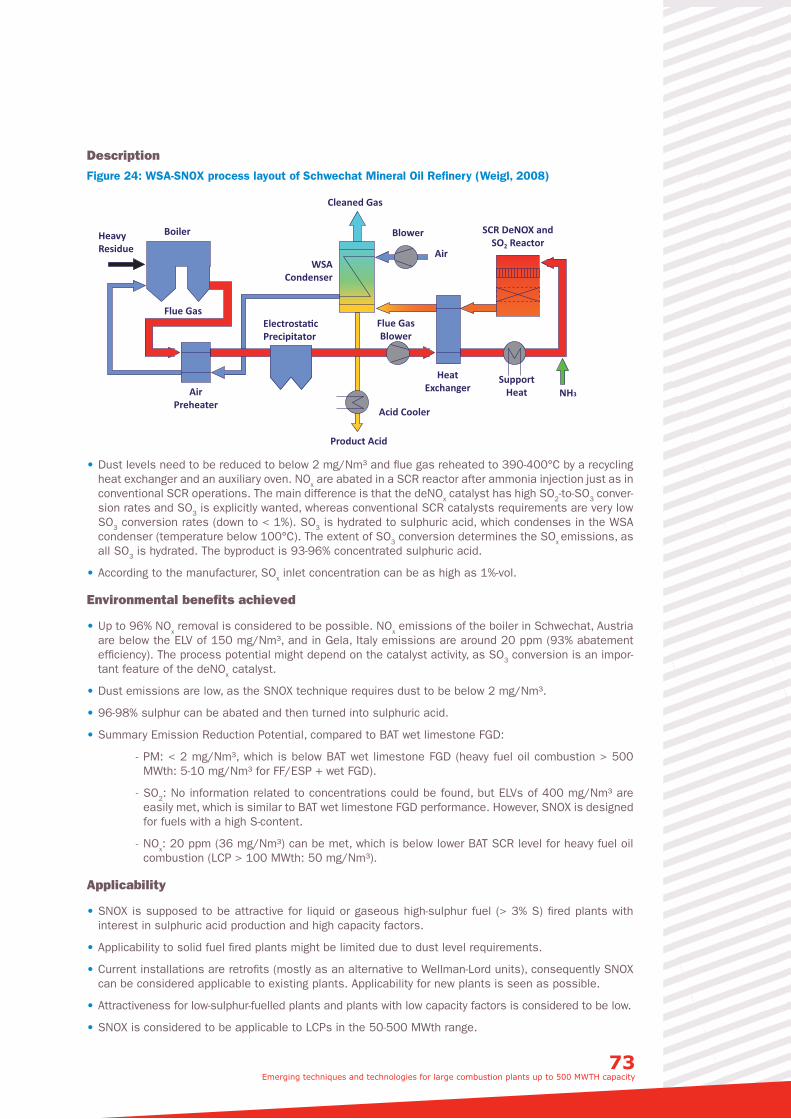
73 Emerging techniques and technologies for large combustion plants up to 500 MWTH capacity
Description
Figure 24: WSA-SNOX process layout of Schwechat Mineral Oil Refinery (Weigl, 2008)
BoilerHeavyResidue
Flue Gas
AirPreheater
Acid Cooler
Product Acid
HeatExchanger
SupportHeat
Flue GasBlower
Blower
Cleaned Gas
WSACondenser
Electrosta�cPrecipitator
SCR DeNOX andSO2 Reactor
NH3
Air
Schéma page 94
• Dust levels need to be reduced to below 2 mg/Nm³ and flue gas reheated to 390-400°C by a recycling heat exchanger and an auxiliary oven. NOx are abated in a SCR reactor after ammonia injection just as in conventional SCR operations. The main difference is that the deNOx catalyst has high SO2-to-SO3 conver-sion rates and SO3 is explicitly wanted, whereas conventional SCR catalysts requirements are very low SO3 conversion rates (down to < 1%). SO3 is hydrated to sulphuric acid, which condenses in the WSA condenser (temperature below 100°C). The extent of SO3 conversion determines the SOx emissions, as all SO3 is hydrated. The byproduct is 93-96% concentrated sulphuric acid.
• According to the manufacturer, SOx inlet concentration can be as high as 1%-vol.
Environmental benefits achieved
• Up to 96% NOx removal is considered to be possible. NOx emissions of the boiler in Schwechat, Austria are below the ELV of 150 mg/Nm³, and in Gela, Italy emissions are around 20 ppm (93% abatement efficiency). The process potential might depend on the catalyst activity, as SO3 conversion is an impor-tant feature of the deNOx catalyst.
• Dust emissions are low, as the SNOX technique requires dust to be below 2 mg/Nm³.
• 96-98% sulphur can be abated and then turned into sulphuric acid.
• Summary Emission Reduction Potential, compared to BAT wet limestone FGD:
- PM: < 2 mg/Nm³, which is below BAT wet limestone FGD (heavy fuel oil combustion > 500 MWth: 5-10 mg/Nm³ for FF/ESP + wet FGD).
- SO2: No information related to concentrations could be found, but ELVs of 400 mg/Nm³ are easily met, which is similar to BAT wet limestone FGD performance. However, SNOX is designed for fuels with a high S-content.
- NOx: 20 ppm (36 mg/Nm³) can be met, which is below lower BAT SCR level for heavy fuel oil combustion (LCP > 100 MWth: 50 mg/Nm³).
Applicability
• SNOX is supposed to be attractive for liquid or gaseous high-sulphur fuel (> 3% S) fired plants with interest in sulphuric acid production and high capacity factors.
• Applicability to solid fuel fired plants might be limited due to dust level requirements.
• Current installations are retrofits (mostly as an alternative to Wellman-Lord units), consequently SNOX can be considered applicable to existing plants. Applicability for new plants is seen as possible.
• Attractiveness for low-sulphur-fuelled plants and plants with low capacity factors is considered to be low.
• SNOX is considered to be applicable to LCPs in the 50-500 MWth range.
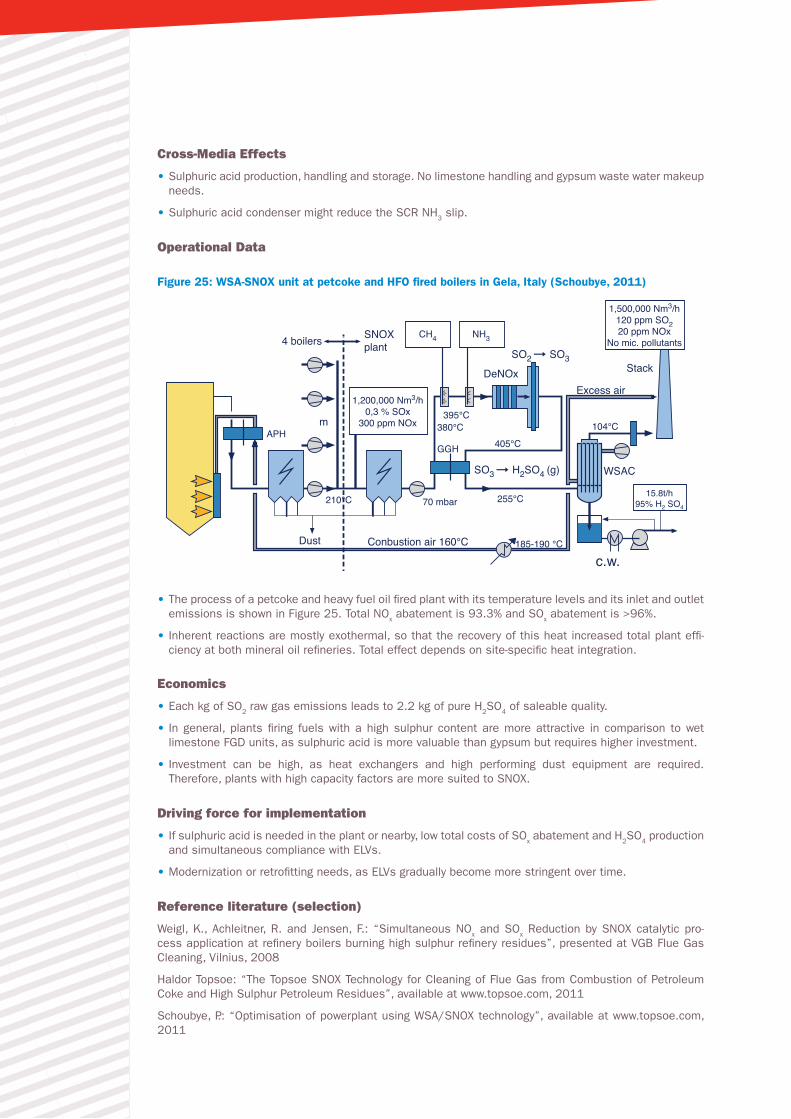
Cross-Media Effects
• Sulphuric acid production, handling and storage. No limestone handling and gypsum waste water makeup needs.
• Sulphuric acid condenser might reduce the SCR NH3 slip.
Operational Data
Figure 25: WSA-SNOX unit at petcoke and HFO fired boilers in Gela, Italy (Schoubye, 2011)
4 boilers SNOXplant
395°C380°C
GGH
DeNOxExcess air
Stack
WSAC
c.w.
APH
210°C
405°C
104°C
185-190 °C
255°C70 mbar
Conbustion air 160°CDust
15.8t/h95% H2 SO4
1,500,000 Nm3/h120 ppm SO220 ppm NOx
No mic. pollutants
1,200,000 Nm3/h0,3 % SOx
300 ppm NOx
CH4 NH3
SO2 ➞ SO3
SO3 ➞ H2SO4 (g)
m
• The process of a petcoke and heavy fuel oil fired plant with its temperature levels and its inlet and outlet emissions is shown in Figure 25. Total NOx abatement is 93.3% and SOx abatement is >96%.
• Inherent reactions are mostly exothermal, so that the recovery of this heat increased total plant effi-ciency at both mineral oil refineries. Total effect depends on site-specific heat integration.
Economics
• Each kg of SO2 raw gas emissions leads to 2.2 kg of pure H2SO4 of saleable quality.
• In general, plants firing fuels with a high sulphur content are more attractive in comparison to wet limestone FGD units, as sulphuric acid is more valuable than gypsum but requires higher investment.
• Investment can be high, as heat exchangers and high performing dust equipment are required. Therefore, plants with high capacity factors are more suited to SNOX.
Driving force for implementation
• If sulphuric acid is needed in the plant or nearby, low total costs of SOx abatement and H2SO4 production and simultaneous compliance with ELVs.
• Modernization or retrofitting needs, as ELVs gradually become more stringent over time.
Reference literature (selection)
Weigl, K., Achleitner, R. and Jensen, F.: “Simultaneous NOx and SOx Reduction by SNOX catalytic pro-cess application at refinery boilers burning high sulphur refinery residues”, presented at VGB Flue Gas Cleaning, Vilnius, 2008
Haldor Topsoe: “The Topsoe SNOX Technology for Cleaning of Flue Gas from Combustion of Petroleum Coke and High Sulphur Petroleum Residues”, available at www.topsoe.com, 2011
Schoubye, P.: “Optimisation of powerplant using WSA/SNOX technology”, available at www.topsoe.com, 2011
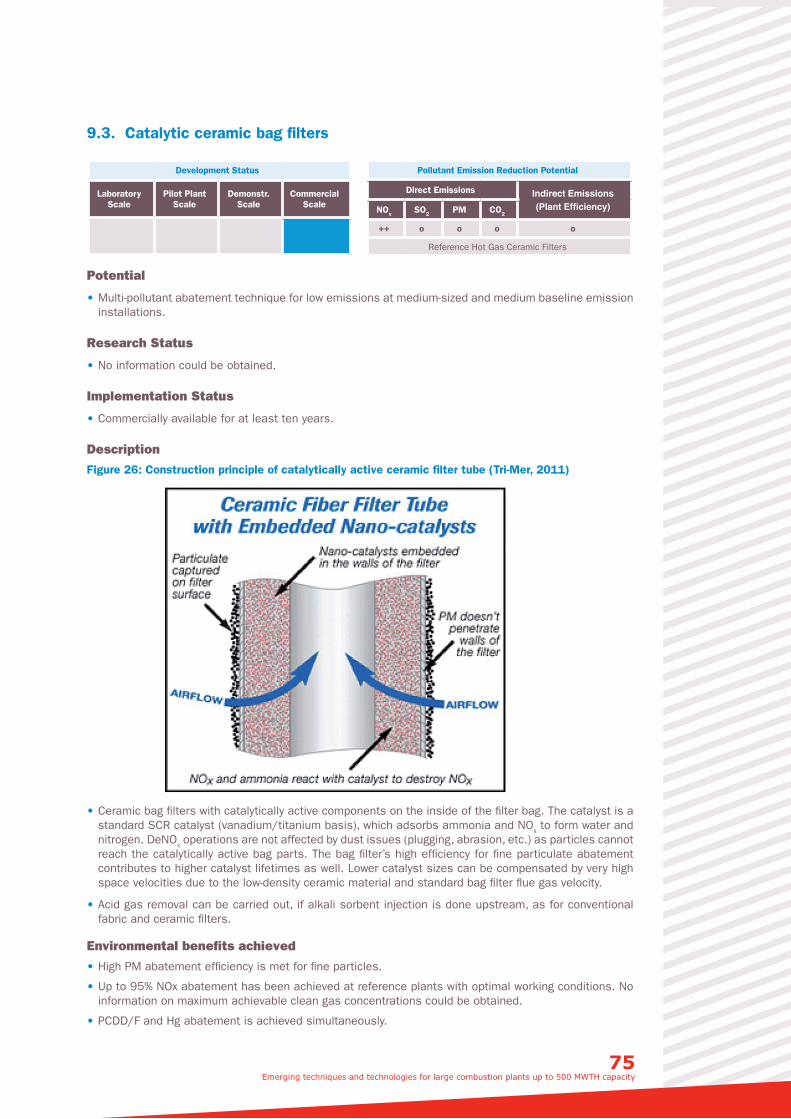
75 Emerging techniques and technologies for large combustion plants up to 500 MWTH capacity
9.3. Catalytic ceramic bag filters
Development Status
Laboratory Scale
Pilot Plant Scale
Demonstr. Scale
Commercial Scale
Pollutant Emission Reduction Potential
Direct Emissions Indirect Emissions (Plant Efficiency)NOx SO2 PM CO2
++ o o o o
Reference Hot Gas Ceramic Filters
Potential
• Multi-pollutant abatement technique for low emissions at medium-sized and medium baseline emission installations.
Research Status
• No information could be obtained.
Implementation Status
• Commercially available for at least ten years.
Description
Figure 26: Construction principle of catalytically active ceramic filter tube (Tri-Mer, 2011)
• Ceramic bag filters with catalytically active components on the inside of the filter bag. The catalyst is a standard SCR catalyst (vanadium/titanium basis), which adsorbs ammonia and NOx to form water and nitrogen. DeNOx operations are not affected by dust issues (plugging, abrasion, etc.) as particles cannot reach the catalytically active bag parts. The bag filter’s high efficiency for fine particulate abatement contributes to higher catalyst lifetimes as well. Lower catalyst sizes can be compensated by very high space velocities due to the low-density ceramic material and standard bag filter flue gas velocity.
• Acid gas removal can be carried out, if alkali sorbent injection is done upstream, as for conventional fabric and ceramic filters.
Environmental benefits achieved
• High PM abatement efficiency is met for fine particles.
• Up to 95% NOx abatement has been achieved at reference plants with optimal working conditions. No information on maximum achievable clean gas concentrations could be obtained.
• PCDD/F and Hg abatement is achieved simultaneously.
• Summary Emission Reduction Potential, compared to hot gas ceramic filters:
- PM: less than 2 ppm is achievable, as for hot gas ceramic filters
- SO2: no direct effect without sorbent injection
- NOx: abatement efficiencies of 70-95% seem to be achievable, although no exact values could be obtained. Ceramic filter bags do not achieve any NOx reduction.
Applicability
• NOx, PCDD/F, Hg and PM combined abatement unit for installations with high fine particle emissions and medium levels of NOx, Hg and PCDD/F, for example CFB units or medium-sized installations or units where there is a need to improve NOx emission reduction.
Cross-Media Effects
• Ammonia handling and emissions, as for conventional SCR operations.
• SO3 conversion at conventional SCR levels.
Operational Data
• Operating temperatures from 150°C to 375°C with high NOx abatement rates in the lower temperature range. This is below conventional high-dust SCR operating temperatures. Therefore, higher heat recove-ries might be obtained compared to high-dust SCR plus ceramic filter bag applications, if inlet tempera-ture is lower than the standard SCR inlet temperature.
• System pressure drop is in the range of ceramic filter bags. In comparison with ceramic filter bags plus SCR, catalytic filter bags feature a lower pressure drop.
Economics
• No investment and lifetime data could be obtained.
• Catalyst volume is considerably lower than for conventional SCR installations. Ceramic bag filter manu-facturing is expected to be more expensive than filter bag or simple ceramic bag filter manufacture.
• Catalyst lifetime is expected to be higher than high-dust SCR catalyst layers.
Driving force for implementation
• Multi-pollutant abatement technique.
Reference literature (selection)
Tri-Mer, product information on UltraCat ceramic filter systems, available at www.tri-mer.com, accessed on 19.09.2011.
Ness, S., et al.: “SCR Catalyst-Coated Fabric Filters for Simultaneous NOx and High-Temperature Particu-late Control”, in: Environmental Progress, 14 (1005) Issue 1, pp. 69-74.
For hot gas ceramic bag filters, see separate fact sheet.
9.4. Electron beam flue gas treatment
Development Status
Laboratory Scale
Pilot Plant Scale
Demonstr. Scale
Commercial Scale
Pollutant Emission Reduction Potential
Direct Emissions Indirect Emissions (Plant Efficiency)NOx SO2 PM CO2
o ++ o o -
Reference: BAT pulverized coal plant
Potential
• Low-dust NOx and SO2 cleaning technology for combustion flue gases without a catalyst.
Research Status
• Basic research was done in the 1980s to 1990s, when various test facilities were operated (Kim et al., 2009).
• No information on current research activities could be obtained.
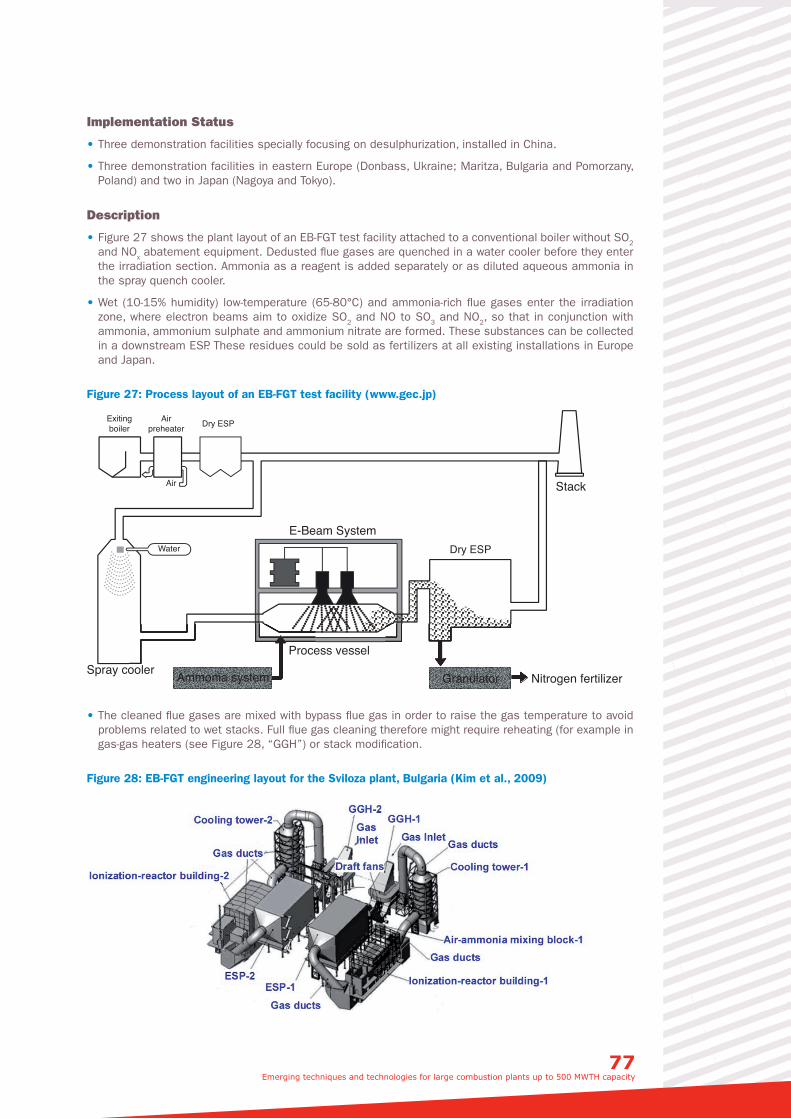
77 Emerging techniques and technologies for large combustion plants up to 500 MWTH capacity
Implementation Status
• Three demonstration facilities specially focusing on desulphurization, installed in China.
• Three demonstration facilities in eastern Europe (Donbass, Ukraine; Maritza, Bulgaria and Pomorzany, Poland) and two in Japan (Nagoya and Tokyo).
Description
• Figure 27 shows the plant layout of an EB-FGT test facility attached to a conventional boiler without SO2
and NOx abatement equipment. Dedusted flue gases are quenched in a water cooler before they enter the irradiation section. Ammonia as a reagent is added separately or as diluted aqueous ammonia in the spray quench cooler.
• Wet (10-15% humidity) low-temperature (65-80°C) and ammonia-rich flue gases enter the irradiation zone, where electron beams aim to oxidize SO2 and NO to SO3 and NO2, so that in conjunction with ammonia, ammonium sulphate and ammonium nitrate are formed. These substances can be collected in a downstream ESP. These residues could be sold as fertilizers at all existing installations in Europe and Japan.
Figure 27: Process layout of an EB-FGT test facility (www.gec.jp)
Exitingboiler
Airpreheater Dry ESP
Dry ESP
Air
Water
Spray cooler
E-Beam System
Process vessel
Stack
Nitrogen fertilizerGranulatorAmmonia system
• The cleaned flue gases are mixed with bypass flue gas in order to raise the gas temperature to avoid problems related to wet stacks. Full flue gas cleaning therefore might require reheating (for example in gas-gas heaters (see Figure 28, “GGH”) or stack modification.
Figure 28: EB-FGT engineering layout for the Sviloza plant, Bulgaria (Kim et al., 2009)
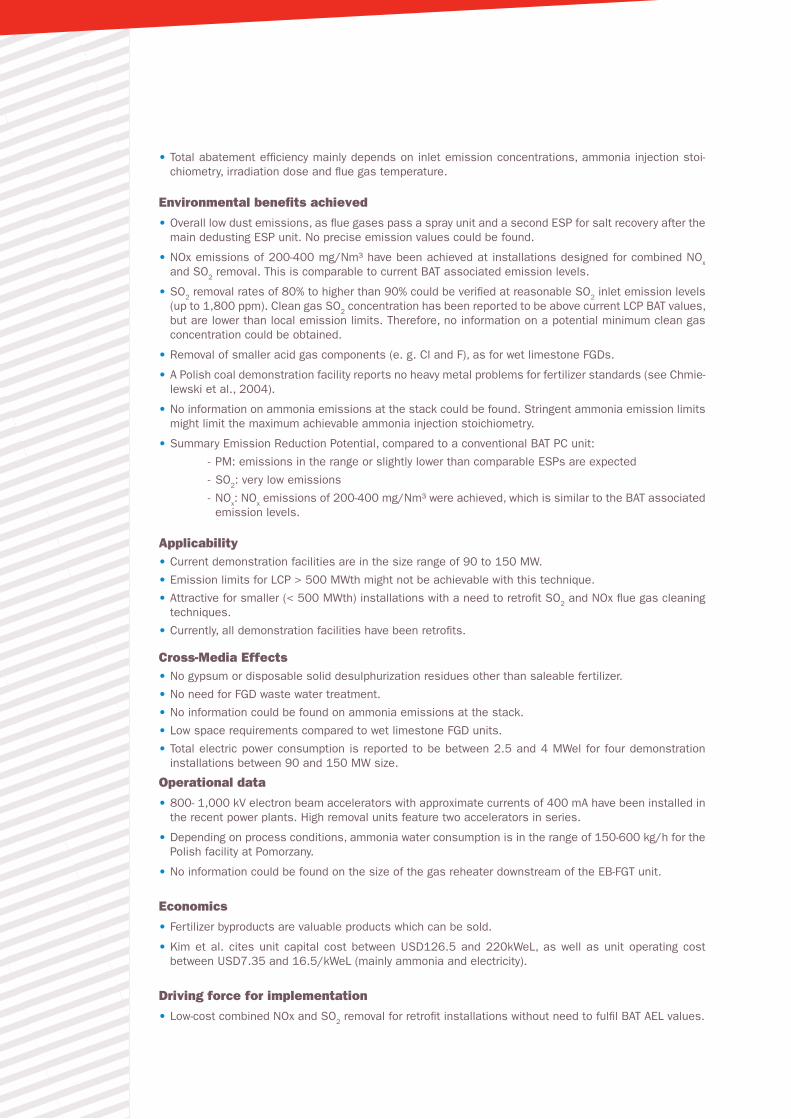
• Total abatement efficiency mainly depends on inlet emission concentrations, ammonia injection stoi-chiometry, irradiation dose and flue gas temperature.
Environmental benefits achieved
• Overall low dust emissions, as flue gases pass a spray unit and a second ESP for salt recovery after the main dedusting ESP unit. No precise emission values could be found.
• NOx emissions of 200-400 mg/Nm³ have been achieved at installations designed for combined NOx and SO2 removal. This is comparable to current BAT associated emission levels.
• SO2 removal rates of 80% to higher than 90% could be verified at reasonable SO2 inlet emission levels (up to 1,800 ppm). Clean gas SO2 concentration has been reported to be above current LCP BAT values, but are lower than local emission limits. Therefore, no information on a potential minimum clean gas concentration could be obtained.
• Removal of smaller acid gas components (e. g. Cl and F), as for wet limestone FGDs.
• A Polish coal demonstration facility reports no heavy metal problems for fertilizer standards (see Chmie-lewski et al., 2004).
• No information on ammonia emissions at the stack could be found. Stringent ammonia emission limits might limit the maximum achievable ammonia injection stoichiometry.
• Summary Emission Reduction Potential, compared to a conventional BAT PC unit:
- PM: emissions in the range or slightly lower than comparable ESPs are expected
- SO2: very low emissions
- NOx: NOx emissions of 200-400 mg/Nm³ were achieved, which is similar to the BAT associated emission levels.
Applicability • Current demonstration facilities are in the size range of 90 to 150 MW.
• Emission limits for LCP > 500 MWth might not be achievable with this technique.
• Attractive for smaller (< 500 MWth) installations with a need to retrofit SO2 and NOx flue gas cleaning techniques.
• Currently, all demonstration facilities have been retrofits.
Cross-Media Effects • No gypsum or disposable solid desulphurization residues other than saleable fertilizer.
• No need for FGD waste water treatment.
• No information could be found on ammonia emissions at the stack.
• Low space requirements compared to wet limestone FGD units.
• Total electric power consumption is reported to be between 2.5 and 4 MWel for four demonstration installations between 90 and 150 MW size.
Operational data
• 800- 1,000 kV electron beam accelerators with approximate currents of 400 mA have been installed in the recent power plants. High removal units feature two accelerators in series.
• Depending on process conditions, ammonia water consumption is in the range of 150-600 kg/h for the Polish facility at Pomorzany.
• No information could be found on the size of the gas reheater downstream of the EB-FGT unit.
Economics
• Fertilizer byproducts are valuable products which can be sold.
• Kim et al. cites unit capital cost between USD126.5 and 220kWeL, as well as unit operating cost between USD7.35 and 16.5/kWeL (mainly ammonia and electricity).
Driving force for implementation
• Low-cost combined NOx and SO2 removal for retrofit installations without need to fulfil BAT AEL values.
79 Emerging techniques and technologies for large combustion plants up to 500 MWTH capacity
Reference literature (selection)
Chmielewski, A. et al: “Operational experience of the industrial plant for electron beam flue gas treat-ment”, in: Radiation Physics and Chemistry, 71 (2004), pp. 439-442.
Doi, Y.; Nakanishi, I. and Konno, Y.: “Operational experience of a commercial scale plant of electron beam purification of flue gas”, in: Radiation Physics and Chemistry, 57 (2000), pp. 495-499.
Gerasimov, G. et al.: “Homogenous and heterogenous radiation induced NO and SO2 removal from power plants flue gases – modeling study”, in: Radiation Physics and Chemistry, 48 (1996), pp. 763-769.
Kim, J. et al.: “E-Beam Flue Gas Treatment Plant for “Sviloza Power Station” in Bulgaria, presented at: International Topical Meeting on Nuclear Research Applications and Utilization of Accelerators, Austria, 2009.
Kim, J.; Kim. Y. and Han, B.: “Electron-beam Flue-gas Treatment Plant for Thermal Power Station “Sviloza” AD in Bulgaria”, in: Journal of the Korean Physical Society, Vol. 59 No.6 (2011), pp. 3494-3498.
Namba, H. et al.: “Pilot-scale test for electron beam purification of flue gas from coal combustion boiler”, in: Radiation Physics and Chemistry, 46 (1995), pp. 1103-1106.
Japanese Advanced Environment Equipment, July 2002, last visited 1.2.2012, http://www.gec.jp/jsim_data/air/air_6/html/doc_148.html.
10. Techniques Which Have Not Been Considered
As mentioned in the introduction to this report, some additional techniques and technologies were brie-fly discussed but no thorough assessment was achieved by the EmTech50-500 group, for the following reasons.
(a) They are obviously still at laboratory scale and no emerging application could be foreseen before 2030 at large combustion plants.
(b) They clearly cover installations with thermal inputs far lower than 50 MWth and no application to the 50-500 MWth range could be foreseen before 2030.
(c) They do not cover the priority pollutants (e.g. abatement techniques dedicated to Hg only).
(d) They are not explicitly designed for large combustion plants, but for other sectors, such as refineries or the steel industry.
(e) Emerging techniques and technologies, previously identified by related reports (e.g. the 2006 LCP BRef), but no information on additional development or research activities or on commercial imple-mentation could be obtained by the subgroup.
These techniques are listed below. This list does not claim to be exhaustive.
- Ultra low NOx infrared burners
- Methane SCR
- Shell FGD process
- SELOX (H2S Removal)
- Activated coke for PCDD/F Removal in biomass appliances
- The use of additives for the abatement of alkaline emissions in biomass combustion
- Mercury removal with activated coke
- Indigo Agglomerator
- SOx-NOx-ROX-BOX
- COHPAC/TOXECON
- ZnO-based LCP flue gas cleaning
- NOXSO.
ABOUT ADEME
The French Environment and Energy Management Agency (ADEME) is a public agency under the joint authority of the Ministry for Ecology, Sustainable Development, Transport and Housing, the Ministry for Higher Education and Research, and the Ministry for Economy, Finance and Industry. The agency is active in the implementation of public policy in the areas of the environment, energy and sustainable development.
ADEME provides expertise and advisory services to businesses, local authorities and communities, government bodies and the public at large, to enable them to establish and consolidate their environmental action. As part of this work the agency helps finance projects, from research to implementation, in the areas of waste management, soil conservation, energy efficiency and renewable energy, air quality
and noise abatement.
www.ademe.frA
vril
2012 I
A
4 éd
ition
s 02
41
720
700
ADEME 20, avenue du GrésilléBP 90406 l 49004 Angers Cedex 01