emerging trends in airport-airline agreements · pdf filenegotiated with airlines ... charges...
TRANSCRIPT

Emerging Trends in Airport-Airline Agreements
AAAE/LeighFisher Rates and Charges Workshop
Phoenix, Arizona November 4, 2016
Sheri Ernico, Director, LeighFisher Jason Snowden, Director, LeighFisher

Discussion Topics
1. Forms of Airport-Airline Business Relationships
2. Airport Rates and Charges and Ratemaking Approaches
3. Negotiation and Planning Process
4. Trends in Airline Lease Negotiations
5. Per-Turn Fees
- Regulatory and Legal Basis
- Implementing and Calculating Fees

Forms of Airport-Airline Business Relationships

3 Emerging Trends in Airport-Airline Agreements Phoenix, Arizona, November 2016
Airport-Airline Business Relationship With or Without a Bilateral Agreement
AGREEMENT
Negotiated with airlines
Passenger airlines vs. cargo carriers
Agreements by definition include compromise
RATES BY RESOLUTION
Rates established through consultation
Ordinance and regulations
Permits and regulations
No airline agreement is required, and some airports operate without an agreement, but the vast majority of airports have agreements
Some airports have rates resolution with revenue sharing agreements (e.g., LAX, MCO)
HYBRID

4 Emerging Trends in Airport-Airline Agreements Phoenix, Arizona, November 2016
Airport-Airline Business Relationship Relatively Few U.S. Airports Set Rates by Ordinance/Resolution (Less than 20%)
1. Source for enplanements and hub Size: FAA, ACAIS CY 2015, Primary Airports, August 2016. There are 132 large, medium, and small hub airports.
2. On January 1, 2013, a new rate agreement went into effect at Los Angeles (LAX).
Source: Large, medium, and small hub U.S. Airports setting rates by resolution compiled by LeighFisher.
Airport Hub Size CY 2015 e.p.1 Time Under Resolution
Los Angeles International L 36,351,226 Since 19932
Phoenix Sky Harbor International L 21,351,445 > 30 years
Orlando International L 18,759,938 Effective November 20133
Boston Logan International L 16,290,323 > 30 years
Oakland International M 5,506,672 Since 2000
Raleigh-Durham International M 4,954,717 > 30 years
John Wayne Airport-Orange County M 4,945,175 > 20 years
Sacramento International M 4,714,723 Since June 2008
San Juan Luis Munoz Marin International M 4,218,785 > 20 years, but airport privatized March 2013
Omaha Eppley Airfield M 2,046,155 > 30 years
Charleston International S 1,669,960 Since 2001
Grand Rapids Gerald R. Ford International S 1,280,801 > 30 years
Long Beach /Daugherty Field S 1,220,906 At least 10 years
Des Moines International Airport S 1,156,450 Since January 1, 2014
Bill & Hillary Clinton National (Little Rock) S 958,510 Since 2009
Northwest Arkansas Regional S 629,903 Since January 1, 2015
Lexington Blue Grass S 606,977 Since 2001
Asheville Regional N 393,379 Since October 2016
Lehigh Valley International (Allentown, PA) N 320,544 Since 1993
Santa Barbara Municipal N 316,508 Since October 2007
Rapid City Regional N 264,170 Since 2015

5 Emerging Trends in Airport-Airline Agreements Phoenix, Arizona, November 2016
Airport-Airline Business Relationship Rates by Resolution
Any unilateral rate methodology must be designed to recover from the air carriers using the airport their fairly allocated share of airport costs in accordance with the U.S. Department of Transportation’s Policy Regarding Airport Rates and Charges, 78 Fed. Reg. 55330 (September 10, 2013), and other applicable law
Without an airline agreement, airline fees set by rate ordinance, resolution, regulation, or tariff
Governed by USDOT Rates and Charges Policy and case law
Key underlying principles and requirements:
― Expressed preference for local resolution
― Endeavor to be self-sustaining
― Rates must be “reasonable” and not “unjustly discriminatory”
― Cost allocation must be “transparent” and comply with USDOT rules
― Justification for significant changes in rate-making approach
― Must consult with airlines
― Compensatory rate-setting permitted without agreement
― Residual rate-setting not permitted without agreement

6 Emerging Trends in Airport-Airline Agreements Phoenix, Arizona, November 2016
Airport-Airline Business Relationship Why Have an Airline Agreement?
Specify what airlines can do at airport and what airport is obliged to do for airlines
Provide certainty in airline payments
― Costs in rate base
― Cost center structure
― Rents, fees, and charges
― Calculation methodologies
Prescribe airline role in capital decisions (Majority-In-Interest vs. consultation)
Set term: short unless airlines committing to major investments
Determine control over and use of gates and facilities (exclusive, preferential, common use)
Provide legal protection: indemnification, insurance, environmental, etc.
Primary Negotiation
Airline Payments
Capital Program Control
Facility Control

Airport Rates and Charges and Ratemaking Approaches

8 Emerging Trends in Airport-Airline Agreements Phoenix, Arizona, November 2016
Airport Rentals, Fees, and Charges Account for a Small Share of U.S. Scheduled Airline Operating Expenses (vs. labor and fuel)
Note: The figures do not include data for all airlines, such as commuter airlines operating aircraft with fewer than 60 seats. Such carriers are
exempt from filing certain financial information with DOT.
Source: U.S. DOT, Form 41 as compiled by LeighFisher, November 2016.
* Includes data for American, Alaska, JetBlue, Delta, Frontier, Spirit, United, US Airways, Virgin America, and Southwest.
Labor 29.7%
Fuel 19.9% Transport related expenses 13.9%
Outsourcing 8.6%
Maintenance 7.4%
Depreciation, 5.2%
Other 4.9%
Terminal rentals 3.1%
Landing fees 2.0%
Aircraft rentals 2.5%
Food 1.7%
Commissions 1.0%
U.S. Scheduled Passenger Airline Operating Expenses by Category (CY 2015)

9 Emerging Trends in Airport-Airline Agreements Phoenix, Arizona, November 2016
Airport Rates and Charges are Also More Predictable than Other U.S. Airline Operating Expenses
Note: The figures do not include data for all airlines, such as commuter airlines operating aircraft with fewer than 60 seats. Such carriers are
exempt from filing certain financial information with DOT. The historical data in the early 1980s is less reliable than the data for more recent years.
Source: U.S. DOT, Form 41 as compiled by LeighFisher, November 2016.
0.0%
5.0%
10.0%
15.0%
20.0%
25.0%
30.0%
35.0%1
98
0
198
1
198
2
198
3
198
4
198
5
198
6
198
7
198
8
198
9
199
0
199
1
199
2
199
3
199
4
199
5
199
6
199
7
199
8
199
9
200
0
200
1
200
2
200
3
200
4
200
5
200
6
200
7
200
8
200
9
201
0
201
1
201
2
201
3
201
4
201
5
Airport Rates and Charges as Percent of Operating Expenses
Fuel Costs as Percent of Operating Expenses

10 Emerging Trends in Airport-Airline Agreements Phoenix, Arizona, November 2016
Some Airlines Pay a Higher Share than Others Due to their Cost Structures and the Airports where they Operate
Source: U.S. DOT, Form 41 as compiled by LeighFisher, November 2016.
0.0%
1.0%
2.0%
3.0%
4.0%
5.0%
6.0%
7.0%
8.0%
9.0%
10.0%
Avera
ge
Sp
irit
Delt
a
US
Air
ways
Am
eri
ca
n
Un
ited
Ala
sk
a
JetB
lue
Vir
gin
Am
eri
ca
So
uth
west
Fro
nti
er
Terminal Landing Fees
Airport Rates and Charges as a Percent of Total Operating Expenses: U.S. Scheduled Passenger Airlines

11 Emerging Trends in Airport-Airline Agreements Phoenix, Arizona, November 2016
In Evaluating the Reasonableness of Airport Rates and Charges we Compare them to the Fare Revenues Generated at an Airport
Note: The figures do not include data for all airlines, such as commuter airlines operating aircraft with fewer than 60 seats. Such carriers are
exempt from filing certain financial information with DOT. The historical data in the early 1980s is less reliable than the data for more recent years.
Source: U.S. DOT, Form-41 as compiled by LeighFisher, November 2016.
0.0%
1.0%
2.0%
3.0%
4.0%
5.0%
6.0%
7.0%
8.0%
19
80
19
81
19
82
19
83
19
84
19
85
19
86
19
87
19
88
19
89
19
90
19
91
19
92
19
93
19
94
19
95
19
96
19
97
19
98
19
99
20
00
20
01
20
02
20
03
20
04
20
05
20
06
20
07
20
08
20
09
20
10
20
11
20
12
20
13
20
14
20
15
Airport Rates and Charges as % OperatingExpenses
Airport Rates and Charges as % FareRevenue
12 Emerging Trends in Airport-Airline Agreements Phoenix, Arizona, November 2016
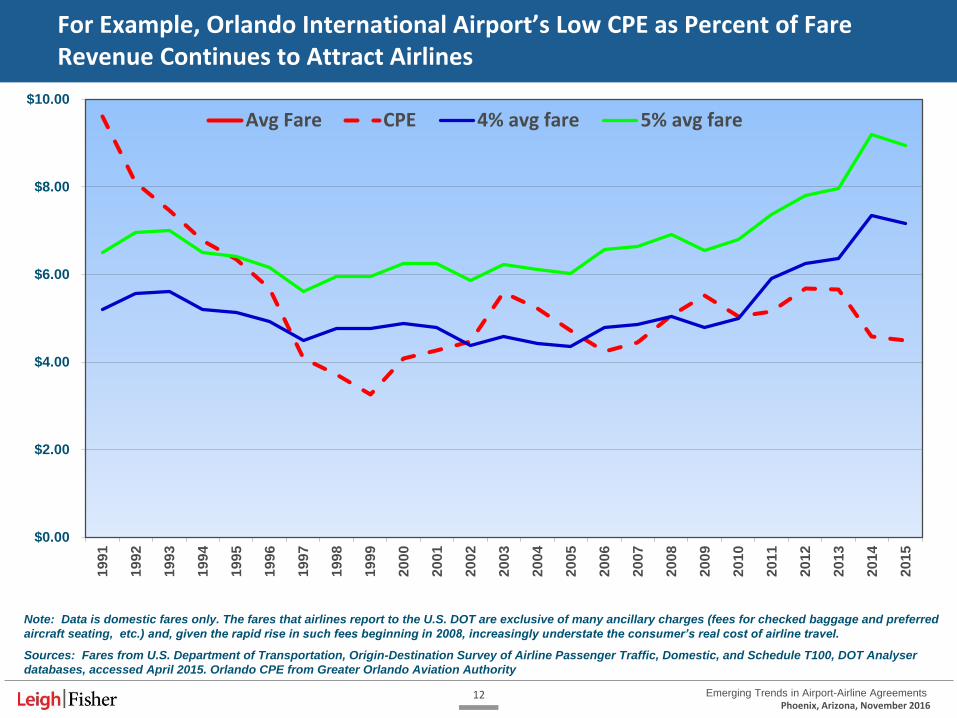
For Example, Orlando International Airport’s Low CPE as Percent of Fare Revenue Continues to Attract Airlines
$0.00
$2.00
$4.00
$6.00
$8.00
$10.001
99
1
19
92
19
93
19
94
19
95
19
96
19
97
19
98
19
99
20
00
20
01
20
02
20
03
20
04
20
05
20
06
20
07
20
08
20
09
20
10
20
11
20
12
20
13
20
14
20
15
Avg Fare CPE 4% avg fare 5% avg fare
Note: Data is domestic fares only. The fares that airlines report to the U.S. DOT are exclusive of many ancillary charges (fees for checked baggage and preferred
aircraft seating, etc.) and, given the rapid rise in such fees beginning in 2008, increasingly understate the consumer’s real cost of airline travel.
Sources: Fares from U.S. Department of Transportation, Origin-Destination Survey of Airline Passenger Traffic, Domestic, and Schedule T100, DOT Analyser
databases, accessed April 2015. Orlando CPE from Greater Orlando Aviation Authority

13 Emerging Trends in Airport-Airline Agreements Phoenix, Arizona, November 2016
Trends in Airline Business Relationships – Large Hubs
Rank LocidCY 2015
EnplanementsMethod
Airline
Agreement
Rates by
Ordinance or
Agreement
Term
(years)Expiration Airfield Terminal
Revenue
Sharing
1 ATL 49,340,732 Hybrid Yes A 7 6/30/3036 CCR CCR Yes
2 LAX 36,351,226 Compensatory Hybrid* O 10 12/31/2022 CCR CC Yes
3 ORD 36,305,668 Residual Yes A 7 5/11/2018 CCR CCR Yes
4 DFW 31,589,832 Compensatory Yes A 10 9/30/2020 CCR CC Yes
5 JFK 27,717,503 Compensatory Yes A Various Various Unit TBs No
6 DEN 26,280,043 Hybrid Yes A 30 2/28/2025 CCR CC Yes
7 SFO 24,190,549 Residual Yes A 10 6/30/2021 CCR+ CCR Residual
8 CLT 21,913,156 Hybrid Yes A 10 6/30/2026 CCR+ CC Yes
9 LAS 21,824,231 Residual Yes A 5 + 5 6/30/2020 CCR CCR Residual
10 PHX 21,351,445 Compensatory No O n.a. M/M Comp CC No
11 MIA 20,986,341 Residual Yes A 16 4/30/2017 Airport Residual CC Residual
12 IAH 20,595,874 Compensatory Yes A 20 12/31/2017 CCR CC No
13 SEA 20,148,980 Compensatory Yes A 5 12/31/2017 CCR CC Yes
14 MCO 18,759,938 Hybrid Hybrid* O 3 9/30/2019 CCR CC Yes
15 EWR 18,684,765 Compensatory Yes A Various Various Unit TBs No
16 MSP 17,634,252 Hybrid Yes A 10 12/31/2020 CCR CC Yes
17 BOS 16,290,323 Compensatory Yes O n.a. n.a. CCR CC No
18 DTW 16,255,507 Residual Yes A 30 9/30/2032 Airport Residual CC Residual
19 PHL 15,101,318 Residual Yes A 5 6/30/2020 CCR CCR Residual
20 LGA 14,319,924 Compensatory Yes A Various Various Unit TBs No
21 FLL 13,061,607 Residual Yes A 5 9/30/2016 CCR CCR Residual
22 BWI 11,738,828 Compensatory Yes A 5 6/30/2019 CCR Comp No
23 DCA 11,242,375 Hybrid Yes A 10 12/31/2024 Comp CC Yes
24 MDW 10,830,783 Residual Yes A 15 12/31/2027 CCR CC Yes
25 SLC 10,634,519 Hybrid Yes A 10 6/30/2024 CCR Comp Yes
26 IAD 10,363,918 Hybrid Yes A 3 12/31/2017 Comp CC Yes
27 SAN 9,985,739 Compensatory Yes A 5 6/30/2018 CCR CC No
28 HNL 9,479,083 Hybrid Yes A M/M M/M CCR CCR Yes
29 TPA 9,150,414 Hybrid Yes A 5 9/30/2020 CCR CC Yes
30 PDX 8,340,234 Hybrid Yes A 10 9/1/2027 CCR CCR Yes
* LAX and MCO have entered into rate and revenue sharing agreements, not airline use and lease agreements.
Legend: Residual Airport-wide residual calculation, or multi-cost center residual CCR Cost center residual
Compensatory Airport keeps nonairline revenues without sharing Comp Compensatory
Hybrid Compensatory with revenue sharing, and other features CC Commercial compensatory
Summary Methodology Form M/M Month-to-month
Residual 8 Ordinance 4
Compensatory 11 Agreement 26
Hybrid 11 30
30
Source: LeighFisher, November 2016.

14 Emerging Trends in Airport-Airline Agreements Phoenix, Arizona, November 2016
Trends in Airline Business Relationships – Medium Hubs
RankHub
SizeLocid City
CY 2014
Enplaned
Passengers
Former
Hub AirlineMethod
Airline
Agreement
Rates by
Ordinance or
Agreement
Term
(years)Expiration
Revenue
Sharing
31 M DAL Dallas 7,040,921 Hybrid Yes A 20 09/30/2028 Yes
32 M STL St. Louis 6,239,231 TWA/AA Residual Yes A 5 06/30/2016 Residual
33 M HOU Houston 5,937,944 Hybrid Yes A 25 06/30/2040 Yes
34 M AUS Austin 5,797,547 Compensatory Yes A 5 09/30/2014 No
35 M BNA Nashville 5,708,852 AA Hybrid Yes A 7 06/30/2022 Yes
36 M OAK Oakland 5,506,672 Hybrid Yes O m/m m/m Yes
37 M MSY New Orleans 5,329,696 Residual Yes A tbd Residual
38 M MCI Kansas City 5,135,127 BN/F9 Compensatory Yes A 8 03/31/2017 No
39 M RDU Raleigh 4,954,717 AA Compensatory No O n.a. n.a. No
40 M SNA Santa Ana 4,945,175 Compensatory Yes O 5 03/31/2016 No
41 M SJC San Jose 4,814,721 AA Hybrid Yes A 10 6/30/2017 Yes
42 M SMF Sacramento 4,714,723 Compensatory No O n.a. n.a. No
43 M SJU San Juan 4,218,785 AA Compensatory Yes O 15* 4/1/2028 No
44 M RSW Fort Myers 4,159,212 Hybrid Yes A 5 09/30/2018 Yes
45 M SAT San Antonio 4,091,389 Hybrid Yes A 4 09/30/2015 Yes
46 M CLE Cleveland 3,916,914 CO/UA Residual Yes A 35 12/31/2020 Residual
47 M PIT Pittsburgh 3,890,677 US Residual Yes A 30 05/18/2018 Residual
48 M IND Indianapolis 3,889,567 Residual Yes A 5 12/31/2015 Residual
49 M CMH Columbus 3,312,496 HP Hybrid Yes A 10 12/31/2019 Yes
50 M MKE Milwaukee 3,229,876 MW/F9/NW Residual Yes A 5 12/31/2015 Residual
51 M OGG Kahului 3,220,753 Hybrid Yes A m/m m/m Yes
52 M PBI West Palm Beach 3,113,485 Hybrid Yes A 13 09/30/2019 Yes
53 M CVG Cincinnati 3,036,697 DL Hybrid Yes A 5? 12/31/2020 Yes
54 M BDL Hartford 2,926,047 Compensatory Yes A 5 06/30/2020 Yes
55 M JAX Jacksonville 2,716,465 Residual Yes A 5 6/30/2017 Residual
56 M ANC Anchorage 2,525,876 Residual Yes A 10 06/30/2023 Residual
57 M BUF Buffalo 2,331,545 Compensatory Yes A 5 3/31/2019 No
58 M ABQ Albuquerque 2,323,850 Hybrid Yes A 5 06/30/2016 Yes
59 M ONT Ontario 2,089,781 Residual Yes A 25 2024 Residual
60 M OMA Omaha 2,046,155 Compensatory Yes O 1 12/31/2016 No
61 S OKC Oklahoma City 1,803,159 Compensatory Yes A 5 12/31/2018 No
10 Residual Airport-wide residual calculation, or multi-cost center residual Form
9 Compensatory Airport keeps nonairline revenues without sharing Ordinance 6
12 Hybrid Compensatory with revenue sharing, and other features Agreement 25
31 31
Source: LeighFisher, November 2016.

15 Emerging Trends in Airport-Airline Agreements Phoenix, Arizona, November 2016
Summary of Airline Business Relationships – Large and Medium Hubs
Source: LeighFisher, November 2016.
Large Hubs Medium Hubs Total
Metric Number Percent Number Percent Number Percent
Methodology
Residual 8 27% 10 32% 18 30%
Compensatory 11 37% 9 29% 20 33%
Hybrid 11 37% 12 39% 23 38%
30 100% 31 100% 61 100%
Form of Agreement
Ordinance 4 13% 6 19% 10 16%
Agreement 26 87% 25 81% 51 84%
30 100% 31 100% 61 100%
Trend away from residual systems as airports operate more like businesses
Blurring of distinctions between traditional rate-making approaches with significant number of hybrid approaches

16 Emerging Trends in Airport-Airline Agreements Phoenix, Arizona, November 2016
Trends in Airline Business Relationships – Small Hubs
RankHub
SizeLocid City
CY 15
EnplanementsAirfield Terminal
Revenue
Shairing
Airline
Agreement
or Rate
Ordinance
61 S BUR Burbank 1,973,869 Airport Residual Fixed (CPI adj) Residual AUA
62 S MEM Memphis 1,873,714 CCR CCR Yes AUA
63 S OKC Oklahoma City 1,803,159 CCR Comp No
64 S PVD Providence 1,763,672 Comp CC No AUA
65 S RIC Richmond 1,740,380
66 S CHS Charleston 1,669,960 Fixed CC No Ordinance
67 S RNO Reno 1,669,863 CCR CC Yes
68 S SDF Louisville 1,640,287 CCR CCR No AUA
69 S TUS Tucson 1,549,114 Airport Residual Fixed (CPI adj) Residual
70 S GEG Spokane 1,515,349 Airport Residual CCR Residual AUA
71 S ORF Norfolk 1,515,198 CCR Comp Yes AUA
72 S BOI Boise 1,487,764 CCR CCR
73 S KOA Kailua Kona 1,485,777 CCR CCR Yes AUA
74 S GUM Tamuning 1,420,500 Airport Residual Comp Residual AUA
75 S LIH Lihue 1,399,528 CCR CCR Yes AUA
76 S ELP El Paso 1,381,367 CCR CCR
77 S TUL Tulsa 1,359,562 CCR CC Yes AUA
78 S BHM Birmingham 1,325,891
79 S GRR Grand Rapids 1,280,801 Comp CC No Ordinance
80 S ALB Albany 1,276,743 CCR CC 50/50 sharing AUA
81 S LGB Long Beach 1,220,906 Ordinance
82 S ROC Rochester 1,177,983 CCR CCR AUA
83 S SFB Sanford 1,174,158
84 S DSM Des Moines 1,156,450 CCR CC No Ordinance
85 S DAY Dayton 1,041,731
86 S MHT Manchester 1,026,342 Comp Comp AUA
87 S SYR Syracuse 987,640
88 S SAV Savannah 980,531
89 S LIT Little Rock 958,510 CCR CC Yes Ordinance
90 S GSP Greenville Spartanburg 955,097
91 S PSP Palm Springs 947,713
92 S MYR Myrtle Beach 899,855
93 S PWM Portland 858,449
94 S TYS Tyson 848,390
95 S GSO Greensboro 848,249 CCR CC Yes AUA
96 S MSN Madison 826,640 Comp CC Yes AUA
97 S PIE Clearwater 819,962

17 Emerging Trends in Airport-Airline Agreements Phoenix, Arizona, November 2016
Trends in Airline Business Relationships – Small Hubs (continued)
RankHub
SizeLocid City
CY 15
EnplanementsAirfield Terminal
Revenue
Shairing
Airline
Agreement
or Rate
Ordinance
98 S CAK Akron 787,901
99 S PNS Pensacola 787,901
100 S ICT Wichita 773,526 CCR Comp Yes AUA
101 S HPN White Plains 757,424
102 S STT Charlotte Amalie 706,098
103 S FAT Fresno 694,994
104 S IWA Mesa 666,168
105 S XNA Bentonville 629,903 CCR CC No Ordinance
106 S ITO Hilo 627,171 CCR CCR Yes AUA
107 S SRQ Sarasota 607,428
108 S LEX Lexington 606,977 CCR CC Yes Ordinance
109 S ISP Islip 603,641
110 S COS Colorado Springs 593,217
111 S ACY Atlantic City 587,967
112 S MDT Harrisburg 587,047 CCR Fixed Yes AUA
113 S BTV Burlington 581,141
114 S CID Cedar Rapids 557,374 Comp Comp No AUA
115 S CAE Columbia 533,575
116 S HSV Huntsville 519,785
117 S MAF Midland 518,496
118 S BZN Bozeman 512,029
119 S JAN Jackson 497,042
120 S FSD Sioux Falls 493,520
121 S FAI Fairbanks 493,443
122 S GSN Saipan 455,232
123 S SGF Springfield 447,843
124 S EUG Eugene 447,803
125 S BLI Bellingham 447,691
126 S LBB Lubbock 443,230
127 S FAR Fargo 437,098
128 S ECP Panama City 428,704
129 S PGD Punta Gorda 421,157
130 S BIL Billings 420,422
131 S GCN Grand Canyon 419,538
132 S FNT Flint 411,763

18 Emerging Trends in Airport-Airline Agreements Phoenix, Arizona, November 2016
Examples of Recently Negotiated Airline Agreements 11 of 35 Retained Residual Regime; Shorter Terms
Residual 34%
Hybrid
Compensatory
Residual
Airport City
Hub
Size
AUA/
Reso Ratemaking
Term/
years Effective
MSP Minneapolis L AUA Retained hybrid 10 1/1/2011
DFW Dallas L AUA Full residual to hybrid 10 10/1/2010
LAS Las Vegas L AUA Retained residual 5+5 7/1/2010
SFO San Francisco L AUA Retained residual 10 7/1/2011
FLL Ft. Lauderdale L AUA Retained residual 5 10/1/2012
MDW Chicago-Midway L AUA Retained residual 15 1/1/2013
LAX Los Angeles L Reso Commercial compensatory, revenue sharing agreement 10 1/1/2013
DCA/IAD Washington, DC L AUA Retained hybrid (commercial compensatory w/ rev sharing, ECP) 10 1/1/2015
PHL Philadelphia L AUA Retained residual 2 7/1/2013
SEA Seattle L AUA Retained hybrid, rate resolution threatened 5 11/1/20131
MCO Orlando L Reso Commercial compensatory, revenue sharing agreement 3 11/1/2013
CLT Charlotte L AUA Retained hybrid (includes revenue sharing) 4 7/1/2012
SAN San Diego L AUA Commercial compensatory 5 7/1/2013
BWI Baltimore L AUA Commercial compensatory 5 7/1/2014
PDX Portland L AUA Retained hybrid (includes revenue sharing) 10 1/1/2015
SLC Salt Lake City L AUA Commercial compensatory w/ revenue sharing 10 7/1/2014
IND Indianapolis M AUA Retained residual 5 1/1/2010
JAX Jacksonville M AUA Retained residual 5 7/1/2012
MEM Memphis M AUA Retained residual, airlines can give back space annually 5 11/1/2012
ANC Anchorage M AUA Retained residual 10 7/1/2013
HOU Houston M AUA Commercial compensatory w/ revenue sharing ? 1/1/2013
OKC Oklahoma City M AUA Retained compensatory 5 1/1/2014
SLC Salt Lake City L AUA Retained hybrid 10 1/1/2014
MCI Kansas City M AUA Pure compensatory w/ airline maintenance surcharge 2 4/1/2014
CMH Columbus M AUA Commercial compensatory w/ revenue sharing 5 1/1/2015
BNA Nashville M AUA Full residual to hybrid 7 7/1/2015
TUL Tulsa S AUA Commercial compensatory w/ revenue sharing 5 7/1/2013
ORF Norfolk S AUA Compensatory w/ revenue sharing 5 7/1/2013
TUS Tucson S AUA Retained residual 3 10/1/2013
DSM Des Moines S Reso Hybrid to commercial compensatory 1 1/1/2014
MDT Harrisburg S AUA Fixed terminal rates w/ revenue sharing & ECP 5 1/1/2015
PBI Palm Beach, FL S AUA Commercial compensatory w/ revenue sharing 5 10/1/2014
ERI Erie N AUA Fixed terminal and landing fee rates, with ECP 4 1/1/2013
RAP Rapid City N Reso Compensatory for terminal, residual for airfield w/ revenue sharing 3 1/1/2015
GEG Spokane S AUA Retained residual 2 1/1/2016

Negotiation and Planning Process :
The “90/10” Rule

20 Emerging Trends in Airport-Airline Agreements Phoenix, Arizona, November 2016
Execution and Transition Airport Readiness and
Preparations for Agreement Execution of Agreement
“Operationalizing” Airport Obligations and Rights
Airline Engagement
Conceptual Airline Engagement Term Sheet Refinement in
Negotiations Lease Drafting and Refinement
in Negotiations
Planning Structuring, and Refining Airport
Strategies and Goals
Translating Goals into Negotiating Ranges and
Options Developing a Term Sheet
Airline Use and Lease Negotiation Process

21 Emerging Trends in Airport-Airline Agreements Phoenix, Arizona, November 2016
Developing a Capital Program is an Iterative Process

22 Emerging Trends in Airport-Airline Agreements Phoenix, Arizona, November 2016
Develop a Financial Model to Optimize the CIP Plan of Finance and Airline Ratemaking System
Capital Program Master Plan R&R Infrastructure Noise mitigation
Plan of Finance PFCs AIP/grants Internal funds Third party CFC Bond sizing
Debt Service Existing debt Short-term Long-term PFC-supported Amortization
M&O Expense Existing facilities Incremental/new
projects By cost center
Airline Revenues Terminal rents Baggage fees Landing fees Other
Non-Airline Revenues Parking Rental car Terminal
concessions Cargo Other
Capital Operating Financial Results Key Assumptions
Application of Revenues Cash flow Cash balances P&L by cost center
Debt Service Coverage Senior lien bonds Subordinate line bonds PFC bonds
Financial Targets Airline CPE Airline share of op revenues Debt service coverage Debt per enplanement Cash flow Liquidity (days cash on hand)
Traffic Space Occupancy Borrowing rates Investment rates Term of debt PFC eligibility PFC level CFC level Parking rates Inflation Staff levels Incremental O&M Sensitivity
analyses
Sensitivity Tests to evaluate risk tolerance

23 Emerging Trends in Airport-Airline Agreements Phoenix, Arizona, November 2016
Set Financial Targets for Your Airport
Source: Global Infrastructure & Project Finance Peer Study, Fitch Ratings, December 9, 2015.
2.98
1.58 1.541.68
1.93
1.54 1.53
1.89
0.00
0.50
1.00
1.50
2.00
2.50
3.00
3.50
ABC U.S. Hub Regional AA A Medium Small
Overview Traffic Profile Rating Category Hub Size
Debt Service Coverage
$8.40 $8.72
$9.45
$8.08
$9.95
$8.51 $8.99
$7.31
$-
$2.00
$4.00
$6.00
$8.00
$10.00
$12.00
ABC U.S. Hub Regional AA A Medium Small
Overview Traffic Profile Rating Category Hub Size
Cost per Enplanement
384
449
683
451
688
451
525
400
0
100
200
300
400
500
600
700
ABC U.S. Hub Regional AA A Medium Small
Overview Traffic Profile Rating Category Hub Size
Days Cash on Hand
$16.25
$78.00
$130.00
$66.00
$113.00
$76.00
$65.00 $68.00
$0
$20
$40
$60
$80
$100
$120
$140
ABC U.S. Hub Regional AA A Medium Small
Overview Traffic Profile Rating Category Hub Size
Debt per Enplaned Passenger

24 Emerging Trends in Airport-Airline Agreements Phoenix, Arizona, November 2016
What Happens When You Don’t Set Targets

25 Emerging Trends in Airport-Airline Agreements Phoenix, Arizona, November 2016
1. Term
2. Signatory Airlines - Affiliates, cargo carriers
- Minimum requirements to become signatory
3. Airline Premises - Exclusive, preferential, joint, and common use
- Preferential use conditions (use it or lose it, sharing, RON parking)
- Equalized gates (a gate is a gate)
4. Cost Centers
5. Rentals, Fees, and Charges - Specific rates and ratemaking methodology
- Rate base (amortization, debt service coverage)
- Common use formula
- Per-turn fees
- Revenue sharing/extraordinary coverage protection
- Non-signatory rates
6. Capital Improvement Consultation (vs. MII)
7. Legal Boilerplate (modernize)
Start With a Term Sheet

Trends in Airline Lease Negotiations

27 Emerging Trends in Airport-Airline Agreements Phoenix, Arizona, November 2016
Trends in Airport-Airline Lease Negotiations 1. Business Relationship
Increasing number of airports setting rates by resolution
Move away from long-term leases (10 years or longer) -- an area of mutual agreement between both airports and airlines
Airline consortiums to manage airline equipment (e.g., ORD, SFO, DTW, MDW, MIA)
Source: ACI-NA, 2015 Business Terms Survey, October 2015 (based upon 62 responses).

28 Emerging Trends in Airport-Airline Agreements Phoenix, Arizona, November 2016
Trends in Airport-Airline Lease Negotiations 2. Airport-wide Ratemaking Methodology
Move away from residual cost rate-making toward compensatory and hybrid methods with revenue sharing?
23% 24%
53%
29%
20%
51%
0%
10%
20%
30%
40%
50%
60%
Residual Compensatory Hybrid
U.S. Airport Ratemaking Methodology
2003 2015
Source: ACI-NA, 2015 Business Terms Survey, October 2015 (based upon 96 responses for 2003 and 70 for 2015).

29 Emerging Trends in Airport-Airline Agreements Phoenix, Arizona, November 2016
Trends in Airport-Airline Lease Negotiations 3. Landing Fee and Terminal Ratemaking Methodology (2015)
Source: ACI-NA, 2015 Business Terms Survey for 2015, October 2015.

30 Emerging Trends in Airport-Airline Agreements Phoenix, Arizona, November 2016
Trends in Airport-Airline Lease Negotiations 4. Common Use Holdroom and Bag Claim Charges (2015)
Move away from 20/80 common use formulas (per capita/passengers) to no or lower per capita allocation and combination of passengers and operations
Source: ACI-NA, 2015 Business Terms Survey for 2015, October 2015.

31 Emerging Trends in Airport-Airline Agreements Phoenix, Arizona, November 2016
Trends in Airport-Airline Lease Negotiations 5. Other Common Use Space Charges
Offering of per-turn fees for low frequency airlines that do not want to lease space/gates
Response from FAA to industry requests on per-turn fees
Establishing cost recovery security fees (security checkpoint, bag screening space, etc.)
Source: Fees, Rates, and Charges, Pittsburgh International Airport, January 1, 2016.

32 Emerging Trends in Airport-Airline Agreements Phoenix, Arizona, November 2016
Trends in Airport-Airline Lease Negotiations 6. MII Clauses
Move away from restrictive Majority-in-Interest (MII) provisions
Move towards less stringent MII clauses
Source: ACI-NA, 2015 Business Terms Survey, October 2015 (based upon 101 responses for 2003 and 62 for 2015).
49% 51%
58%
42%
0%
10%
20%
30%
40%
50%
60%
70%
MII No MII
U.S. Airport MII Clauses
2003 2015
Type of MII (2015)
33 Emerging Trends in Airport-Airline Agreements Phoenix, Arizona, November 2016
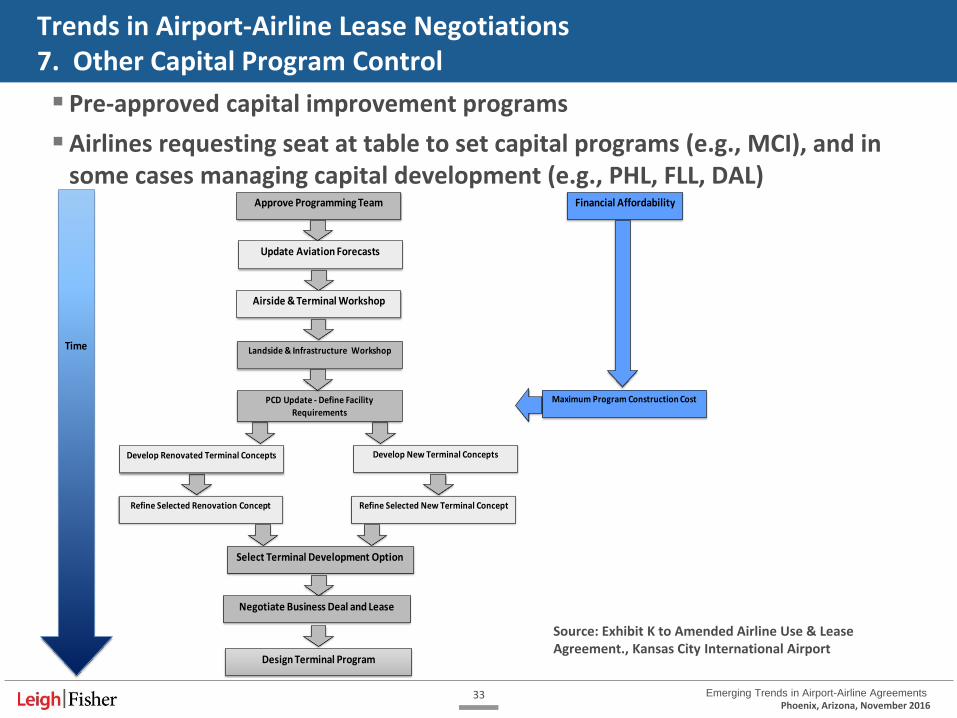
Source: Exhibit K to Amended Airline Use & Lease Agreement., Kansas City International Airport
Approve Programming Team
Update Aviation Forecasts
Airside & Terminal Workshop
Landside & Infrastructure Workshop
Develop Renovated Terminal Concepts Develop New Terminal Concepts
Refine Selected New Terminal ConceptRefine Selected Renovation Concept
Select Terminal Development Option
Negotiate Business Deal and Lease
Design Terminal Program
Financial Affordability
Maximum Program Construction Cost
Time
PCD Update - Define Facility
Requirements
Pre-approved capital improvement programs
Airlines requesting seat at table to set capital programs (e.g., MCI), and in some cases managing capital development (e.g., PHL, FLL, DAL)
Trends in Airport-Airline Lease Negotiations 7. Other Capital Program Control

34 Emerging Trends in Airport-Airline Agreements Phoenix, Arizona, November 2016
Trends in Airport-Airline Lease Negotiations 8. Facility Control
Move away from exclusive use to preferential and common use space/gates
More common use systems, including outbound baggage systems
Preserving the flexibility to reallocate or reassign exclusive use space to accommodate changing mix of airlines and market shares
Airlines “right-sizing” (returning space after bankruptcies, mergers, lease renewals)

35 Emerging Trends in Airport-Airline Agreements Phoenix, Arizona, November 2016
Trends in Airport-Airline Lease Negotiations 9. Other Provisions/Trends
Modernize legal boilerplate (environmental, insurance, indemnification)
Stronger payment and security features (bankruptcy protection)
FAA considering revisions to Rates & Charges Policy
Source: FAA, Feedback from Policy Regarding Airports Rates and Charges Listening Sessions, April 17, 2014.

Per-Turn Fees: Regulatory Basis and Calculations

37 Emerging Trends in Airport-Airline Agreements Phoenix, Arizona, November 2016
The only reference in the Rates and Charges Policy is: – 1.1.3 Airport proprietors should consider the public interest in establishing airport fees, and
aeronautical users should consider the public interest in consulting with airports on setting such fees
USDOT’s statutory responsibilities include: – Ensure… "the availability of a variety of … low-priced services without unreasonable
discrimination or unfair or deceptive practices (49 U.S.C. § 40101(a)(5)) – “Encourage[ing] entry …by new and existing air carriers and …strengthening of small air
carriers to ensure a more …competitive airline industry" (49 U.S.C. § 40101(a)(13))
Under airport competition plans, the USDOT encourages airports to retain common use gates for new entrants and expanding incumbents
Regulatory Basis for Per-Turn Fees
Little guidance under the USDOT Rates and Charges Policy for per-turn fees
“It is the fundamental position of the Department that the issue of rates and charges is best
addressed at the local level by agreement between users and airports…
“Airport proprietors and aeronautical users should consult and make a good-faith effort to reach
agreement. Absent agreement, airport proprietors are free to act in accordance with their
proposals, subject to review by the Secretary or the Administrator on complaint by the user . . ..” - U.S. DOT Policy Concerning Airport Rates and Charges, Introduction and Section 1.1.4

38 Emerging Trends in Airport-Airline Agreements Phoenix, Arizona, November 2016
Why is This an Issue?
Due to airline industry consolidation, smaller airports have little negotiating leverage; they need to retain existing and attract new service
Some network airlines are pushing for regimes that price the less-than-daily airlines out of the smaller markets, which is contrary to the “public interest” and the desire to have healthy competition
Low frequency airlines can’t afford to lease full ticket/gate modules
Setting a per-turn fee at a reasonable level, and adjusting as necessary:
― Promotes competition and fosters an encouraging environment for variety of business models and new entrants
― Accomplishes the airport’s obligation to serve the public (both airlines and travelers)
― Provides an airport with the means to remain financially self-sufficient
Alternatively, if the topic is approached from the reverse…
― If an airport does NOT maintain a reasonable per turn fee, it could be considered unjustly discriminatory - a de facto exclusion of low-frequency carriers from the market
Recent/future changes to the US airline structure give smaller communities fewer options

39 Emerging Trends in Airport-Airline Agreements Phoenix, Arizona, November 2016
1. “Arbitrarily” discriminating based on differential rates by concourse 2. Basing per-turn fees on unreasonable usage assumptions - 8 turns per gate per day 3. Offering per-turn fee to some airlines, but not others 4. Disproportionately shifting costs to signatory airlines by not including a fixed fee
component in their common use space allocation methodology 5. Imposing or threatening to impose ordinance rates is not good faith negotiations
What is A4A Saying?
A number of airports have “gone off reservation” – some airports are:

40 Emerging Trends in Airport-Airline Agreements Phoenix, Arizona, November 2016
Objectives for Per-Turn Fees
Offer competitive rates to attract and/or retain air service
1. Daily, low-frequency service
2. Less-than-daily service
3. Seasonal service
4. Charters
Avoid giving an incentive to signatory airlines to give back space
Provide a transparent and defensible policy that is reasonable and not unjustly discriminatory
Retain flexibility to apply to all airline business models
― Overflow activity for signatory airlines
― Low volume carriers

41 Emerging Trends in Airport-Airline Agreements Phoenix, Arizona, November 2016
Source: Airline Operating and Use Agreement, Des Moines International Airport.
Types of Terminal Space/Per-Turn Fee (ticket, common baggage, gates)
Ticketing/Queue, Baggage Systems, Gates (Holdrooms, Loading Bridges, Aircraft Apron)
Ticket Counters/Queue
Passenger Screening
Baggage Screening Inbound Baggage/ Baggage Claim
Gates = Holdrooms/ Loading Bridges/ Aircraft Parking

42 Emerging Trends in Airport-Airline Agreements Phoenix, Arizona, November 2016
Methodologies to Allocate Common / Joint Use Space
Units
― Passengers
― Operations
― Fixed or per capita
― Bags
― Time of use
Formulas
― Passengers / fixed (split equally among users)
80/20, 90/10, 85/15
― 100% passengers
― Passengers / operations – 50/50, 70/30
― Passengers / operations / fixed – 35/55/10
― Bags
Issues
― Turns per day
― Premium for non-signatories
― Limiting per-turn fee option to airlines flying less than [x] flights per week
Carve-outs/exceptions
― Affiliates
― Low volume carriers (e.g., 2% - 5% of passenger market share)

43 Emerging Trends in Airport-Airline Agreements Phoenix, Arizona, November 2016
Calculation Methodologies in General
Not all airports have formula-driven methodologies for setting per turn fees
A methodology is preferred, and helps an airport provide reasonable, transparent, and defensible fees; additionally, a fee set according to a methodology can be adjusted over time as other rates and charges are adjusted
Methodologies in the airport industry for setting per turn fees vary widely, but in our experience methods that are reasonable, transparent, and defensible generally fall into two categories
― Method A – Calculated using average cost, size, and operations at a typical gate
― Method B – Calculated using imputed average per turn cost for traditional carriers
The method for charging for joint use space is an important consideration when establishing the per turn fee
― Joint use space can be included in a bundled per turn fee and charged 100% on the basis of operations, or
― Joint use space can be separately charged under established methodology, or
― A separate passenger fee can be calculated to recover joint use costs

44 Emerging Trends in Airport-Airline Agreements Phoenix, Arizona, November 2016
Per-Turn Fees at Other Airports
Method A – Calculated using average cost, size, and operations at a typical gate
― TUL, CVG, PHX, LAX, and SEA
― Methods may include an explicit premium (CVG 1.25x) or implicit premium (TUL 3 turns per gate divisor)
― Per-turn fee could be completely “bundled” (inclusive of all terminal fees) or joint use fees could be charged separately (using 100/0 or other methods)
― Per-turn fees could be weighted for aircraft size, especially in situations where a “bundled” rate is charged (LAX fees range from 0.75x to 3.00x; SEA fees range from 0.50x to 2.00x)
Method B – Calculated using imputed average per turn cost for traditional carriers
― LEX determines the average signatory terminal cost per turn and then multiplies the average by a 1.6x premium to calculate the non-signatory per turn fee; the rate is “bundled” and joint use costs are included in the per-turn fee; the 1.6x premium is in recognition of non-signatory status and differences in aircraft size
Method C – Some airports charge a “market rate” per turn, which is annually adjusted for inflation (MDT)
45 Emerging Trends in Airport-Airline Agreements Phoenix, Arizona, November 2016
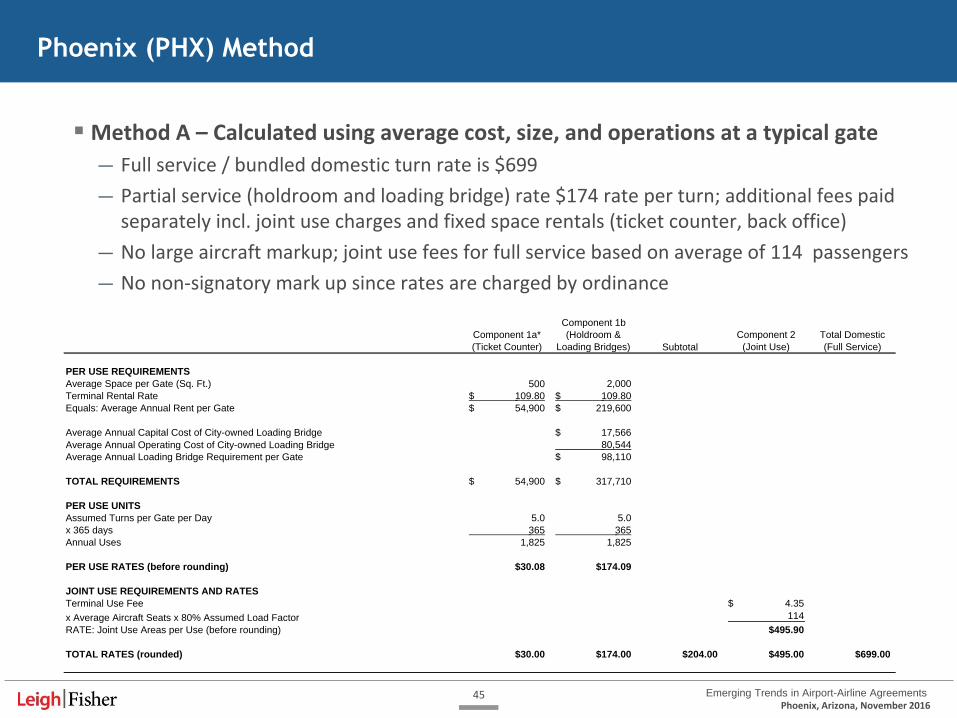
Phoenix (PHX) Method
Component 1b
Component 1a*
(Ticket Counter)
(Holdroom &
Loading Bridges) Subtotal
Component 2
(Joint Use)
Total Domestic
(Full Service)
PER USE REQUIREMENTS
Average Space per Gate (Sq. Ft.) 500 2,000
Terminal Rental Rate 109.80$ 109.80$
Equals: Average Annual Rent per Gate 54,900$ 219,600$
Average Annual Capital Cost of City-owned Loading Bridge 17,566$
Average Annual Operating Cost of City-owned Loading Bridge 80,544
Average Annual Loading Bridge Requirement per Gate 98,110$
TOTAL REQUIREMENTS 54,900$ 317,710$
PER USE UNITS
Assumed Turns per Gate per Day 5.0 5.0
x 365 days 365 365
Annual Uses 1,825 1,825
PER USE RATES (before rounding) $30.08 $174.09
JOINT USE REQUIREMENTS AND RATES
Terminal Use Fee 4.35$
x Average Aircraft Seats x 80% Assumed Load Factor 114
RATE: Joint Use Areas per Use (before rounding) $495.90
TOTAL RATES (rounded) $30.00 $174.00 $204.00 $495.00 $699.00
Method A – Calculated using average cost, size, and operations at a typical gate
― Full service / bundled domestic turn rate is $699
― Partial service (holdroom and loading bridge) rate $174 rate per turn; additional fees paid separately incl. joint use charges and fixed space rentals (ticket counter, back office)
― No large aircraft markup; joint use fees for full service based on average of 114 passengers
― No non-signatory mark up since rates are charged by ordinance

46 Emerging Trends in Airport-Airline Agreements Phoenix, Arizona, November 2016
Lexington (LEX) Method
Method B – Calculated using imputed average per turn cost for traditional carriers ― LEX offers a rate structure where carriers can elect to pay a “Per Turn Fee” or lease space
exclusively/preferentially in the traditional manner
― The Per Turn Fee rate is based on airport-wide average cost per turn with a premium multiplier
― It’s intended to reduce costs for low-frequency operators so as not to discourage even minimal amounts of air service, but yet become disadvantageous once a carrier reaches a certain level so that they move back to paying traditional rentals
Airline Code
Number of
Gates
Excl. and
Pref. Rent
Common Use
Rent Total Rent Annual Turns
Total Rent
per Turn
Reference Exhibit 7.0 Exhibit 7.0 Exhibit 5.0
American AA 1 357,614 378,676 736,290 1,830 402.34
Delta DL 2 608,381 1,113,442 1,721,823 4,553 378.17
United UA 2 186,522 300,824 487,346 1,653 294.82
US Airways US 1 139,496 530,184 669,680 2,928 228.72
Total 6 1,292,013$ 2,323,125$ 3,615,139$ 10,964 329.73$
Average (AA, DL, UA, US) 329.73$
Per Turn Fee Premium 1.50
Calculated Per Turn Fee (rounded) 500.00$

www.leighfisher.com Sheri Ernico LeighFisher 555 Airport Boulevard, Suite 300 Burlingame, CA. 20190 (650) 593-3003 [email protected]