emerging trends in real estate 2014 highly regarded and widely read 35th annual outlook based on...
TRANSCRIPT


Emerging Trends in Real Estate 2014
• Highly regarded and widely read
• 35th annual outlook
• Based on over 1,000 interviews and surveys of industry leaders
• Sponsored by PwC and the Urban Land Institute
• Investment and development trends
• Capital markets
• Metro areas
• Property sectors

Fundamentals continue to improve…slowly… across all property groups and property markets
Development is back, and 2014 will likely be the last year when minimal new supply is delivered
Reaching an inflection point where valuations will be driven by fundamentals, not capital markets
Interest rates anticipated to increase; it’s the pace and magnitude of the increase that is uncertain
Capital goes wide, in more markets and taking on more risk
Gaining Momentum

Investment Prospects by Asset Class
Investment-grade bonds
Commercial mortgage backed securities
Publicly listed equities
Publicly listed property companies or REITS
Publicly listed homebuilders
Private direct real estate investments
1 2 3 4 5 6 7 8 9
4.62
4.96
5.49
5.57
5.78
6.43
2014 2013 2012 2011
Source: Emerging Trends in Real Estate surveys
Abysmal Fair Excellent

2005 2006 2007 2008 2009 2010 2011 2012 2013 20140
1
2
3
4
5
6
7
8
9
5.05.4 5.4 5.3
4.74.3
4.6
5.35.6 5.8
Investment Prospects: Average Market ScoreInvestment Prospects
Excellent
Fair
Poor
Source: Emerging Trends in Real Estate surveys

Issues of importance for real estateEconomic/Financial Issues
none moderate great
Source: Emerging Trends in Real Estate 2014 surveyNote: Based on US respondents only
Federal fiscal deficits/imbalances
Global economic growth
Tax policies
Inflation
Income and wage growth
Interest rates
Job growth
0 1 2 3 4 5
3.50
3.60
3.61
3.68
4.11
4.46
4.63

Issues of importance for real estateReal Estate/Development Issues
none moderate great
Source: Emerging Trends in Real Estate 2014 surveyNote: Based on US respondents only
Infrastructure funding/development
Future home prices
Refinancing
Land costs
Vacancy Rates
Construction costs
0 1 2 3 4 5
3.58
3.58
3.59
3.85
3.99
4.03

“2014 should be a year when we see real estate fundamentals improve in sectors beyond the very healthy multifamily sector—and in a number of markets—to a point where we could see above-inflation-rate rental growth”

A “stubbornly high” unemployment rate
Uncertainty over government regulation and fiscal policy
Likely increase in the cost of both equity and debt capital
Economic uncertainty in the Euro-zone
China’s moderating economic growth
Headwinds Facing the Real Estate Industry

“Good if not great” job growth in industries with high real estate utilization including: energy, technology, health care, medical research, education, and financial services
Increasing corporate profits
Continuing recovery in the single-family housing industry
Historically low interest rates currently
Tailwinds Benefiting the Real Estate Industry

Industry profitability expected to continue to improve
Interest rates anticipated to increase
Dependence on cap rate compression to drive value to be replaced by rent growth and vacancy declines
Markets are expected to be “well supplied” with both equity and debt capital
Emerging Trends: Key Trends/Drivers for 2014

Opportunities to develop property finally appear in sectors other than multifamily
Industry begins to understand changing needs of both Gen Y and the baby boomers
Needs of end users of commercial space continue to evolve
The single family housing market continues to make a positive contribution to the overall economy
Emerging Trends: Key Trends/Drivers for 2014

Prospects for profitability by percentage of respondents
2010 2011 2012 2013 20140%
10%
20%
30%
40%
50%
60%
70%
80%
Abysmal to Poor
Modestly Poor to Modestly Good
Good to Excellent
Source: Emerging Trends in Real Estate surveysNote: Based on US respondents only

Capital markets

Prospects by Investment Category/Strategy
Distressed Debt
Distressed Properties
Core Investments
Core-plus Investments
Opportunistic Investments
Development
Value-added Investments
0 1 2 3 4 5 6 7 8 9
4.80
4.99
5.53
5.95
6.13
6.15
6.32
Abysmal Fair ExcellentSource: Emerging Trends in Real Estate 2014 survey
Note: Based on US respondents only
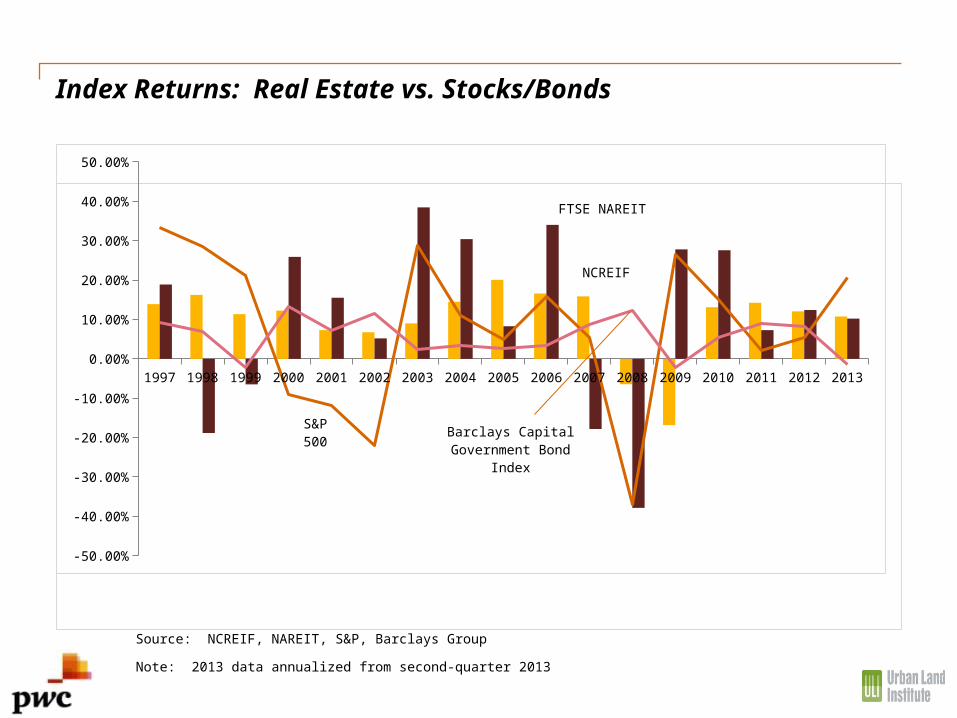
Index Returns: Real Estate vs. Stocks/Bonds
1997 1998 1999 2000 2001 2002 2003 2004 2005 2006 2007 2008 2009 2010 2011 2012 2013
-50.00%
-40.00%
-30.00%
-20.00%
-10.00%
0.00%
10.00%
20.00%
30.00%
40.00%
50.00%
FTSE NAREIT
NCREIF
S&P 500 Barclays Capital Gov-
ernment Bond Index
Source: NCREIF, NAREIT, S&P, Barclays Group
Note: 2013 data annualized from second-quarter 2013

NCREIF Cap Rates vs. U.S. Ten-Year Treasury Yields
Source: NCREIF, Moody’s Analytics, Federal Reserve Board
*Ten-year Treasury yields based on average of the quarter, 2013Q2 average is as of July 2013
Note: Cap rate based on four-quarter moving average of current-value cap rate
1990
Q1
1990
Q4
1991
Q3
1992
Q2
1993
Q1
1993
Q4
1994
Q3
1995
Q2
1996
Q1
1996
Q4
1997
Q3
1998
Q2
1999
Q1
1999
Q4
2000
Q3
2001
Q2
2002
Q1
2002
Q4
2003
Q3
2004
Q2
2005
Q1
2005
Q4
2006
Q3
2007
Q2
2008
Q1
2008
Q4
2009
Q3
2010
Q2
2011
Q1
2011
Q4
2012
Q3
2013
Q2
-4.00%
-2.00%
0.00%
2.00%
4.00%
6.00%
8.00%
10.00%
12.00%
Cap Rate
10-Year Treasury*
Spread

Equity and Debt Capital Balance Outlook
Substantially undersupplied
Moderately undersupplied
In balance
Modestly oversupplied
Substantially oversupplied
4.4%
26.0%
43.4%
23.5%
2.7%
1.8%
17.1%
26.9%
40.5%
13.7%
Equity capital for investing Debt capital for acquisitionsSource: Emerging Trends in Real Estate 2014 surveyNote: Based on US respondents only

Debt capital for development and refinancing
Substantially under-supplied
Moderately undersupplied
In balance
Modestly oversupplied
Substantially oversupplied
3.1%
24.1%
52.2%
17.2%
3.4%
15.9%
42.9%
30.2%
10.4%
0.7%
Debt capital for development Debt capital for refinancing
Source: Emerging Trends in Real Estate 2014 surveyNote: Based on US respondents only

Debt Underwriting Standards Forecast
2011
2012
2013
2014
29.8%
33.0%
39.1%
17.4%
29.2%
35.1%
41.5%
39.4%
41.0%
31.9%
19.4%
43.3%
More rigorous Remain the same Less rigorous
Source: Emerging Trends in Real Estate 2014 surveyNote: Based on US respondents only

Emerging trends barometer 2014
2004 2005 2006 2007 2008 2009 2010 2011 2012 2013 2014
Buy
SellHold
Source: Emerging Trends in Real Estate surveysNote: Based on US respondents only
Excellent
Poor
Fair
Abysmal
Good

Change in Availability of Equity Capital for Real Estate
Public Equity REITs
Private REITs
Private Local Investors
Private Equity/Opportunity/Hedge Funds
Institutional Investors/Pension Funds
Foreign Investors
0 1 2 3 4 5 6 7 8 9
5.38
5.70
6.00
6.12
6.18
6.43
Very large decline Stay the Same Very large increase
Equity source
Source: Emerging Trends in Real Estate 2014 surveyNote: Based on US respondents only

Change in Availability of Debt Capital for Real Estate
Government Sponsored Enterprises
Mortgage REITs
Non-Bank Financial Institutions
Mezzanine Lenders
Insurance Companies
Commercial Banks
Securitized Lenders/CMBS
0 1 2 3 4 5 6 7 8 9
4.55
5.54
5.95
6.00
6.03
6.12
6.24
Very large decline Stay the Same Very large increase
Lending source
Source: Emerging Trends in Real Estate 2014 surveyNote: Based on US respondents only

CMBS Revival Continues
CMBS 2013 issuance expected to exceed $80 billion
CMBS 2014 issuance anticipated to exceed $100 billion
CMBS lenders continue to fill the gaps left by conventional lenders in terms of:
--deal size (under $25 million) and
--property location (secondary versus solely primary locations)

Commercial Banks
Regional and local banks are expected to become increasingly active as their balance sheets improve
National banks, searching for opportunities, will increasingly compete on a regional and local basis
Development and construction loans will become increasingly available for borrowers with strong credentials and track records, and with substantial pre-leasing

1991
1991
1992
1993
19
9419
94
1995
1996
19
9719
97
1998
1999
20
0020
00
2001
2002
20
0320
03
2004
2005
20
0620
06
2007
2008
20
0920
09
2010
2011
20
122,
012
0%
2%
4%
6%
8%
10%
12%
14%
16%
18%
Construction and development loans noncurrent rate
Multifamily mortgages noncurrent rate
Commercial mortgages noncurrent rate
Bank Real Estate Loan Delinquency Rates
Source: Federal Deposit Insurance Corp.
Note: Delinquent loans defined her as those that are noncurrent, either 90 days or more past due or in noncurrent status
*as of second quarter 2013

1990
1990
1991
1992
1993
1993
1994
1995
1996
1996
1997
1998
1999
1999
2000
2001
2002
2002
2003
2004
2005
2005
2006
2007
2008
2008
2009
2010
2011
2011
2012
2013
0
1
2
3
4
5
6
7
8
Delinquency
Life insurers mortgage delinquency rates
Source: Moody’s Analytics, American Council of Life Insurers
In-foreclosure
%

Mezzanine Financing
Interviewees and survey participants seem of two minds regarding the roll of mezzanine financing in 2014
Some interviewees predict an “increase in B-piece, mezzanine, and debt funds to fill gaps in transaction structure” and “an increase in the use of mezzanine financing combined with higher-cost senior debt.”
“The biggest question on mezzanine is where the returns are going to be. If mezzanine rates don’t increase enough and we don’t feel we’re getting paid enough, we’ll stop. At a 200 [basis point] difference, we don’t think we’re getting paid for the risk.”

Markets to watch
More markets begin to look attractive

Growing Strength Across Many Metro Areas
Investment Prospects Development Prospects Homebuilding Prospects0%
10%
20%
30%
40%
50%
60%
70%
41%
16%
6%
57%
39%
28%
65%
47%
59%
Percent of markets ranked moderately good or better
201220132014
Source: Emerging Trends in Real Estate 2014 surveyNote: Based on US respondents only

1. San Francisco
2. Houston
3. San Jose
4. New York
5. Dallas/Ft. Worth
6. Seattle
7. Austin
8. Miami
9. Boston
10. Orange County, CA
7.0
7.0
6.8
6.8
6.8
6.8
6.7
6.6
6.6
6.6
6.9
6.6
6.7
6.6
6.4
6.4
6.3
6.4
6.4
6.2
7.7
7.5
7.4
7.2
7.4
7.2
7.3
7.1
6.9
6.9
Top 10 total rank2014
Investment Development Homebuilding
Source: Emerging Trends in Real Estate 2014 surveyNote: Based on US respondents only

11. Denver
12. Nashville
13. Los Angeles
14. San Antonio
15. San Diego
16. Charlotte
17. Raleigh/Durham
18. Salt Lake City
19. Portland, OR
20. Minneapolis/St. Paul
6.5
6.5
6.5
6.3
6.5
6.4
6.3
6.4
6.5
6.3
6.1
6.2
6.2
6.1
5.9
5.9
5.9
6.0
5.9
6.3
6.8
6.8
6.7
6.8
6.7
6.8
6.8
6.5
6.3
5.9
Next 10 markets2014
Investment Development Homebuilding
Source: Emerging Trends in Real Estate 2014 surveyNote: Based on US respondents only

Outlook improves for more markets
Markets with Investment Prospects of Good or Better
2011 2012 2013 2014
New York City Austin Austin Austin
Washington D.C. Boston Boston Boston
New York City Houston Dallas/Ft. Worth
San Francisco New York City Houston
San Jose San Francisco Miami
Seattle San Jose New York City
Washington D.C. Seattle Orange County
Portland
San Francisco
San Jose
Seattle

Changing positions Best and worst
Las V
egas
Sacram
ento
Atla
nta
Inla
nd E
mpir
e
Phoenix
St. L
ouis
India
napolis
Tam
pa/S
t. P
etersburg
Nashville
San A
ntonio
Alb
uquerque
Milw
aukee
Balt
imore
Rale
igh/D
urham
Honolu
lu/H
aw
aii
Vir
gin
ia B
each/N
orfolk
Westchester/F
air
field
Okla
hom
a C
ity
Northern N
ew
Jersey
Washin
gton, D
C
-15
-10
-5
0
5
10
15
20
Rank Change from 2013
Position change
Source: Emerging Trends in Real Estate surveysNote: Based on US respondents only

The impact of uncertainty and new supplyfor Washington, DC
2004 2005 2006 2007 2008 2009 2010 2011 2012 2013 20140.00
1.00
2.00
3.00
4.00
5.00
6.00
7.00
8.00
9.00
0
5
10
15
20
25
30
Rank Score
The outlook for Washington, DC succumbs to fed fatigue
Market Rank
Investment Score
Excellent
Fair
Poor
Source: Emerging Trends in Real Estate surveysNote: Based on US respondents only

Top 10 investment markets
2014 2013 Rank Change
1. Houston 7.00 6.84 +4
2. San Francisco 6.98 7.21 -1
3. New York 6.84 7.14 -1
4. Seattle 6.83 6.72 +2
5. San Jose 6.78 6.89 -2
6. Dallas/ Fort Worth 6.76 6.47 +4
7. Austin 6.69 6.71 -
8. Boston 6.64 6.85 -4
9. Orange County, CA
6.60 6.48 -
10. Miami 6.57 6.47 +1

Top 10 development markets
2014 2013 Rank Change
1. San Francisco 6.88 6.87 -
2. San Jose 6.75 6.58 +1
3. Houston 6.64 6.36 +2
4. New York 6.58 6.76 -2
5. Miami 6.38 5.89 +6
6. Dallas/Fort Worth 6.37 6.20 +1
7. Seattle 6.36 6.13 -1
8. Boston 6.35 6.31 -29. Minneapolis/St. Paul
6.27 5.06 +16
10. Austin 6.25 6.40 -6
Source: Emerging Trends in Real Estate 2014 surveyNote: Based on US respondents only

Top 10 homebuilding markets
2014 2013 Rank Change
1. San Francisco 7.74 6.80 -
2. Houston 7.48 6.15 +4
3. San Jose 7.40 6.58 -1
4. Dallas/Fort Worth 7.36 5.86 +6
5. Austin 7.34 6.26 -
6. New York 7.19 6.42 -3
7. Seattle 7.19 6.14 -
8. Miami 7.06 5.44 +8
9. Boston 6.87 6.05 -1
10. Orange County, CA 6.85 5.91 -1
Source: Emerging Trends in Real Estate 2014 surveyNote: Based on US respondents only

Markets: 2014 emerging trendsMarkets: 2

East coast
Boston 6.6
Washington DC5.9
New York 6.8
Providence 4.3
Pittsburgh 5.5
Philadelphia 5.6
Northern NJ 5.9
Westchester/Fairfield, CT 5.5
Baltimore 5.1

West coast
Seattle 6.8
San Francisco 7.0
Los Angeles 6.5
Portland 6.5
San Jose 6.8
Sacramento 5.0
Inland Empire 5.9
Orange County 6.6San Diego 6.5
Honolulu 5.7

Southwest
Las Vegas 5.5
Phoenix 6.1
Tucson 5.1
Albuquerque 4.6
Oklahoma City 4.8
Denver 6.5
Dallas 6.8
Houston 7.0
Austin 6.7
San Antonia 6.3
Salt Lake City 6.4

Southeast
Atlanta 6.1
New Orleans 4.5
Charlotte 6.4
Raleigh/Durham 6.3
Nashville 6.5 Memphis 4.5
Virginia Beach/Norfolk 5.2

Florida
Miami 6.6
Jacksonville 5.0
Tampa 6.0
Orlando 5.9

Midwest
Minneapolis 6.3
Kansas City 5.3
St. Louis 5.2
Chicago 6.1
Indianapolis 5.3
Cincinnati 5.0
Columbus 4.9
Cleveland 4.2
Milwaukee 4.8 Detroit 3.1

Property type outlook
Industrial leads the pack

Industrial takes the top spot
Retail
Office
Apartment Residential (Rental)
Hotels
Industrial/Distribution
0.00 1.00 2.00 3.00 4.00 5.00 6.00 7.00 8.00 9.00
5.72
5.76
6.14
6.23
6.45
Investment Prospects for major commercial property types
Source: Emerging Trends in Real Estate 2014 surveyNote: Based on US respondents only
Abysmal Fair Excellent

Subsector outlook shows diversity of recovery
Suburban Office
Regional Malls
Apartment Rental--high-income
Central City Office
Limited-Service Hotels
Warehouse Industrial
0.00 1.00 2.00 3.00 4.00 5.00 6.00 7.00 8.00 9.00
4.93
4.95
5.29
5.72
5.92
6.00
6.08
6.11
6.17
6.30
6.56
Investments prospects for commercial subsectors in 2014
Source: Emerging Trends in Real Estate 2014 surveyNote: Based on US respondents only
Abysmal Fair Excellent

Commercial development begins to look up
Office
Retail
Hotels
Apartment Residential (Rental)
Industrial/Distribution
0 1 2 3 4 5 6 7 8 9
4.58
4.63
5.31
5.52
6.74
Prospects for major commercial property types in 2014
Source: Emerging Trends in Real Estate 2014 surveyNote: Based on US respondents only
Abysmal Fair Excellent

Development prospects reflect where market is strongest
Regional Malls
Suburban Office
Power Centers
Full-Service Hotels
R&D Industrial
Central City Office
Neigh./Community Shopping Ctrs.
Limited-Service Hotels
Apartment Rental--moderate-income
Apartment Rental--high-income
Warehouse Industrial
0 1 2 3 4 5 6 7 8 9
3.43
3.55
3.92
4.96
5.11
5.14
5.23
5.52
6.00
6.25
6.44
Prospects for commercial subsectors in 2014
Source: Emerging Trends in Real Estate 2014 surveyNote: Based on US respondents only
Abysmal Fair Excellent
