emily a ferenczi charu ramakrishnan daniel j lisa a...
TRANSCRIPT

Principles for applying optogenetic tools derived from directcomparative analysis of microbial opsins
Joanna Mattis1,2,7, Kay M Tye1,7, Emily A Ferenczi1,2,7, Charu Ramakrishnan1, Daniel JO’Shea1,2, Rohit Prakash1,2, Lisa A Gunaydin1,2, Minsuk Hyun1, Lief E Fenno1,2, VivianaGradinaru1,3, Ofer Yizhar1,4, and Karl Deisseroth1,2,3,5,6
1Department of Bioengineering, Stanford University, Stanford, California, USA
2Neuroscience Program, Stanford University, Stanford, California, USA
3CNC Program, Stanford University, Stanford, California, USA
4Department of Neurobiology, Weizmann Institute of Science, Rehovot, Israel
5Department of Psychiatry and Behavioral Sciences, Stanford University, Stanford, California,USA
6Howard Hughes Medical Institute, Stanford University, Stanford, California, USA
Abstract
Diverse optogenetic tools have allowed versatile control over neural activity. Many depolarizing
and hyperpolarizing tools have now been developed in multiple laboratories and tested across
different preparations, presenting opportunities but also making it difficult to draw direct
comparisons. This challenge has been compounded by the dependence of performance on
parameters such as vector, promoter, expression time, illumination, cell type and many other
variables. As a result, it has become increasingly complicated for end users to select the optimal
reagents for their experimental needs. For a rapidly growing field, critical figures of merit should
be formalized both to establish a framework for further development and so that end users can
readily understand how these standardized parameters translate into performance. Here we
systematically compared microbial opsins under matched experimental conditions to extract
essential principles and identify key parameters for the conduct, design and interpretation of
experiments involving optogenetic techniques.
© 2012 Nature America, Inc. All rights reserved.
Correspondence should be addressed to K.D. ([email protected]).7These authors contributed equally to this work.
Note: Supplementary information is available on the Nature Methods website.
Author ContriButionsJ.M., K.M.T., E.A.F., C.R., R.P., O.Y. and K.D. contributed to study design and data interpretation. J.M. coordinated all experimentsand data analysis. J.M., K.M.T., E.A.F., D.J.O., R.P. and L.E.F. contributed to acquisition of electrophysiological data. C.R. cloned allconstructs, cultured primary neurons, performed transfections and managed viral packaging processes. D.J.O. wrote custom analysisscripts and analyzed all electrophysiological data. M.H. contributed to data analysis. J.M., K.M.T., C.R., L.A.G. and V.G. contributedto the histological processing and fluorescence imaging. K.D. supervised all aspects of the work. J.M., K.M.T., E.A.F. and K.D. wrotethe paper.
COMPETING FINANCIAL INTERESTSThe authors declare no competing financial interests.
Published as: Nat Methods. ; 9(2): 159–172.
HH
MI A
uthor Manuscript
HH
MI A
uthor Manuscript
HH
MI A
uthor Manuscript

Optogenetics1,2 integrates genetic targeting and optical stimulation to achieve temporally
precise manipulation of genetically and spatially defined cell types in intact tissue, and has
influenced the study of the central nervous system and other systems across a broad range of
model organisms and behaviors3,4. The adoption of optogenetics has been facilitated by the
emergence of single-component (that is, with no exogenous cofactor required5), genetically
targetable, microbial (type I) ‘opsin’ genes, encoding proteins that respond to illumination
by certain wavelengths of light with depolarizing currents, hyperpolarizing currents or
specified signal-transduction events3,4.
Since the first demonstrations that microbial opsins could be used to control action
potentials6–9, the optogenetic toolbox has expanded to offer researchers an increasingly
powerful and diverse selection of opsins. However, this process has also made it
increasingly challenging to conclude which tool might be optimal for a given experiment.
To draw these conclusions, researchers require two broad classes of information.
First, it is essential to understand the important properties of microbial opsins and how these
properties vary across opsin type. It is difficult to extract a rigorous comparison from the
current literature because previously published studies differ in confounding variables that
contribute to differences in performance (including expression method, vector backbone,
promoter, temperature, light power density and stimulation protocols). There has not been a
broad empirical comparison under standardized conditions that allows isolated comparison
of the tools themselves, rather than of the experimental parameters.
Second, it is important to understand how differences in these properties may result in
differences in the ability to elicit or inhibit neural activity. Indeed, most papers introducing
new opsin genes have also included evidence of improved functionality, often highlighting
the advantage of one or several key properties. But not only do different papers highlight
different aspects of performance, confounding experimental variables make it difficult to
compare results from even a single performance measure across datasets. For example, the
biophysical properties of the specific cell type will determine how the photocurrent is
transformed into a change in membrane voltage and also how that change in membrane
potential affects action-potential firing.
To begin to address these issues, we compared, in parallel, depolarizing and hyperpolarizing
optogenetic tools, under conditions chosen for relevance to the mammalian nervous system.
We then investigated the ability of depolarizing tools to elicit spikes in pyramidal cells and
to drive fast-spiking cells at high frequencies as well as the ability of hyperpolarizing tools
to inhibit action potentials in pyramidal cells. Given the complexity of the subject, this work
will not answer all questions about performance under all possible circumstances, which will
still inevitably be contingent on many experimental factors and will need to be addressed for
each specific experimental condition. Rather, our analysis is intended to provide a starting
point: to compare properties and performance under specific experimental conditions, to
identify critical parameters, to develop a framework of principles that organize the currently
available tools and to guide characterization of future tools.
Mattis et al. Page 2
Nat Methods. Author manuscript; available in PMC 2014 September 17.
HH
MI A
uthor Manuscript
HH
MI A
uthor Manuscript
HH
MI A
uthor Manuscript

RESULTS
Depolarizing tools and properties
Channelrhodopsins are cation channels that can give rise to neuronal depolarization when
activated by light. Channelrhodopsin-2 (ChR2), isolated from the algae Chlamydomonas
reinhardtii, can depolarize neurons and evoke precisely timed action potentials7–10. The
subsequently developed depolarizing tools, ChR2 point mutants10–16, channelrhodopsins
from other algal species identified using genomic strategies17,18 and chimeras constructed
by combining channelrhodopsins11,19–21, range widely in their photo-current wavelength
selectivity, kinetics and/or magnitudes. Here we compare microbial opsin genes that enable
elicitation of precisely timed action potentials in response to light and exclude step-function
opsins (SFOs), a distinct class of depolarizing tool that exhibits bistable photocurrents used
to modulate excitability11,15.
Light-evoked spiking is a function of the size and kinetics of the photocurrent, together with
the cell’s biophysical response to that photocurrent. We first quantify these photocurrent
properties under voltage clamp and then compare performance in eliciting spikes under
current clamp. We note some initial principles that govern the experimental setup to follow:
first, to elicit spikes, these channelrhodopsins must open rapidly in response to a light pulse,
conduct enough photocurrent to bring the neuron past the spiking threshold with precise
timing after light onset and then close rapidly after the pulse to allow the neuron to
repolarize. Second, photocurrents typically desensitize in response to sustained light; this
effect can cause spike ‘failures’ if photocurrents are reduced to subthreshold amounts. To
elicit consistent firing throughout prolonged pulse trains, channelrhodopsins should
therefore exhibit minimal desensitization during light and/or rapid recovery from
desensitization in darkness. Third, for some applications, particularly experiments in vivo, it
may be important to modulate a large or distant tissue volume using low intensity light, in
which case the relationship between photocurrent and light intensity becomes critical.
We first characterized, side by side, the major strongly expressing depolarizing
channelrhodopsins that have been reported, which fall into three genetic classes (Fig. 1a).
The first class consists of wild-type ChR2 and ChR2 mutants with several single-amino-acid
substitutions: ChR2(H134R) (ChR2R10,12), ChR2(E123A) (ChETAA
13), ChR2(T159C)
(TC14), ChR2(E123T/ T159C) (ChETATC14) and ChR2(L132C) (CatCh16). The second
class comprises hybrids formed from combining different segments of ChR1 and ChR2:
ChIEF19, which has an I170V amino acid substitution relative to ChR1, channelrhodopsin
fast receiver (FR20) and channelrhodopsin green receiver (GR21). The third class consists of
hybrids formed by combining ChR1 and VChR1 (a ChR variant from Volvox carteri),
termed C1V1, including the mutants C1V1(E162T) (C1V1T11) and C1V1(E122T/E162T)
(C1V1TT11) (see Supplementary Table 1 for a summary of depolarizing tool backbones,
mutations and naming convention). We compared photocurrent properties in transfected
cultured hippocampal pyramidal neurons. We packaged all opsin genes identically in a
lentiviral backbone, driven by the mouse excitatory neuron–specific CaMKIIoc (Camk2a)
promoter and fused in frame with the gene encoding enhanced YFP (eYFP), enabling direct
visualization of transfected neurons (Fig. 1b).
Mattis et al. Page 3
Nat Methods. Author manuscript; available in PMC 2014 September 17.
HH
MI A
uthor Manuscript
HH
MI A
uthor Manuscript
HH
MI A
uthor Manuscript
We tested these depolarizing tool variants under voltage-clamp conditions, analyzing factors
that contribute to photocurrent amplitude. Because many photocurrent properties are
dependent on light intensity, we matched light power density across experiments, at an
irradiance (5 mW mm−2) chosen to mimic typical effective and safe experimental conditions
at target neurons in vivo4. Although most uses of these depolarizing tools involve pulsed
light, the response to constant light (Fig. 1c and Supplementary Fig. 1a) provides crucial
insight into the same channel dynamics that underlie the response to any pattern of light
stimulation, with increasing relevance for longer and higher frequency stimulation patterns
which, in the limit, approach the constant-light condition. The macroscopic photocurrent is a
result of the aggregate activity of the membrane-resident channel population, giving rise to a
peak photocurrent followed by a smaller steady-state photocurrent owing to a proportion of
the population shuttling to the desensitized state22,23. Based on the action spectra (Fig. 1d),
we performed subsequent characterizations using 560-nm light for C1V1T and C1V1TT, and
blue light (470 nm) for all other channelrhodopsins, although we noted a moderate red-shift
in ChETATC, as previously observed14.
Compared to ChR2, most depolarizing tools had similar mean peak photocurrents (1–1.5
nA), although ChETAA photocurrents were significantly smaller (<0.5 nA) and C1V1T
photocurrents were significantly larger than ChR2 (P < 0.05; Fig. 1e and Supplementary
Fig. 1b). However, pointing to one of the most important challenges faced when aiming to
achieve performance consistency, we observed that ChR2 displayed the most desensitization
or the lowest steady-state/peak ratio (0.30 ± 0.01 (values throughout are mean ± s.e.m.),
Supplementary Fig. 1c), resulting in significantly smaller steady-state photocurrents than all
other tools except for ChETAA (P < 0.001–0.05). In contrast, CatCh, ChIEF and GR had the
highest steady-state/peak ratios (>0.75), demonstrating capability for stable photocurrent
responses across prolonged illumination. Although cells expressing different opsins differed
significantly in the mean total fluorescence from these eYFP fusion proteins, with ChR2R,
ChETAA and ChETATC being the brightest (P < 0.001), this measure was not a good
predictor of group differences in photocurrents among opsins; there was also significant
variation in photocurrent/fluorescence ratio, with CatCh, ChIEF, C1V1T and C1V1TT
showing the highest ratios (P < 0.001–0.01; Supplementary Fig. 1d,e).
Because photocurrent peak timing results from the balance between activation and
desensitization of the proteins (Fig. 1f), we next examined the kinetics of those processes
most relevant to the temporal precision and stability of the photocurrent response. ChR2 had
the fastest time to peak, and CatCh, ChIEF, GR, C1V1T and C1V1TT were significantly
slower (>15 ms, P < 0.001, Supplementary Fig. 1f). As activation and desensitization occur
simultaneously, photocurrents are expected to peak more rapidly if desensitization rate is
faster. We measured desensitization kinetics (τdes; Supplementary Fig. 1g) with a
monoexponential fit of the photocurrent transition from peak to steady state, and indeed the
desensitization kinetics were highly correlated with time to peak (R2 = 0.53, Spearman
correlation coefficient R = 0.77, P < 0.01; Fig. 1f).
We next explored the kinetics of recovery from desensitization in darkness, another
important determinant of photocurrent stability in response to pulsed light. We delivered two
1-s light pulses separated by varying intervals of darkness (Δt); for each light pulse, we
Mattis et al. Page 4
Nat Methods. Author manuscript; available in PMC 2014 September 17.
HH
MI A
uthor Manuscript
HH
MI A
uthor Manuscript
HH
MI A
uthor Manuscript
quantified ΔI, the difference between the peak and steady-state photocurrent magnitude (Fig.
1g). We divided ΔI from the second pulse (ΔI2) by ΔI from the first pulse (ΔI1) and plotted
the ratio against Δt (Fig. 1g). We excluded CatCh, ChIEF and GR from this analysis because
they had high (>75%) steady-state/peak ratios (very little desensitization), which prevented
accurate measurement of this parameter and rendered measurement of this parameter less
functionally relevant. The data were well described by a bi-exponential fit (R2 of 0.77–0.98),
from which we quantified time required for 50% recovery from desensitization
(Supplementary Fig. 1h). ChETAA had significantly faster recovery (P < 0.05), and
ChETATC and FR both trended in that direction; ChR2R and C1V1T recovery was
significantly slower (P < 0.01).
Finally, we measured off kinetics (τoff), the rate of channel closure at the end of the light
pulse. Fast off kinetics are important for avoiding sustained depolarization between light
pulses. We calculated τoff from a monoexponential fit of the decay of the photocurrent after
light offset. As τoff has been shown to depend on parameters including pulse duration9, we
used a short (3-ms) light pulse, a typical duration for eliciting spikes in vivo (Fig. 1h). The
proteins had widely varied off kinetics: compared to ChR2 (11.6 ± 0.4 ms), under these
conditions ChETAA trended toward more rapid deactivation (7.5 ± 0.4 ms), ChETATC,
ChIEF, FR and GR had similar kinetics (10–17 ms), and the remaining tools were slower; in
particular CatCh and C1V1T were significantly slower (both ∼60 ms, P < 0.001).
An additional critical consideration for in vivo use is activation at low light, for modulation
of large volumes of tissue or minimally invasive stimulation of cells far from the light
source11. We therefore quantified photocurrent responses across a range of light power
densities, ∼0.1–20 mW mm-2. Although we focus this analysis on peak and steady-state
photocurrent magnitudes, we note that light power density greatly affects not only the
photocurrent size but also many other features characterized above, including steady-state/
peak ratio, time to peak (quantified for ChR2 in Supplementary Fig. 1i) and desensitization
kinetics, as seen in the representative ChR2 photocurrent responses (Fig. 1i).
We measured both peak and steady-state photocurrents across the range of light power
densities and fit the data with a one-site specific binding curve (R2 = 0.34–0.82; Fig. 1i) as
has been used previously19. For safety reasons we did not push to saturating light intensities,
so we did not constrain the peak value of the fit; we therefore extrapolated the maximal peak
and steady-state photocurrents achievable with unbounded light intensity, ChIEF showing
the largest predicted peak (1,740 ± 140 pA) and steady state (1,540 ± 110 pA,
Supplementary Fig. 1j). Both peak and steady-state photocurrents increased with light power
density, but steady-state photocurrents saturated more quickly, resulting in a lower steady-
state/peak ratio at higher light power densities.
Absolute (non-normalized) photocurrents help define the ‘operational’ light sensitivity of
the different opsins, providing insight into practical cell performance at different light power
densities. ChIEF, for example, has the highest photocurrent peak and steady state at higher
light power densities, whereas ChR2 shows peak photocurrents that are moderate and
steady-state photocurrents that are among the smallest. However, these absolute
photocurrent values are highly subject to protein expression levels under our specific
Mattis et al. Page 5
Nat Methods. Author manuscript; available in PMC 2014 September 17.
HH
MI A
uthor Manuscript
HH
MI A
uthor Manuscript
HH
MI A
uthor Manuscript
experimental conditions (transfected cultured neurons, CaMKIIα promoter and so on). To
focus on differences independent of expression, we normalized photocurrents in each cell
(Supplementary Fig. 1k,l) and used the curve fit to calculate the light power density required
to achieve half-maximal activation (EPD50 or effective power density for 50% activation,
analogous to an EC50; Fig. 1i), a measure of sensitivity independent of protein expression.
Compared to ChR2 (EPD50 for the peak was 1.3 ± 0.2 mW mm−2), the ChETAA peak
photocurrent was less sensitive (3.1 ± 0.3 mW mm−2, P < 0.001), whereas those for CatCh
and C1V1T were more sensitive (∼0.4 ± 0.1 mW mm−2, P < 0.05).
Differences in EPD50 (population light sensitivity) may arise from differences in intrinsic
protein light sensitivity (the efficiency with which individual molecules are activated by
light24) or from differences in off kinetics. At lower light intensities a smaller fraction of the
pool is recruited in the beginning of the pulse, so there is a larger pool of molecules in the
closed state, which can continue to be recruited as the light pulse continues; moreover, with
slow off kinetics, members of the population of opsins on a cell will accumulate in the open
state as the light pulse continues. In fact, τoff and EPD50 were highly correlated (R2 = 0.84,
Spearman correlation coefficient R = −0.91, P < 0.001; Fig. 1j), suggesting that population
light sensitivity is dominated by off kinetics, although intrinsic light sensitivity may account
for deviations from the curve. This correlation supports a theoretical tradeoff between off
kinetics (precision of spiking) and sensitivity (volume of activation).
To summarize experimentally important characteristics of the depolarizing tools, we plotted
τoff against peak and steady-state photocurrents (Fig. 1j), both calculated from 1-s pulses of
∼5 mW mm-2 light. These summary plots can be used as a starting point to guide opsin
choice for experiments with different stimulation paradigm timing and patterns (which will
help determine the relevance of the peak versus the steady state), and with different
requirements for photocurrent size and kinetics.
Evoking spiking in pyramidal cells in vitro
We next compared the same depolarizing tools under current clamp to investigate evoked
spiking in pyramidal cells. As ChETAA had small photocurrents in this preparation (not
consistently larger than the rheobase of pyramidal cells25), and the GR activation spectrum
limits combinatorial experiments relative to the C1V1 tools without providing a
photocurrent advantage, we excluded those two opsins from this analysis, focusing on
ChR2, ChR2R, TC, ChETATC, CatCh, ChIEF, FR, C1V1T and C1V1TT. Although subsets
of these depolarizing tools have previously been compared14,16,19,26, to our knowledge no
empirical study to date has attempted the broader comparison.
Because we performed these experiments separately from those in Figure 1, we first verified
that steady-state photocurrent values were comparable (Supplementary Fig. 2a). Although
we could not directly measure peak photocurrents owing to escaped spikes (we collected
previous data in the presence of sodium-channel blockers, which could not be used in these
experiments), we also calculated expected peak values based on the steady-state/peak ratios
from the previous dataset (Supplementary Fig. 2b). We first compared the health of opsin-
expressing cells; relative to eYFP-transfected controls, all opsin-expressing cells trended
toward larger mean holding currents, with significant differences reached for ChIEF (P <
Mattis et al. Page 6
Nat Methods. Author manuscript; available in PMC 2014 September 17.
HH
MI A
uthor Manuscript
HH
MI A
uthor Manuscript
HH
MI A
uthor Manuscript
0.01), C1V1T (P < 0.01) and C1V1TT (P < 0.05). ChIEF-expressing cells also had
significantly lower input resistance and membrane capacitance (P < 0.05 for both;
Supplementary Fig. 2c–e). As these lower input resistances could impede spiking in
response to a given input, we compared spiking fidelity of opsin- and eYFP-expressing cells
in response to trains of short (5-ms) 400-pA current injections over a range of frequencies
(Supplementary Fig. 2f). eYFP-expressing cells trended toward more successful spiking at
higher pulse frequencies, and two-way ANOVA revealed a significant interaction between
cell population and spiking success across frequencies (F54,738 = 1.83; P = 0.0004).
However, Bonferroni post-tests of spiking performance relative to eYFP were not significant
for any opsin at any frequency.
We stimulated cells with trains of 40 pulses (2-ms pulse width) ranging from 5 Hz to 100
Hz, at 20 mW mm−2, 6 mW mm−2 and 2 mW mm−2 (Fig. 2a). The performance of some
tools, such as ChR2, deteriorated markedly with decreasing light power densities, whereas
that of others remained stable or even (in the case of CatCh) improved. Bonferroni post-tests
between ChR2 and CatCh showed that, although CatCh performed significantly worse than
ChR2 at high light intensities (P < 0.01 at 10 and 20 Hz), it performed better than ChR2 at
low light intensities (P < 0.05 at 5 and 10 Hz), consistent with previous reports16. A likely
explanation is the difference in light sensitivity, with ChR2 (which has a higher EPD50)
creating insufficient photocurrent to generate reliable spikes at lower light power densities.
As commonly observed, we also noted that spiking failures tended to occur later in the pulse
train for most of these optogenetic tools, as seen in a representative ChR2 trace (Fig. 2b). To
quantify spiking stability over time, to which we refer as ‘temporal stationarity’, we divided
the pulse train into quartiles and calculated the number of successful spikes in each quartile
(Fig. 2b and Supplementary Fig. 2g). One possible explanation for these late failures is
insufficient photocurrent toward the end of the pulse train, owing to photocurrent
desensitization. However, slow off kinetics could also cause spike failures owing to
interactions with the host cell repolarization and spike-firing mechanisms, particularly at
higher frequencies. To explore this factor, we chose photocurrent-matched cells expressing
the faster tools ChIEF and FR, and the slower tool CatCh, and examined spike performance
across frequencies (Fig. 2c). CatCh elicited spiking at lower frequencies but suffered from
more spike failures at high frequencies, though even the same CatCh-expressing cell could
spike at high frequency in response to injection of current pulses.
It has been hypothesized that the CatCh photocurrent activates calcium-dependent BK
channels that could help repolarize the cell16; pipette solutions could mask such an effect
through altered calcium buffering. We therefore repeated these experiments for both CatCh
and ChR2R, comparing evoked spiking in whole-cell versus cell-attached modes under
identical stimulation conditions (Fig. 2d and Supplementary Fig. 3). We observed no
significant differences in performance between those two methods when expressing either
opsin, and ChR2R outperformed CatCh at the two higher light power densities (Bonferroni
post-tests: P < 0.01 at 10 Hz, 20 mW mm−2 and P < 0.01 at 20 Hz, 6 mW mm−2; Fig. 2d and
Supplementary Fig. 3).
Mattis et al. Page 7
Nat Methods. Author manuscript; available in PMC 2014 September 17.
HH
MI A
uthor Manuscript
HH
MI A
uthor Manuscript
HH
MI A
uthor Manuscript
CatCh-expressing cells displayed a larger sustained depolarization (plateau potential), which
we quantified across all opsins and conditions (Fig. 2e and Supplementary Fig. 4). This is an
important issue to address because plateau potentials can lead to spike failures by impairing
the voltage-dependent de-inactivation of host-cell sodium channels; ChETA mutations have
previously been shown to virtually eliminate the plateau potential in fast-spiking
interneurons13, but left unclear the best strategy to use for pyramidal neurons because those
ChETAs did not give rise to strong photocurrents in cultured pyramidal cells (Fig. 1). We
found that among strongly expressing opsins in pyramidal cells, mean plateau potentials
were highly correlated with off kinetics (R2 = 0.81, Spearman’s correlation coefficient R =
0.97, P < 0.001) but not with either steady-state (R2 = 0.03, Spearman’s correlation
coefficient R = 0.13, P = 0.66) or projected peak photocurrent magnitudes (R2 = 0.02,
Spearman’s correlation coefficient R = 0.23, P = 0.74; Fig. 2f). For example, CatCh plateau
potentials were significantly larger than for ChR2 at all frequencies above 5 Hz (P < 0.001,
Bonferroni post-test; Supplementary Fig. 4); ChIEF and TC appeared to most effectively
normalize the plateau potential in these cells19,26, but all of these tools displayed a
pronounced frequency-dependent emergence of missed spikes compared with current
injection (Supplementary Fig. 5), consistent with the idea that finite off kinetics can lead to
difficulty driving pyramidal neurons at high frequency owing to accumulation of plateau
potentials. Indeed, this is a cell type–specific phenomenon: fast-spiking cells will continue
to spike in the presence of a sustained depolarizing current, whether electrically or optically
induced, whereas pyramidal cells are more susceptible to depolarization block
(Supplementary Fig. 6).
As we performed this analysis at room temperature (20–22 °C) and because
channelrhodopsin kinetics accelerate markedly with temperature, the difference between
current-evoked and light-evoked spiking may be smaller in vivo or in warmed solution.
Another recent comparison of the functional properties of four depolarizing tools (ChR2,
ChR2R, TC and ChETATC) across a similar range of frequencies and light power densities
also reported large plateau potentials at high frequencies and light intensities, correlated with
poor spiking performance14. In general higher-fidelity spiking had been seen in that study14
at higher frequencies; this effect may be attributable to the higher recording temperature
(29–31 °C), highlighting the importance of direct experimental comparison under matched
conditions.
Finally, we analyzed parameters of spiking precision: the proportion of light pulses that
evoked multiple spikes, the mean spike latency (the time from light onset to spike threshold)
and the mean latency spread across a pulse train (Fig. 2g and Supplementary Fig. 7a–c). In
pyramidal neurons, ChIEF, ChETATC and FR consistently displayed the lowest latency, and
latency spread across trains, over different stimulation conditions (Supplementary Fig. 7).
Ultrafast depolarizing tools and properties
Next we aimed to identify the most promising optogenetic tools for evoking precise and
very-high-frequency spikes in fast-spiking cells. ChR2(E123T/H134R) (ChETATR) is a
standard tool currently used for eliciting high-frequency stimulation and has already been
shown to out-perform ChR2 in driving stimulation up to 200 Hz13. However, it is not clear
Mattis et al. Page 8
Nat Methods. Author manuscript; available in PMC 2014 September 17.
HH
MI A
uthor Manuscript
HH
MI A
uthor Manuscript
HH
MI A
uthor Manuscript

how the properties of ChETATR compare with those of the single-mutant ChR2(E123T)
(ChETAT) or with the additional ChETA mutants ChR2(E123A) (ChETAA) and
ChR2(E123A/H134R) (ChETAAR), which have not yet been tested in neurons. Furthermore,
no ChETA has ever been tested directly against ChIEF in any functional context. Based on
ChIEF’s photocurrent properties (fast kinetics, low desensitization in the face of sustained
light) and its ability to elicit high-fidelity spikes in pyramidal cells at the high end of their
frequency capacity, ChIEF is another promising candidate for eliciting reliable, precise
spiking at even higher frequencies. We therefore sequentially (i) compared the properties of
the ChETA mutants to identify the most promising, (ii) tested the performance of those
ChETA mutants in eliciting high-frequency spikes in fast-spiking neurons in Pvalb ::cre
mice27,28 and (iii) tested the performance of the best-performing ChETA mutant against
ChIEF.
We analyzed ChETAA, ChETAAR, ChETAT and ChETATR, with ChR2 included as a
benchmark (Fig. 3a). As in the experiments described in Figure 1, we analyzed photocurrent
properties in response to 1-s light stimulation under voltage clamp (Fig. 3a). Because these
ChETA variants respond to blue light, we used 470-nm light for this comparison; but we
noted that ChETAT has a moderate red-shift (Fig. 3b), as described previously13 and as seen
for ChETATC (Fig. 1d). All ChETAs had smaller peak photo-currents than ChR2 (< 0. 5 nA
versus > 1 nA, P < 0.001; Fig. 3c and Supplementary Fig. 8a) but in light of the small
steady-state/ peak ratio of ChR2 (Supplementary Fig. 8b) displayed steady-state
photocurrents comparable to those of ChR2 (∼0.3 nA, P > 0.05). Relative to the double
mutants, ChETA single mutants exhibited both faster time to peak and faster desensitization
kinetics, consistent with the correlation between the two parameters (Supplementary Fig.
8c–e). The single-mutation ChETA variants also had faster recovery from desensitization
(Fig. 3d and Supplementary Fig. 8f) and faster off kinetics: under these matched conditions
of illumination and temperature, ChETAA and ChETAT had τoff values of 7.5 ± 0.4 ms and
6.8 ± 0.2 ms, respectively, whereas the double mutants and ChR2 had τoff values several
milliseconds slower (P < 0.001).
We completed our characterization of ChETA properties by examining sensitivity to light.
ChR2 had the largest peak photo-currents across light power densities, followed by
ChETATR, but steady-state photocurrents were more similar (Supplementary Fig. 8g,h). A
comparison of the normalized curves, to remove differences in expression or trafficking,
revealed that cells expressing either of the single-mutant ChETAs showed significantly
higher peak EPD50 values (>3 mW mm−2), ∼ 2–3 times greater (less sensitive) than those
expressing ChR2 or the double mutants (P < 0.001, Supplementary Fig. 8i,j).
Evoking high-frequency spiking in parvalbumin neurons
As single-mutant ChETA variants had faster kinetics and double mutants (in particular
ChETATR) had larger photocurrents in vitro, we compared the functional performance of
ChETATR and ChETAA. (Although ChETAT was similar overall to ChETAA, it had a
slightly reduced steady-state/peak ratio, which would impair spike fidelity over sustained
pulse trains, as well as a spectral red-shift disadvantageous for combinatorial experiments.)
We targeted fast-spiking parvalbumin cells capable of firing up to and above 200 Hz so that
Mattis et al. Page 9
Nat Methods. Author manuscript; available in PMC 2014 September 17.
HH
MI A
uthor Manuscript
HH
MI A
uthor Manuscript
HH
MI A
uthor Manuscript
tool performance itself, rather than the biophysics of the cell, would be the limiting factor in
achieving high-frequency spike fidelity. To achieve this, we used opsins in a Cre-dependent
(double-floxed inverted open reading frame (DIO)) configuration28–30 under the control of
the ubiquitous promoter EF1α (Ef1a; Fig. 3e and Online Methods). We packaged constructs
in an adeno-associated viral vector (AAV serotype 2/5) and stereotactically injected into the
prefrontal cortex of transgenic Pvalb ::cre mice to obtain whole-cell recordings from fast-
spiking parvalbumin interneurons in an acute slice preparation.
Both ChETAA and ChETATR expressed well in vivo (Fig. 3e). Expressing cells had no
difference in cell health measures of input resistance or resting potential (Supplementary
Fig. 9a). In contrast to the results in culture, ChETAA actually had larger steady-state
photocurrents than ChETATR (610 ± 80 pA versus 370 ± 40 pA, P = 0.02; Fig. 3f).
Although both tools showed faster off kinetics (the expected result because we performed
this experiment at 32 °C rather than room temperature), the relationship seen in culture was
maintained, with ChETAA having faster off kinetics (4.5 ± 0.4 ms versus 7.1 ± 0.9 ms, P =
0.02; Fig. 3f). To test the performance of the two ChETAs, we stimulated cells with trains of
40 light pulses with 1 ms, 2 ms and 5 ms pulse widths of 5–200 Hz (100 Hz for 5-ms pulse
width) with the cell resting at either −60 or −70 mV membrane potential. Overall, the two
ChETAs performed very similarly across conditions, showing no detectable difference in
temporal stationarity, plateau potential, successfully evoked spikes or multiple evoked
spikes (Supplementary Figs. 9b – d and 10a). However, ChETAA triggered spikes with
significantly shorter latency and reduced latency spread across the pulse train (Fig. 3f and
Supplementary Fig. 10b,c) in several of the more stringent conditions (for 1-ms pulses at
−60 mV, F1,15 = 5.81, P = 0.03 for latency; F1,15 = 8.28, P = 0.01 for latency spread). The
lower latency of ChETAA may be attributable to a combination of faster time to peak and
larger peak photocurrent, whereas its lower latency spread across the pulse train may be
related to faster recovery from desensitization. These results identify ChETAA as perhaps
best-suited among these ChETAs for eliciting high-frequency spikes with high precision in
fast-spiking cells.
We next directly compared ChETAs and ChIEF. First, we considered the fact that our τoff
measurements were obtained from neurons held at −70 mV, whereas spiking neurons are
(over time) substantially more depolarized. Previous studies have shown that ChR2 τoff
varies with membrane potential31 and that the E123T mutation can abolish that voltage
dependence14. However, no studies to date have investigated the voltage dependence of
kinetics in ChETAA or ChIEF. We therefore quantified τoff for ChR2, ChETAA, ChETATR
and ChIEF, while applying holding potentials of −70 mV to +50 m V. Kinetics responded
very differently to voltage (F12,144 = 27.81, P < 0.0001), with ChR2 slowing with
depolarization (P < 0.001), both ChETAs staying constant and ChIEF appearing to
accelerate (P < 0.001; Fig. 3g). Although ChR2 only trended slower than the others at −70
mV, ChR2 was highly significantly (P < 0.001) slower at all more depolarized voltages
(Bonferroni post-test).
We investigated kinetic properties of ChR2, ChETAA and ChIEF by comparing τoff in
response to the first light pulse on the cell (dark-adapted state) versus τoff in response to a
subsequent light pulse after 1 s of illumination (light-adapted state). Whereas ChR2 and
Mattis et al. Page 10
Nat Methods. Author manuscript; available in PMC 2014 September 17.
HH
MI A
uthor Manuscript
HH
MI A
uthor Manuscript
HH
MI A
uthor Manuscript

ChETAA showed no significant change in kinetics between those conditions, ChIEF kinetics
slightly accelerated (Supplementary Fig. 11a). Note that we chose this faster, light-adapted
τoff as the more relevant measure to report for ChIEF in our initial characterization (Fig. 1h),
as most optogenetics experiments involve multiple light pulses. The ChIEF off kinetics
(particularly under the conditions described above) along with its large, stable photocurrents
(Fig. 1) suggest that it may also be highly suited for driving high-frequency firing, but no
studies to date have demonstrated ChIEF functionality in driving action potentials at greater
than 75 Hz26. We therefore tested ChIEF against ChETAA in fast-spiking parvalbumin
neurons in acute slices.
Under matched conditions, ChETAA expressed much more strongly in vivo than ChIEF by
fluorescence (P < 0.001; Fig. 3h and Supplementary Fig. 11b). However, ChIEF expression
was qualitatively more membrane-localized, as seen in the higher-magnification image and
as reported previously26. Consistent with this, ChIEF had significantly (P = 0.037) more
photocurrent per fluorescence unit (Supplementary Fig. 11b), such that steady-state
photocurrent magnitudes were comparable between the two (460 ± 50 pA for ChETAA
versus 390 ± 40 pA for ChIEF; P = 0.27; Fig. 3i). ChETAA photocurrents were significantly
larger in slice than in culture (P < 0.05 and P < 0.001 when expressed in vivo for 4 weeks
and 6 weeks, respectively; Supplementary Fig. 11c), whereas ChIEF expressed more
strongly in culture than in slice (P < 0.01 when expressed in vivo for 4 weeks; not examined
at later time points), highlighting the importance of using matched cell preparations for
comparison of performance. Despite the difference in opsin expression, neurons expressing
both ChETAA and ChIEF had no difference in average input resistance or resting potential
(Supplementary Fig. 11d). ChETAA off kinetics trended slightly faster (4.7 ± 0.3 ms versus
5.2 ± 0.5 ms; P = 0.17; Fig. 3i).
To test the performance of ChETAA and ChIEF, we stimulated cells under the same
conditions described above. ChETAA and ChIEF elicited 200-Hz firing and generated
precise, single action potentials in response to single light pulses (Fig. 3i and Supplementary
Fig. 12a,b). Statistically, ChETAA and ChIEF showed no differences in plateau potential (P
= 0.23–0.71; Supplementary Fig. 12a). Consistent with the fact that these fast-spiking cells
are less subject to depolarization block, we observed that cells with larger photocurrents
tended to elicit more successful spikes, as exemplified by two representative ChIEF cells
with small (190 pA) and large (510 pA) photocurrents (Fig. 3j and Supplementary Fig. 12c);
we saw the same trend in an analysis of ChR2-expressing neurons with larger photocurrents
(Supplementary Fig. 12d). Despite not showing larger photocurrents than ChETAA, ChIEF
trended toward more successful spiking (with significance obtained under some select
conditions such as 2 ms pulses at −70 mV: F121 = 8.46, P = 0.01; Supplementary Fig. 12b),
but ChIEF also trended toward more extra (spurious) spikes (Supplementary Fig. 13).
Finally, ChETAA and ChIEF showed no consistent difference in temporal stationarity
(Supplementary Fig. 13a), and had similarly fast latency and small latency spread across
pulse train, for most conditions (Supplementary Fig. 14a,b).
Mattis et al. Page 11
Nat Methods. Author manuscript; available in PMC 2014 September 17.
HH
MI A
uthor Manuscript
HH
MI A
uthor Manuscript
HH
MI A
uthor Manuscript
Trade-off between kinetics and light sensitivity
Although our analysis excluded the SFOs, which have been compared elsewhere11,15 and by
virtue of their orders-of-magnitude slower off kinetics are more appropriate for modulating
excitability than for eliciting precisely timed spikes, we hypothesized that the same
principles that govern enhanced population light sensitivity in SFOs might also explain
variations in light sensitivity among the faster channelrhodopsins. Although the molecular
perspective on light sensitivity considers only the efficiency by which an individual protein
is activated by light (intrinsic sensitivity), cells expressing optogenetic protein populations
with slower off kinetics will effectively appear more light-sensitive in the face of prolonged
light stimulation, owing to greater integration of photons over time by the population at low
(nonsaturating) light powers.
To test the universality of this principle, we plotted τoff versus EPD50 for all tools
characterized in Figures 1 and 3 as well as VChR1 (ref. 17), ChR2(C128S) (an SFO15), and
the recently described ChR2(C128S/D156A) stable SFO (SSFO11; Fig. 4). Indeed, the
ChETAs, with generally faster off kinetics and larger EPD50s, fit well with the inverse
correlation seen in Figure 1j. With the addition of the ChETAs, the combined dataset was
highly correlated (Spearman correlation coefficient R = −0.92, P < 0.0001). The SFOs,
which have much slower off kinetics, were also close to the established relationship.
Notably, EPD50 for these SFOs will be highly dependent upon the duration of the light
pulse, with longer stimulation enabling more integration of photons and higher population
sensitivity (lower EPD50). Whereas the light pulse duration (1 s) used to measure EPD50
for all non-SFOs was sufficient to reach saturation, even the longer light pulses used for
SFO and SSFO (5 s and 20 s, respectively) did not result in photocurrent saturation; the
resulting EPD50 values were therefore overestimated and longer light pulses would be
expected to bring measured values toward the consistent relationship shown. Together, these
data highlight a useful and fundamental tradeoff between kinetics and population light
sensitivity.
Hyperpolarizing tools and properties
We next compared hyperpolarizing optogenetic tools head to head. Although each
experiment will have unique requirements for hyperpolarizing photocurrent properties, some
common guiding principles initially seem clear. (i) In most experimental applications,
hyperpolarizing photocurrents will need to be sufficiently large to robustly and safely inhibit
spiking even in the presence of excitatory inputs. (ii) As with excitatory tools, higher light
sensitivity will likely enable modulation of larger volumes of tissue, the use of lower light
powers and/or less invasive light delivery. (iii) Precise, time-locked inhibition will
presumably require photocurrents with rapid onset and offset, whereas longer-term
inhibition will require photocurrents that are stable, with minimal desensitization. (iv)
Finally the nature of the action spectrum will dictate feasibility of combining with other
light-activated reagents in the same preparation32–34.
The first hyperpolarizing tool shown to be efficacious in neurons was the Natromonas
pharaonis halorhodopsin (NpHR), a yellow light-activated chloride pump that has now been
used in preparations ranging across mammalian brain slice32, freely moving worms32,
Mattis et al. Page 12
Nat Methods. Author manuscript; available in PMC 2014 September 17.
HH
MI A
uthor Manuscript
HH
MI A
uthor Manuscript
HH
MI A
uthor Manuscript
cultured neurons32,34 and behaving mammals35–38. Two versions modified for enhanced
membrane targeting in mammalian neurons, termed eNpHR2.0 (ref. 39) and eNpHR3.0 (ref.
33) have been reported. The outward proton pumps Arch40 (from Halorubrum sodomense),
ArchT41 (from Halorubrum strain TP009), eBR33 (from Halobacterium) and Mac40 (from
Leptosphaeria maculans) have also recently been shown to achieve neuronal inhibition.
eNpHR3.0 has larger photocurrents than eNpHR2.0 (ref. 33), and Arch has larger
photocurrents than eNpHR2.0 (ref. 40), but no direct comparison between eNpHR3.0 and
Arch or any of the proton pumps has yet been reported to our knowledge. Below we present
a direct comparison of the most potent hyperpolarizing opsins (Fig. 5a), including new
membrane trafficking–enhanced versions of proton pumps resulting in the highest
expression and largest inhibitory photocurrents yet described. We first characterize
properties in vitro and then test the functional performance of two of the most promising
candidates in acute slice.
We first fused each hyperpolarizing tool in-frame with enhanced YFP (eYFP), cloned the
opsins into an identical lentiviral backbone with the excitatory CaMKIIα promoter and
expressed the opsins in cultured neurons (Fig. 5a,b). eNpHR3.0 was well-targeted to the
membrane, but unmodified (1.0) Arch, ArchT and Mac all showed intracellular
accumulations reminiscent of the endoplasmic reticulum (ER) aggregations observed with
NpHR1.0 (ref. 39). We observed the same accumulations in the GFP versions of the
constructs (Supplementary Fig. 15a); the GFP and eYFP 1.0 versions (that is, those without
added trafficking motifs) had similar photocurrents (data not shown). ER aggregation was
confirmed by co-staining with the ER marker KDEL (Fig. 5b). Given that the trafficking
modifications applied to eNpHR3.0 generalize to the proton pumps bacteriorhodopsin and
G. theta rhodopsin-3 (GtR3)33, we added the same trafficking motifs to Arch, ArchT and
Mac. These new trafficking-enhanced versions, which we term (by analogy with NpHR
version progression) eArch3.0, eArchT3.0 and eMac3.0, all had markedly reduced
intracellular labeling and improved membrane localization with labeling of cellular
processes (Fig. 5b and Supplementary Fig. 15b). Intermediate 2.0 versions (that is, with an
ER export motif but not the additional neurite-trafficking signal (TS) motif that defines 3.0
versions) were potent but not as successful as the 3.0 versions (Supplementary Fig. 15c).
Because only those proteins expressed on the membrane can contribute to the measured
photocurrent, we anticipated that this improved opsin trafficking should increase
photocurrent size. Indeed, all three trafficking-enhanced proton pumps had dramatically
increased photocurrents (P < 0.001; Fig. 5c). Whereas the 1.0 versions of the proton pumps
had significantly smaller photocurrents than eNpHR3.0, eArch3.0 and eArchT3.0 photo-
currents were significantly larger (P < 0.01 for each comparison; Fig. 5c and Supplementary
Fig. 15d). eNpHR3.0-expressing cells had the dimmest fluorescence, but the greatest
photocurrent per fluorescence, of these tools (Supplementary Fig. 15e).
Although maximal eMac3.0 photocurrents were the smallest among the enhanced opsins
(and significantly smaller than eNpHR3.0; P < 0.05), Mac has been reported to have an
activation spectrum sufficiently blue-shifted to allow dual-inhibition in combination with
eNpHR3.0 (ref. 40). After verifying that membrane trafficking did not change the spectra
(Supplementary Fig. 16a), we compared the spectra of the enhanced pumps, plotted with
Mattis et al. Page 13
Nat Methods. Author manuscript; available in PMC 2014 September 17.
HH
MI A
uthor Manuscript
HH
MI A
uthor Manuscript
HH
MI A
uthor Manuscript

ChR2, for reference (Fig. 5d). eNpHR3.0 was red-shifted (peaking at 560–590 nm) relative
to the three proton pumps (peaking at 520–560 nm), exhibiting the least overlap with ChR2;
we saw no functionally relevant differences among the proton pumps.
We next investigated the temporal precision of hyperpolarizing photocurrents by quantifying
on kinetics (τon) and τoff at the beginning and end of a 1-s light pulse. All pumps activated
rapidly, with proton pumps activating significantly faster than eNpHR3.0 (all in the range of
1.5–3 ms; Fig. 5e). Both Mac variants had much slower off kinetics compared with the other
pumps (P < 0.001; Fig. 5e).
We also considered the light sensitivity of the hyperpolarizing pumps by measuring
photocurrents across a range of light power densities from ∼0.05 mW mm−2 to ∼20 mW
mm−2 (Fig. 5f and Supplementary Fig. 16b–d; owing to small photocurrents, we eliminated
Mac1.0 from this and subsequent analyses). As expected, the 3.0 pumps had much larger
operational light sensitivity (that is, by absolute current magnitude) than the 1.0
counterparts, although trafficking enhancement did not affect the population sensitivity
(normalized current magnitudes or EPD50). eMac3.0 was the most sensitive (EPD50 = 1.9 ±
0.4 mW mm−2 versus 5.4 ± 0.2 mW mm−2 for eNpHR3.0; P < 0.001). We note that off
kinetics and population light sensitivity were therefore inversely correlated for the
hyperpolarizing tools (Supplementary Fig. 16d), reminiscent of the pattern observed for
depolarizing tools (Fig. 4).
Given that many behavioral neuroscience experiments may require prolonged inhibition on
the order of minutes, we investigated the stability of the hyperpolarizing photocurrents.
Whereas all pump photocurrents decayed across 60 s of continuous light, eNpHR3.0
currents were the most persistent and the large 3.0 proton pump currents (eArch3.0 and
eArchT3.0) had the largest dropoff in vitro (Supplementary Fig. 17a). All pumps recovered
photocurrents with similar efficacy under these cultured-neuron conditions (Supplementary
Fig. 17b).
Inhibiting spikes in pyramidal cells in acute slice
To investigate the characteristics of prolonged photocurrents under conditions more relevant
to in vivo experiments and to test the functional ability of hyperpolarization to stably inhibit
spiking, we turned to an acute slice preparation. We compared one of each broad class of
hyperpolarizing tool (the chloride pump eNpHR3.0 against one of the proton pumps). We
chose the enhanced counterpart of the best-established proton pump (Arch1.0) to date,
eArch3.0. To express eNpHR3.0 and eArch3.0 in vivo, we stereotactically injected an
adeno-associated viral vector (AAV serotype 2/5), with the opsin-eYFP fusion gene under
control of the CaMKIIα promoter. Under matched conditions, eArch3.0 expressed much
more strongly based on fluorescence, both at the injection site and in axons at downstream
targets such as the basolateral amygdala (BLA; Fig. 6a). Compared with eYFP-transduced
controls, cells expressing both opsins had similar baseline input resistances (Fig. 6b) and
resting potentials but slightly higher membrane capacitance (Supplementary Fig. 17c), as
has previously been observed for opsin-expressing HEK cells42. Also as expected from the
in vitro work (Fig. 5), at matched light power densities (5 mW mm-2) eArch3.0 had
significantly larger photocurrents (P = 0.01), averaging 1,680 ± 360 pA versus 450 ± 70 pA
Mattis et al. Page 14
Nat Methods. Author manuscript; available in PMC 2014 September 17.
HH
MI A
uthor Manuscript
HH
MI A
uthor Manuscript
HH
MI A
uthor Manuscript

for eNpHR3.0 (Fig. 6c). Under current clamp, eArch3.0-mediated hyperpolarization was
also significantly larger (−94 ± 12 mV versus −41 ± 4 mV, P = 0.005; Fig. 6d); smaller
differences in hyperpolarization compared with photocurrent could be due to voltage-
dependent slowing of photocycle turnover in proton pumps.
Because photocurrent stability and cell responses to hyperpolarization may depend on
photocurrent magnitudes, we carried out a final set of experiments using nonmatched light
power densities (5–10 mW mm-2 for eNpHR3.0; 0.25–5 mW mm−2 for eArch3.0) to obtain
a similar range of photocurrents for the two tools. We again illuminated cells for 60 s under
voltage clamp and measured the start and end photocurrent for each cell (Supplementary
Fig. 17d). These data were well fit by linear regression (eNpHR3.0 R2 = 0.68, eArch3.0 R2 =
0.88) with eArch3.0 having significantly higher slope (F1,36 = 22.2, P < 0.001), reflecting
the fact that, for cells with similar onset photocurrents, eArch3.0-expressing cells had more
photocurrent remaining at the end of the light pulse under these slice conditions, as seen in
the illustrative traces and in contrast with the pattern of stability observed in vitro. The
relationship between photocurrent (measured in voltage clamp) and hyperpolarization
(measured in current clamp) is shown in Supplementary Figure 17e.
Finally, we compared the ability of eArch3.0 and eNpHR3.0 to inhibit spiking in current
clamp. We elicited spiking with modestly suprathreshold current injections at 5 Hz, with 30
s baseline (pre-light), 60 s light and 30 s after light offset. Both pumps blocked spikes
throughout the prolonged light stimulation (Fig. 6e). We observed that from both groups
some cells became unstable after prolonged hyperpolarization especially by >50 mV, failing
to spike to current injections or rebounding to a more depolarized resting potential after light
offset. We quantified these factors for each cell and plotted each against the degree of
hyperpolarization (Fig. 6f). Under more moderate (<50 mV) hyperpolarizations, we
observed no consistent or lasting effects on excitability or membrane resistance.
DISCUSSION
Depending on experimental requirements, different properties may be critical in guiding
optogenetic tool selection. For single-target optogenetic experiments (involving introduction
of only one opsin gene and no additional light-activated elements), a relatively broad or
nonselective spectrum is not problematic, and from a practical perspective broader
wavelengths could enable more efficient activation with off-peak-wavelength light, thus
relaxing the requirement for precisely tuned optical filters. All things being equal,
optogenetic tools with greater response to redder light (such as the C1V1 family and
eNpHR3.0) will enable control of deeper tissue (longer wavelengths will scatter less and
more effectively penetrate tissue, and also these lower-energy photons may cause less
phototoxicity)4. Future development of further red-shifted depolarizing and hyperpolarizing
tools will be welcome.
For multiple-target optogenetic experiments (involving more than one opsin, or an opsin
plus a light-sensitive element such as calcium or voltage sensors), both the value and the
selectivity of the activation wavelength are critical. In targeting two distinct cell types for
independent depolarization, C1V1 variants can be used in combination with blue-light-
Mattis et al. Page 15
Nat Methods. Author manuscript; available in PMC 2014 September 17.
HH
MI A
uthor Manuscript
HH
MI A
uthor Manuscript
HH
MI A
uthor Manuscript

selective channelrhodopsins, as recently demonstrated11; for such experiments, lasers or
narrower bandpass filters than used here are recommended. GR, ChETATC and ChETAT are
less spectrally separated and therefore less useful for such combinatorial experiments.
Because many available calcium or voltage sensors respond preferentially to blue light,
C1V1 variants also present the possibility of optical manipulation of one cell type, with
concurrent optical readout from the same or different cell types, in a single experimental
preparation. These combinatorial possibilities will become increasingly practical as new
indicators with different spectral sensitivities are developed and optimized43.
All proton pumps in our analysis (Arch, ArchT and Mac) were slightly blue-shifted relative
to eNpHR3.0, but the still-large spectral overlap would preclude reliable independent
hyperpolarization of multiple cell types in intact mammalian tissues. A preferentially blue
light-activated hyperpolarizing tool has yet to be described but would be a powerful addition
to the optogenetic toolbox. For combined hyperpolarization and depolarization, either in the
same cells or in distinct populations in the same preparation, the relatively red-shifted
spectrum of NpHR variants may be suitable for combination with blue light-selective
depolarizing optogenetic tools.
For all optogenetic tools, photocurrent magnitude is a critical parameter determining
whether light will successfully evoke or inhibit action potentials, which in turn depends on
several other factors. First, there is a limit to the intensity of light that can safely be applied
in vivo while avoiding phototoxic effects resulting in heating artifacts or tissue damage11.
Second, light scatters as it passes through tissue, decreasing in power density at increasing
distance from the light source; opsin-expressing tissue, if activated by a single light source,
is therefore subjected to a light power density gradient4,37 as a function of distance from the
source. Third, light sensitivity at the cell is crucial, and here we distinguish among three
different perspectives on light sensitivity, which we term operational, population and
intrinsic sensitivity.
Operational light sensitivity refers to the ability of the expressed opsins at a given light
power density to exert an effect on the cell (for example, to evoke or inhibit spikes), which
is largely determined by the absolute photocurrent magnitude. Many factors contribute to
this photocurrent magnitude, including properties at the single protein level (see below), but
also critically including the overall degree of opsin expression and the efficiency of
membrane targeting. Operational light sensitivity is therefore the most practically useful
number for the experimentalist but is also sensitive to many factors that alter expression and
targeting (such as transgenic versus viral expression, viral type and titer, promoter,
expression time and membrane trafficking), which will need to be tested in each
experimental situation.
Although absolute opsin expression and membrane targeting are critical in determining
operational photocurrent magnitude, it is also informative to consider the contribution of
‘normalized’ characteristics of the opsin population response to light. From the perspective
of the whole cell, changes in such a ‘population light sensitivity’ (EPD50; normalized to
control for influences of expression) could arise in part from differences in the duration of
the conducting state of the opsin after photon absorption (off kinetics; Fig. 4). Both
Mattis et al. Page 16
Nat Methods. Author manuscript; available in PMC 2014 September 17.
HH
MI A
uthor Manuscript
HH
MI A
uthor Manuscript
HH
MI A
uthor Manuscript

operational and population light sensitivity will be influenced by how efficiently each
individual protein absorbs an incident photon; this constitutes ‘intrinsic light sensitivity’, a
third measure given by the product of the molar absorption coefficient and the quantum
yield of the molecule24. Given that EPD50 values are highly correlated with off kinetics,
differences in off kinetics likely dominate population sensitivity, but differences in intrinsic
light sensitivity may still come into play with additional molecular engineering or genomic
discovery. Although we did not analyze the bistable SFOs11,15 here, they would be the most
appropriate tool for recruiting very large volumes of tissue owing to extreme light
sensitivity. The SFOs are also particularly useful for investigating the impact of
asynchronous elevation of the firing rate of a defined neuronal population, such as the
epochs of persistent activity observed in cortical and subcortical sequences of
depolarizations44,45.
For depolarizing tools, researchers face a theoretical tradeoff between activating large or
distant volumes of tissue and evoking spikes with high temporal precision or at high
frequencies. Because ultimately the absolute (not normalized) photocurrent magnitude
matters for performance, in practice one way to circumvent the tradeoff is by increasing the
expression and membrane targeting of faster opsins, with the caveat that high expression
may lead to toxicity. Other possible approaches for improving trafficking and photocurrents
include separating the opsin from the fluorophore (note that we fused all of our opsins in
frame with eYFP) or adding trafficking-enhancing sequences (as with C1V1 (ref. 11) and
the hyperpolarizing opsins).
In addition to a critical role in determining population sensitivity, off kinetics (together with
on kinetics) also will define the temporal precision of the photocurrent effects. For
depolarizing channels, fast on kinetics will support short spike latencies; moreover,
depolarizing channels with faster off kinetics will avoid problems resulting from prolonged
depolarization, including arte-factual extra spikes and plateau potentials, both of which may
degrade delivery of a precise neural signal. Just as different cell types respond differently to
sustained injection of depolarizing current, different cell types will also respond differently
to plateau potentials, another example of the interaction between biophysical properties of
the optogenetic tool and the host cell in determining the ultimate response. With slower
channelrhodopsins, which give rise to larger plateau potentials, pyramidal cells exhibit
severe depolarization block at higher frequencies. On the most precise end of the spectrum,
we identified ChETAA and ChIEF as perhaps best suited for eliciting rapid spike trains with
high precision in fast-spiking cells, owing to kinetic stability across voltages.
Effective photocurrent size in response to pulsed light will be somewhere between the peak
and steady-state photocurrent values, depending upon the interplay between the stimulation
parameters and the conductance properties. Relevant properties include steady-state/peak
ratio, kinetics of desensitization (τdes, the transition from peak to steady state), and kinetics
of recovery from desensitization (the recovery of the peak photocurrent). Instability in
photocurrent magnitude could manifest as lower temporal stationarity in spiking or higher
spike-latency dispersion across pulse trains, reflecting inconsistent spike success or timing
across a pulse train, respectively. Even recovery from desensitization alone is itself complex,
with different (much faster) kinetics operating in the presence of continued illumination23,
Mattis et al. Page 17
Nat Methods. Author manuscript; available in PMC 2014 September 17.
HH
MI A
uthor Manuscript
HH
MI A
uthor Manuscript
HH
MI A
uthor Manuscript

particularly relevant for high duty-cycle illumination. Computational modeling is needed to
accurately predict photocurrent dynamics over a train for different optogenetic tools and
stimulation paradigms, given the interactions among all of these properties. In principle,
higher steady-state/peak ratios, slower desensitization and more rapid recovery from
desensitization should all promote stable photocurrents across stimulation conditions.
For hyperpolarizing tools, it is important to note that the three hyperpolarizing opsins with
largest photocurrents (eNpHR3.0, eArch3.0 and eArchT3.0) all have relatively high EPD50
values, so none may be well-suited for hyperpolarizing a large volume of tissue; to achieve
sufficient inactivation of cells far from the light source may require excessive
hyperpolarization that could be detrimental to health of the cells closest to the light source.
Ideally, therefore, large-volume inhibition would be hypothetically achieved with a
hyperpolarizing, photon-integrating version of the SFO, with moderate photocurrents and an
extremely low EPD50 value, enabling more even photocurrent responses to the gradient of
light intensity across tissue. As slow off kinetics are conceptually achievable with channels
but not with pumps (which use energy provided by light to actively transport ions and
therefore in theory should not be able to sustain photocurrents in the absence of light), a
major open area for future opsin engineering efforts would be the development of a light-
activated hyperpolarizing tool, such as a light-activated K+ channel.
All hyperpolarizing pumps we examined here showed suitably fast on kinetics for single-
spike precision, with the proton pumps faster than eNpHR3.0, but notably Mac1.0 and
eMac3.0 had markedly slower off kinetics than the other pumps. Depolarizing optogenetic
tools (more so than hyperpolarizing tools) tend to be used with many different patterns of
pulsed light stimulation: examples in the literature include 20-Hz stimulation of amygdala
cells sustained over a 3-min behavioral trial37 and phasic 50 Hz bursts of light to stimulate
dopaminergic cells in the ventral tegmental area29. But although hyperpolarizing tools may
also be stimulated with brief light pulses, more typical useful paradigms for behavioral loss-
of-function experiments involve sustained hyperpolarization across many seconds or even
minutes; a recent effort relied upon sustained inhibition of hippocampal pyramidal cells for
30 min38.
Optogenetic photocurrents, such as physiological synaptic currents, are mediated by specific
ions that can have effects distinct from membrane voltage. The depolarizing optogenetic
tools are cation channels, conducting a mix of Na+, K+, H+ and Ca2+ (refs. 16,46). As Ca2+
is an important intracellular signaling molecule, Ca2+ conductance could have effects
independent of membrane voltage which may either be an advantage or a confound
depending on the experiment47,48; for example, it has been suggested that Ca2+-dependent
K+ channels can be recruited downstream of the directly light-activated photocurrent16. It is
also possible that large or prolonged optogenetic ion fluxes could alter extracellular fields
and ion concentrations sufficiently to influence either the expressing cell or proximal non-
expressing cells. Such effects can also happen in the course of physiological neural
activity49 in the form of ephaptic interactions after high-frequency activity, or rebound
excitation after prolonged inhibition owing to increased membrane excitability or chloride
balance changes.
Mattis et al. Page 18
Nat Methods. Author manuscript; available in PMC 2014 September 17.
HH
MI A
uthor Manuscript
HH
MI A
uthor Manuscript
HH
MI A
uthor Manuscript

For many applications with hyperpolarizing opsins, sustained stimulation will be desired
(for example, to mimic a lesion). We did not observe consistently increased excitability in
the slice after eNpHR3.0 activity (Fig. 6), nor have in vivo studies observed prolonged
effects outlasting light by more than ∼20 s35,38; nevertheless it is important to consider the
potential for effects after light exposure when designing either physiological or optogenetic
prolonged-inhibition experiments, and particularly for inhibition it is routine and advisable
to focus experimental attention on the within-light, rather than post-light, epoch. Finally,
although native amounts of high-concentration extracellular ions may be unlikely to be
substantially depleted by intracellularly directed optogenetic pumps, we cannot exclude the
possibility that large extracellularly directed fluxes of low-concentration ions could
influence surrounding non-expressing cells.
All of the experiments described here involve illumination of cell bodies and do not directly
address performance in axons11,36,37,50, important for applications such as projection
targeting. The relationship between where depolarization or hyperpolarization is initiated
and how that voltage change will propagate is complex and will depend on experiment-
specific conditions (including distribution of opsins in the cell, location and intensity of light
delivery, cell type, local host channels, axon caliber and myelination and other factors).
Such subcellular factors could also come into play with spatially restricted two-photon
illumination. Finally, many optogenetics experiments will be performed in dynamic systems
with complex feedback and nonlinearities. At the network level, activation or inhibition of a
population of connected cells will evoke circuit-level responses, and as many of these
optogenetic tools are sensitive to membrane voltage, local activity can feed back onto and
modulate properties of the expressed opsins in a time-varying fashion. Although we
attempted to eliminate these considerations by patching in the presence of sodium channel or
synaptic blockers, in vivo experiments will have no such constraints.
Our data can contribute to initial guiding principles in selection and characterization of
opsins. As the optogenetic toolbox will expand, we suggest that future introduction of tools
include side-by-side comparison of key parameters with relevant existing opsins, for
maximal utility to the scientific community. With the many variables and tradeoffs among
different figures of merit, it is unlikely that any given tool will prove superior by all
measurable parameters. These data should therefore not be used to support the unqualified
endorsement of one opsin over another but rather to facilitate informed decisions based on
tradeoffs relevant to specific experimental requirements, with due regard for caveats arising
from extrapolation across preparations.
ONLINE METHODS
Experiments with mice
All experiments were conducted under protocols approved by the Stanford Administrative
Panel on Laboratory Animal Care. Male C57/BL6 mice (wild type or Pvalb::cre) were
injected at 3–4 weeks of age and patched 4–6 weeks later. For each opsin comparison, all
experiments were performed in parallel in littermates.
Mattis et al. Page 19
Nat Methods. Author manuscript; available in PMC 2014 September 17.
HH
MI A
uthor Manuscript
HH
MI A
uthor Manuscript
HH
MI A
uthor Manuscript

Molecular cloning
Lentiviral constructs contained BamHI between the promoter and the opsin gene, NotI
between the opsin gene and the fluorophore gene, and EcoRI between the fluorophore gene
and the WPRE. As an exception, pLenti-CaMKIIα-ChIEF-EYFP contained EcoRI between
the opsin and the fluorophore. Wild-type ChR2 (from C. reinhardtii) and the mutated
variants ChETAA, ChETAAR, ChETAT, ChETATR and ChIEF were also cloned in the reverse
orientation into a Cre-inducible recombinant AAV vector carrying two pairs of incompatible
lox sites28–30under the EF1α promoter (double-floxed inverted open reading frame (DIO)).
Opsin-fluorophore fragmentswere PCR-amplified to add AscI and NheI, using
gtggcgcgccctattacttgtacagctcgtccatg (for all), tatgctagccaccatggactatggcggcgc (for ChR2
mutants), and gttatg ctagcgccaccatgtcgcggaggccatggc (for ChIEF), and then ligated to an
AAV-Ef1α-DIO backbone.
ChR2 was human codon—optimized (humanized). ChIEF (non-human codon–optimized
(nonhumanized)) was obtained from M. Lin (Stanford University) in a Sindbis expression
plasmid. GR and FR were constructed by fusing ChR1 (from C. reinhardtii) to ChR2
(neither were humanized) as described20,21. C1V1 was generated by fusing ChR1
(nonhumanized) with VChR1 (humanized) (GenBank ACD70142.1) by overlap extension
PCR as previously described11. All ChR2 and C1V1 mutations were produced by site-
directed mutagenesis (QuikChange, Agilent), as previously described13. Double mutants
were made with combinations of the single-mutant primers.
Mac (from L. maculans) and Arch (from H. sodomense) were obtained from Addgene as
GFP fusion genes and switched to eYFP for consistency. Humanized ArchT (from
Halorubrum strain TP009) was synthesized by DNA2.0. Mac, Arch and ArchT were
enhanced to the 2.0 versions using the ER export element alone and to the 3.0 versions with
both the ER export motif and the trafficking signal as described previously33.
All constructs were fully sequenced, and all AAV vectors were tested for in vitro expression
before viral production. All cloning and mutagenesis primers are listed in Supplementary
Table 2. Complete sequences are available at http://www.optogenetics.org/.
Hippocampal neuron culture and calcium phosphate trans-fections
Primary cultured hippocampal neurons were prepared from P0 Sprague-Dawley rat pups
(Charles River). CA1 and CA3 were isolated, digested with 0.4 mg ml−1 papain
(Worthington), and plated onto glass coverslips precoated with 1:30 Matrigel (Becton
Dickinson Labware). Cultures were maintained in a 5% CO2 humid incubator with
Neurobasal-A medium (Invitrogen) containing 1.25% FBS (HyClone), 4% B-27 supplement
(Gibco), 2 mM Glutamax (Gibco) and 2 mg ml−1 fluorodeoxyuridine (FUDR) (Sigma), and
grown on coverslips in a 24-well plate at a density of 65,000 cells per well.
For each well, a DNA-CaCl2 mix was prepared with 2 µg DNA (Qiagen endotoxin-free
preparation) and 1.875 µl 2 M CaCl2 (final Ca2+ concentration 250 mM) in 15 µl H2O. To
DNA-CaCl2 we added 15 µl of 2× HEPES-buffered saline (pH 7.05). After 20 min at room
temperature (20–22 °C), the mix was added dropwise into each well (from which the growth
medium had been removed and replaced with prewarmed minimal essential medium
Mattis et al. Page 20
Nat Methods. Author manuscript; available in PMC 2014 September 17.
HH
MI A
uthor Manuscript
HH
MI A
uthor Manuscript
HH
MI A
uthor Manuscript

(MEM)) and transfection proceeded for 45–60 min at 37 °C, after which each well was
washed with 3 × 1 ml warm MEM before the original growth medium was returned.
Stereotactic injections
Adeno-associated virus (AAV) sero-type 2/5 containing the various constructs was produced
by the University of Carolina Chapel Hill Vector Core. Genomic titers were 1.5 × 10¹² c.f.u.
ml−1 for ChETAA, ChETATR and ChIEF and 4 × 10¹² c.f.u. ml−1 for eYFP, eNpHR3.0 and
eArch3.0. One microliter of virus was stereotactically injected bilaterally into the medial
prefrontal cortex of 3–4-week-old mice at +1.7 mm anteroposterior, 0.4 mm mediolateral
and 2.5 mm dorsoventral (from bregma).
Whole-cell electrophysiology recordings
Recordings in cultured neurons were performed 4–6 d after transfection in Tyrode’s solution
(320 mOsm): 125 mM NaCl, 2 mM KCl, 2 mM CaCl2, 2 mM MgCl2, 30 mM glucose and
25 mM HEPES, titrated to pH 7.3–7.4 with NaOH. Tyrode was perfused at a rate of 1–2 ml
min−1 and was kept at room temperature (20–22 °C). Intracellular solution (300 mOsm)
contained 130 mM K-gluconate, 10 mM KCl, 10 mM HEPES, 10 mM EGTA and 2 mM
MgCl2, titrated to pH 7.3 with KOH. Characterization of excitatory tools was done with
bath-applied tetrodotoxin (TTX) (1 µM; Sigma-Aldrich) and intracellular QX-314 chloride
(1 mM; Tocris Bioscience). In vitro patching of hyperpolarizing tools and current clamp
recordings for depolarizing tools were performed in the presence of synaptic transmission
blockers 6-cyano-7-nitroquinoxaline-2,3-dione (CNQX; 10 µM; Sigma-Aldrich) and d(-)-2-
amino-5-phosphonovaleric acid (APV; 25 µM, Sigma-Aldrich) as well as gabazine for the
current clamp experiments (10 µM; Sigma-Aldrich). Recordings were performed on an
upright Leica DM-LFSA microscope.
Recordings of ChETAA, ChETATR and ChIEF-expressing fast-spiking cells were performed
in acute slices from Pvalb::cre transgenic mice, 6 weeks (ChETAA versus ChETATR
comparison) or 4 weeks (ChETAA versus ChIEF comparison) after virus injections.
Artificial cerebrospinal fluid (ACSF) (300 mOsm) was composed of 123 mM NaCl, 26 mM
NaHCO3, 3 mM KCl, 1.25 mM NaH2PO4·H2O, 1 mM MgCl2·6H2O, 2 mM CaCl2·2H2O
and 11 mM glucose. ACSF was bubbled with 95% O2 and 5% CO2 (Praxair) to an
equilibrium pH of 7.3. ACSF was perfused at a rate of 7 ml min−1 and heated to 32 °C. The
intracellular solution was adjusted to 280 mOsm using water. Fast-spiking cells were
identified by eYFP expression and characteristic electrophysiological properties. Recordings
were performed on an upright Leica DM-LFSA microscope.
Recordings of eYFP-, eNpHR3.0- and eArch3.0-expressing pyramidal cells were performed
in acute slices from wild-type C57BL/6 mice 6–7 weeks after virus injection. ACSF
contained CNQX, APV and gabazine. Intracellular solution (280 mOsm) contained 135 mM
K-gluconate, 5 mM KCl, 10 mM HEPES, 0.1 mM EGTA, 2 mM MgCl2, 2 mM Mg-ATP
and 0.2 mM Na2-GTP, titrated to pH 7.4 with KOH. Pyramidal cells were identified by
morphology and characteristic electrophysiological properties. Recordings were performed
on an upright Olympus BX51 microscope. For all patching experiments, borosilicate glass
(Sutter Instruments) pipette resistances were 3–6 MΩ. For cell-attached electrophysiology
Mattis et al. Page 21
Nat Methods. Author manuscript; available in PMC 2014 September 17.
HH
MI A
uthor Manuscript
HH
MI A
uthor Manuscript
HH
MI A
uthor Manuscript
recordings, upon obtaining GΩ seals, holding potential was set so that no net current flowed
across the membrane; the same stimulation protocols were used as for whole-cell spiking
experiments. After the cell-attached recording was performed, we applied suction to the
pipette to break into the cell and repeated the same experiments in whole-cell configuration
to provide a direct within-cell comparison. No exogenous retinal cofactor was added to
neurons in any preparation.
Data collection across opsins was randomized and distributed to minimize across-group
differences in expression time, room temperature and so on.
Light delivery
All experiments were performed using single-photon activation. For cultured neurons, light
was emitted from a 300 W DG-4 lamp (Sutter Instruments) and was delivered through a
40×, 0.8 numerical aperture (NA) water-immersion objective. Pulsed input signals were
delivered to the DG-4 from pClamp (Axon Instruments) via a Bayonet Neill-Concelman
(BNC) connection. The delay from the DG-4 trigger signal to full light output was measured
using an amplified photodetector (Thorlabs) as ∼1 ms, with a 200 µs rise time. All
measurements of time to peak and latency were corrected for this delay.
For light-sensitivity measurements, light was passed through a 470/40 nm filter (for blue-
light sensitive excitatory tools) or a 562/40 nm filter (for C1V1s and all inhibitory tools),
and then through neutral density (ND) filters to achieve power densities ranging from ∼0.1
to 20 mW mm−2. Other properties were studied at ∼5 mW mm−2. For these experiments, the
light was passed through a Lambda 10-3 filter wheel (Sutter Instruments) with a 10-position
wheel for filters of different wavelengths, ND-normalized to generate closely matched
power densities. Filters were 406/15 nm; 427/20 nm; 445/20 nm; 470/20 nm; 494/20 nm;
520/15 nm; 542/20 nm; 560/25 nm; and 590/20 nm. Inhibitory spectra also used a 607/45
filter. Functional performance of depolarizing tools in culture used a 470/40 nm filter (for
blue light–sensitive excitatory tools) or a 562/40 nm filter (for C1V1s) and then ND filters to
achieve power densities of 2 mW mm−2, 6 mW mm−2 and 20 mW mm−2.
For experiments investigating fast depolarizing tools in slice, light was emitted from the
same 300 W DG-4 lamp (Sutter Instruments) and delivered through a 40×, 0.8 NA water-
immersion objective. Light was passed through a 470/40 nm filter and adjusted to achieve a
light power density of 5.1 mW mm−2. For experiments investigating hyperpolarizing tools in
slice, a 40×, 0.8 NA LUMPlanFL/IR Objective (Olympus), XCite halogen light source
(EXPO) was used. Light was passed through a 589/15 nm filter (eNpHR3.0) or a 560/14
filter (eArch3.0). For experiments comparing the photocurrent and hyperpolariza-tion
magnitudes under matched conditions, light power density was adjusted to ∼5 mW mm−2.
For the remaining experiments light was adjusted across a range of light power densities (5–
10 mW mm−2 for eNpHR3.0; 0.25–5 mW mm−2 for eArch3.0) to achieve a comparable
range of photocurrents for both.
All experiments contained at least 30 s of dark between sweeps to allow recovery to
baseline. All filters are given here as wavelength in nanometers per bandwidth in
Mattis et al. Page 22
Nat Methods. Author manuscript; available in PMC 2014 September 17.
HH
MI A
uthor Manuscript
HH
MI A
uthor Manuscript
HH
MI A
uthor Manuscript

nanometers. All light power densities were measured coming out of the 40× objective, at
approximately the sample distance.
Data analysis
Analyses of physiological results were performed using ClampFit software (Axon
Instruments) or custom software written in Matlab (Mathworks).
Access resistance (Ra) and input resistance (Rin) were monitored continually and data were
only included when Ra was < 30 MΩ and Rin was > 90 MΩ. Any traces containing escaped
spikes were excluded from analyses of peak photocurrent or of kinetics, but steady-state
photocurrents were still measured when possible. For current clamp recordings in culture,
only cells that fit those criteria and had leak currents > −150 pA (holding at −65 mV) were
included for analysis. For current clamp recordings in acute slice, only cells that fit those
criteria and had resting potentials < −55 mV were included for analysis. Only initially
reliable cells that showed 0.9–1.1 spikes per current pulse in the pre-light baseline were
analyzed for Figure 6f.
To identify the peak photocurrent, traces were smoothed using the robust Loess method with
a filter width of 2 ms and the peak was defined as the extremum from laser onset to 200 ms
post laser onset, less the baseline current (from the average over 500 ms before laser onset).
Visual inspection ensured that no escape spikes or other anomalies occurred. Time to peak
was measured from laser onset to this marked peak time. The steady-state photo-current was
determined by fitting a monoexponential curve to the smoothed waveform from 2 ms after
the peak to the laser offset time. Steady-state current was taken from the parameters of this
fit. τoff and τdes were calculated using ClampFit. We first smoothed the trace using a
lowpass Gaussian filter with a −3 dB cutoff at 1,000 Hz, and then fit a monoexponential
curve to the smoothed waveform. All curves were visually inspected for goodness of fit.
Photocurrent properties of the depolarizing tools ChR2, ChETAA and ChIEF were
characterized in vitro using both the lentiviral and the AAV constructs. For parameters that
depend on single-molecule properties (steady-state/peak ratio, action spectrum, light
sensitivity and kinetics), values were pooled across experiments after confirming that
datasets were not statistically different. Photocurrent properties of the hyperpolarizing tools
were assessed in two separate rounds of experiments. eNpHR3.0 photocurrent magnitudes
were statistically different between the two datasets, so we only combined datasets when
considering normalized values or intrinsic single-molecule properties (action spectrum, light
sensitivity and kinetics) after confirming that eNpHR3.0 performed similarly across
datasets.
Whole-cell spikes were defined as rising above a high threshold (−20 mV for the
comparison of fast depolarizing tools in slice; 0 mV for all other comparisons) and then
dropping below a low threshold (−30 mV). Subsequent spikes that occurred within 2 ms of a
prior spike were ignored. To detect spikes elicited by light, we defined a window of time
from 1ms to 50 ms after the pulse onset. Above 20 Hz, this window was truncated to 1 ms
after the current pulse onset to 1 ms after the subsequent pulse onset. The window around
the last light pulse was truncated to the same duration. Cell-attached spikes were identified
Mattis et al. Page 23
Nat Methods. Author manuscript; available in PMC 2014 September 17.
HH
MI A
uthor Manuscript
HH
MI A
uthor Manuscript
HH
MI A
uthor Manuscript
using the threshold function in ClampFit. Very small, broad events were not included as
spikes. Where the spike data was ambiguous, the trace was inspected manually. For each
whole-cell pulse train we calculated the proportion of light pulses that elicited ≥1 spike
(pulse efficacy) and that elicited > 1 spike (multiple spike likelihood).
Plateau potentials were defined as the offset of the spike waveform from the baseline. For
the depolarizing tools in vitro, all cells that fired ≥ 1 spike were included for analysis. For
the fast-spiking cells in slice, only traces that had 100% pulse efficacy were included for
analysis. Temporal stationarity, the extent to which spiking is sustained at the same
reliability over time, was calculated by dividing the light pulses into quartiles and computing
the pulse efficacy each quartile. Latency and latency spread across pulse trains were
determined as follows: for each light pulse, we measured the time delta from the light pulse
onset to the spike time. Latency is the average of these time deltas, and latency spread is the
s.d. of these time deltas. Note that latency spread therefore is a measure of how variable the
latencies are in each cell, whereas the error bars on latency are the standard error of mean
latencies across cells. Traces in which the cell fired < 5 action potentials were excluded from
analysis.
Statistical analysis
All statistical analysis was performed using GraphPad Prism version 5.04 for Windows
(GraphPad Software). For two-sample comparisons of a single variable (such as kinetics of
ChETAA versus ChIEF in slice), we first tested whether the data followed a Gaussian
distribution (Shapiro-Wilk normality test). If the data were detectably non-Gaussian, we
performed a non-parametric Mann-Whitney test. If the data well-approximated a Gaussian,
we performed an independent, two-sample t-test (equal variance). In the case of unequal
variance (determined by an F test), we applied Welch’s correction. All tests were two-tailed
with confidence levels of 95%.
For multiway comparisons of a single variable (such as kinetics) we first tested whether the
data followed a Gaussian distribution (Shapiro-Wilk normality test). In cases in which
distributions were detectably non-Gaussian, we used a square root transformation to
stabilize the variance and make the data approximately normal and then compared all data
against one specified ‘control’, correcting for family-wise error using Dunnett’s test. If the
transformed data were still non-Gaussian, we used the nonparametric Dunn’s test. In all
cases, we maintained overall significance levels of alpha = 0.05 (95% confidence interval).
Comparisons between larger numbers of tools will therefore have a more conservative alpha
(more stringent requirement for significance). This may also result in different significance
values assigned to the same comparison, depending on how many comparisons are being
performed in parallel. In particular, as some of the same ChR2 and ChETAA data were
included in two comparisons, discrepancies in reported significance values can be attributed
to the context of the comparison.
For comparisons across multiple variables (such as spiking performance across frequencies),
we performed two-way ANOVAs followed by post-tests between pairs or against a specified
‘control’. We used a conservative Bonferroni’s correction to control the false positive rate.
To test the relationship between two properties (such as τoff versus EPD50), we performed a
Mattis et al. Page 24
Nat Methods. Author manuscript; available in PMC 2014 September 17.
HH
MI A
uthor Manuscript
HH
MI A
uthor Manuscript
HH
MI A
uthor Manuscript

nonparametric, two-tailed Spearman correlation with a confidence level of 95%. To estimate
the slope, we performed a least-squares regression (either linear or linear on log-log
transformed data), minimizing relative distance squared (1/Y2).
To test the dependency of a property on an experimental condition (for example,
photocurrent versus light power density), we performed regressions as follows. First, for
analysis of time to peak versus light power density, we performed linear regression on log-
log transformed data and we compare whether, for each, the best-fit slope differs
significantly from 0. Second, for analysis of recovery from desensitization, we used a
nonlinear regression to fit the mean photocurrent recovery data with a two-phase association
curve, constraining Y0 = 0 and plateau = 1. This fit was used to generate the curves and the
R-squared values. In a separate analysis, we fit the data for each individual cell, to calculate
the time required for 50% recovery. Third, for analysis of light sensitivities, we fit the raw
population means with a one-site specific binding curve: Y = Bmax × X/(Kd + X). In a
separate analysis, we normalized the photocurrents for each cell, and plotted the population
means and standard errors for each tool. This population data was fit the same way to
generate the curves and the R2 values. For each individual cell, we obtained an equilibrium
binding constant (Kd), which we refer to as EPD50 (50% effective light power density).
Population significance thresholds were always set at P < 0.05 (*), P < 0.01 (**), and P <
0.001 (***) for the entire family of comparisons. All data in graphs are shown as mean ±
s.e.m.
Immunohistochemistry
Six or four weeks after injection, mice were perfused transcardially with PBS followed by
4% paraformaldehyde (PFA). After an overnight post-fix in PFA, brains were equilibrated in
30% sucrose in PBS for at least 24 h. We obtained 40-µm sections using a frozen
microtome, DAPI-stained them (1:50,000), and ‘cover-slipped’ them with Polyvinyl
Alcohol mounting medium containing the antifading agent 1,4-diazabicyclo[2.2.2]octane
(PVA-DABCO) (Sigma-Aldrich). Transfected primary hippocampal cultures were fixed for
15 min with 4% PFA. For staining with KDEL, cultures were then permeabilized for 30 min
with 0.4% saponin in 2% normal donkey serum (NDS). Primary antibody incubations were
performed overnight at 4 °C using a monoclonal antibody marking endogenous ER-resident
proteins containing the KDEL retention signal (KDEL 1:200, Abcam). Secondary antibodies
(Jackson ImmunoResearch) were applied in 2% NDS for 1 h at room temperature.
Equipment and settings
All images were obtained on a Leica confocal microscope (DM600B) as 1,024 × 1,024 pixel
resolution (pixel dimensions were 3.03 µm2). Images were acquired using the following
objectives: 10×, 0.40 NA (air), 40×, 1.25 NA (oil) and 63×, 1.40 NA (oil). Excitation and
emission wavelengths were as follows: eYFP in Figure 5b, 514 nm/512–600 nm (excitation/
emission); eYFP for all other figures, 488 nm/500–545 nm; GFP, 488 nm/500–600 nm; Cy5,
633 nm/650–750 nm. For the following figures we used line averaging: Figure 3e,h (across
two lines), Figure 5b (across four lines), Figure 6a (across three lines), Supplementary
Figure 15a (across four lines). Consistent settings were used for all images in each given
Mattis et al. Page 25
Nat Methods. Author manuscript; available in PMC 2014 September 17.
HH
MI A
uthor Manuscript
HH
MI A
uthor Manuscript
HH
MI A
uthor Manuscript

figure panel. The brightness and contrast of all eYFP images for Figure 5b were uniformly
and identically modified in Photoshop (Adobe). All other images were unprocessed after
acquisition.
Quantification of fluorescence in transfected cells
Fluorescence images were acquired from the same cells that were patched to enable
quantification of expression levels and photocurrent/ fluorescence relationships. Images
were acquired with Metamorph, maintaining constant settings, and processed offline using
ImageJ. Hand-drawn regions of interest encompassed the soma and proximal dendrites.
Supplementary Material
Refer to Web version on PubMed Central for supplementary material.
Acknowledgments
We thank A. Andalman, T. Davidson, I. Diester, S. Evans, I. Goshen, D. Mattis, I. Witten, L. Grosenick, S.-Y. Kimand C. Perry for helpful discussions, M. Lin (Stanford University) for ChIEF clones, and all memebers of theDeisseroth laboratory for their support. All viruses were packaged at University of North Carolina Vector Core.Supported by Bio-X and the Stanford Medical Scientist Training Program (J.M.), the US National Institute ofMental Health (1F32MH088010-01, K.M.T.), and the International Fulbright Science and Technology Award and aStanford Graduate Fellowship (E.A.F.). K.D. is supported by National Institute of Mental Health, National Instituteon Drug Abuse, National Institute of Neurological Disorders and Stroke, Howard Hughes Medical Institute, theDefense Advanced Research Projects Agency Reorganization and Plasticity to Accelerate Injury RecoveryProgram, the Keck Foundation, the McKnight Foundation and the Gatsby Charitable Foundation.
References
1. Deisseroth K. Optogenetics. Nat. Methods. 2011; 8:26–29. [PubMed: 21191368]
2. Deisseroth K. Controlling the brain with light. Sci. Am. 2010; 303:48–55. [PubMed: 21033283]
3. Fenno L, Yizhar O, Deisseroth K. The development and application of optogenetics. Annu. Rev.Neurosci. 2011; 34:389–412. [PubMed: 21692661]
4. Yizhar O, Fenno LE, Davidson TJ, Mogri M, Deisseroth K. Optogenetics in neural systems.Neuron. 2011; 71:9–34. [PubMed: 21745635]
5. Wang C, Kane MA, Napoli JL. Multiple retinol and retinal dehydrogenases catalyze all-trans-retinoic acid biosynthesis in astrocytes. J. Biol. Chem. 2011; 286:6542–6553. [PubMed: 21138835]
6. Boyden ES, Zhang F, Bamberg E, Nagel G, Deisseroth K. Millisecond-timescale, geneticallytargeted optical control of neural activity. Nat. Neurosci. 2005; 8:1263–1268. [PubMed: 16116447]
7. Li X, et al. Fast noninvasive activation and inhibition of neural and network activity by vertebraterhodopsin and green algae channelrhodopsin. Proc. Natl. Acad. Sci. USA. 2005; 102:17816–17821.[PubMed: 16306259]
8. Bi A, et al. Ectopic expression of a microbial-type rhodopsin restores visual responses in mice withphotoreceptor degeneration. Neuron. 2006; 50:23–33. [PubMed: 16600853]
9. Ishizuka T, Kakuda M, Araki R, Yawo H. Kinetic evaluation of photosensitivity in geneticallyengineered neurons expressing green algae light-gated channels. Neurosci. Res. 2006; 54:85–94.[PubMed: 16298005]
10. Nagel G, et al. Light activation of channelrhodopsin-2 in excitable cells of Caenorhabditis eleganstriggers rapid behavioral responses. Curr. Biol. 2005; 15:2279–2284. [PubMed: 16360690]
11. Yizhar O, et al. Neocortical excitation/inhibition balance in information processing and socialdysfunction. Nature. 2011; 477:171–178. [PubMed: 21796121]
12. Gradinaru V, et al. Targeting and readout strategies for fast optical neural control in vitro and invivo . J. Neurosci. 2007; 27:14231–14238. [PubMed: 18160630]
Mattis et al. Page 26
Nat Methods. Author manuscript; available in PMC 2014 September 17.
HH
MI A
uthor Manuscript
HH
MI A
uthor Manuscript
HH
MI A
uthor Manuscript

13. Gunaydin LA, et al. Ultrafast optogenetic control. Nat Neurosci. 2010; 13:387–392. [PubMed:20081849]
14. Berndt A, et al. High-efficiency channelrhodopsins for fast neuronal stimulation at low light levels.Proc. Natl. Acad. Sci. USA. 2011; 108:7595–7600. [PubMed: 21504945]
15. Berndt A, Yizhar O, Gunaydin LA, Hegemann P, Deisseroth K. Bi-stable neural state switches.Nat. Neurosci. 2009; 12:229–234. [PubMed: 19079251]
16. Kleinlogel S, et al. Ultra light-sensitive and fast neuronal activation with the Ca(2+)-permeablechannelrhodopsin CatCh. Nat Neurosci. 2011; 14:513–518. [PubMed: 21399632]
17. Zhang F, et al. Red-shifted optogenetic excitation: a tool for fast neural control derived fromVolvox carteri . Nat. Neurosci. 2008; 11:631–633. [PubMed: 18432196]
18. Govorunova EG, Spudich EN, Lane CE, Sineshchekov OA, Spudich JL. New channelrhodopsinwith a red-shifted spectrum and rapid kinetics from Mesostigma viride . MBio. 2011; 2:e00115–11. [PubMed: 21693637]
19. Lin JY, Lin MZ, Steinbach P, Tsien RY. Characterization of engineered channelrhodopsin variantswith improved properties and kinetics. Biophys. J. 2009; 96:1803–1814. [PubMed: 19254539]
20. Wang H, et al. Molecular determinants differentiating photocurrent properties of twochannelrhodopsins from chlamydomonas. J. Biol. Chem. 2009; 284:5685–5696. [PubMed:19103605]
21. Wen L, et al. Opto-current-clamp actuation of cortical neurons using a strategically designedchannelrhodopsin. PLoS ONE. 2010; 5:e12893. [PubMed: 20886118]
22. Stehfest K, Hegemann P. Evolution of the channelrhodopsin photocycle model. ChemPhysChem.2010; 11:1120–1126. [PubMed: 20349494]
23. Bamann C, Kirsch T, Nagel G, Bamberg E. Spectral characteristics of the photocycle ofchannelrhodopsin-2 and its implication for channel function. J. Mol. Biol. 2008; 375:686–694.[PubMed: 18037436]
24. Sugiyama Y, et al. Photocurrent attenuation by a single polar-to-nonpolar point mutation ofchannelrhodopsin-2. Photochem. Photobiol. Sci. 2009; 8:328–336. [PubMed: 19255673]
25. Hedrick T, Waters TH. Spiking patterns of neocortical L5 pyramidal neurons in vitro change withtemperature. Front Cell Neurosci. 2011; 5:1. [PubMed: 21286222]
26. Lin JY. A user’s guide to channelrhodopsin variants: features, limitations and future developments.Exp. Physiol. 2010; 96:19–25. [PubMed: 20621963]
27. Cardin JA, et al. Driving fast-spiking cells induces gamma rhythm and controls sensory responses.Nature. 2009; 459:663–667. [PubMed: 19396156]
28. Sohal VS, Zhang F, Yizhar O, Deisseroth K. Parvalbumin neurons and gamma rhythms enhancecortical circuit performance. Nature. 2009; 459:698–702. [PubMed: 19396159]
29. Tsai HC, et al. Phasic firing in dopaminergic neurons is sufficient for behavioral conditioning.Science. 2009; 324:1080–1084. [PubMed: 19389999]
30. Atasoy D, Aponte Y, Su HH, Sternson SMA. FLEX switch targets Channelrhodopsin-2 to multiplecell types for imaging and long-range circuit mapping. J. Neurosci. 2008; 28:7025–7030.[PubMed: 18614669]
31. Chater TE, Henley JM, Brown JT, Randall AD. Voltage- and temperature-dependent gating ofheterologously expressed channelrhodopsin-2. J. Neurosci. Methods. 2010; 193:7–13. [PubMed:20691205]
32. Zhang F, et al. Multimodal fast optical interrogation of neural circuitry. Nature. 2007; 446:633–639. [PubMed: 17410168]
33. Gradinaru V, et al. Molecular and cellular approaches for diversifying and extending optogenetics.Cell. 2010; 141:154–165. [PubMed: 20303157]
34. Han X, Boyden ES. Multiple-color optical activation, silencing, and desynchronization of neuralactivity, with single-spike temporal resolution. PLoS ONE. 2007; 2:e299. [PubMed: 17375185]
35. Witten IB, et al. Cholinergic interneurons control local circuit activity and cocaine conditioning.Science. 2010; 330:1677–1681. [PubMed: 21164015]
36. Stuber GD, et al. Excitatory transmission from the amygdala to nucleus accumbens facilitatesreward seeking. Nature. 2011; 475:377–380. [PubMed: 21716290]
Mattis et al. Page 27
Nat Methods. Author manuscript; available in PMC 2014 September 17.
HH
MI A
uthor Manuscript
HH
MI A
uthor Manuscript
HH
MI A
uthor Manuscript

37. Tye KM, et al. Amygdala circuitry mediating reversible and bidirectional control of anxiety.Nature. 2011; 471:358–362. [PubMed: 21389985]
38. Goshen I, et al. Dynamics of retrieval strategies for remote memories. Cell. 2011; 147:678–689.[PubMed: 22019004]
39. Gradinaru V, Thompson KR, Deisseroth K. eNpHR: a Natronomonas halorhodopsin enhanced foroptogenetic applications. Brain Cell Biol. 2008; 36:129–139. [PubMed: 18677566]
40. Chow BY, et al. High-performance genetically targetable optical neural silencing by light-drivenproton pumps. Nature. 2010; 463:98–102. [PubMed: 20054397]
41. Han X, et al. A high-light sensitivity optical neural silencer: development and application tooptogenetic control of non-human primate cortex. Front. Syst. Neurosci. 2011; 5:18. [PubMed:21811444]
42. Zimmermann D, et al. Effects on capacitance by overexpression of membrane proteins. Biochem.Biophys. Res. Commun. 2008; 369:1022–1026. [PubMed: 18331832]
43. Zhao Y, et al. An expanded palette of genetically encoded Ca(2+) indicators. Science. 2011;333:1888–1891. [PubMed: 21903779]
44. Goto Y, O’Donnell P. Network synchrony in the nucleus accumbens in vivo . J. Neurosci. 2001;21:4498–4504. [PubMed: 11404437]
45. Sanchez-Vives MV, McCormick DA. Cellular and network mechanisms of rhythmic recurrentactivity in neocortex. Nat Neurosci. 2000; 3:1027–1034. [PubMed: 11017176]
46. Nagel G, et al. Channelrhodopsin-2, a directly light-gated cation-selective membrane channel.Proc. Natl. Acad. Sci. USA. 2003; 100:13940–13945. [PubMed: 14615590]
47. Goold CP, Nicoll RA. Single-cell optogenetic excitation drives homeostatic synaptic depression.Neuron. 2010; 68:512–528. [PubMed: 21040851]
48. Lindsay TH, Thiele TR. Lockery, S.R. Optogenetic analysis of synaptic transmission in the centralnervous system of the nematode Caenorhabditis elegans . Nat Commun. 2011; 2:306. [PubMed:21556060]
49. Taylor CP, Dudek FE. Synchronous neural afterdischarges in rat hippocampal slices without activechemical synapses. Science. 1982; 218:810–812. [PubMed: 7134978]
50. Ren J, et al. Habenula “cholinergic” neurons co-release glutamate and acetylcholine and activatepostsynaptic neurons via distinct transmission modes. Neuron. 2011; 59:445–452. [PubMed:21315256]
Mattis et al. Page 28
Nat Methods. Author manuscript; available in PMC 2014 September 17.
HH
MI A
uthor Manuscript
HH
MI A
uthor Manuscript
HH
MI A
uthor Manuscript
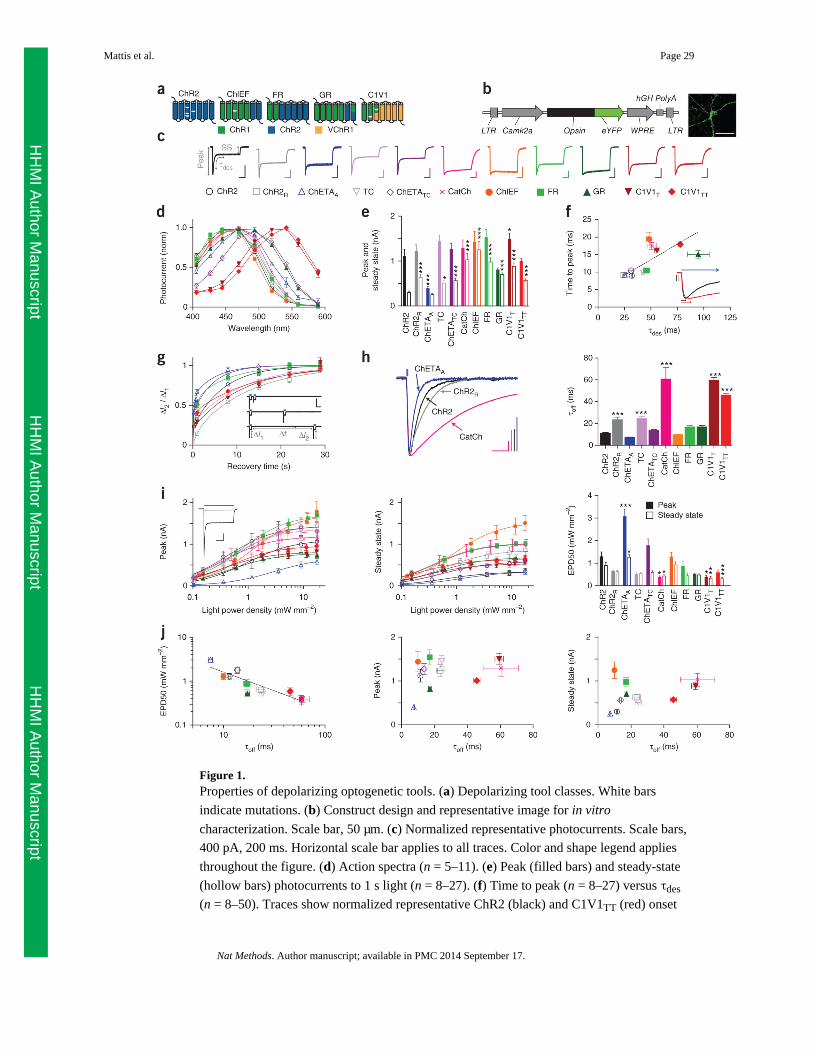
Figure 1.Properties of depolarizing optogenetic tools. (a) Depolarizing tool classes. White bars
indicate mutations. (b) Construct design and representative image for in vitro
characterization. Scale bar, 50 µm. (c) Normalized representative photocurrents. Scale bars,
400 pA, 200 ms. Horizontal scale bar applies to all traces. Color and shape legend applies
throughout the figure. (d) Action spectra (n = 5–11). (e) Peak (filled bars) and steady-state
(hollow bars) photocurrents to 1 s light (n = 8–27). (f) Time to peak (n = 8–27) versus τdes
(n = 8–50). Traces show normalized representative ChR2 (black) and C1V1TT (red) onset
Mattis et al. Page 29
Nat Methods. Author manuscript; available in PMC 2014 September 17.
HH
MI A
uthor Manuscript
HH
MI A
uthor Manuscript
HH
MI A
uthor Manuscript
photocurrents. Vertical scale bars represent 200 pA, bars indicate time to peak, and blue
arrow indicates ongoing light pulse. (g) Recovery from desensitization (n = 5–20). Vertical
and horizontal scale bars represent 1 nA and 2 s. (h) Normalized representative traces and
summary plots of τoff (n = 8–53). Scale bars, 200 pA and 25 ms. (i) Peak and steady-state
photocurrents across light intensities. Inset, representative ChR2 photocurrents at low (light
gray) versus high (dark gray) light intensity. Scale bars, 250 pA and 250 ms. EPD50 for
peak (filled bars) and steady state (hollow bars) (n = 5–15). (j) τoff versus EPD50 and peak
and steady-state photocurrents. All population data are plotted as mean ± s.e.m. *P < 0.05,
**P < 0.01 and *** P < 0.001. Unless otherwise indicated, C1V1T and C1V1TT were
activated with 560-nm light, and all other tools were activated with 470-nm light at ∼5 mW
mm−2.
Mattis et al. Page 30
Nat Methods. Author manuscript; available in PMC 2014 September 17.
HH
MI A
uthor Manuscript
HH
MI A
uthor Manuscript
HH
MI A
uthor Manuscript
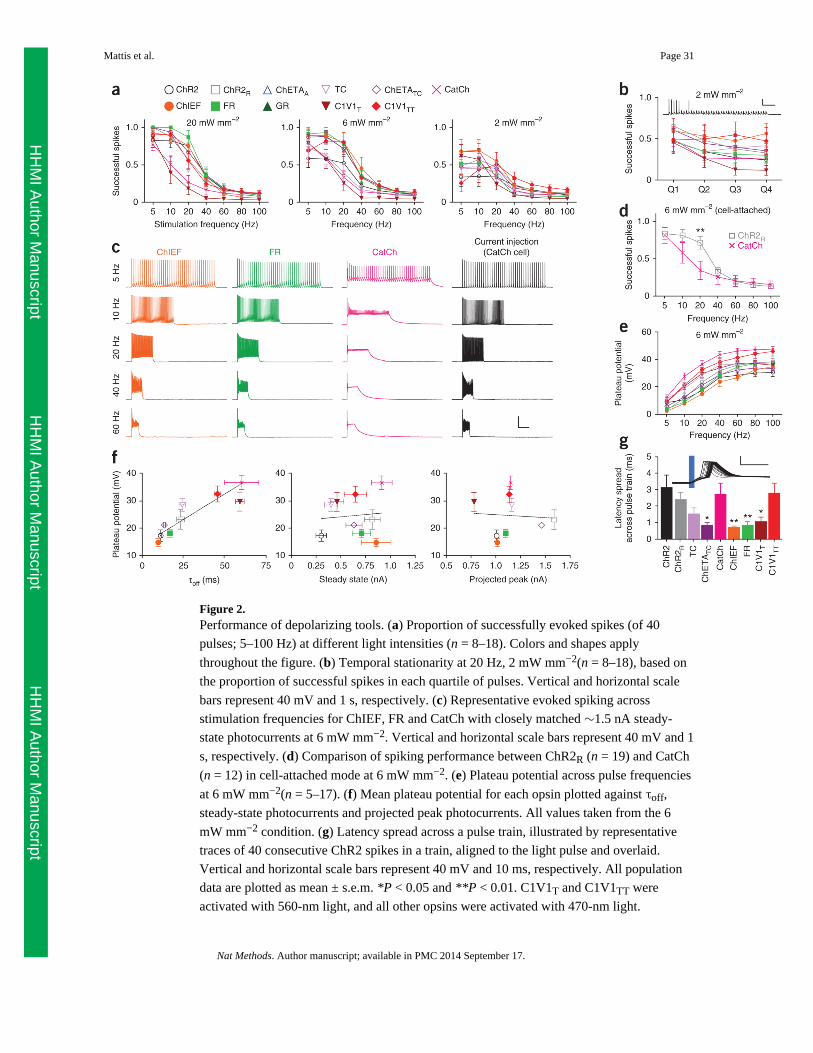
Figure 2.Performance of depolarizing tools. (a) Proportion of successfully evoked spikes (of 40
pulses; 5–100 Hz) at different light intensities (n = 8–18). Colors and shapes apply
throughout the figure. (b) Temporal stationarity at 20 Hz, 2 mW mm−2(n = 8–18), based on
the proportion of successful spikes in each quartile of pulses. Vertical and horizontal scale
bars represent 40 mV and 1 s, respectively. (c) Representative evoked spiking across
stimulation frequencies for ChIEF, FR and CatCh with closely matched ∼1.5 nA steady-
state photocurrents at 6 mW mm−2. Vertical and horizontal scale bars represent 40 mV and 1
s, respectively. (d) Comparison of spiking performance between ChR2R (n = 19) and CatCh
(n = 12) in cell-attached mode at 6 mW mm−2. (e) Plateau potential across pulse frequencies
at 6 mW mm−2(n = 5–17). (f) Mean plateau potential for each opsin plotted against τoff,
steady-state photocurrents and projected peak photocurrents. All values taken from the 6
mW mm−2 condition. (g) Latency spread across a pulse train, illustrated by representative
traces of 40 consecutive ChR2 spikes in a train, aligned to the light pulse and overlaid.
Vertical and horizontal scale bars represent 40 mV and 10 ms, respectively. All population
data are plotted as mean ± s.e.m. *P < 0.05 and **P < 0.01. C1V1T and C1V1TT were
activated with 560-nm light, and all other opsins were activated with 470-nm light.
Mattis et al. Page 31
Nat Methods. Author manuscript; available in PMC 2014 September 17.
HH
MI A
uthor Manuscript
HH
MI A
uthor Manuscript
HH
MI A
uthor Manuscript
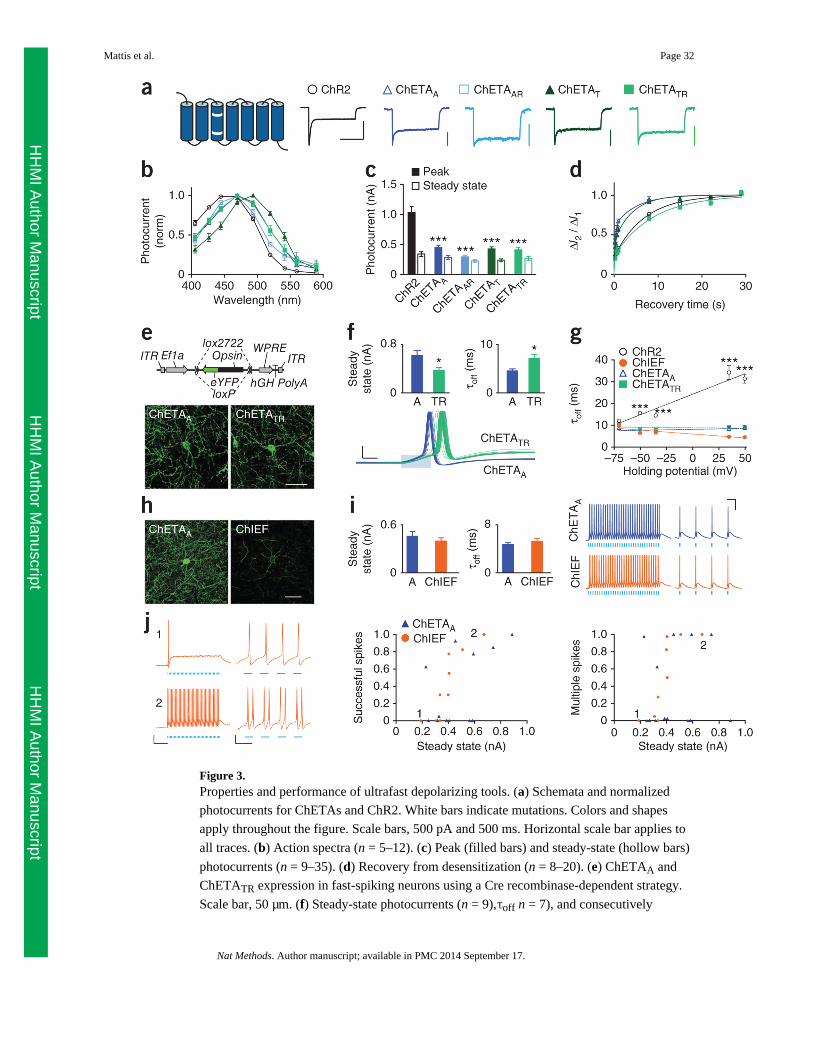
Figure 3.Properties and performance of ultrafast depolarizing tools. (a) Schemata and normalized
photocurrents for ChETAs and ChR2. White bars indicate mutations. Colors and shapes
apply throughout the figure. Scale bars, 500 pA and 500 ms. Horizontal scale bar applies to
all traces. (b) Action spectra (n = 5–12). (c) Peak (filled bars) and steady-state (hollow bars)
photocurrents (n = 9–35). (d) Recovery from desensitization (n = 8–20). (e) ChETAA and
ChETATR expression in fast-spiking neurons using a Cre recombinase-dependent strategy.
Scale bar, 50 µm. (f) Steady-state photocurrents (n = 9),τoff n = 7), and consecutively
Mattis et al. Page 32
Nat Methods. Author manuscript; available in PMC 2014 September 17.
HH
MI A
uthor Manuscript
HH
MI A
uthor Manuscript
HH
MI A
uthor Manuscript

evoked spikes for ChETAA and ChETATR (5 Hz, 2-ms light pulses). Scale bars, 20 mV and
1 ms. (g) τoff at −70 mV to +50 mV (n = 7–12). (h) ChETAA and ChIEF expression (scale
bar, 50 µm). (i) Steady-state photocurrents (n = 9–13),τoff (n = 7), and evoked high and low
frequency firing (200 Hz and 20 Hz). Scale bars, 25 mV and 25 ms. (j) ChIEF-expressing
neurons with small (190 pA) or large (510 pA) photocurrents, under stringent or permissive
conditions (1 ms or 5 ms pulse width). Vertical scale bar, 20 mV. Horizontal scale bars, 50
ms (left) and 10 ms (right). Spiking performance and multiple spike likelihood (under those
same conditions) for all cells. All population data is plotted as mean ± s.e.m. *P < 0.05 and
*** P < 0.001. Cells were illuminated with 470-nm light at ∼5 mW mm−2, unless otherwise
specified.
Mattis et al. Page 33
Nat Methods. Author manuscript; available in PMC 2014 September 17.
HH
MI A
uthor Manuscript
HH
MI A
uthor Manuscript
HH
MI A
uthor Manuscript

Figure 4.Relationship between off kinetics and light sensitivity of optogenetic tools. Summary plot
(on a log-log scale) of the relationship between τoff versus EPD50 for all depolarizing tools
from Figures 1 and 3, plus VChR1, SFO(C128S) and SSFO(C128S/D156A). Dashed line
represents best fit regression with R2 = 0.83; Spearman correlation coefficient R = −0.93, P
< 0.001. Values for SFO and SSFO were estimated from previous publications11,15 and did
not contribute to the regression or correlation calculations.
Mattis et al. Page 34
Nat Methods. Author manuscript; available in PMC 2014 September 17.
HH
MI A
uthor Manuscript
HH
MI A
uthor Manuscript
HH
MI A
uthor Manuscript

Figure 5.Properties of hyperpolarizing tools. (a) NpHR is an inward chloride pump (halorhodopsin
type; HR), whereas Arch, ArchT, and Mac are outward proton pumps (bacteriorhodopsin
type; BR). The 3.0 versions include the endoplasmic reticulum export sequence (ER) after
the fluorophore (which constitutes the 2.0 version) as well as a trafficking sequence (TS)
between opsin and fluorophore. (b) Confocal images of 1.0 (the originally described version
of the molecule) and 3.0 versions (green) expressed in culture and immunolabeled with an
ER marker (KDEL; red). Scale bar, 25 µm. (c) Representative traces and raw photocurrents
Mattis et al. Page 35
Nat Methods. Author manuscript; available in PMC 2014 September 17.
HH
MI A
uthor Manuscript
HH
MI A
uthor Manuscript
HH
MI A
uthor Manuscript

in response to 1 s light for 1.0 (open bars) versus 3.0 versions (closed bars) for Arch (n =
15–19), ArchT (n = 14–16) and Mac (n = 8–12). Vertical and horizontal scale bars represent
500 pA and 500 ms, respectively. Photocurrents were normalized to eNpHR3.0 values from
within the same experiment to enable direct comparisons across opsins (n = 8–35). (d)
Action spectra for 3.0 versions (n = 7–20) alongside ChR2 (black). (e) τon and τoff (n = 7–
35). Vertical and horizontal scale bars represent 200 pA and 5 ms, respectively. (f) EPD50
values for all hyperpolarizing opsins (n = 5–14). Raw photocurrent versus light power
density plotted alongside within-experiment eNpHR3.0 (n = 5–14). Population data are
plotted as mean ± s.e.m. *P < 0.05, **P < 0.01 and ***P < 0.001. Unless otherwise
indicated, eNpHR3.0 was activated with 590-nm light, and all other tools were activated
with 560-nm light, both at ∼5 mW mm−2.
Mattis et al. Page 36
Nat Methods. Author manuscript; available in PMC 2014 September 17.
HH
MI A
uthor Manuscript
HH
MI A
uthor Manuscript
HH
MI A
uthor Manuscript
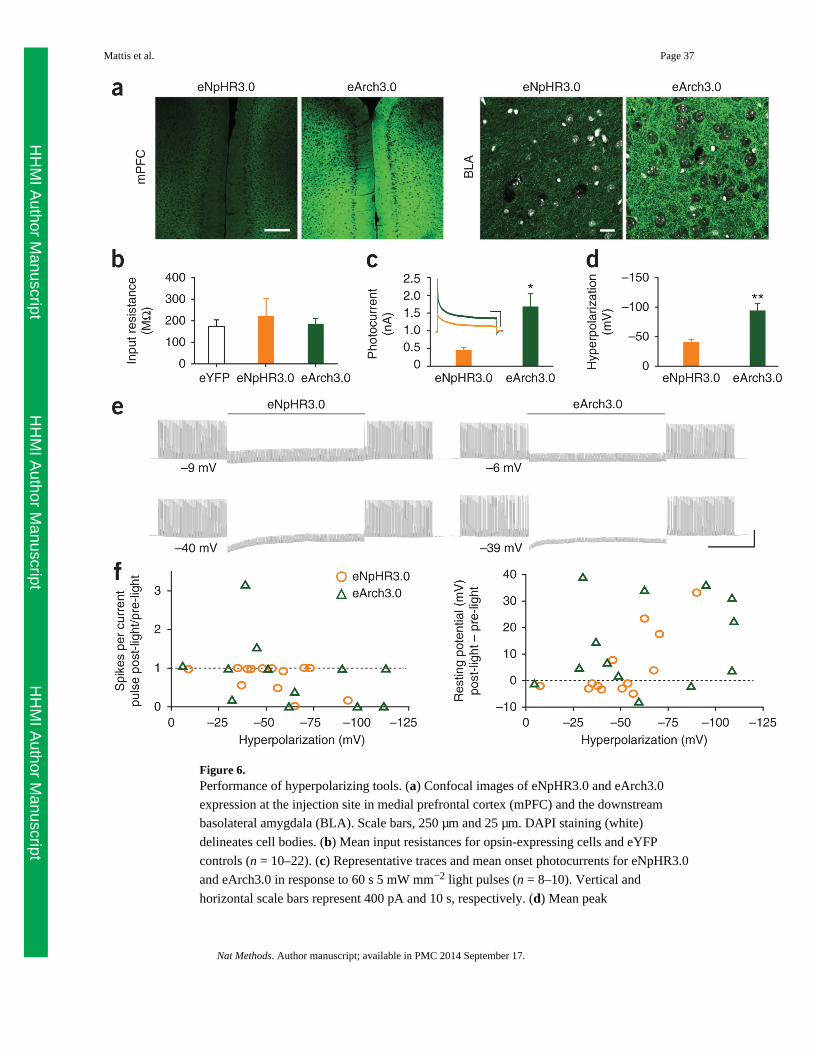
Figure 6.Performance of hyperpolarizing tools. (a) Confocal images of eNpHR3.0 and eArch3.0
expression at the injection site in medial prefrontal cortex (mPFC) and the downstream
basolateral amygdala (BLA). Scale bars, 250 µm and 25 µm. DAPI staining (white)
delineates cell bodies. (b) Mean input resistances for opsin-expressing cells and eYFP
controls (n = 10–22). (c) Representative traces and mean onset photocurrents for eNpHR3.0
and eArch3.0 in response to 60 s 5 mW mm−2 light pulses (n = 8–10). Vertical and
horizontal scale bars represent 400 pA and 10 s, respectively. (d) Mean peak
Mattis et al. Page 37
Nat Methods. Author manuscript; available in PMC 2014 September 17.
HH
MI A
uthor Manuscript
HH
MI A
uthor Manuscript
HH
MI A
uthor Manuscript

hyperpolarization generated by eNpHR3.0 and eArch3.0 with 60 s 5 mW mm−2 light pulses
(n = 6–10). (e) Suppression of current injection-evoked spiking in reliably firing cells by 60
s of continuous light in cells expressing eNpHR3.0 or eArch3.0. Cells were illuminated with
light power densities set to achieve approximately matched hyperpolarization. Vertical and
horizontal scale bars represent 40 mV and 20 s, respectively. (f) Relationship between
hyperpolarization magnitude and cell stability. Post-light recovery of evoked spiking
(relative to pre-light performance) and change in resting potential plotted against light-
evoked hyperpolarization. Population data are plotted as mean ± s.e.m. *P < 0.05 and **P <
0.01. eNpHR3.0 was activated with 590-nm light, and eArch3.0 was activated with 560-nm
light.
Mattis et al. Page 38
Nat Methods. Author manuscript; available in PMC 2014 September 17.
HH
MI A
uthor Manuscript
HH
MI A
uthor Manuscript
HH
MI A
uthor Manuscript