emission estimation technique manual · first published in june 1999 emission estimation technique...
TRANSCRIPT
First published in June 1999
�������������������� �����
Emission EstimationTechnique Manual
for
Nickel Concentrating, Smelting and Refining
Nickel Concentrating, Smelting & Refining i
EMISSION ESTIMATION TECHNIQUES
FOR
NICKEL CONCENTRATING, SMELTING AND REFINING
TABLE OF CONTENTS
1.0 INTRODUCTION ................................................................................................. 1
2.0 PROCESS DESCRIPTION................................................................................... 5
2.1 General............................................................................................................... 52.2 Nickel Sulfide Processing .............................................................................. 52.2.1 Concentrating............................................................................................................ 52.2.2 Smelting ..................................................................................................................... 72.2.3 Refining...................................................................................................................... 92.3 Nickel Laterite Pressure Acid Leach Process .............................................. 102.4 Nickel Laterite Ammonia Leach Process..................................................... 12
3.0 LIKELY EMISSIONS ............................................................................................ 14
3.1 Reporting Thresholds ..................................................................................... 163.1.1 Category 1.................................................................................................................. 163.1.2 Category 1a................................................................................................................ 173.1.3 Category 2a................................................................................................................ 173.1.4 Category 2b................................................................................................................ 173.1.5 Category 3.................................................................................................................. 17
4.0 EMISSION ESTIMATION .................................................................................. 18
4.1 Elements of the Environment ........................................................................ 244.1.1 Emissions to Air........................................................................................................ 244.1.2 Emissions to Water ................................................................................................... 244.1.3 Emissions to Land..................................................................................................... 25
5.0 MASS BALANCE .................................................................................................. 26
5.1 Water Balance ................................................................................................... 265.2 Metals ................................................................................................................. 275.3 Chemical Usage ................................................................................................ 295.4 Converter and Smelter Emissions ................................................................ 295.4.1 Emissions Estimation for Converter and Smelter Operations ........................... 305.4.2 Emissions Estimation for Fuel ................................................................................ 335.5 Cyanide Balance............................................................................................... 335.5.1 Cyanide Emissions from Storage and Mixing Areas........................................... 345.5.2 Cyanide Emissions from the Ore Processing Area.............................................. 345.5.3 Cyanide Emissions from TSFs ................................................................................ 35
6.0 EMISSION FACTORS.......................................................................................... 37
6.1 Carbon Disulfide ............................................................................................. 376.2 Dust: PM10 and Total Suspended Particulates (TSP)................................. 396.3 Metals in Dust .................................................................................................. 416.4 Sewage ............................................................................................................... 41
Nickel Concentrating, Smelting & Refining ii
NICKEL CONCENTRATING, SMELTING AND REFINING
TABLE OF CONTENTS CONT’
6.5 Combustion Emissions ...............................................................................426.6 Nickel .............................................................................................................426.7 Cyanide ..........................................................................................................436.7.1 Cyanide Emissions from the Ore Processing Area.......................................... 436.7.2 Cyanide Emissions from the TSFs...................................................................... 43
7.0 MODELLING .....................................................................................................45
7.1 Groundwater Modelling - Fates & Trajectories .....................................457.2 Seepage from TSFs ......................................................................................45
8.0 ENGINEERING CALCULATIONS ...............................................................46
9.0 DIRECT MEASUREMENT OR SOURCE MONITORING ......................47
9.1 Total Nitrogen and Total Phosphorus .....................................................479.2 Dust & PM10...................................................................................................489.3 Metals in Dust ..............................................................................................489.4 TSF Seepage..................................................................................................489.5 Cyanide ..........................................................................................................50
10.0 EMISSION FACTOR RATING ......................................................................51
11.0 DEFINITIONS....................................................................................................52
12.0 REFERENCES.....................................................................................................53
12.1 References Cited in Text...........................................................................5312.2 References Not Cited in Text...................................................................55
Appendix A - Generic Ore Assays..............................................................................56
Appendix B - Existing Data..........................................................................................59
Appendix C - Transfers.................................................................................................64
Nickel Concentrating, Smelting & Refining iii
NICKEL CONCENTRATING, SMELTING & REFINING
LIST OF FIGURES AND TABLES
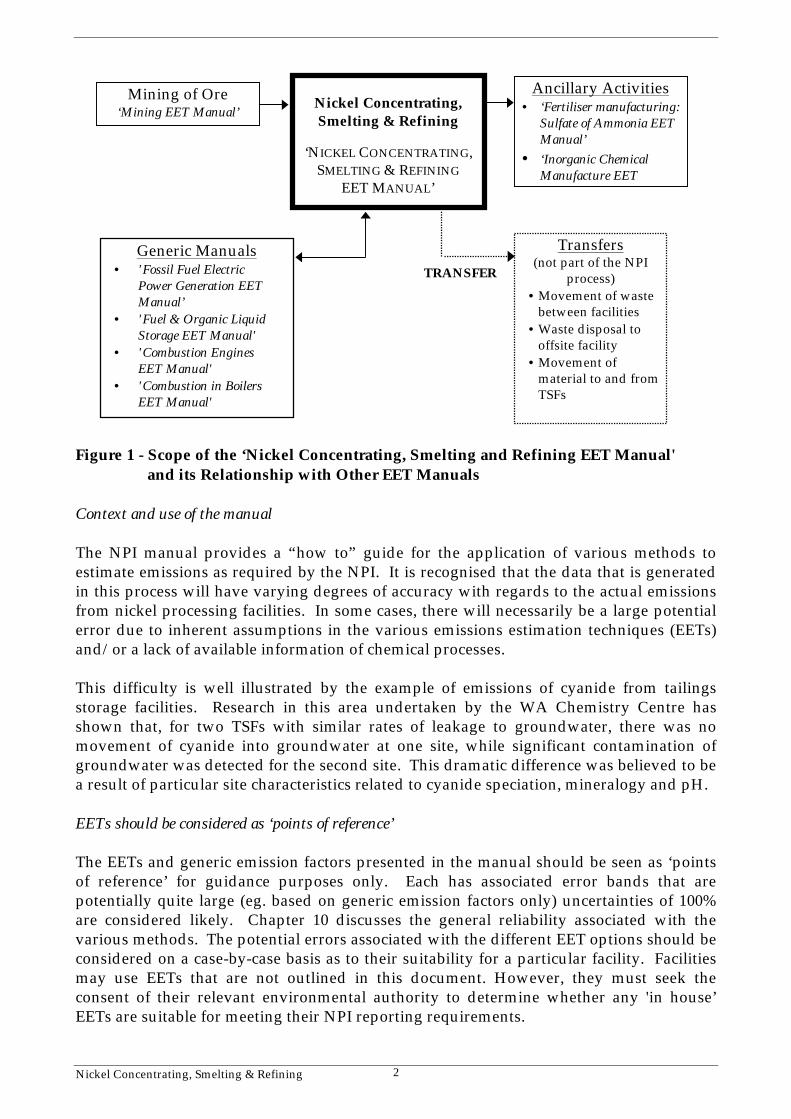
Figure 1 - Scope of the ‘Nickel Concentrating, Smelting and Refining EET Manual' 2
2 - Nickel Sulfide Concentrating Process Inputs and Emissions ............... 6
3 - Nickel Sulfide Smelting Process Inputs and Emissions......................... 8
4 - Nickel Sulfide Refining Process Inputs and Emissions ......................... 9
5 - Nickel Laterite Pressure Acid Leach Process Inputs and Emissions .... 11
6 - Nickel Laterite Ammonia Leach Process Inputs and Emissions........... 13
7 - TSF Water Balance ......................................................................................... 26
8 - Mass Balance Approach for Converter and Smelter Operations .......... 30
9 - Mass Balance of Sulfur Dioxide Emissions from Smelter and ConverterOperations............................................................................................................. 31
10 - Mass Balance of Cyanide Emissions from the Ore Processing Area.. 34
11 - Mass Balance of Cyanide Emissions from TSFs .................................... 35
12 - TSF Bore Hole Monitoring Approach ...................................................... 49
Table 1 - NPI-Listed Substances Likely to Trigger Thresholds, and ProposedMethods for Determining Emissions............................................................... 14
2 - Relevant NPI-Listed Substances for the Nickel Processing Industry, andAssociated Emission Estimation Methods...................................................... 21
3 - Emission Factors for Dust Generation ....................................................... 40
4 - Indicative Pollution Figures for Wastewater NPI Threshold Tripping 42
5 - Nickel Emission Factors from Primary Smelting Operations ............... 43
6 - Effect of pH on the Volatilisation of Cyanide .......................................... 44
Nickel Concentrating, Smelting & Refining 1
1.0 Introduction
The purpose of all Emission Estimation Technique (EET) Manuals in this series is to assistAustralian manufacturing, industrial and service facilities to report emissions of listedsubstances to the National Pollutant Inventory (NPI). This Manual describes theprocedures and recommended approaches for estimating emissions from facilitiesengaged in nickel concentrating, smelting and refining.
The scope of this document is to outline methods that can be used by the nickelconcentrating, smelting and refining industry to:
• identify which substances they are required to report as part of the National PollutantInventory (NPI); and
• estimate emissions of NPI substances to air, water and land from their facilities.
This handbook covers the concentrating, smelting and refining of nickel commencing fromthe delivery of ore to the processing facilities for crushing and milling, through smeltingand to the production of +99% pure nickel at the refinery, for the nickel sulfide andnickel/cobalt laterite processes.
It does not include extraction of ore, which is covered by the EET Manual for Mining.
Ancillary activities (eg. power generation, and ammonium sulfate and sulfuric acidproduction) are likewise not covered in this handbook but may be reportable under theNPI. These activities are covered by separate EET manuals.
The emission of NPI substances from processing facilities Tailings Storage Facilities (TSFs),waste management sites and sewerage systems are included in the reporting requirementsof the NPI, and are covered by this manual.
EET MANUAL: Nickel Concentrating, Smelting & Refining
HANDBOOK: Basic Non-Ferrous Metal Manufacturing
ANZSIC CODE : 2729
The scope of this manual is presented diagrammatically in Figure 1.
Nickel Concentrating, Smelting & Refining 2
Figure 1 - Scope of the ‘Nickel Concentrating, Smelting and Refining EET Manual' and its Relationship with Other EET Manuals
Context and use of the manual
The NPI manual provides a “how to” guide for the application of various methods toestimate emissions as required by the NPI. It is recognised that the data that is generatedin this process will have varying degrees of accuracy with regards to the actual emissionsfrom nickel processing facilities. In some cases, there will necessarily be a large potentialerror due to inherent assumptions in the various emissions estimation techniques (EETs)and/or a lack of available information of chemical processes.
This difficulty is well illustrated by the example of emissions of cyanide from tailingsstorage facilities. Research in this area undertaken by the WA Chemistry Centre hasshown that, for two TSFs with similar rates of leakage to groundwater, there was nomovement of cyanide into groundwater at one site, while significant contamination ofgroundwater was detected for the second site. This dramatic difference was believed to bea result of particular site characteristics related to cyanide speciation, mineralogy and pH.
EETs should be considered as ‘points of reference’
The EETs and generic emission factors presented in the manual should be seen as ‘pointsof reference’ for guidance purposes only. Each has associated error bands that arepotentially quite large (eg. based on generic emission factors only) uncertainties of 100%are considered likely. Chapter 10 discusses the general reliability associated with thevarious methods. The potential errors associated with the different EET options should beconsidered on a case-by-case basis as to their suitability for a particular facility. Facilitiesmay use EETs that are not outlined in this document. However, they must seek theconsent of their relevant environmental authority to determine whether any 'in house’EETs are suitable for meeting their NPI reporting requirements.
Mining of Ore‘Mining EET Manual’
Nickel Concentrating,Smelting & Refining
‘NICKEL CONCENTRATING,SMELTING & REFINING
EET MANUAL’
Ancillary Activities• ‘Fertiliser manufacturing:
Sulfate of Ammonia EETManual’
• ‘Inorganic ChemicalManufacture EET
TRANSFER
Transfers(not part of the NPI
process)• Movement of waste
between facilities• Waste disposal to
offsite facility• Movement of
material to and fromTSFs
Generic Manuals• 'Fossil Fuel Electric
Power Generation EETManual’
• 'Fuel & Organic LiquidStorage EET Manual'
• 'Combustion EnginesEET Manual'
• 'Combustion in BoilersEET Manual'
Nickel Concentrating, Smelting & Refining 3
Hierarchical approach recommended in applying EETs
The manual presents a number of different EETs, each of which could be applied to theestimation of NPI substances. The range of available methods should be viewed as ahierarchy of available techniques in terms of the error associated with the estimate. Eachsubstance needs to be considered in terms of the level of error that is acceptable orappropriate with the use of the various estimation techniques. Also, the availability ofpre-existing data and the effort required to decrease the error associated with the estimatewill need to be considered. For example, if emissions of a substance are clearly very smallno matter which EET is applied, then there would be little gained by applying an EETwhich required significant additional sampling.
The steps in meeting the reporting requirements of the NPI can be summarised as follows:
• for Category 1 and 1a substances identify which reportable NPI substances are used (orhandled by way of their incidental presence in ore or materials, or exceeds the bulkstorage capacity for 1a), and determine whether the amounts used or handled are abovethe “threshold” values and therefore trigger reporting requirements;
• for Category 2a and 2b substances determine the amount and rate of fuel (or waste)burnt each year, the annual power consumption and the maximum potential powerconsumption, and assess whether the threshold limits are exceeded;
• for Category 3 substances determine the annual emissions to water and assess whetherthe threshold limits are exceeded; and
• for those substances above the threshold values, examine the available range of EETsand determine emission estimates using the most appropriate EET.
Generally it will be appropriate to consider various EETs as alternative options whosesuitability should be evaluated in terms of:
• the associated reliability or error bands; and• the cost/benefit of using a more reliable method.
The accuracy of particular EETs is discussed in Chapter 10 - Emission Factor Rating.
NPI emissions in the environmental context
It should be noted that the NPI reporting process generates emission estimates only. Itdoes not attempt to relate emissions to potential environmental impacts, bioavailability ofemissions, natural background levels etc.
Facilities may undertake ‘Ancillary Activities’, such as the production of hydrochloric acidor ammonium sulfate, either as a process input or through processing of waste steams.When estimating emissions a facility should ensure that emissions are not ‘doubleaccounted’ (See Section 4) and process maps should be used to minimise the potential forthis.
The manual is structured to allow facilities to work through the manual addressing issuesin a structured and coherent manner.
Nickel Concentrating, Smelting & Refining 4
Likely emissions from facilities are discussed in Section 3, while Section 4 discusses theapproach to emissions estimation and those elements of the environment where emissionsmay result.
Sections 5, 6, 7, 8 and 9 address the EETs likely to be used by the industry. This approachhas been adopted in order to demonstrate how an EET may be applied to estimatingemissions of a substance and supported by other EETs. For example facilities may chooseto use a mass balance approach to their estimation of cyanide emissions. However themass balance EET is likely to be supported by direct monitoring data and emission factors.
This manual has been prepared by PPK Environment & Infrastructure Pty Ltd on behalf ofthe WA Department of Environmental Protection. Funding for the project was providedby Environment Australia. It has been developed through a process of nationalconsultation involving State and Territory environmental authorities, and industrygroups. Particular thanks are due to Western Mining Corporation for its’ comments,advice and information.
Nickel Concentrating, Smelting & Refining 5
2.0 Process Description
2.1 General
Australia supplies 10% of world nickel production, most of which comes from WesternAustralia.
Nickel occurs naturally in two forms; as sulfide ores or laterite (oxide) ores.
• Sulfide ores are generally deep, hard rock deposits, which may be mined by acombination of open-cut and underground mining techniques.
• In laterite ores the weathering process has converted the nickel sulfides to oxide oreswithin the near-surface weathering zone. Laterite deposits are clay-rich “soft” deposits,extracted by open-cut mining.
Distinct processes are applied to the concentrating, smelting and refining of the ores fromthese sources.
Representative processes are discussed below and example process maps/flowsheets arepresented as a source of reference. Refining processes at facilities across Australia willvary, and the flowsheets presented in this manual are not intended to be a comprehensiveanalysis of nickel processing techniques
As it is not possible to address the specific processes used at all Australia based nickelprocessing facilities in this manual, facilities are advised to use their own processmaps/flow sheets to assist in structuring and addressing NPI reporting requirements.
2.2 Nickel Sulfide Processing
Nickel sulfide processing can be separated into the three processing stages: concentrating,smelting and refining. These stages are often carried out at distinct facilities and as suchhave been presented in this manner to simplify appreciation of operational issues.
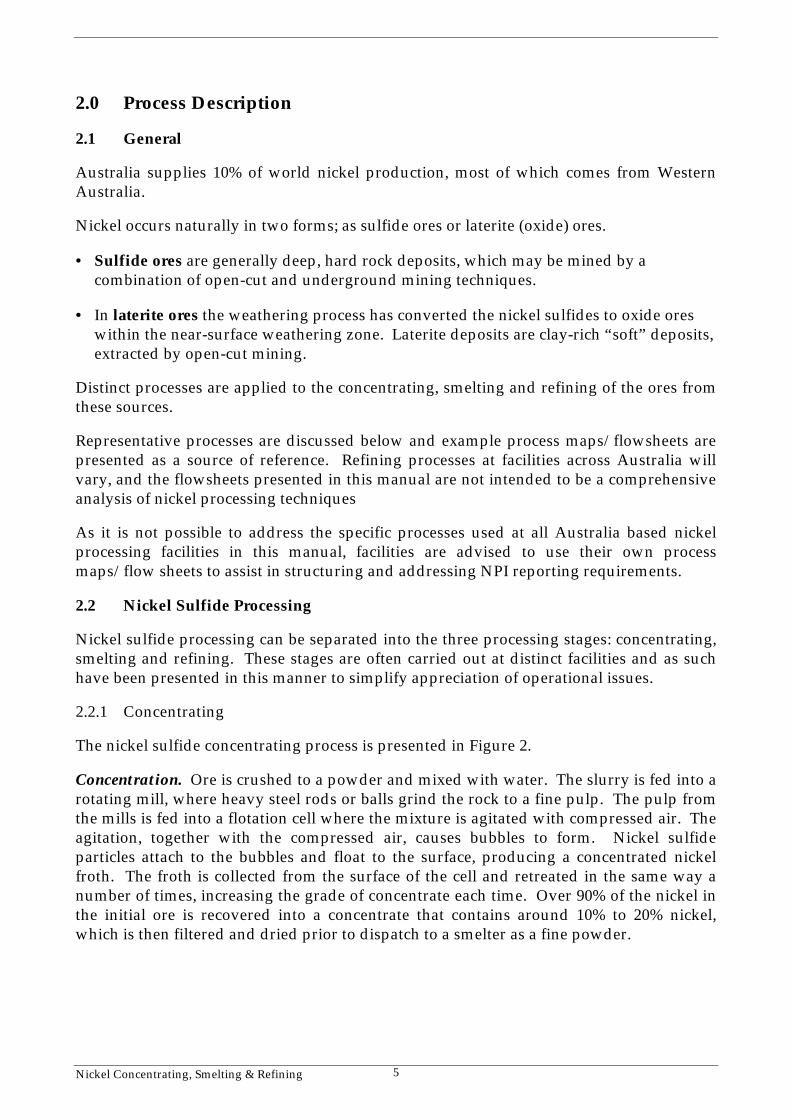
2.2.1 Concentrating
The nickel sulfide concentrating process is presented in Figure 2.
Concentration. Ore is crushed to a powder and mixed with water. The slurry is fed into arotating mill, where heavy steel rods or balls grind the rock to a fine pulp. The pulp fromthe mills is fed into a flotation cell where the mixture is agitated with compressed air. Theagitation, together with the compressed air, causes bubbles to form. Nickel sulfideparticles attach to the bubbles and float to the surface, producing a concentrated nickelfroth. The froth is collected from the surface of the cell and retreated in the same way anumber of times, increasing the grade of concentrate each time. Over 90% of the nickel inthe initial ore is recovered into a concentrate that contains around 10% to 20% nickel,which is then filtered and dried prior to dispatch to a smelter as a fine powder.

Nickel Concentrating, Smelting & Refining 6
Figure 2 - Nickel Sulfide Concentrating Process Inputs and Emissions
INPUTS EMISSIONS
Crushing & Milling
Flotation
Thickening & Drying
Hydrocyclone
Thickener
TSFs
Coarse sand usedfor mine backfill
Nickel SulfideConcentrate
(13 - 20%)
Ore
Soda Ash orLime Metals, PM10
CS2, HCN
Collector (Xanthate), frother, activator,depressant, lime, CaO, cyanide
Power/Fuel Products of combustion, CS2
PM10, cyanide, metals
Nickel Concentrating, Smelting & Refining 7
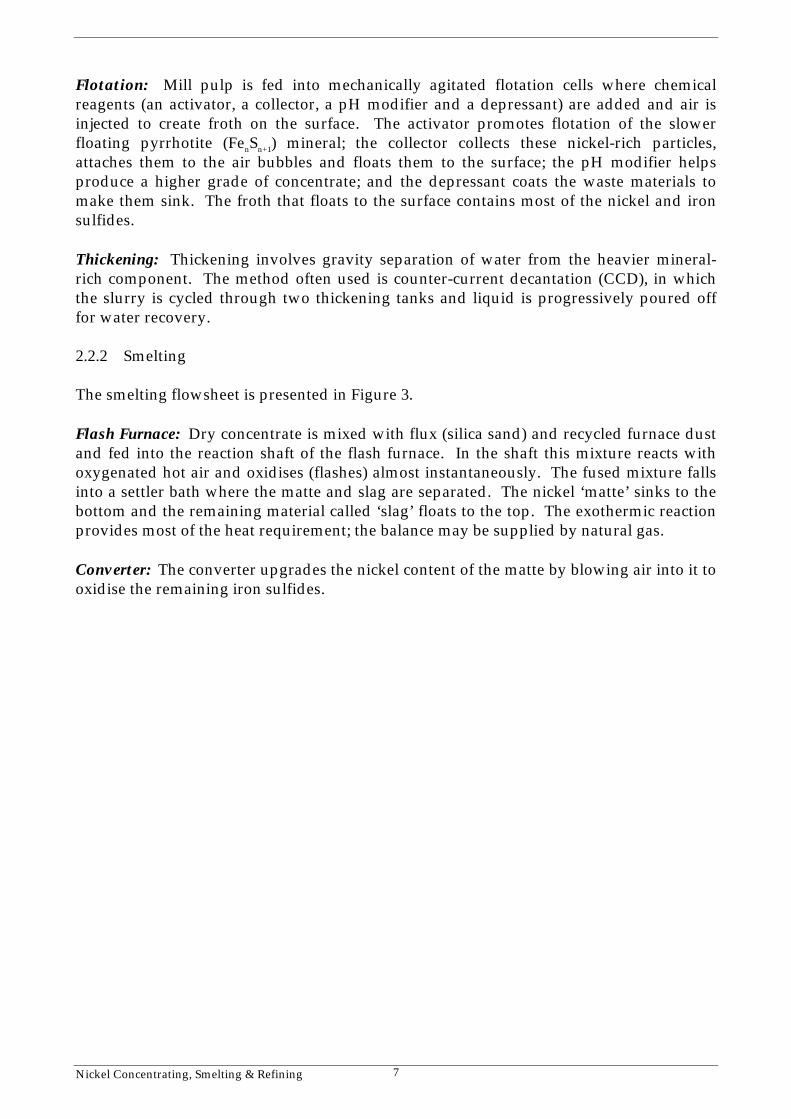
Flotation: Mill pulp is fed into mechanically agitated flotation cells where chemicalreagents (an activator, a collector, a pH modifier and a depressant) are added and air isinjected to create froth on the surface. The activator promotes flotation of the slowerfloating pyrrhotite (FenSn+1) mineral; the collector collects these nickel-rich particles,attaches them to the air bubbles and floats them to the surface; the pH modifier helpsproduce a higher grade of concentrate; and the depressant coats the waste materials tomake them sink. The froth that floats to the surface contains most of the nickel and ironsulfides.
Thickening: Thickening involves gravity separation of water from the heavier mineral-rich component. The method often used is counter-current decantation (CCD), in whichthe slurry is cycled through two thickening tanks and liquid is progressively poured offfor water recovery.
2.2.2 Smelting
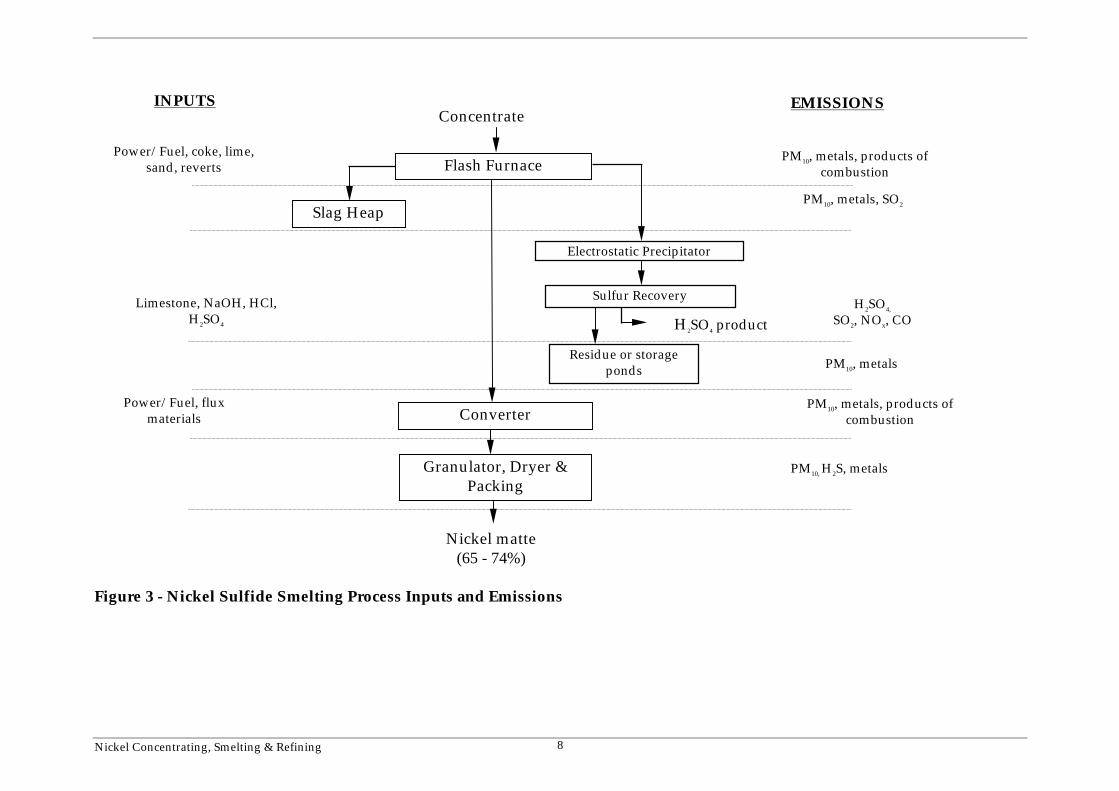
The smelting flowsheet is presented in Figure 3.
Flash Furnace: Dry concentrate is mixed with flux (silica sand) and recycled furnace dustand fed into the reaction shaft of the flash furnace. In the shaft this mixture reacts withoxygenated hot air and oxidises (flashes) almost instantaneously. The fused mixture fallsinto a settler bath where the matte and slag are separated. The nickel ‘matte’ sinks to thebottom and the remaining material called ‘slag’ floats to the top. The exothermic reactionprovides most of the heat requirement; the balance may be supplied by natural gas.
Converter: The converter upgrades the nickel content of the matte by blowing air into it tooxidise the remaining iron sulfides.
Nickel Concentrating, Smelting & Refining 8
Figure 3 - Nickel Sulfide Smelting Process Inputs and Emissions
Flash Furnace
Converter
Granulator, Dryer &Packing
Slag Heap
Electrostatic Precipitator
Sulfur Recovery
Residue or storageponds
H2SO4 product
Nickel matte(65 - 74%)
EMISSIONSINPUTS
Power/Fuel, coke, lime,sand, reverts
PM10, metals, products ofcombustion
PM10, metals, SO2
Power/Fuel, fluxmaterials
Limestone, NaOH, HCl,H2SO4
H2SO4,
SO2, NOx, CO
PM10, metals, products ofcombustion
PM10, metals
PM10, H2S, metals
Concentrate

Nickel Concentrating, Smelting & Refining 9
2.2.3 Refining
An example nickel refining flowsheet is presented in Figure 4. Figure 4 is representativeof one refining process. Facilities utilising other processes should refer to their facility-specific flowsheets.
Figure 4 - Nickel Sulfide Refining Process Inputs and Emissions
Reduction
Flash Tanks
Liquor Stripping
Mixedsulfides
Ammoniumsulfate
(NH4)2SO4
Washing, filtering& drying
Briquetting
Sintering
Nickel Briquettes(+99%)
INPUTS EMISSIONS
Grinding
Leaching
Heating, Thickening& Filtering
Copper sulfideproduct
Nickel matte
Ammonia (NH3) Ammonia (NH3)
Metals, PM10
PM10, CuSFlocculants
FeSO4, H2
H2, Ni, (NH4)2SO4
H2SH2S, SO2, PM10,
mercaptans
PM10
PM10, metals, products ofcombustion
Power/Fuel
Power/Fuel
PM10, H2S, metals,products of combustion
Nickel Concentrating, Smelting & Refining 10
Various processes exist to convert the nickel matte into marketable products. Essentially,residual iron sulfides are removed by leaching with ammonia, then valuable componentsare progressively removed by differential precipitation.
Leaching: Finely ground nickel matte is mixed with process liquor (recycled from the finalleaching tank) and pumped into autoclaves for reaction with air and ammonia at highpressure. Leaching dissolves the valuable metals - nickel, copper and cobalt - but leavesiron as an insoluble residue.
Reduction: The process liquor undergoes a 5 day reduction cycle to precipitate nickelpowder. The cycle commences with nucleation - the generation of fine seed particles - andends with total discharge of the vessel. Nickel in solution is reduced to nickel metal andferrous sulfate is oxidised to ferrous hydroxide. The nickel and liquor are separated bysettlement.
Liquor Stripping: Reaction with hydrogen sulfide gas in a recirculating pipe reactorsystem precipitates a mixed sulfur product. This product typically contains 25% nickel,25% cobalt and 30% sulfur.
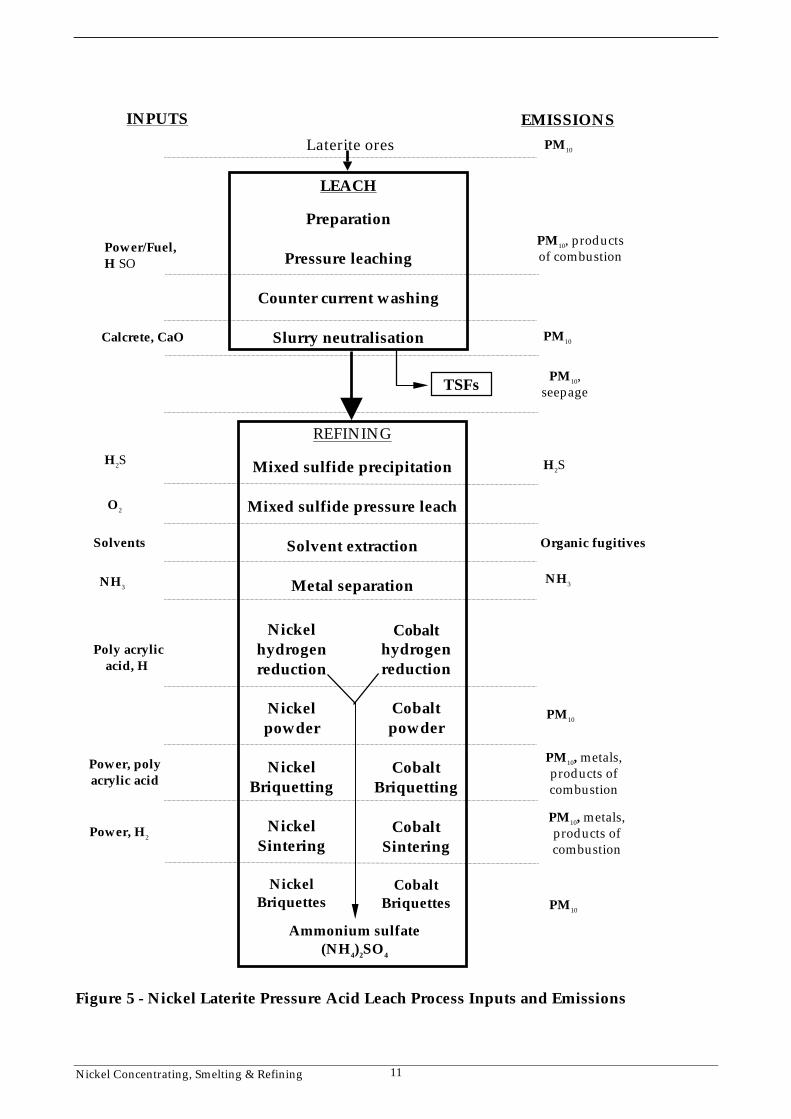
2.3 Nickel Laterite Pressure Acid Leach Process
The process flow diagram for the nickel laterite pressure acid leach process is presented inFigure 5.
Pressure Leaching: Slurry is fed into autoclaves at high pressure following heating. Theslurry reacts with sulfuric acid at high pressure and temperature. Leaching dissolves thevaluable metals - nickel and cobalt - but leaves iron as an insoluble residue.
Sulfide Precipitation: Sulfide precipitation yields a ‘cake’ product following heating andinjection with hydrogen sulfide to precipitate the nickel and cobalt.
Solvent Extraction: This process utilises an organic solvent to extract nickel from theproduct liquor, leaving cobalt. Nickel is subsequently stripped from the loaded solventusing a concentrated ammonia (NH3) solution or sulfuric acid (H2SO4).
Nickel Concentrating, Smelting & Refining 11
Figure 5 - Nickel Laterite Pressure Acid Leach Process Inputs and Emissions
INPUTS EMISSIONS
TSFs
LEACH
Preparation
Pressure leaching
Counter current washing
Slurry neutralisation
REFINING
Mixed sulfide precipitation
Mixed sulfide pressure leach
Solvent extraction
Metal separation
Nickelhydrogenreduction
Nickelpowder
NickelBriquetting
NickelSintering
NickelBriquettes
Cobalthydrogenreduction
Cobaltpowder
CobaltBriquetting
CobaltSintering
CobaltBriquettes
Ammonium sulfate(NH4)2SO4
Laterite ores PM10
PM10, productsof combustion
Power/Fuel,H SO
Calcrete, CaO PM10
PM10,seepage
H2S H2S
O2
Solvents Organic fugitives
NH3NH3
Poly acrylicacid, H
PM10
Power, polyacrylic acid
PM10, metals,products ofcombustion
Power, H2
PM10, metals,products ofcombustion
PM10
Nickel Concentrating, Smelting & Refining 12
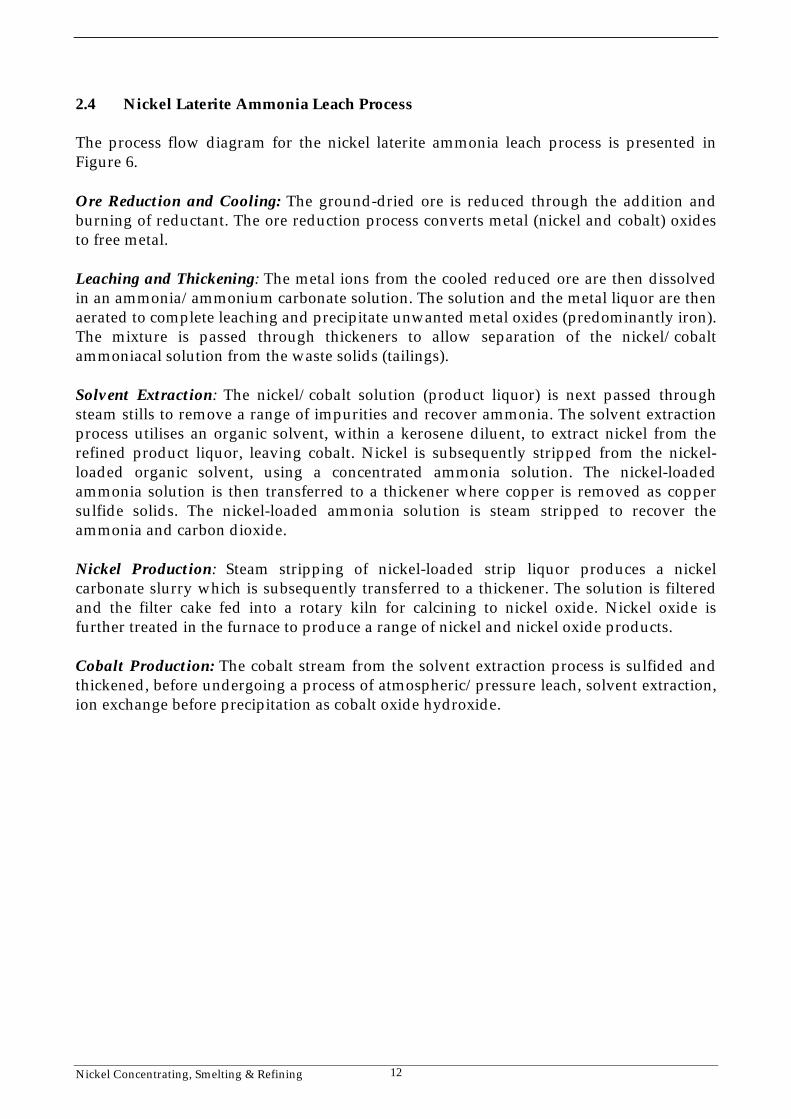
2.4 Nickel Laterite Ammonia Leach Process
The process flow diagram for the nickel laterite ammonia leach process is presented inFigure 6.
Ore Reduction and Cooling: The ground-dried ore is reduced through the addition andburning of reductant. The ore reduction process converts metal (nickel and cobalt) oxidesto free metal.
Leaching and Thickening: The metal ions from the cooled reduced ore are then dissolvedin an ammonia/ammonium carbonate solution. The solution and the metal liquor are thenaerated to complete leaching and precipitate unwanted metal oxides (predominantly iron).The mixture is passed through thickeners to allow separation of the nickel/cobaltammoniacal solution from the waste solids (tailings).
Solvent Extraction: The nickel/cobalt solution (product liquor) is next passed throughsteam stills to remove a range of impurities and recover ammonia. The solvent extractionprocess utilises an organic solvent, within a kerosene diluent, to extract nickel from therefined product liquor, leaving cobalt. Nickel is subsequently stripped from the nickel-loaded organic solvent, using a concentrated ammonia solution. The nickel-loadedammonia solution is then transferred to a thickener where copper is removed as coppersulfide solids. The nickel-loaded ammonia solution is steam stripped to recover theammonia and carbon dioxide.
Nickel Production: Steam stripping of nickel-loaded strip liquor produces a nickelcarbonate slurry which is subsequently transferred to a thickener. The solution is filteredand the filter cake fed into a rotary kiln for calcining to nickel oxide. Nickel oxide isfurther treated in the furnace to produce a range of nickel and nickel oxide products.
Cobalt Production: The cobalt stream from the solvent extraction process is sulfided andthickened, before undergoing a process of atmospheric/pressure leach, solvent extraction,ion exchange before precipitation as cobalt oxide hydroxide.
Nickel Concentrating, Smelting & Refining 13
Figure 6 - Nickel Laterite Ammonia Leach Process Inputs and Emissions
Fuel PM10, SO2, NOx
Fuel, Reductant PM10, CO, SO2, NOx
Ammonia
Ammonia
Ammonia
Solvent, Ammonia Ammonia
H2S
H2S
Power/Fuel PM10, CO, SO2, NOx
Solvent, Ammonia Ammonia
Power/Fuel, PM10, CO, SO2, NOx
N2,H2
Steam Stripping
Leaching andThickening
Solvent Extraction
Leaching
Sulfiding
Calciner
ReductionPrecipitation
Solvent Extraction
Gas Recovery
Tailings Disposal
Ni Product(+ 99.5%)
Co Product(+ 65%)
Laterite Ore
Roasting
Drying andGrinding
Nickel Stream Cobalt Stream
Nickel Concentrating, Smelting & Refining 14
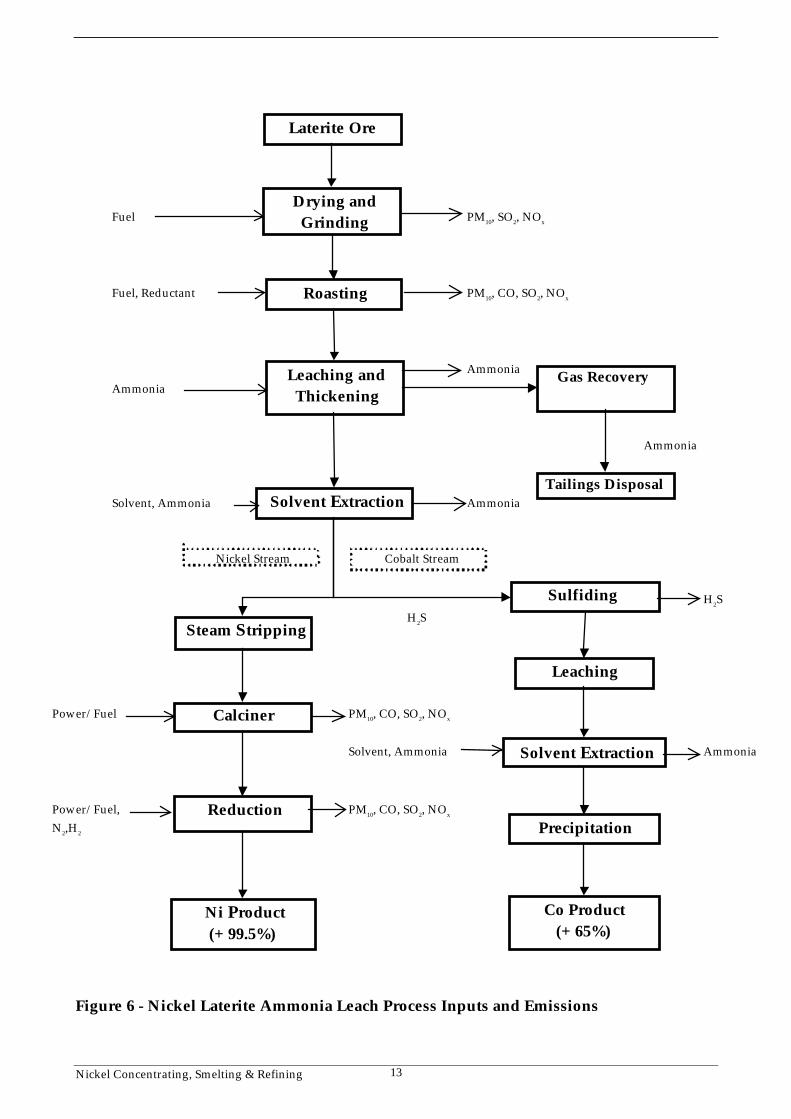
3.0 Likely Emissions
Estimates of emissions of listed substances to air, water and land shall be reported for eachsubstance that exceeds a defined threshold value of ’usage’ or emission. The reporting listand detailed information on thresholds are contained in The NPI Guide.
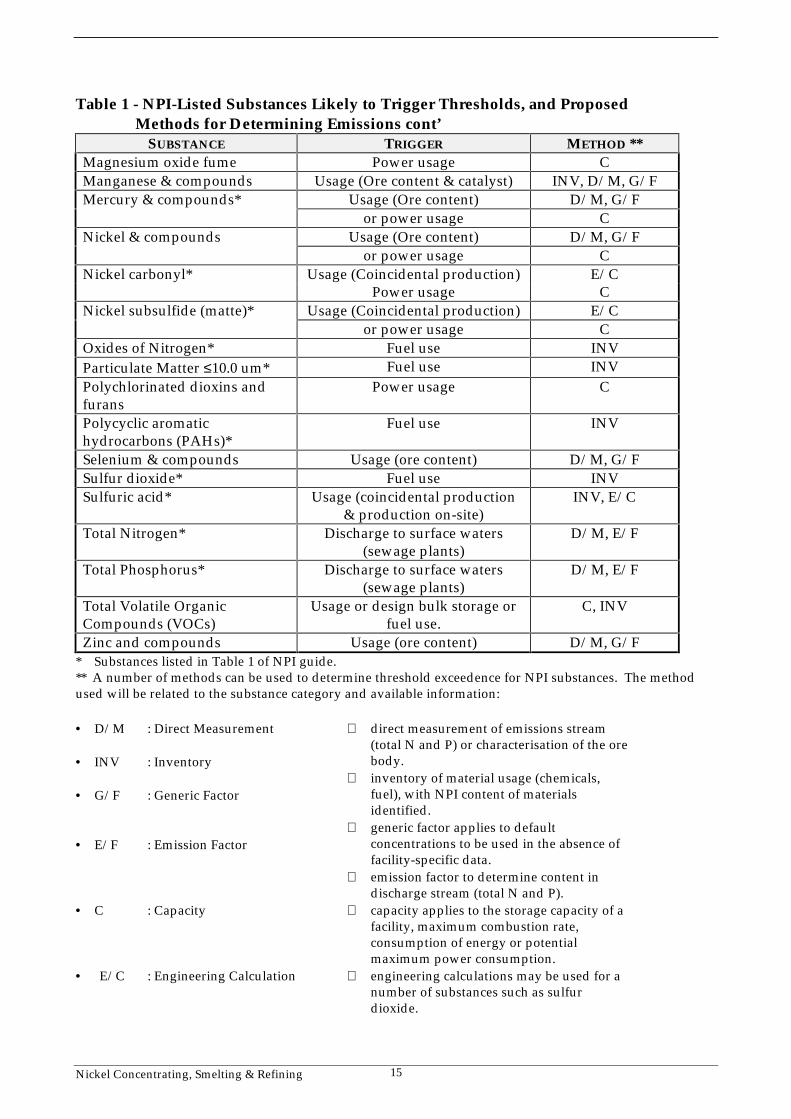
It is the responsibility of nickel concentrating, smelting and refining facilities to determinewhich NPI-listed substances are triggered for reporting. Table 1 indicates those NPI-listedsubstances likely to be of relevance where the threshold may be triggered by the nickelconcentrating, smelting and refining industry and the most appropriate method ofdetermining whether the threshold is triggered. This table is intended as a guide tosubstances that may need to be reported for Nickel concentrating, smelting and refiningfacilities.
Table 1 - NPI-Listed Substances Likely to Trigger Thresholds, and Proposed Methods for Determining Emissions
SUBSTANCE TRIGGER METHOD **Acrylic acid Usage INVAmmonia (total) Usage INVAntimony & compounds Usage (Ore content) D/M, G/FArsenic & compounds* Usage (Ore content) D/M, G/F
or power usage CBeryllium & compounds Usage (Ore content) D/M, G/F
or power usage CBoron & compounds Usage (Ore content) D/M, G/FCadmium & compounds* Usage (Ore content) D/M, G/F
or power usage CCarbon disulfide Usage (Coincidental production) E/CCarbon monoxide* Fuel use INVChromium (III) compounds Usage (Ore content) D/M, G/F
or power usage CChromium (VI) compounds* Usage (Ore content) D/M, G/F
or power usage CCobalt & compounds* Usage (ore content) D/M, G/FCopper & compounds Usage (Ore content) D/M, G/F
or power usage CCyanide (inorganic)compounds*
Usage INV
Fluoride compounds* Usage (Ore content) D/M, G/For fuel use. INV
Hydrochloric acid Usage (Usage & coincidentalproduction)
INV, E/C
or fuel use. INVHydrogen sulfide Usage
(Production on site)INV
Lead & compounds* Usage (Ore content & anodes) INV, D/M, G/For power usage C
Nickel Concentrating, Smelting & Refining 15
Table 1 - NPI-Listed Substances Likely to Trigger Thresholds, and Proposed Methods for Determining Emissions cont’
SUBSTANCE TRIGGER METHOD **Magnesium oxide fume Power usage CManganese & compounds Usage (Ore content & catalyst) INV, D/M, G/FMercury & compounds* Usage (Ore content) D/M, G/F
or power usage CNickel & compounds Usage (Ore content) D/M, G/F
or power usage CNickel carbonyl* Usage (Coincidental production) E/C
Power usage CNickel subsulfide (matte)* Usage (Coincidental production) E/C
or power usage COxides of Nitrogen* Fuel use INVParticulate Matter ≤10.0 um* Fuel use INVPolychlorinated dioxins andfurans
Power usage C
Polycyclic aromatichydrocarbons (PAHs)*
Fuel use INV
Selenium & compounds Usage (ore content) D/M, G/FSulfur dioxide* Fuel use INVSulfuric acid* Usage (coincidental production
& production on-site)INV, E/C
Total Nitrogen* Discharge to surface waters(sewage plants)
D/M, E/F
Total Phosphorus* Discharge to surface waters(sewage plants)
D/M, E/F
Total Volatile OrganicCompounds (VOCs)
Usage or design bulk storage orfuel use.
C, INV
Zinc and compounds Usage (ore content) D/M, G/F* Substances listed in Table 1 of NPI guide.** A number of methods can be used to determine threshold exceedence for NPI substances. The methodused will be related to the substance category and available information:
• D/M : Direct Measurement • INV : Inventory • G/F : Generic Factor • E/F : Emission Factor
⇒ direct measurement of emissions stream(total N and P) or characterisation of the orebody.
⇒ inventory of material usage (chemicals,fuel), with NPI content of materialsidentified.
⇒ generic factor applies to defaultconcentrations to be used in the absence offacility-specific data.
⇒ emission factor to determine content indischarge stream (total N and P).
• C : Capacity • E/C : Engineering Calculation
⇒ capacity applies to the storage capacity of afacility, maximum combustion rate,consumption of energy or potentialmaximum power consumption.
⇒ engineering calculations may be used for anumber of substances such as sulfurdioxide.
Nickel Concentrating, Smelting & Refining 16
The NPI Guide, along with Worksheets 1 and 2 (at the front of this Handbook), areavailable to assist facilities in determining substances that exceed reporting triggers.
You should note that while the reporting threshold for a substance may not be triggeredduring one reporting period, it may be triggered in another reporting period. As such, itis important to review NPI reporting requirements each reporting period.
3.1 Reporting Thresholds
Thresholds have been set for five categories, although a substance may exceed thresholdsin more than one category (for example, copper may trigger reporting through its useand/or the facility’s fuel usage). These are detailed below in simple terms. The NPIreporting list and detailed information on thresholds are contained in The NPI Guide.
3.1.1 Category 1
Category 1 substances trigger reporting through the ‘use’ of 10 tonnes or more per year ofthat substance.
‘Use’ has a very broad definition within the NPI and includes coincidental production andhandling. Within the nickel industry, trace metals within ore may trigger reportingthresholds, as may the coincidental production of carbon disulfide from the breakdown ofxanthates and the NPI substance content of process chemicals used at facilities.
Ore handled at nickel concentrating, smelting and refining facilities may contain asufficient concentration of NPI metals & compounds to trigger the Category 1 reportingthreshold of 10 tonnes per annum.
Ore will need to be characterised for all NPI metals & compounds to determine thecontribution of ore metal ‘use’ to the total facility ‘use’ of metals and compounds.
Direct measurement by representative sampling is the most accurate means ofcharacterising ore and hence determining ‘usage’ of trace metals as the metals content ofore will vary between and within facilities. In the absence of facility-specific assays,generic ore assays may be used as the basis for reporting of metals ‘usage’. These genericassays are presented in Appendix A.
Where substances are ’used’ as a result of coincidental production, such as carbondisulfide from the decay of xanthates, engineering calculations may be appropriate todetermine the amount that is 'used' based on the chemical reaction rates.
Reference to facility inventories will facilitate the calculation of the mass of NPI substances‘used’ through their presence in process chemicals. This approach will require recordingof the volumes of process chemicals used in a reporting period and determination of theconcentration of NPI substances in those chemicals. This data may be available frommaterial safety data sheets (MSDS) or directly from suppliers.
Nickel Concentrating, Smelting & Refining 17
3.1.2 Category 1a
This category considers total volatile organic compounds (VOC) only and the threshold istriggered through either the mass of VOCs used annually or the total VOC storagecapacity of the facility.
The reporting threshold for a category 1a substance is exceeded in a reporting period if theactivities involve the use of 25 tonnes or more of the substance in that period. Thereporting threshold for a category 1a substance is only exceeded for bulk storage facilitiesif their design capacity also exceeds 25 kilotonnes.
VOC emission estimation from tanks is addressed by the EET Manual for Fuel and OrganicLiquid Storage.
3.1.3 Category 2a
Category 2a encompasses products of combustion.
Reporting thresholds are triggered if a facility:• burns 400 tonnes or more of fuel or waste in a year; or• burns 1 tonne or more of fuel or waste in an hour at any time during the reporting year.
Exceedence of threshold triggers may be determined through reference to masses of fuelused from facility inventories, or maximum fuel combustion rates.
3.1.4 Category 2b
Category 2b encompasses products of combustion.
Reporting thresholds are triggered where a facility:• burns 2,000 tonnes or more of fuel or waste in a year;• consumes 60,000 megawatt hours or more of energy in a year; or• the maximum potential power consumption of the facility at any time in the year is
rated at 20 megawatts or more.
3.1.5 Category 3
Category 3 substances are nitrogen and phosphorus. These are reportable if emissions towater (excluding groundwater) exceed the following scheduled amounts:• 15 tonnes per year of total nitrogen; and• 3 tonnes per year of total phosphorus.
Direct measurement (through representative sampling) of the total nitrogen andphosphorus content of surface water discharges is likely to be the most appropriate meansof determining whether reporting thresholds are triggered.
Nickel Concentrating, Smelting & Refining 18
4.0 Emission Estimation
Estimates of emissions of listed substances to air, water and land should be reported foreach substance that triggers a threshold. The reporting list and detailed information onthresholds are contained in The NPI Guide at the front of this Handbook.
In general, there are four types of emission estimation techniques (EETs) that may be usedto estimate emissions from your facility.
The four types described in The NPI Guide are:
• sampling or direct measurement;• mass balance;• fuel analysis or other engineering calculations; and• emission factors.
Select the EET, (or mix of EETs), that is most appropriate for your purposes. For example,you might choose to use a mass balance to best estimate fugitive losses from pumps andvents, direct measurement for stack and pipe emissions, and emission factors whenestimating losses from storage tanks and stockpiles.
If you estimate your emission by using any of these EETs, your data will be displayed onthe NPI database as being of ‘acceptable reliability’. Similarly, if your relevantenvironmental authority has approved the use of EETs that are not outlined in thishandbook, your data will also be displayed as being of ‘acceptable reliability’.
This Manual seeks to provide the most effective emission estimation techniques for theNPI substances relevant to this industry. However, the absence of an EET for a substancein this handbook does not necessarily imply that an emission should not be reported to theNPI. The obligation to report on all relevant emissions remains if reporting thresholdshave been exceeded.
You are able to use emission estimation techniques that are not outlined in thisdocument. You must, however, seek the consent of your relevant environmentalauthority. For example, if your company has developed site-specific emission factors,you may use these if approved by your relevant environmental authority.
You should note that the EETs presented in this manual relate principally to averageprocess emissions. Emissions resulting from non-routine events are rarely discussed in theliterature, and there is a general lack of EETs for such events. However, it is important torecognise that emissions resulting from significant operating excursions and/or accidentalsituations (eg. spills) will also need to be estimated. Emissions to land, air and water fromspills must be estimated and added to process emissions when calculating total emissionsfor reporting purposes. The emission resulting from a spill is the net emission, ie., thequantity of the NPI reportable substance spilled, less the quantity recovered or consumedduring clean up operations.
Nickel Concentrating, Smelting & Refining 19
Those techniques available for estimating emissions of NPI substances from nickelconcentrating, smelting and refining activities are detailed in Table 2.
The estimation techniques detailed provide a range of options for facilities. These EETsmay be supplemented by other techniques to develop facility-specific EETs or to confirmthe accuracy of alternate EETs.
While particular estimation methods are generally more suited to some applications, theestimation method selected will be dependent upon a number of factors, such as:
• cost of estimation techniques;• ease of measurement or monitoring;• availability of suitable emission factors;• level of accuracy desired;• nature of the substance; and• existing monitoring and data availability.
It should be appreciated that while the NPI requires reporting of metals and compounds,such as lead and compounds, emissions relate only to the amount of metal emitted.
For example if CuSO4 were emitted to the environment, only the Cu component would bereportable. While CuSO4 has a molecular weight of 159 the Cu component has a molecularweight of only 63. Reporting of the total CuSO4 emissions would therefore lead to anemissions estimate of two-and-a-half times greater than that required.
When estimating emissions it may be simpler to determine the percentage content of NPIsubstances within distinct emission streams and report that percentage of the totalemission.
Wherever practicable, facilities should ensure that only the reportable component of anemission is reported. In some circumstances this may be very difficult to achieve and inthese cases a liberal estimate should be made.
For example, the NPI requires that inorganic cyanide compounds only are reported. Theform in which cyanide is emitted should be factored into emissions estimation wherepracticable, although this may be very difficult to achieve where extensive cyanidecomplexes are emitted. Where this is the case total cyanide emissions should be reported.
The NPI addresses the total loading, of those forms of a substance required by the NPI, tothe environment and does not distinguish between bioavailable and non-bioavailableforms of a substance (except for total nitrogen and phosphorus emissions).
For example, for metals such as cadmium and compounds, the total loading of cadmiumto the environment must be reported not just the available forms of cadmium.
Nickel Concentrating, Smelting & Refining 20
In reporting emissions it is important to note that while the reporting threshold for asubstance may be triggered this does not mean that the emissions will be significant. Forexample most trace metals in the processed ore are likely to be disposed of to the TSFs.However only emissions from TSFs must be reported within the NPI process.
The NPI has a commitment of not requiring any additional monitoring by facilities inorder to estimate their emissions. While monitoring is an EET available to facilities, arange of EETs that do not require direct monitoring is available. However, in the absenceof monitoring data, a lower level of accuracy can be expected.
Appendix B details sources of data that may already be available to facilities. This datamay be used to assist in NPI reporting requirements.
A combination of these methods may be employed to estimate emissions to theenvironment from particular process areas, such as emissions from TSFs.
The nickel concentrating, smelting and refining industry also requires a range of rawmaterial inputs, which at some facilities are produced on site. Likewise some facilitiesmay produce additional products through their emissions treatment processes. These arereferred to in this Manual as ‘Ancillary Activities’ and may include:
• hydrogen production;• sulfuric acid production;• ammonium sulfate production; and• hydrogen sulfide production.
Where EET Manuals have been produced to assist in NPI reporting of these ‘AncillaryActivities’, they should be referred to in order to ensure that all substance usage andemissions are fully accounted for. EET Manuals include Ammonium Sulfate and InorganicChemicals Manufacture. Where manuals are not available, the use and emission ofsubstances should be accounted for as part of the facilities estimation methods detailed inthis handbook.
In all cases, when estimating emissions a facility should ensure that emissions are not‘double accounted’ between different processes.
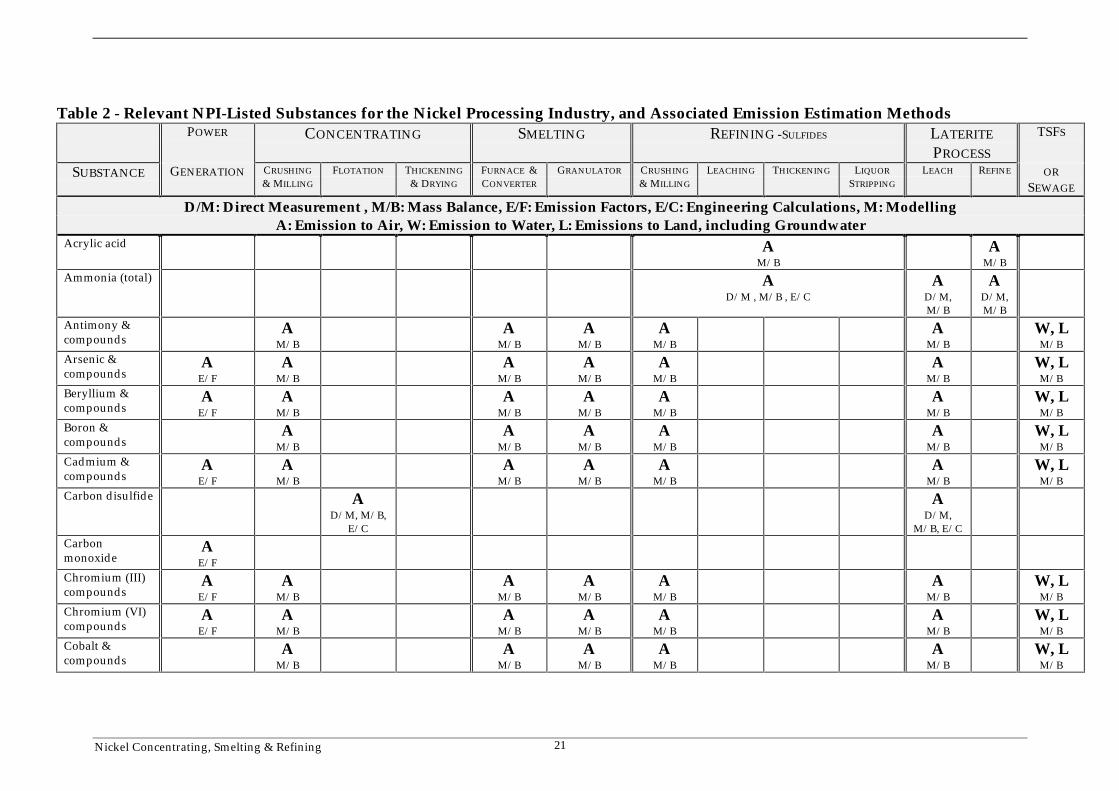
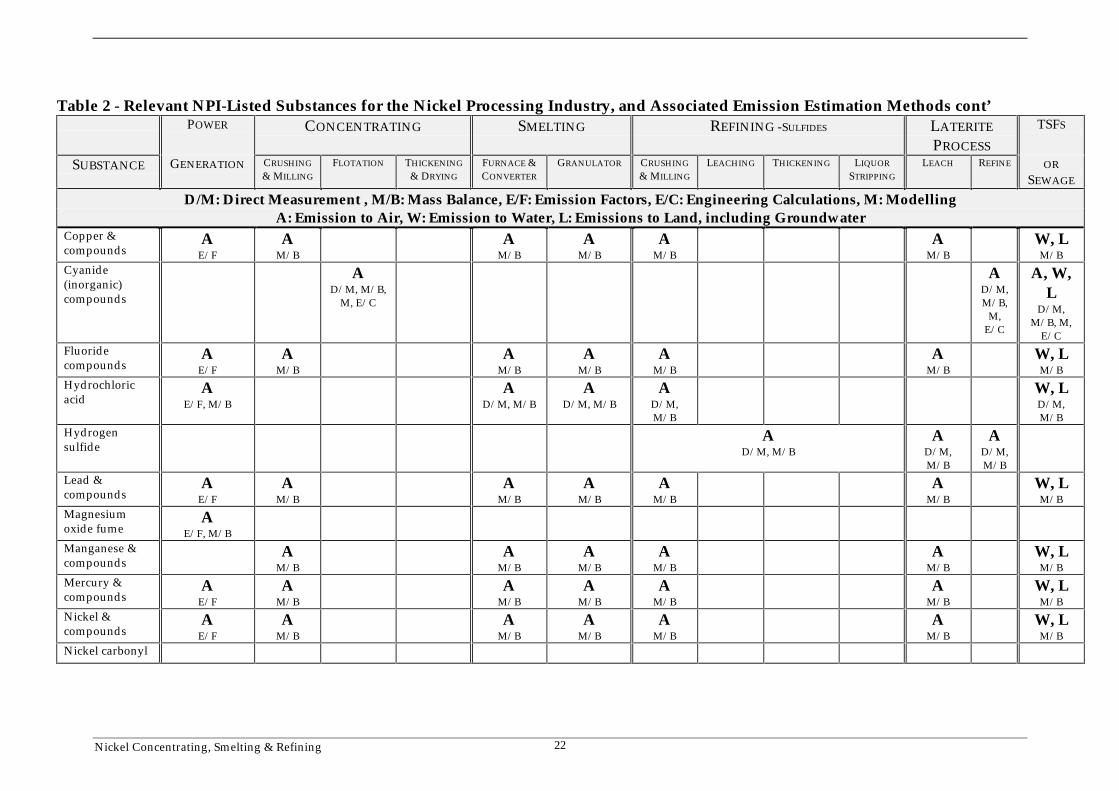
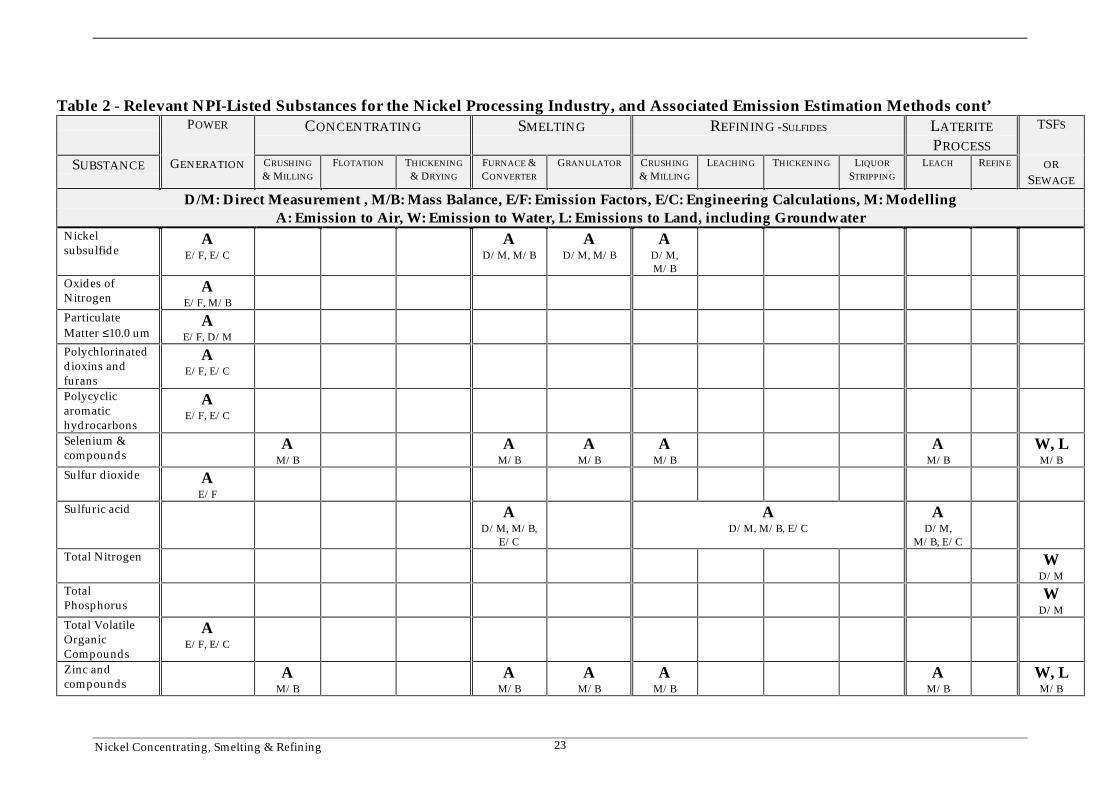
Table 2 details the NPI substance, the stage in the process where it is used and emitted,and indicates appropriate emission estimation techniques. While emission factors (E/F)are identified as potential EETs for substances, emission factors may not currently beavailable for all substances. It is anticipated that emission factors will be developed forthese substances in the future.
The NPI Guide provides guidance on the most appropriate approach to the estimation ofemissions for particular categories of substances.
Nickel Concentrating, Smelting & Refining 21
Table 2 - Relevant NPI-Listed Substances for the Nickel Processing Industry, and Associated Emission Estimation MethodsPOWER CONCENTRATING SMELTING REFINING -SULFIDES LATERITE
PROCESS
TSFS
SUBSTANCE GENERATION CRUSHING
& MILLING
FLOTATION THICKENING
& DRYING
FURNACE &CONVERTER
GRANULATOR CRUSHING
& MILLING
LEACHING THICKENING LIQUOR
STRIPPING
LEACH REFINE ORSEWAGE
D/M: Direct Measurement , M/B: Mass Balance, E/F: Emission Factors, E/C: Engineering Calculations, M: ModellingA: Emission to Air, W: Emission to Water, L: Emissions to Land, including Groundwater
Acrylic acid AM/B
AM/B
Ammonia (total) AD/M , M/B , E/C
AD/M,M/B
AD/M,M/B
Antimony &compounds
AM/B
AM/B
AM/B
AM/B
AM/B
W, LM/B
Arsenic &compounds
AE/F
AM/B
AM/B
AM/B
AM/B
AM/B
W, LM/B
Beryllium &compounds
AE/F
AM/B
AM/B
AM/B
AM/B
AM/B
W, LM/B
Boron &compounds
AM/B
AM/B
AM/B
AM/B
AM/B
W, LM/B
Cadmium &compounds
AE/F
AM/B
AM/B
AM/B
AM/B
AM/B
W, LM/B
Carbon disulfide AD/M, M/B,
E/C
AD/M,
M/B, E/CCarbonmonoxide
AE/F
Chromium (III)compounds
AE/F
AM/B
AM/B
AM/B
AM/B
AM/B
W, LM/B
Chromium (VI)compounds
AE/F
AM/B
AM/B
AM/B
AM/B
AM/B
W, LM/B
Cobalt &compounds
AM/B
AM/B
AM/B
AM/B
AM/B
W, LM/B
Nickel Concentrating, Smelting & Refining 22
Table 2 - Relevant NPI-Listed Substances for the Nickel Processing Industry, and Associated Emission Estimation Methods cont’POWER CONCENTRATING SMELTING REFINING -SULFIDES LATERITE
PROCESS
TSFS
SUBSTANCE GENERATION CRUSHING
& MILLING
FLOTATION THICKENING
& DRYING
FURNACE &CONVERTER
GRANULATOR CRUSHING
& MILLING
LEACHING THICKENING LIQUOR
STRIPPING
LEACH REFINE ORSEWAGE
D/M: Direct Measurement , M/B: Mass Balance, E/F: Emission Factors, E/C: Engineering Calculations, M: ModellingA: Emission to Air, W: Emission to Water, L: Emissions to Land, including Groundwater
Copper &compounds
AE/F
AM/B
AM/B
AM/B
AM/B
AM/B
W, LM/B
Cyanide(inorganic)compounds
AD/M, M/B,
M, E/C
AD/M,M/B,
M,E/C
A, W,L
D/M,M/B, M,
E/CFluoridecompounds
AE/F
AM/B
AM/B
AM/B
AM/B
AM/B
W, LM/B
Hydrochloricacid
AE/F, M/B
AD/M, M/B
AD/M, M/B
AD/M,M/B
W, LD/M,M/B
Hydrogensulfide
AD/M, M/B
AD/M,M/B
AD/M,M/B
Lead &compounds
AE/F
AM/B
AM/B
AM/B
AM/B
AM/B
W, LM/B
Magnesiumoxide fume
AE/F, M/B
Manganese &compounds
AM/B
AM/B
AM/B
AM/B
AM/B
W, LM/B
Mercury &compounds
AE/F
AM/B
AM/B
AM/B
AM/B
AM/B
W, LM/B
Nickel &compounds
AE/F
AM/B
AM/B
AM/B
AM/B
AM/B
W, LM/B
Nickel carbonyl
Nickel Concentrating, Smelting & Refining 23
Table 2 - Relevant NPI-Listed Substances for the Nickel Processing Industry, and Associated Emission Estimation Methods cont’POWER CONCENTRATING SMELTING REFINING -SULFIDES LATERITE
PROCESS
TSFS
SUBSTANCE GENERATION CRUSHING
& MILLING
FLOTATION THICKENING
& DRYING
FURNACE &CONVERTER
GRANULATOR CRUSHING
& MILLING
LEACHING THICKENING LIQUOR
STRIPPING
LEACH REFINE ORSEWAGE
D/M: Direct Measurement , M/B: Mass Balance, E/F: Emission Factors, E/C: Engineering Calculations, M: ModellingA: Emission to Air, W: Emission to Water, L: Emissions to Land, including Groundwater
Nickelsubsulfide
AE/F, E/C
AD/M, M/B
AD/M, M/B
AD/M,M/B
Oxides ofNitrogen
AE/F, M/B
ParticulateMatter ≤10.0 um
AE/F, D/M
Polychlorinateddioxins andfurans
AE/F, E/C
Polycyclicaromatichydrocarbons
AE/F, E/C
Selenium &compounds
AM/B
AM/B
AM/B
AM/B
AM/B
W, LM/B
Sulfur dioxide AE/F
Sulfuric acid AD/M, M/B,
E/C
AD/M, M/B, E/C
AD/M,
M/B, E/CTotal Nitrogen W
D/MTotalPhosphorus
WD/M
Total VolatileOrganicCompounds
AE/F, E/C
Zinc andcompounds
AM/B
AM/B
AM/B
AM/B
AM/B
W, LM/B
Nickel Concentrating, Smelting & Refining 24
4.1 Elements of the Environment
4.1.1 Emissions to Air
Significant emissions to air within the nickel concentrating, smelting and refining industrywill be related to:
• stack emissions from smelters;• the stockpiling, movement and comminution of ore;• the operation of process plants including solvent extraction heap leaches; and• the operation of tailing storage facilities (TSFs).
Emissions to air are estimated from their point of creation rather than at the facilityboundary. Emissions estimation takes no account of the fate of emitted substances, suchas the speed of their subsequent decay within the atmosphere.
Air emissions may be categorised as:
Fugitive emissionsThese are emissions that are not released through a vent or stack. Examples of fugitiveemissions include dust from stockpiles, volatilisation of vapour from vats or open vessels,and material handling. Emissions emanating from ridgeline roof-vents, louvres, and opendoors of a building as well as equipment leaks, and leaks from valves and flanges are alsoexamples of fugitive emissions.
Emission factor EETs are the usual method for determining losses through fugitiveemissions.
Point source emissionsThese emissions are exhausted into a vent or stack and emitted through a single pointsource into the atmosphere. An air emissions control device such as a carbon adsorptionunit, scrubber, baghouse, or afterburner may ’treat’ stack emissions prior to their release,reducing their total loading to the atmosphere.
4.1.2 Emissions to Water
Emissions of substances to water can be categorised as discharges to:
• Surface waters (eg. lakes, rivers, dams, and estuaries);• Coastal or marine waters; and• Stormwater.
Groundwater is not considered as a ‘water body’ within the context of NPI reporting.Groundwater is included within emissions to land.
Significant emissions to water within the nickel concentrating, smelting and refiningindustry will be related to:
• runoff and erosion from the facility area (refer to the EET Manual for Mining);• the discharge of treated process waters (eg. treated TSF decant water);• the discharge of sewage and domestic wastewaters; and• spills to surface waters.
Nickel Concentrating, Smelting & Refining 25
The most accurate technique for estimating emissions to the environment via wastewateris likely to be direct measurement. However, facilities may use other EETs for thepurposes of reporting within the NPI.
4.1.3 Emissions to Land
Emissions of substances to land on-site may include solid wastes, slurries, sediments, spillsand leaks, storage and distribution of liquids, and the use of chemicals to control variouselements of the environment where these emissions contain listed substances. Theseemission sources can be broadly categorised as:
• surface impoundments of liquids and slurries, such as TSFs; and• unintentional leaks and spills.
In relation to the nickel concentrating, smelting and refining industry, discharges to landsuch as purpose built TSFs, solid waste dumps and waste rock dumps are classed astransfers. However, emissions from these facilities to the environment are included withinthe scope of the NPI and will generally be addressed as either emissions to groundwater(land) or to air.
Nickel Concentrating, Smelting & Refining 26
5.0 Mass BalanceMass balance provides an estimate of emissions where known quantities of substances aresupplied to a process, and the process fate of the substance is both known andquantifiable.
It is essential that the mass balance calculation addresses all losses and fates of a substanceand utilises the best available data.
As a result of inherent errors in the estimation of inputs to and losses from a facility orprocess, and the fates of those substances, the effectiveness of a mass balance approach inestimating minor emissions may be questionable and may contain broad error bands.
5.1 Water Balance
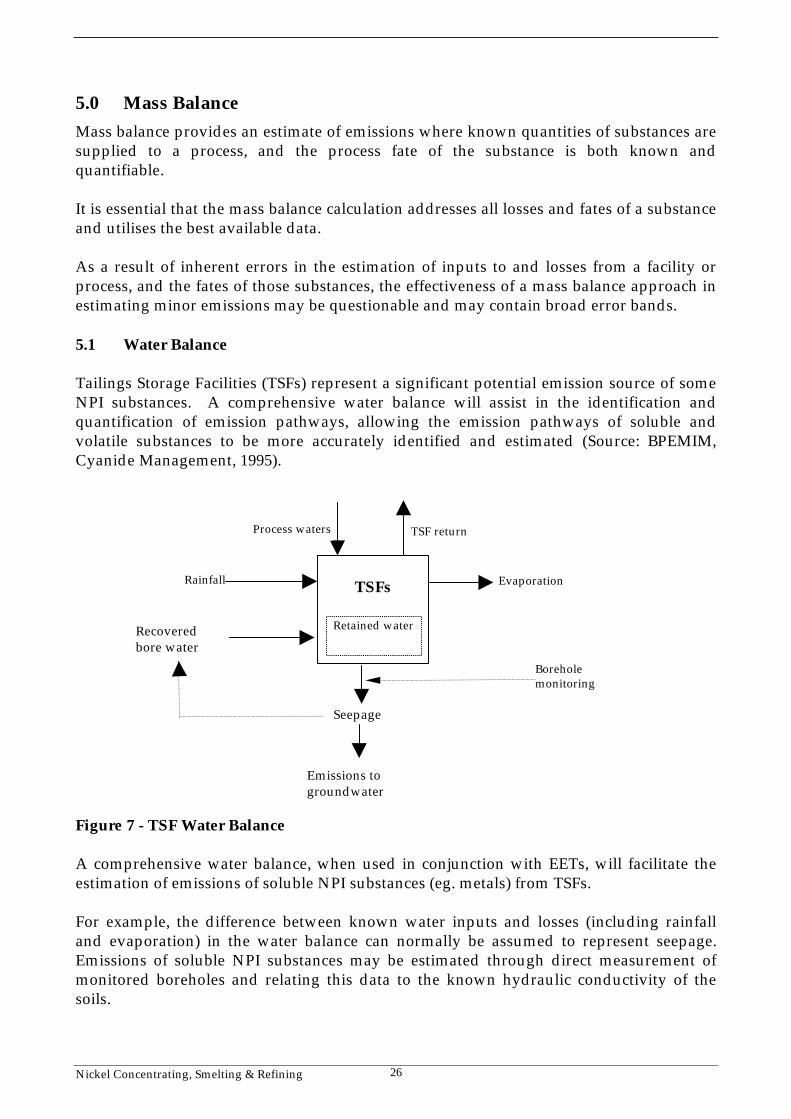
Tailings Storage Facilities (TSFs) represent a significant potential emission source of someNPI substances. A comprehensive water balance will assist in the identification andquantification of emission pathways, allowing the emission pathways of soluble andvolatile substances to be more accurately identified and estimated (Source: BPEMIM,Cyanide Management, 1995).
Figure 7 - TSF Water Balance
A comprehensive water balance, when used in conjunction with EETs, will facilitate theestimation of emissions of soluble NPI substances (eg. metals) from TSFs.
For example, the difference between known water inputs and losses (including rainfalland evaporation) in the water balance can normally be assumed to represent seepage.Emissions of soluble NPI substances may be estimated through direct measurement ofmonitored boreholes and relating this data to the known hydraulic conductivity of thesoils.
Boreholemonitoring
Rainfall EvaporationTSFs
TSF returnProcess waters
Retained water
Seepage
Recoveredbore water
Emissions togroundwater
Nickel Concentrating, Smelting & Refining 27
However, it is noted that estimates of the inputs/outputs of some water balances mayhave significant associated error bands. Work recently undertaken by MERIWAdemonstrates the errors that may be associated with the calculation of evaporative lossesfrom the surface of TSFs. This is well illustrated by the following example from MERIWAProject Report M241, 1998;
For a TSF of 100 ha, an evaporative loss of 100 mm is equivalent to a total volumeof 100,000m3.
Evaporative losses are influenced by a wide variety of factors. Increasingsalinity may reduce evaporation by as much as 60 - 95% of the potentialevaporative rate. As such estimating to an accuracy of 100 mm may requireextensive study and characterisation and any errors in calculating these lossesmay result in significant inaccuracies.
5.2 Metals
Metals may be emitted:
• through seepage from TSFs and heap/dump leach pads;• as dust; and• as a result of TSF overflow.
The mass balance approach may be utilised to estimate emissions of metals in a mannersimilar to that used to estimate the emission of cyanide through seepage (refer to Section5.5)
The mass of reportable NPI metals lost to the environment through seepage may beestimated using:
• estimates of seepage rate; and• the concentration of NPI metals in TSFs return water or dump / heap leach liquors
While these seepage rates will be facility-specific, generic seepage rates of between 0 - 10% has been quoted within the industry (Mt Keith Nickel 1996, ANCOLD, per. comms.).
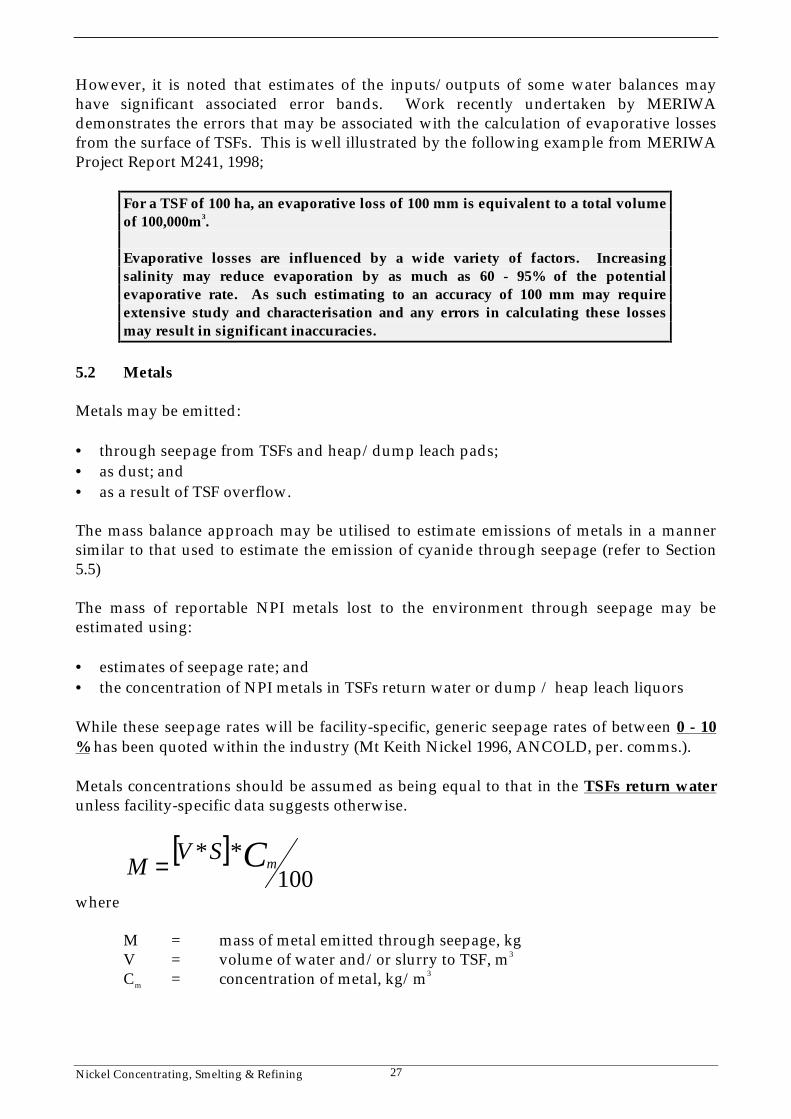
Metals concentrations should be assumed as being equal to that in the TSFs return waterunless facility-specific data suggests otherwise.
[ ]100
** CmSV
M = where M = mass of metal emitted through seepage, kg V = volume of water and/or slurry to TSF, m3
Cm = concentration of metal, kg/m3
Nickel Concentrating, Smelting & Refining 28
Where data on the permeability of TSF construction material is known Darcy’s Law maybe applied to calculate hydraulic loadings to the environment. Darcy’s Law is mostapplicable where an impermeable membrane has not been installed as part of the TSFdesign. Where an impermeable membrane has been installed but seepage is known to beoccurring, Darcy’s Law may be applied where facilities can estimate the surface area of theliner where its integrity has been compromised.
Seepage = [K * A * Sy * (dh/dl)] m3/d
Where: K = vertical permeability of TSF floor material, m/dayA = surface area of TSF cell floor, m2
Sy = specific yield of tailings material, %dh = thickness of tailings in the cell, mdl = hydraulic head above floor of the cell, m
Specific yield is the amount of water potentially released by the tailings material. Forexample where the saturated moisture content of the tailings is known to be 10% thespecific yield may be half of the saturated moisture content and would be expressed as 5%.
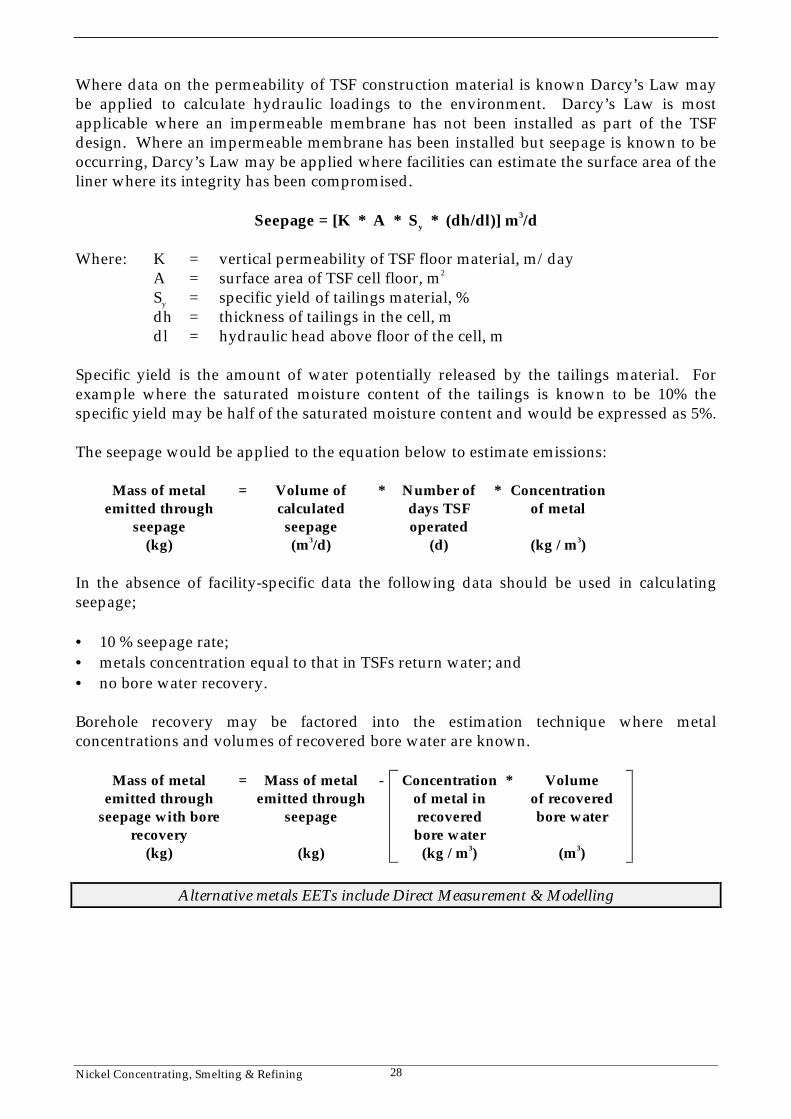
The seepage would be applied to the equation below to estimate emissions:
Mass of metalemitted through
seepage(kg)
= Volume ofcalculated
seepage(m3/d)
* Number ofdays TSFoperated
(d)
* Concentrationof metal
(kg / m3)
In the absence of facility-specific data the following data should be used in calculatingseepage;
• 10 % seepage rate;• metals concentration equal to that in TSFs return water; and• no bore water recovery.
Borehole recovery may be factored into the estimation technique where metalconcentrations and volumes of recovered bore water are known.
Mass of metalemitted through
seepage with borerecovery
(kg)
= Mass of metalemitted through
seepage
(kg)
- Concentrationof metal inrecoveredbore water
(kg / m3)
* Volumeof recoveredbore water
(m3)
Alternative metals EETs include Direct Measurement & Modelling
Nickel Concentrating, Smelting & Refining 29
5.3 Chemical Usage
The emission of chemicals from facilities from some sources (either as a result of normaloperations, spillages or incidents) may be estimated through mass balance.
Process and domestic chemicals used within the facility may be emitted to theenvironment. The full inventory of these chemicals used within a reporting period may beassumed either to be emitted to the environment, or to be transferred to an alternativedisposal, recycling or reuse facility.
In order to estimate the fate of chemicals, and their component NPI substances, thefollowing approach should be taken:
• Mass of NPI substances within chemicals determined (including coincidentalproduction);
• Inventory (or hazardous substances registers) of chemical usage maintained; and• Fate of chemical determined -
⇒ is chemical emitted to the environment or transferred?⇒ is chemical treated prior to emission from the facility?⇒ is chemical emitted to air, water or land?⇒ does chemical undergo partitioning into other forms?⇒ what are the fates of partitioned substances?
This approach may be applied to chemical usage in areas such as:
• chemical storage areas;• laboratories;• workshops;• kitchens;• domestic; and• washdown areas.
Alternative chemicals usage EETs include Direct Measurement
5.4 Converter and Smelter Emissions
Emissions (eg. sulfur dioxide and metals) from converter and smelter operations may beestimated through the use of mass balance. However, some direct sampling may bedesirable to improve components of the mass balance, eg. sulfur/metals content of processinputs and outputs.
It is important that the fates of component substances are considered within the massbalance and that all assumptions are stated. For example, it may be assumed that allsulfur is converted to sulfur dioxide during combustion, and ash content analyses maysuggest that a percentage of some metals are emitted.
The mass balance approach allows fugitive and other emissions to the environment to beestimated.
Nickel Concentrating, Smelting & Refining 30
5.4.1 Emissions Estimation for Converter and Smelter Operations
In a similar manner in which emissions from combustion are estimated, emissions fromconverter and smelter operations may be estimated using a mass balance.
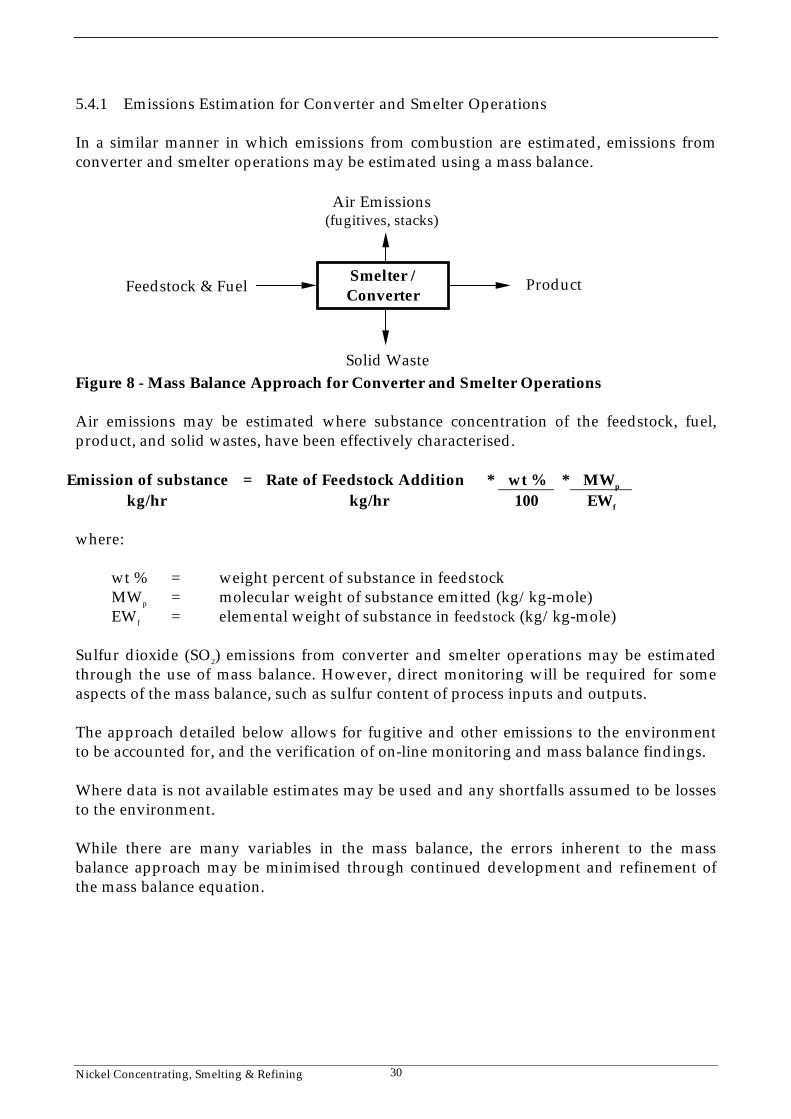
Figure 8 - Mass Balance Approach for Converter and Smelter Operations
Air emissions may be estimated where substance concentration of the feedstock, fuel,product, and solid wastes, have been effectively characterised.
Emission of substance = Rate of Feedstock Addition * wt % * MWp
kg/hr kg/hr 100 EWf
where:
wt % = weight percent of substance in feedstockMWp = molecular weight of substance emitted (kg/kg-mole)EWf = elemental weight of substance in feedstock (kg/kg-mole)
Sulfur dioxide (SO2) emissions from converter and smelter operations may be estimatedthrough the use of mass balance. However, direct monitoring will be required for someaspects of the mass balance, such as sulfur content of process inputs and outputs.
The approach detailed below allows for fugitive and other emissions to the environmentto be accounted for, and the verification of on-line monitoring and mass balance findings.
Where data is not available estimates may be used and any shortfalls assumed to be lossesto the environment.
While there are many variables in the mass balance, the errors inherent to the massbalance approach may be minimised through continued development and refinement ofthe mass balance equation.
Smelter /ConverterFeedstock & Fuel Product
Air Emissions(fugitives, stacks)
Solid Waste
Nickel Concentrating, Smelting & Refining 31
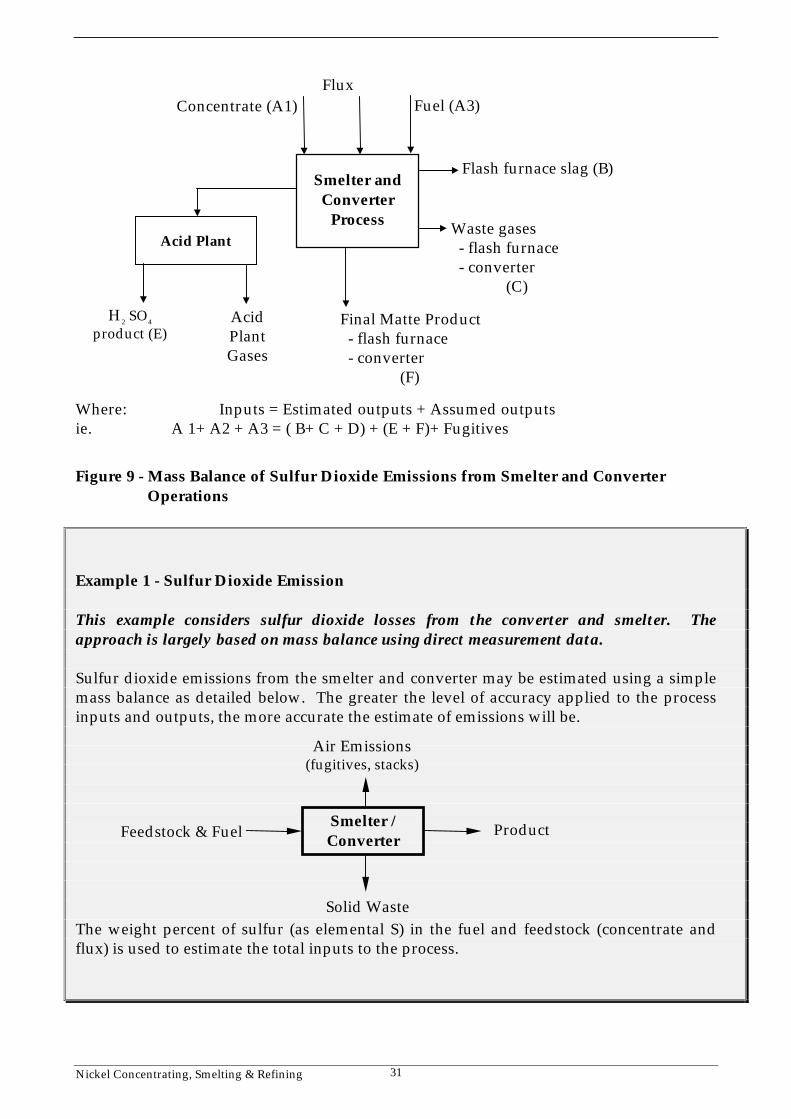
Where: Inputs = Estimated outputs + Assumed outputsie. A 1+ A2 + A3 = ( B+ C + D) + (E + F)+ Fugitives
Figure 9 - Mass Balance of Sulfur Dioxide Emissions from Smelter and Converter Operations
Example 1 - Sulfur Dioxide Emission
This example considers sulfur dioxide losses from the converter and smelter. Theapproach is largely based on mass balance using direct measurement data.
Sulfur dioxide emissions from the smelter and converter may be estimated using a simplemass balance as detailed below. The greater the level of accuracy applied to the processinputs and outputs, the more accurate the estimate of emissions will be.
The weight percent of sulfur (as elemental S) in the fuel and feedstock (concentrate andflux) is used to estimate the total inputs to the process.
Smelter andConverter
Process
Fuel (A3)Flux
Concentrate (A1)
Waste gases - flash furnace - converter
(C)
Flash furnace slag (B)
Final Matte Product - flash furnace - converter (F)
Acid Plant
H2 SO4
product (E)AcidPlantGases
Smelter /ConverterFeedstock & Fuel Product
Air Emissions(fugitives, stacks)
Solid Waste
Nickel Concentrating, Smelting & Refining 32
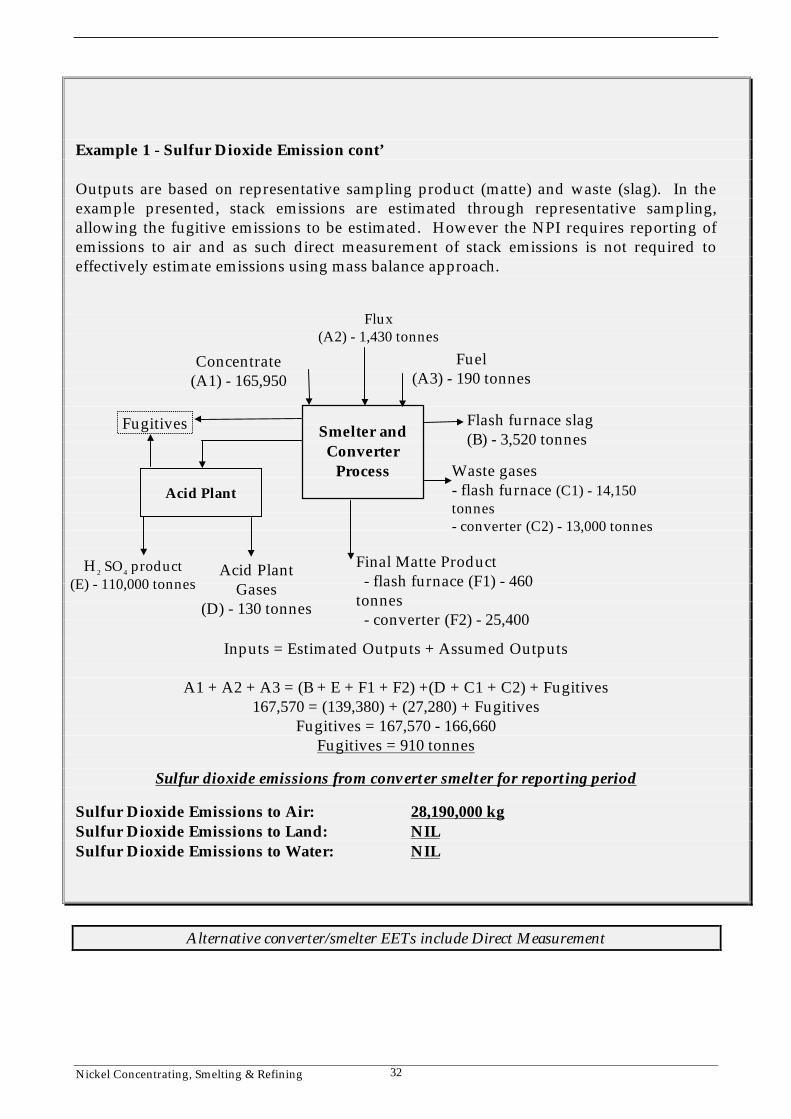
Example 1 - Sulfur Dioxide Emission cont’
Outputs are based on representative sampling product (matte) and waste (slag). In theexample presented, stack emissions are estimated through representative sampling,allowing the fugitive emissions to be estimated. However the NPI requires reporting ofemissions to air and as such direct measurement of stack emissions is not required toeffectively estimate emissions using mass balance approach.
Inputs = Estimated Outputs + Assumed Outputs
A1 + A2 + A3 = (B + E + F1 + F2) +(D + C1 + C2) + Fugitives167,570 = (139,380) + (27,280) + Fugitives
Fugitives = 167,570 - 166,660Fugitives = 910 tonnes
Sulfur dioxide emissions from converter smelter for reporting period
Sulfur Dioxide Emissions to Air: 28,190,000 kgSulfur Dioxide Emissions to Land: NILSulfur Dioxide Emissions to Water: NIL
Alternative converter/smelter EETs include Direct Measurement
Final Matte Product - flash furnace (F1) - 460tonnes - converter (F2) - 25,400
Smelter andConverter
Process
Fuel(A3) - 190 tonnes
Flux(A2) - 1,430 tonnes
Concentrate(A1) - 165,950
Waste gases- flash furnace (C1) - 14,150tonnes- converter (C2) - 13,000 tonnes
Flash furnace slag(B) - 3,520 tonnes
Acid Plant
H2 SO4 product(E) - 110,000 tonnes
Acid PlantGases
(D) - 130 tonnes
Fugitives

Nickel Concentrating, Smelting & Refining 33
5.4.2 Emissions Estimation for Fuel
Fuel analysis can be used to predict SO2, metals, and other emissions resulting fromcombustion.
The basic equation used in fuel analysis emission calculations is the following:
Emission of Substance = Rate of Fuel Usage * wt % * MWp
(kg/hr) (kg/hr) 100 EWf
where:
wt % = weight percent of the element in the fuel.MWp = molecular weight of substance emitted (kg/kg-mole)EWf = elemental weight of substance in fuel (kg/kg-mole)
SO2 emissions from combustion can be calculated based on the concentration of sulfur inthe fuel.
This approach assumes complete (100%) conversion of sulfur to SO2. Therefore, for everykilogram of sulfur (EW = 32) burned, two kilograms of SO2 (MW = 64) are emitted.
Emission of SO2 (kg/hr) = Fuel Usage (kg/hr) * wt % S * MWSO2
100 EWS
Where: wt % S = weight percent of sulfur (as elemental S) in the fuel.
The emissions are estimated as kg/hr and as such should be multiplied by the hours ofoperation in order to determine the total emission load.
Guidance on emissions from fuel combustion may also be found in the following NPIEET Manuals:
• Fossil Fuel Electric Power Generation;• Combustion Engines; and• Combustion in Boilers.
5.5 Cyanide Balance
Cyanide is used in small quantities at a limited number of facilities for arsenic suppressionwithin the nickel concentrating, smelting and refining industry. It is likely that mostfacilities will not trigger the reporting threshold for cyanide.
The NPI requires that inorganic cyanide compounds are reported where the threshold istriggered. As such when estimating emissions of cyanide to the environment it isimportant that total cyanide is reported where the CN- mass is not known.
Cyanide fates within the process and TSFs are extremely complex. Evaporation,reduction, oxidation, precipitation, adsorption, desorption, exchange reactions are just a
Nickel Concentrating, Smelting & Refining 34
few of many possible simultaneous events. Ultimately, all cyanide is either emitted to theenvironment, decomposed or complexed within the TSFs.
A mass balance approach may be employed to develop a flow diagram of cyanideadditions and losses to the process. It is likely, however, that the mass balance approachwill be supported by other EETs, (eg. direct measurement and modelling), in order toincrease the accuracy of estimated emissions.
5.5.1 Cyanide Emissions from Storage and Mixing Areas
Cyanide emissions from storage and mixing areas will mainly be due to spillage lossesand may be estimated through effective record keeping of all spills and inventories ofsupplies.
Losses to ground and water may be differentiated through effective record keeping of allspills, and the fate of spilled material (washed to treatment process, absorbed anddisposed of to licensed site etc).
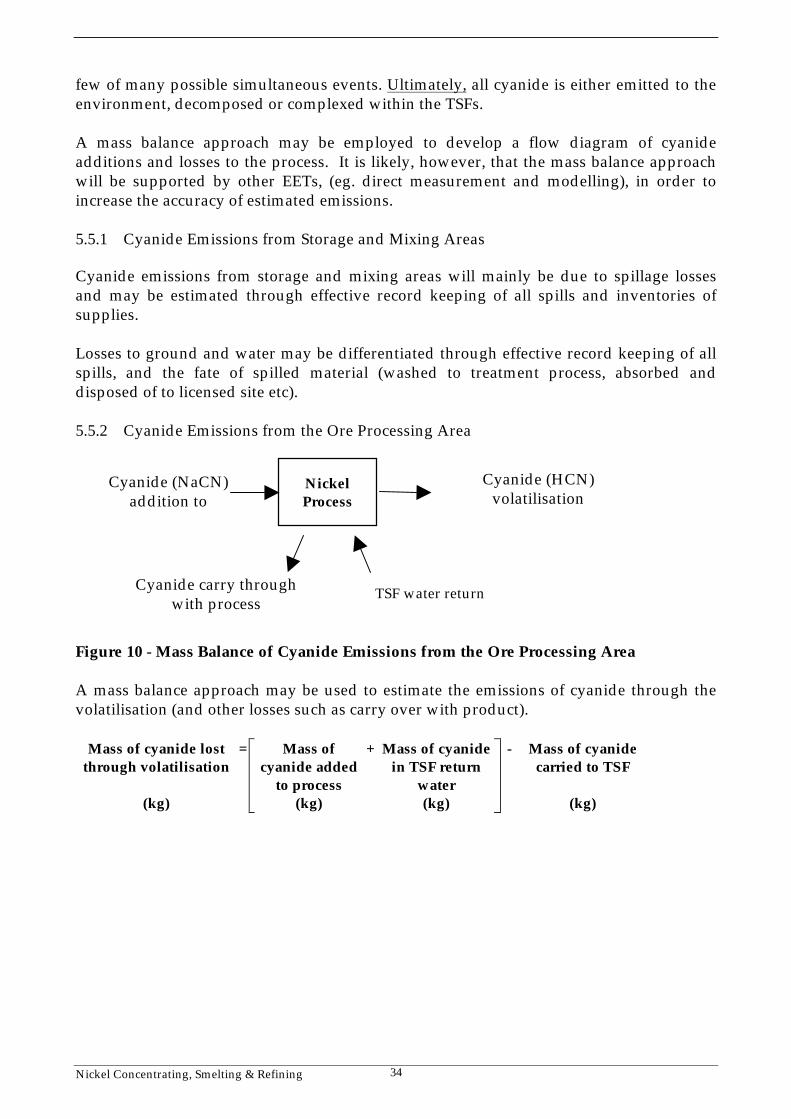
5.5.2 Cyanide Emissions from the Ore Processing Area
Figure 10 - Mass Balance of Cyanide Emissions from the Ore Processing Area
A mass balance approach may be used to estimate the emissions of cyanide through thevolatilisation (and other losses such as carry over with product).
Mass of cyanide lostthrough volatilisation
(kg)
= Mass ofcyanide added
to process(kg)
+ Mass of cyanidein TSF return
water(kg)
- Mass of cyanidecarried to TSF
(kg)
NickelProcess
Cyanide (NaCN)addition to
Cyanide (HCN)volatilisation
TSF water returnCyanide carry throughwith process
Nickel Concentrating, Smelting & Refining 35
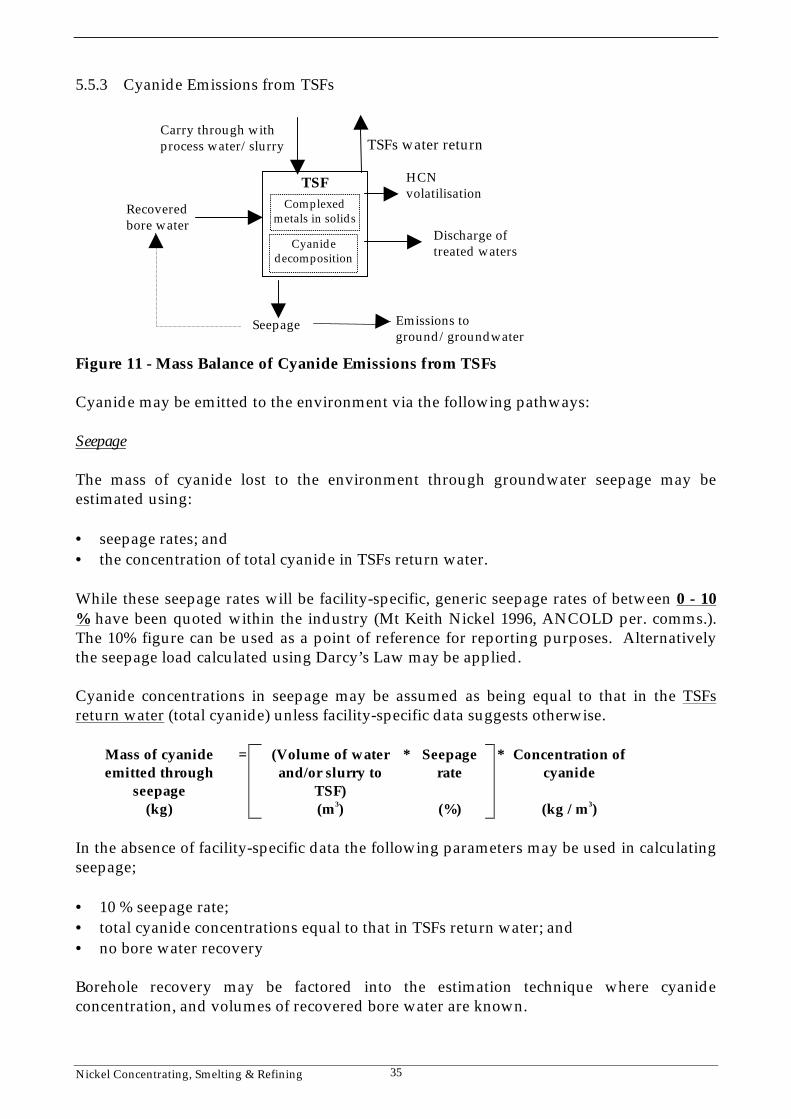
5.5.3 Cyanide Emissions from TSFs
Figure 11 - Mass Balance of Cyanide Emissions from TSFs
Cyanide may be emitted to the environment via the following pathways:
Seepage
The mass of cyanide lost to the environment through groundwater seepage may beestimated using:
• seepage rates; and• the concentration of total cyanide in TSFs return water.
While these seepage rates will be facility-specific, generic seepage rates of between 0 - 10% have been quoted within the industry (Mt Keith Nickel 1996, ANCOLD per. comms.).The 10% figure can be used as a point of reference for reporting purposes. Alternativelythe seepage load calculated using Darcy’s Law may be applied.
Cyanide concentrations in seepage may be assumed as being equal to that in the TSFsreturn water (total cyanide) unless facility-specific data suggests otherwise.
Mass of cyanideemitted through
seepage(kg)
= (Volume of waterand/or slurry to
TSF)(m3)
* Seepagerate
(%)
* Concentration ofcyanide
(kg / m3)
In the absence of facility-specific data the following parameters may be used in calculatingseepage;
• 10 % seepage rate;• total cyanide concentrations equal to that in TSFs return water; and• no bore water recovery
Borehole recovery may be factored into the estimation technique where cyanideconcentration, and volumes of recovered bore water are known.
Discharge oftreated waters
TSF
TSFs water returnCarry through withprocess water/slurry
HCNvolatilisation
Complexedmetals in solids
Seepage
Recoveredbore water
Emissions toground/groundwater
Cyanidedecomposition
Nickel Concentrating, Smelting & Refining 36
Volatilisation
In natural degradation most ‘free’ cyanide is lost through volatilisation (BPEMIM,Cyanide Management, 1998). The cyanide is volatilised as HCN, which ultimately breaksdown to form ammonia and carbon dioxide
At present there is no reliable method for estimating emissions of cyanide from TSFs usinga mass balance. The emissions factors for volatilisation from TSFs presented inSection 6.7.2 may be used to estimate these emissions.
Alternative cyanide EETs include Emission Factors,Modelling & Direct Measurement
Nickel Concentrating, Smelting & Refining 37
6.0 Emission FactorsAn emission factor is a tool that is used to estimate emissions to the environment.Emission factors are a useful tool for estimating emissions where the relationship betweenthe emission and the “use” of substances is well defined. Emission factors are widely usedin estimating emissions from combustion sources, (eg. furnaces and fuel usage).
Emission factors are obtained from US, European, and Australian sources and are usuallyexpressed as the weight of a substance emitted, such as the mass of PM10 and TSPproduced per tonne of ore handled.
Emission factors are used to estimate emissions by the general equation:
Ekpy,i = [A * OpHrs] * EFi * [1 - (CEi/100)]
where :
Ekpy,i = emission rate of pollutant i, kg/yr A = activity rate, t/hr OpHrs= operating hours, hr/yr EFi = uncontrolled emission factor of pollutant i, kg/t CEi = overall control efficiency for pollutant i, %.
Some emission factors may involve the use of more complex equations and requiredifferentiation of substances fates. Estimation of cyanide fates is an example of asubstance that may require the use of more complex EETs.
Emission factors are derived from direct measurement of actual emission loads from arange of similar plants or equipment. While emission factors have an empirical basis theyare based on standard equipment and operating practices. As such, the site-specificcharacteristics of facilities will introduce inaccuracies to the use of emission factors, andwith the increasing use of improved technologies and control methods, emission factorsmay become dated.
Emission factors may be verified at individual facilities by carrying out direct monitoringof emission sources and developing site-specific variations to the standard factors toreflect on-site operational processes and practices.
6.1 Carbon Disulfide
In the nickel industry carbon disulfide is formed through the breakdown of xanthateswhich are added at the flotation stage of ore processing.
Xanthate breakdown is influenced by a number of factors. Within the nickelconcentrating, smelting and refining industry the most significant of these factors are:
• pH (below pH 7 the xanthate decomposition rate increases dramatically); and• temperature (10°C rise in temperature may cause a threefold increase in decomposition
rates).[Source: WMC Report Ref 692 634, 1992]
Nickel Concentrating, Smelting & Refining 38
The stoichiometry of xanthate decomposition, and hence CS2 formation, will also varyaccording to the pH.
• Hydrolytic decomposition (alkali conditions) of the xanthate ion results in astoichiometry of 1:0.5 (xanthate to CS2).
• Hydrolysis decomposition (acidic conditions) of the xanthate ion results in astoichiometry of 1:1 (xanthate to CS2).
[Source: WMC Report Ref 692 634, 1992]
The decomposition stoichiometry will vary with the form of xanthate used at particularfacilities. Facilities should verify the stoichiometry(s) to be applied based on their use ofxanthate types.
The nickel concentrating, smelting and refining area will generally be of an alkaline pH.However at some facilities this may be very difficult to achieve. TSFs are also likely to bealkaline, although the geochemistry of the ore being handled may result in TSFs becomingacid.
Available data suggests a wide range of xanthate decomposition rates under varyingconditions. Additionally, limited carry over of xanthate may take place with the productand some carry over to TSFs (approx. 2% [Society of Mining Engineers, 1976] ) may also occur.
However, as the first point of reference, it can be assumed that 100% degradation ofxanthate occurs within the processing area.
Nickel Concentrating, Smelting & Refining 39
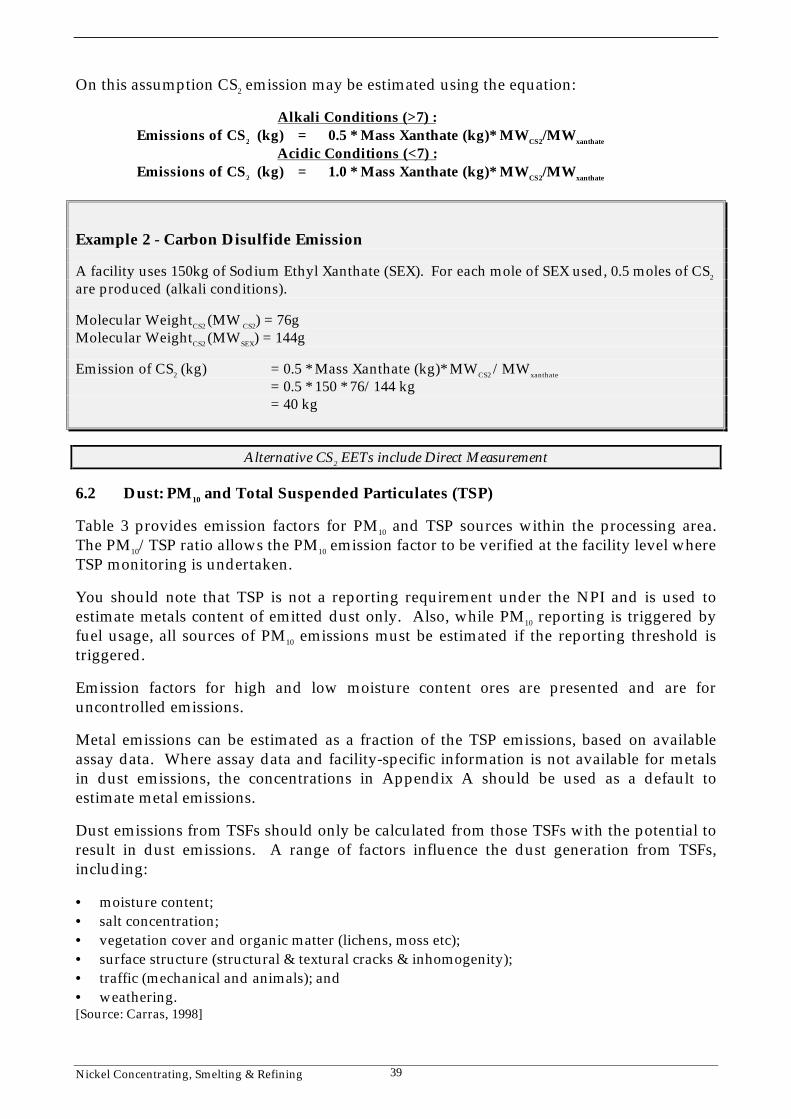
On this assumption CS2 emission may be estimated using the equation:
Alkali Conditions (>7) :Emissions of CS2 (kg) = 0.5 * Mass Xanthate (kg)* MWCS2/MWxanthate
Acidic Conditions (<7) :Emissions of CS2 (kg) = 1.0 * Mass Xanthate (kg)* MWCS2/MWxanthate
Example 2 - Carbon Disulfide Emission
A facility uses 150kg of Sodium Ethyl Xanthate (SEX). For each mole of SEX used, 0.5 moles of CS2
are produced (alkali conditions).
Molecular WeightCS2 (MW CS2) = 76gMolecular WeightCS2 (MWSEX) = 144g
Emission of CS2 (kg) = 0.5 * Mass Xanthate (kg)* MWCS2 /MWxanthate
= 0.5 * 150 * 76/144 kg = 40 kg
Alternative CS2 EETs include Direct Measurement
6.2 Dust: PM10 and Total Suspended Particulates (TSP)
Table 3 provides emission factors for PM10 and TSP sources within the processing area.The PM10/TSP ratio allows the PM10 emission factor to be verified at the facility level whereTSP monitoring is undertaken.
You should note that TSP is not a reporting requirement under the NPI and is used toestimate metals content of emitted dust only. Also, while PM10 reporting is triggered byfuel usage, all sources of PM10 emissions must be estimated if the reporting threshold istriggered.
Emission factors for high and low moisture content ores are presented and are foruncontrolled emissions.
Metal emissions can be estimated as a fraction of the TSP emissions, based on availableassay data. Where assay data and facility-specific information is not available for metalsin dust emissions, the concentrations in Appendix A should be used as a default toestimate metal emissions.
Dust emissions from TSFs should only be calculated from those TSFs with the potential toresult in dust emissions. A range of factors influence the dust generation from TSFs,including:
• moisture content;• salt concentration;• vegetation cover and organic matter (lichens, moss etc);• surface structure (structural & textural cracks & inhomogenity);• traffic (mechanical and animals); and• weathering.[Source: Carras, 1998]
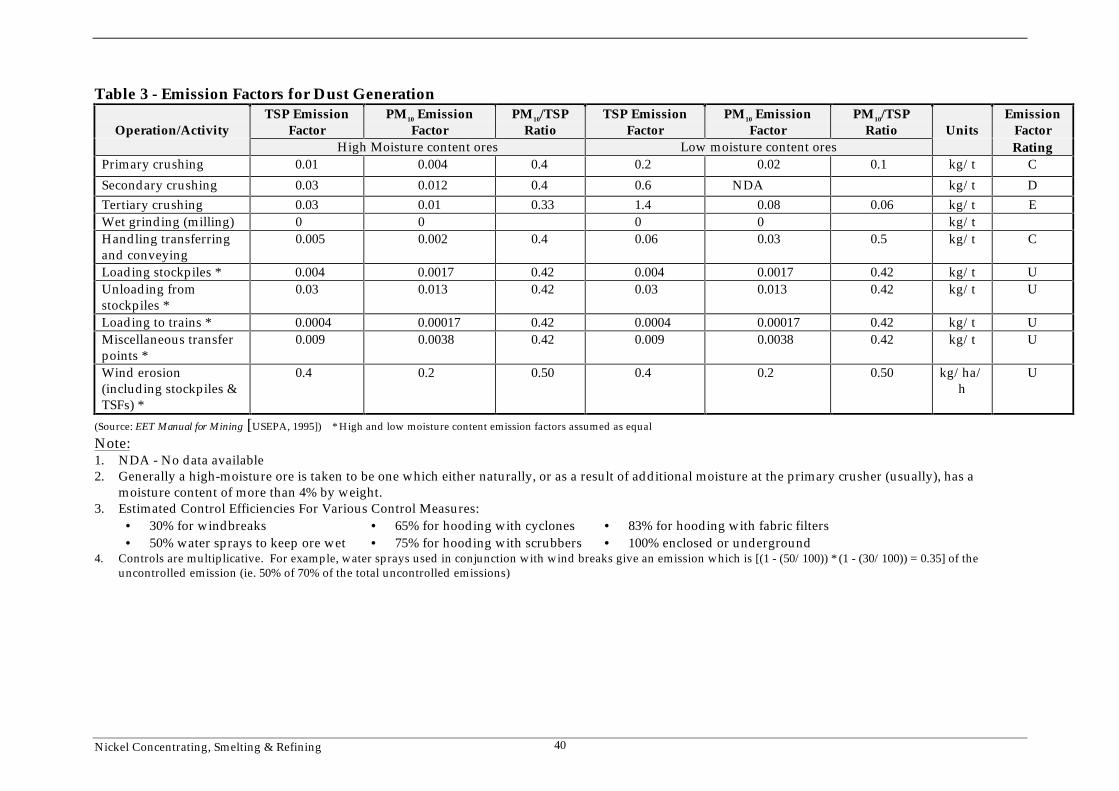
Nickel Concentrating, Smelting & Refining 40
Table 3 - Emission Factors for Dust Generation
Operation/ActivityTSP Emission
FactorPM10 Emission
FactorPM10/TSP
RatioTSP Emission
FactorPM10 Emission
FactorPM10/TSP
Ratio UnitsEmission
FactorHigh Moisture content ores Low moisture content ores Rating
Primary crushing 0.01 0.004 0.4 0.2 0.02 0.1 kg/t C
Secondary crushing 0.03 0.012 0.4 0.6 NDA kg/t DTertiary crushing 0.03 0.01 0.33 1.4 0.08 0.06 kg/t EWet grinding (milling) 0 0 0 0 kg/tHandling transferringand conveying
0.005 0.002 0.4 0.06 0.03 0.5 kg/t C
Loading stockpiles * 0.004 0.0017 0.42 0.004 0.0017 0.42 kg/t UUnloading fromstockpiles *
0.03 0.013 0.42 0.03 0.013 0.42 kg/t U
Loading to trains * 0.0004 0.00017 0.42 0.0004 0.00017 0.42 kg/t UMiscellaneous transferpoints *
0.009 0.0038 0.42 0.009 0.0038 0.42 kg/t U
Wind erosion(including stockpiles &TSFs) *
0.4 0.2 0.50 0.4 0.2 0.50 kg/ha/h
U
(Source: EET Manual for Mining [USEPA, 1995]) * High and low moisture content emission factors assumed as equal
Note:1. NDA - No data available2. Generally a high-moisture ore is taken to be one which either naturally, or as a result of additional moisture at the primary crusher (usually), has a
moisture content of more than 4% by weight.3. Estimated Control Efficiencies For Various Control Measures:
• 30% for windbreaks• 50% water sprays to keep ore wet
• 65% for hooding with cyclones• 75% for hooding with scrubbers
• 83% for hooding with fabric filters• 100% enclosed or underground
4. Controls are multiplicative. For example, water sprays used in conjunction with wind breaks give an emission which is [(1 - (50/100)) * (1 - (30/100)) = 0.35] of theuncontrolled emission (ie. 50% of 70% of the total uncontrolled emissions)
Nickel Concentrating, Smelting & Refining 41
Retaining a wet surface on TSFs will prevent dust generation (BPEMIM, TailingsContainment, 1995), while TSFs with a low salt content, (and a low moisture content), havea greater potential for dust generation than TSFs with a high salt content. Revegetation ofdecommissioned TSFs will minimise their potential for dust generation.
The potential for TSFs to generate dust should be assessed on a facility basis. Theassessment should be based on known factors that influence dust generation andobservational/monitored results.
In the absence of facility-specific dust generation factors the following assumptions maybe made:
• zero dust generation from TSFs where hyper saline water used in process;• zero dust generation from ‘wet’ area of TSFs; and• zero dust generation from vegetated TSFs.
Alternative dust EETs include Direct Measurement
6.3 Metals in Dust
PM10 and TSP may contain a metal fraction, which will represent part of the facility’smetals emissions.
The speciation of dust, both PM10 and TSP, using an emission factors approach may beachieved using:
• Metals content of ore (generic or facility-specific); and• Dust generation estimates (either through emission factors, modelling or direct
monitoring).
The metals fraction for all processing dust sources may be assumed to be the same as thatfor unprocessed ore, in the absence of more suitable data. Fractions may be sourced fromfacility-specific assays of generic ore types (Appendix A).
The metals (and cyanide) content of TSF dust emissions should be based on representativesampling of the TSFs surface matrix.
Alternative metals content of dust EETs include Direct Measurement
6.4 Sewage
The reporting threshold for Category 3 substances is unlikely to be exceeded at mostfacilities, however, it is the responsibility of each facility to determine whether they exceedthe reporting threshold.
Based on the West Australian Water Corporation wastewater treatment design criteria, theper person per day loading of total nitrogen and phosphorus has been calculated. The datain Table 4 below has been applied to the NPI reporting thresholds to provide an indicativefacility population that will result in exceedence of the reporting thresholds.
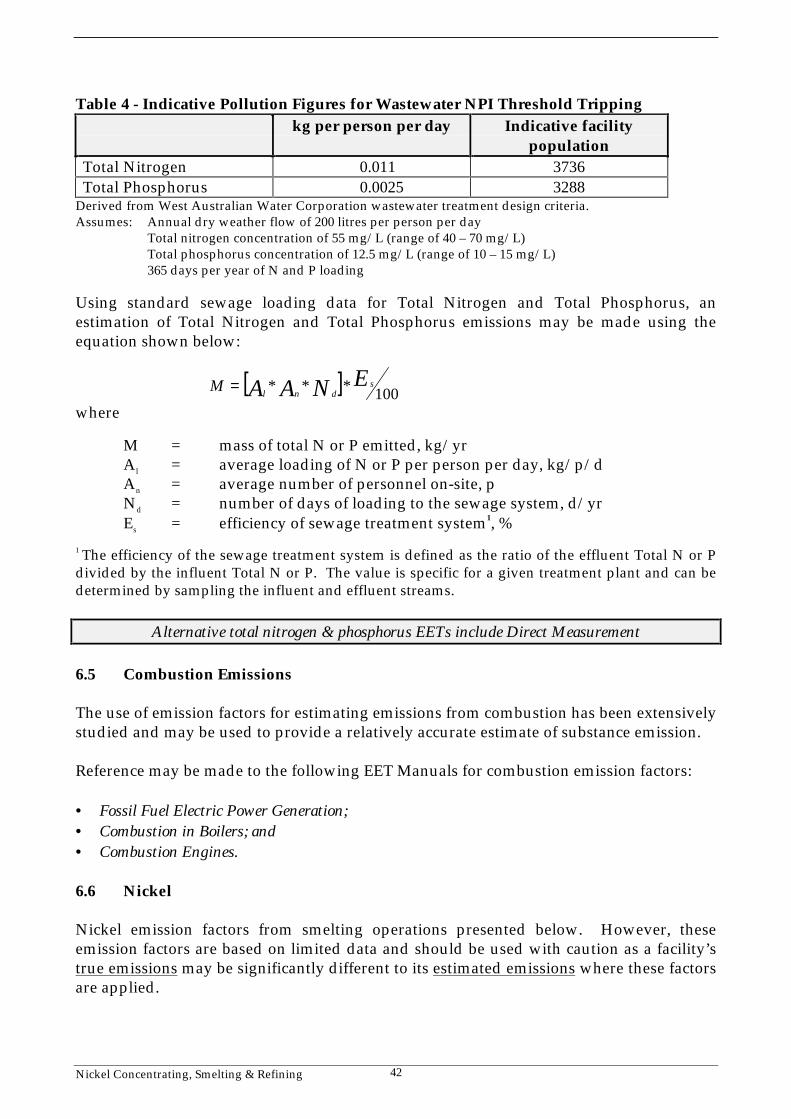
Nickel Concentrating, Smelting & Refining 42
Table 4 - Indicative Pollution Figures for Wastewater NPI Threshold Trippingkg per person per day Indicative facility
populationTotal Nitrogen 0.011 3736Total Phosphorus 0.0025 3288
Derived from West Australian Water Corporation wastewater treatment design criteria.Assumes: Annual dry weather flow of 200 litres per person per day
Total nitrogen concentration of 55 mg/L (range of 40 – 70 mg/L)Total phosphorus concentration of 12.5 mg/L (range of 10 – 15 mg/L)365 days per year of N and P loading
Using standard sewage loading data for Total Nitrogen and Total Phosphorus, anestimation of Total Nitrogen and Total Phosphorus emissions may be made using theequation shown below:
[ ] 100*** ENAA sdnl
M =
where
M = mass of total N or P emitted, kg/yrAl = average loading of N or P per person per day, kg/p/dAn = average number of personnel on-site, pNd = number of days of loading to the sewage system, d/yrEs = efficiency of sewage treatment system1, %
1 The efficiency of the sewage treatment system is defined as the ratio of the effluent Total N or Pdivided by the influent Total N or P. The value is specific for a given treatment plant and can bedetermined by sampling the influent and effluent streams.
Alternative total nitrogen & phosphorus EETs include Direct Measurement
6.5 Combustion Emissions
The use of emission factors for estimating emissions from combustion has been extensivelystudied and may be used to provide a relatively accurate estimate of substance emission.
Reference may be made to the following EET Manuals for combustion emission factors:
• Fossil Fuel Electric Power Generation;• Combustion in Boilers; and• Combustion Engines.
6.6 Nickel
Nickel emission factors from smelting operations presented below. However, theseemission factors are based on limited data and should be used with caution as a facility’strue emissions may be significantly different to its estimated emissions where these factorsare applied.
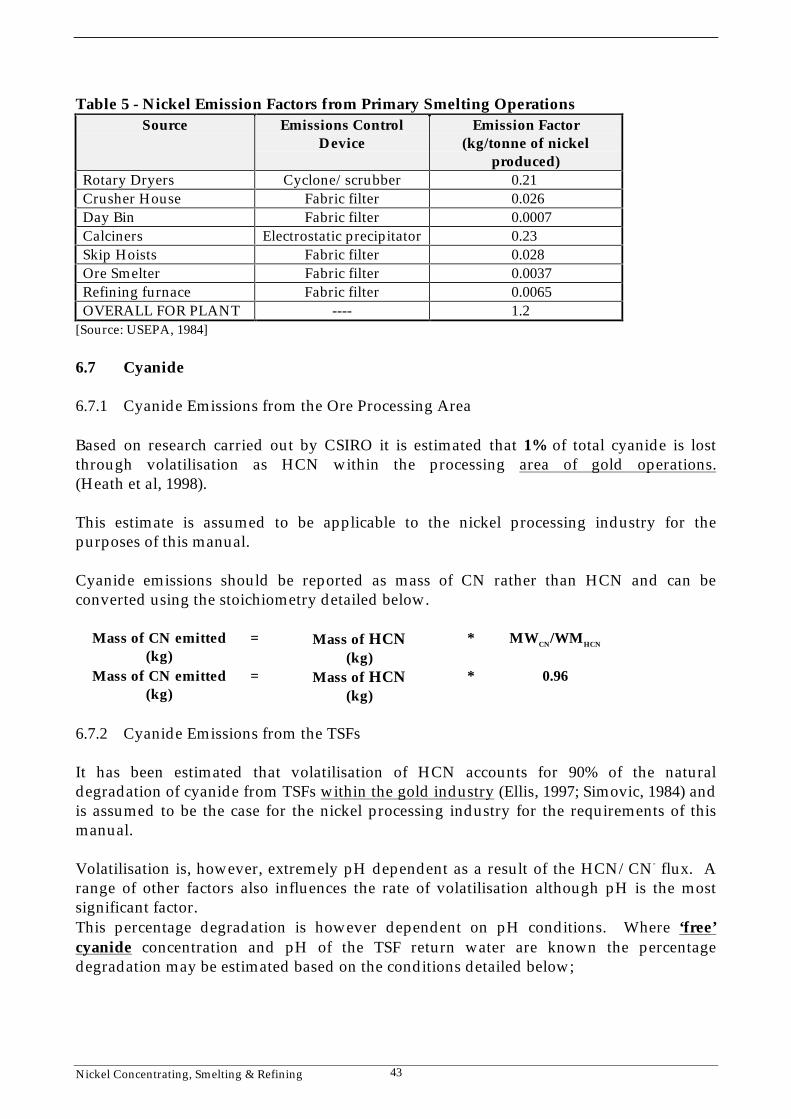
Nickel Concentrating, Smelting & Refining 43
Table 5 - Nickel Emission Factors from Primary Smelting OperationsSource Emissions Control
DeviceEmission Factor
(kg/tonne of nickelproduced)
Rotary Dryers Cyclone/scrubber 0.21Crusher House Fabric filter 0.026Day Bin Fabric filter 0.0007Calciners Electrostatic precipitator 0.23Skip Hoists Fabric filter 0.028Ore Smelter Fabric filter 0.0037Refining furnace Fabric filter 0.0065OVERALL FOR PLANT ---- 1.2
[Source: USEPA, 1984]
6.7 Cyanide
6.7.1 Cyanide Emissions from the Ore Processing Area
Based on research carried out by CSIRO it is estimated that 1% of total cyanide is lostthrough volatilisation as HCN within the processing area of gold operations.(Heath et al, 1998).
This estimate is assumed to be applicable to the nickel processing industry for thepurposes of this manual.
Cyanide emissions should be reported as mass of CN rather than HCN and can beconverted using the stoichiometry detailed below.
Mass of CN emitted(kg)
= Mass of HCN(kg)
* MWCN/WMHCN
Mass of CN emitted(kg)
= Mass of HCN(kg)
* 0.96
6.7.2 Cyanide Emissions from the TSFs
It has been estimated that volatilisation of HCN accounts for 90% of the naturaldegradation of cyanide from TSFs within the gold industry (Ellis, 1997; Simovic, 1984) andis assumed to be the case for the nickel processing industry for the requirements of thismanual.
Volatilisation is, however, extremely pH dependent as a result of the HCN/CN- flux. Arange of other factors also influences the rate of volatilisation although pH is the mostsignificant factor.This percentage degradation is however dependent on pH conditions. Where ‘free’cyanide concentration and pH of the TSF return water are known the percentagedegradation may be estimated based on the conditions detailed below;
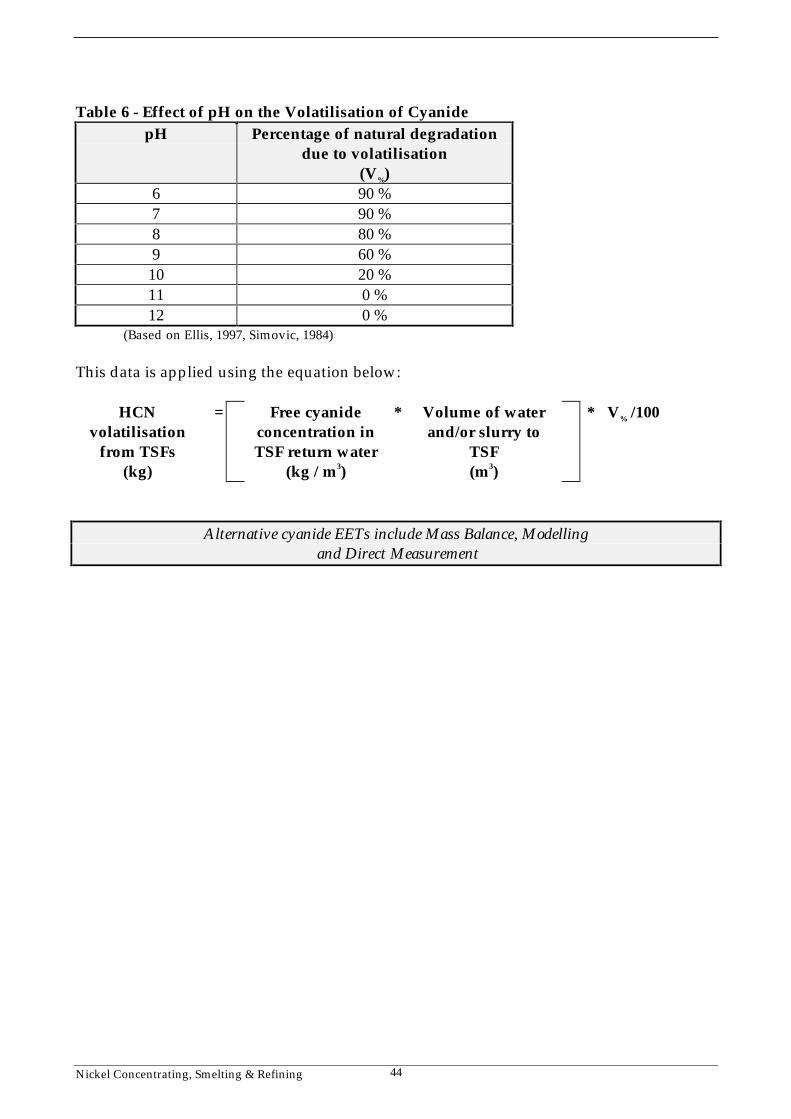
Nickel Concentrating, Smelting & Refining 44
Table 6 - Effect of pH on the Volatilisation of CyanidepH Percentage of natural degradation
due to volatilisation(V%)
6 90 %7 90 %8 80 %9 60 %10 20 %11 0 %12 0 %
(Based on Ellis, 1997, Simovic, 1984)
This data is applied using the equation below:
HCNvolatilisation
from TSFs(kg)
= Free cyanideconcentration inTSF return water
(kg / m3)
* Volume of waterand/or slurry to
TSF(m3)
* V% /100
Alternative cyanide EETs include Mass Balance, Modelling and Direct Measurement
Nickel Concentrating, Smelting & Refining 45
7.0 ModellingModelling may be utilised to determine the fate of substances emitted to the environment,including emissions to air and groundwater.
This EET may be of particular use for estimation of emissions of substances such as PM10,cyanide and dissolved metals and their emission through TSFs seepage.
For cyanide and dissolved metals emissions from TSFs, modelling would be likely to haveat least two components:
• the fate of the substance within the TSF; and• the fate and transport of substances within groundwater.
Models may be very simple, based on minimal data and making broad based assumptions,or complex with factors for weather influences, chemical speciation and site-specificfactors.
The complexity of a model will influence the accuracy of any emission estimations madeusing this method. Wherever possible, however, models should be verified by directmeasurement under a range of conditions. With effective model verification, models maybe factored to allow for site-specific influences, and other significant influences may beincluded within the model itself.
7.1 Groundwater Modelling - Fates & Trajectories
Groundwater movement may be modelled to allow prediction of groundwater fates andthat of any associated dissolved substances. Additionally, modelling will allow thetemporal prediction of groundwater movement allowing the potential for the breakdownof substances within the groundwater or their in-situ adsorption to be estimated.
Groundwater models may be based on limited data such as calculated groundwater flowrates and direction, or contain in-depth data such as the geology and hydrogeology of thearea. The complexity of models should be stated when used to estimate emissions in orderto ensure that the error bands associated with the reported data are fully appreciated.
The fate of dissolved metals resulting from TSF seepage would be suited to this approach.
7.2 Seepage from TSFs
Seepage from TSFs is generally accounted for as part of the design criteria and should notbe viewed as a failure of the containment system.
Modelling of seepage from TSFs is recognised as an appropriate means of designing andoperating TSFs. Models may be used to estimate emission of dissolved substances such ascyanide and metals.
There are many commercially available models available. Models include PC-SEEP, atwo-dimensional unsaturated/saturated groundwater flow model (Mt Keith Nickel, 1996).
Nickel Concentrating, Smelting & Refining 46
8.0 Engineering CalculationsEngineering calculations may be used to estimate emissions from processes subject to rigidcontrols, such as where a substance is formed coincidentally, (eg. carbon disulfide), orwhere the substance breaks down very quickly in the atmosphere (eg. nickel carbonyl).
These processes may be designed to operate at a given efficiency and while variations willoccur it may be valid to assume a given performance efficiency under normal operatingconditions.
Engineering calculations also utilise standard physical and chemical laws and constants toallow the estimation of particular emissions. These may include equilibrium constants,thermodynamic properties of processes, chemical reactions, pressure constants andphysical laws such as Boyle’s Law.
Engineering calculations are based on known performance standards of particularprocesses and equipment, physical/chemical properties (eg. vapour pressure) of thesubstance and mathematical relationships (eg. ideal gas law).
Nickel Concentrating, Smelting & Refining 47
9.0 Direct Measurement or Source MonitoringWhile not a requirement of the NPI, additional direct measurement (or source monitoring)is one of the more accurate methods of estimating emissions of substances from processesand facilities.
Facilities may decide to undertake direct measurement in order to:
• estimate their emissions of particular NPI substances;• verify estimates from alternative EETs; and• provide supporting data for other EETs.
Where direct measurement is undertaken it is essential to ensure background levels arefully considered. Some areas will have significant background levels of NPI substanceseither as a consequence of adjacent activities (eg. TSP and PM10) and as a consequence ofthe natural background levels (eg. metals in particular geological formations).
Monitoring programs should be designed to be representative of the parameters beingconsidered, taking standard and non-standard conditions into account. Additionally theimmediate and long-term aim of the monitoring program should be decided in order toavoid unnecessary ongoing monitoring.
Facilities may have existing monitoring commitments and data, which can be applied tothe reporting requirements of the NPI. Potential sources of existing data are discussed inAppendix B.
Facilities may also have the analytical expertise on site to enable the monitoring andanalysis of NPI substances to be undertaken in a more cost-effective manner.
Direct measurement data may be used to calculate actual loads to the environment bymultiplying the concentration of the NPI substances in the final emission stream, by thevolume of the final emission stream.
massemitted
(kg)
= substanceconcentration
(kg / m3)
* volume oftotal emission
(m3)
Where direct measurement is undertaken it is essential that sampling and monitoringprocedures are established. The procedures should ensure that all sampling and analysesare undertaken in a standard manner and in compliance with Australian, or other,standards.
9.1 Total Nitrogen and Total Phosphorus
Total nitrogen and total phosphorus loadings may be estimated using direct measurementbased on:
• wastewater flows; and• representative concentrations of total nitrogen and phosphorus in wastewater flows.
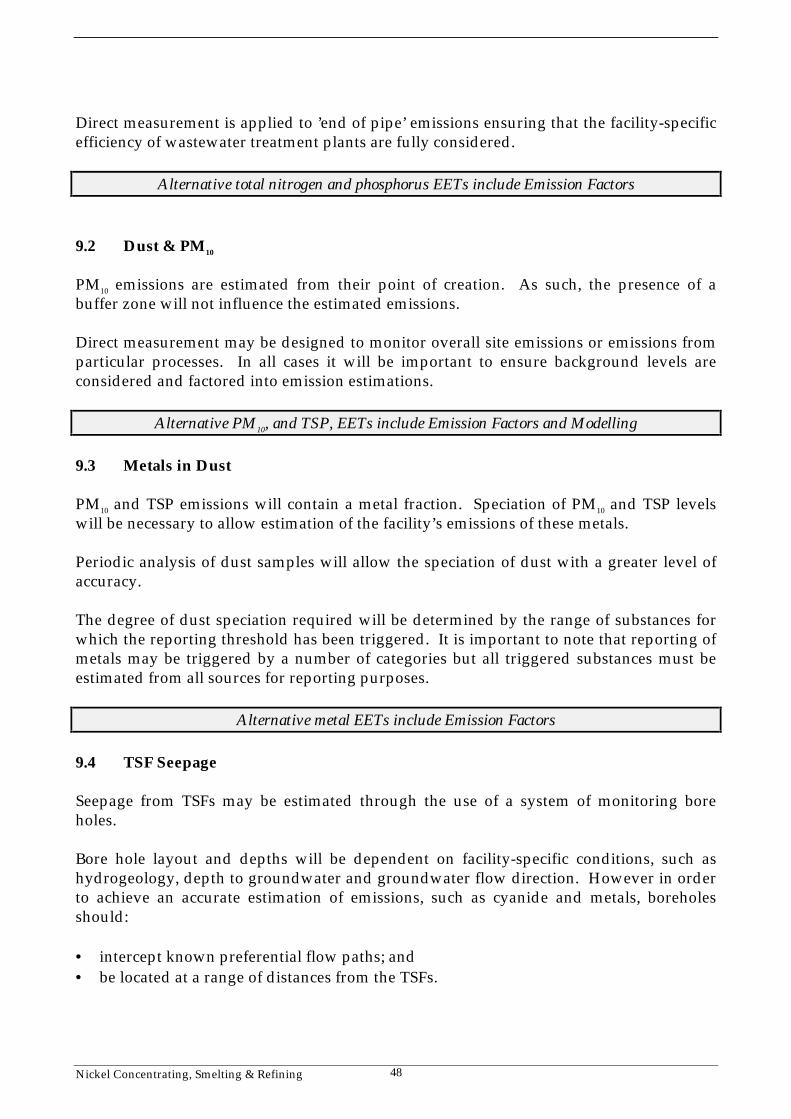
Nickel Concentrating, Smelting & Refining 48
Direct measurement is applied to ’end of pipe’ emissions ensuring that the facility-specificefficiency of wastewater treatment plants are fully considered.
Alternative total nitrogen and phosphorus EETs include Emission Factors
9.2 Dust & PM10
PM10 emissions are estimated from their point of creation. As such, the presence of abuffer zone will not influence the estimated emissions.
Direct measurement may be designed to monitor overall site emissions or emissions fromparticular processes. In all cases it will be important to ensure background levels areconsidered and factored into emission estimations.
Alternative PM10, and TSP, EETs include Emission Factors and Modelling
9.3 Metals in Dust
PM10 and TSP emissions will contain a metal fraction. Speciation of PM10 and TSP levelswill be necessary to allow estimation of the facility’s emissions of these metals.
Periodic analysis of dust samples will allow the speciation of dust with a greater level ofaccuracy.
The degree of dust speciation required will be determined by the range of substances forwhich the reporting threshold has been triggered. It is important to note that reporting ofmetals may be triggered by a number of categories but all triggered substances must beestimated from all sources for reporting purposes.
Alternative metal EETs include Emission Factors
9.4 TSF Seepage
Seepage from TSFs may be estimated through the use of a system of monitoring boreholes.
Bore hole layout and depths will be dependent on facility-specific conditions, such ashydrogeology, depth to groundwater and groundwater flow direction. However in orderto achieve an accurate estimation of emissions, such as cyanide and metals, boreholesshould:
• intercept known preferential flow paths; and• be located at a range of distances from the TSFs.
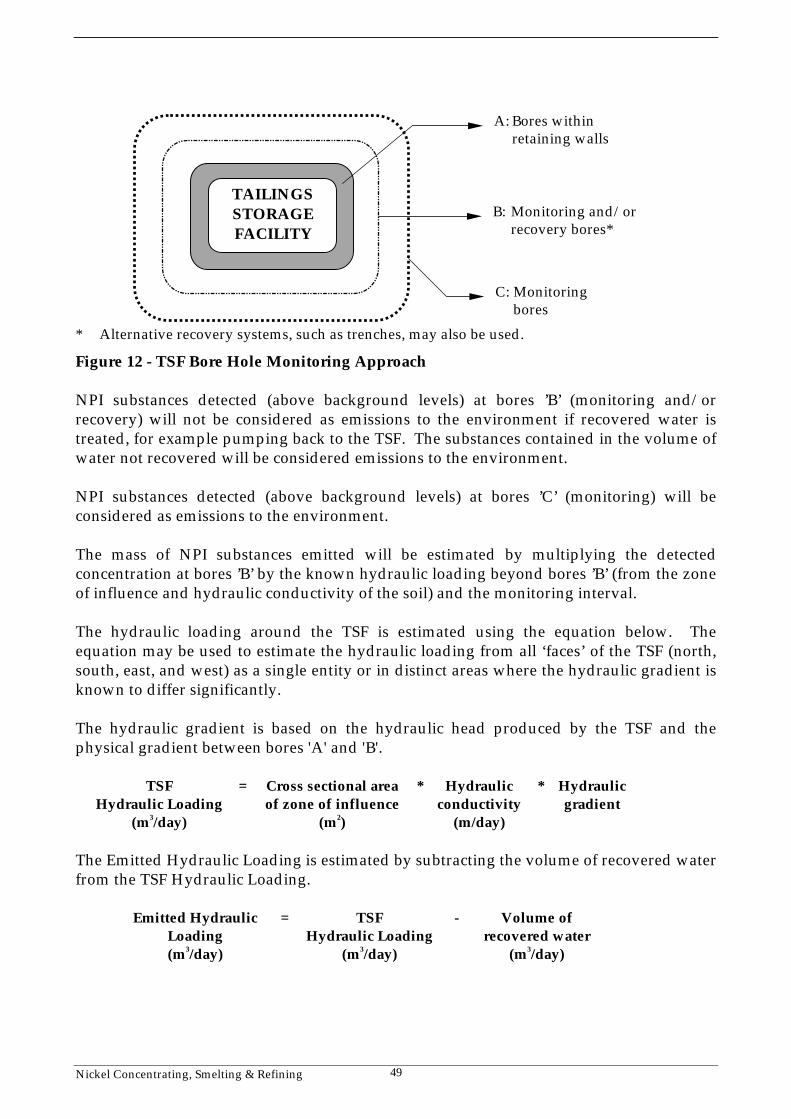
Nickel Concentrating, Smelting & Refining 49
* Alternative recovery systems, such as trenches, may also be used.
Figure 12 - TSF Bore Hole Monitoring Approach
NPI substances detected (above background levels) at bores ’B’ (monitoring and/orrecovery) will not be considered as emissions to the environment if recovered water istreated, for example pumping back to the TSF. The substances contained in the volume ofwater not recovered will be considered emissions to the environment.
NPI substances detected (above background levels) at bores ’C’ (monitoring) will beconsidered as emissions to the environment.
The mass of NPI substances emitted will be estimated by multiplying the detectedconcentration at bores ’B’ by the known hydraulic loading beyond bores ’B’ (from the zoneof influence and hydraulic conductivity of the soil) and the monitoring interval.
The hydraulic loading around the TSF is estimated using the equation below. Theequation may be used to estimate the hydraulic loading from all ‘faces’ of the TSF (north,south, east, and west) as a single entity or in distinct areas where the hydraulic gradient isknown to differ significantly.
The hydraulic gradient is based on the hydraulic head produced by the TSF and thephysical gradient between bores 'A' and 'B'.
TSFHydraulic Loading
(m3/day)
= Cross sectional areaof zone of influence
(m2)
* Hydraulicconductivity
(m/day)
* Hydraulicgradient
The Emitted Hydraulic Loading is estimated by subtracting the volume of recovered waterfrom the TSF Hydraulic Loading.
Emitted HydraulicLoading(m3/day)
= TSFHydraulic Loading
(m3/day)
- Volume ofrecovered water
(m3/day)
TAILINGSSTORAGEFACILITY
B: Monitoring and/orrecovery bores*
C: Monitoringbores
A: Bores withinretaining walls
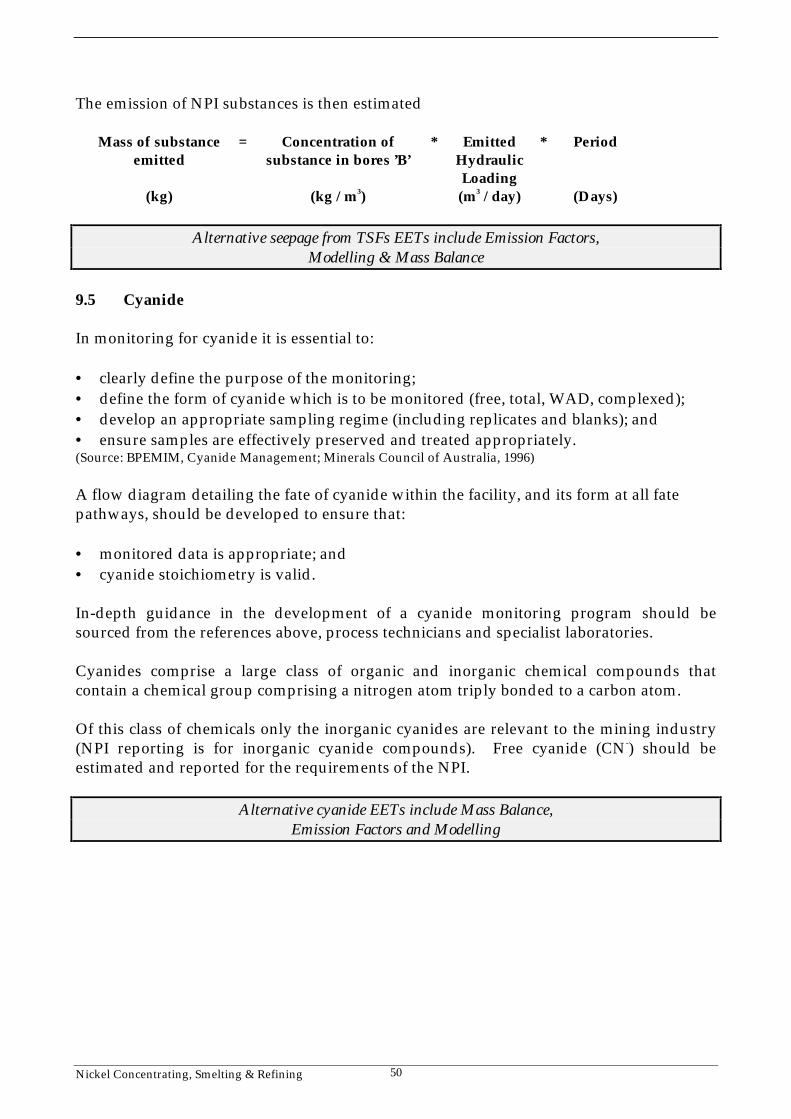
Nickel Concentrating, Smelting & Refining 50
The emission of NPI substances is then estimated
Mass of substanceemitted
(kg)
= Concentration ofsubstance in bores ’B’
(kg / m3)
* EmittedHydraulicLoading
(m3 / day)
* Period
(Days)
Alternative seepage from TSFs EETs include Emission Factors,Modelling & Mass Balance
9.5 Cyanide
In monitoring for cyanide it is essential to:
• clearly define the purpose of the monitoring;• define the form of cyanide which is to be monitored (free, total, WAD, complexed);• develop an appropriate sampling regime (including replicates and blanks); and• ensure samples are effectively preserved and treated appropriately.(Source: BPEMIM, Cyanide Management; Minerals Council of Australia, 1996)
A flow diagram detailing the fate of cyanide within the facility, and its form at all fatepathways, should be developed to ensure that:
• monitored data is appropriate; and• cyanide stoichiometry is valid.
In-depth guidance in the development of a cyanide monitoring program should besourced from the references above, process technicians and specialist laboratories.
Cyanides comprise a large class of organic and inorganic chemical compounds thatcontain a chemical group comprising a nitrogen atom triply bonded to a carbon atom.
Of this class of chemicals only the inorganic cyanides are relevant to the mining industry(NPI reporting is for inorganic cyanide compounds). Free cyanide (CN-) should beestimated and reported for the requirements of the NPI.
Alternative cyanide EETs include Mass Balance,Emission Factors and Modelling
Nickel Concentrating, Smelting & Refining 51
10.0 Emission Factor RatingEvery emission factor has an associated emission factor rating (EFR) code. This ratingsystem is common to EETs for all industries and sectors and therefore, to all IndustryHandbooks. They are based on rating systems developed by the United StatesEnvironmental Protection Agency (USEPA), and by the European Environment Agency(EEA). Consequently, the ratings may not be directly relevant to Australian industry.Sources for all emission factors cited can be found Section 12.0 of this Manual. Theemission factor ratings will not form part of the public NPI database.
When using emission factors, you should be aware of the associated EFR code and whatthat rating implies. An A or B rating indicates a greater degree of certainty than a D or Erating. The less certainty, the more likely that a given emission factor for a specific sourceor category is not representative of the source type. These ratings notwithstanding, themain criterion affecting the uncertainty of an emission factor remains the degree ofsimilarity between the equipment/process selected in applying the factor, and the targetequipment/process from which the factor was derived.
The EFR system is as follows:
A - ExcellentB - Above AverageC - AverageD - Below AverageE - PoorU - Unrated
Estimating the facility’s emissions based on emission factors only, and without taking intoaccount any control measures, may have an uncertainty as high as 100%.
Where emission factor ratings have not been included, these emission factors should beassumed to be 'U', or unrated factors. This rating reflects the limited amount of researchand data upon which the factors have been based, and/or the confidence associated withthe factor itself.
Nickel Concentrating, Smelting & Refining 52
11.0 Definitions
Reference should be made to the National Pollution Inventory and The NPI Guide fordefinition of terms used within the NPI system.
Boundary Boundary is defined in varying ways dependingon the emission type. For emissions to airboundary is the point of creation (such as thesurface of a liquid during evaporation, or thewheels of a vehicle for dust generation). Foremissions to land and water, boundary is thepoint at which a substance is no longer contained(such as a spill to ground from a process vessel,or a discharge to surface waters from a treatmentworks).
Direct Measurement Technique used to estimate emissions to theenvironment through the sampling and analysisof emission streams.
Emission Any release of substances to the environmentwhether it is in a pure form or contained in othermatter. Emissions may be solid, liquid orgaseous.
Emission Factor A number or equation that may be applied toraw data from a facility to estimate emissionsfrom that facility without the need for emissionssampling and analysis. This technique is mostoften used to estimate gaseous emissions to theenvironment.
Fugitive Emissions Emissions not released from a vent or stack.Inventory Means of recording usage and stores of all
materials, and product, held on a facility orutilised by a process.
Mass Balance Technique Estimation of emissions to the environmentthrough equalisation of inputs and outputs to aparticular process or facility.
Power Generation Production of power for the operation of facilitiesand use in processes.
Nickel Concentrating, Smelting & Refining 53
12.0 References
12.1 References Cited in Text
ANCOLD, pers comms Telephone conversation with ANCOLDrepresentative, Re. Guidelines on Tailings Disposaland TSFs seepage
BPEMIM, CyanideManagement, 1998
BPEMIM, Cyanide Management (1998), Best PracticeEnvironmental Management in Mining series, ’CyanideManagement’, EPA
BPEMIM, TailingsContainment, 1995
BPEMIM, Tailings Containment (1995), Best PracticeEnvironmental Management in Mining series, ’TailingsContainment’, EPA
Carras, 1998 Carras (1998), Letter to PPK Environment &Infrastructure, CSIRO
Ellis, 1997 Ellis (1997), Investigation & Modelling of the NaturalDecay of Cyanide in a Gold Mine Tailings Pond, DanielEllis, Honours Thesis, University of Western Australia.
Heath et al, 1998 Heath et al (1998), A method for measuring HCN(g)
emission from CIP / CIL tanks, CSIRO & CurtinUniversity
MERIWA Project M241,1998
MERIWA Project M241 (1998), ‘Saline Tailings Disposal& Decommissioning’, Australian Centre forGeomechanics [ACG : 1004-98 (A)/(B)]
Minerals Council ofAustralia, 1996
Minerals Council of Australia (1996), Tailings StorageFacilities at Australian Gold Mines
Mt Keith Nickel, 1996 Mt Keith Nickel (1996), Mt Keith Nickel Project TailingsStorage Upgrade CER, Jan 1996, for WMC byWoodward Clyde
NOI Guidelines, 1993 NOI Guidelines (1993), Guidelines for preparation of a“Notice of Intent” - tailings disposal facility, vat leach, heapleach or extensions to existing structures. WA DoME,July 1993
Schulz, Roger, 1998 Roger Schulz (1998), Letter to NSW EPA and PPKEnvironment & Infrastructure
Nickel Concentrating, Smelting & Refining 54
Simovic, 1984 Simovic (1984), Report on Natural Degradation ofCyanides from the Cullaton Lake Gold Mines Effluent,Environment Canada, Waste Water TechnologyCentre.
NOTE: Referenced through Ellis, 1997
Society of MiningEngineers, 1976
Society of Mining Engineers (1976), Environmentalproblems of flotation reagents in mineral processing planttailings water’, Davis et al.Flotation, A M Gaudin Memorial Volume, Society ofMining Engineers, M C Furstenen (Ed), 1976
USEPA, 1984 USEPA (1984), Locating and estimating air emissions fromsources of nickel, March 1984, EPA-450/4-84-0071
USEPA, 1995 USEPA (1995), Compilation of Air Pollutant EmissionFactors, Volume I, Fifth Edition, AP-42
WMC Report Ref 692 634,1992
WMC Report Ref 692 634 (1992), Investigation ofEngineering Design Criteria for Xanthate HandlingFacilities
The following Emission Estimation Technique Manuals referred to in this Manualare available at the NPI Homepage and from your local environmental protectionagency (see the front of the NPI Guide for details);
• Combustion in Boilers;• Combustion Engines;• Fuel & Organic Liquid Storage;• Fossil Fuel Electric Power Generation; and• Sewage & Wastewater Treatment.
Nickel Concentrating, Smelting & Refining 55
12.2 References Not Cited in Text
Background Report AP-42 Section 5.17 Sulfuric Acid, December 1992
Consultative Environmental Review Volume 1 - Bulong Nickel Laterite Project, KinhillEngineers, February 1996
Cyanide Management Guidelines, Department of Minerals and Energy, MiningEngineering Division, July 1992
Guidelines for Mining in Arid Environments, WA Department of Minerals and Energy,June 1996
Guidelines for the Preparation of an Annual Environmental Report, WA Department ofMinerals and Energy, April 1996
Guidelines for the Safe Design and Operating Standards for Tailings Storage, WADepartment of Minerals and Energy, March 1996
Olympic Dam Expansion Project - Environmental Impact Statement, Kinhill Engineers,May 1997
Sodium Ethyl Xanthate - Full Public Report, National Industrial Chemicals Notification &Assessment Scheme.
Tailings Containment, Best Practice Environmental Management in Mining, EnvironmentProtection Agency, June 1995
Technical Guidelines for the Environmental Management of Exploration and Mining inQueensland, WA Department of Minerals and Energy, January 1995
Waste Management: Solutions and Opportunities in the Mining Industry, 26th August1993

Nickel Concentrating, Smelting & Refining 56
Appendix A - Generic Ore Assays
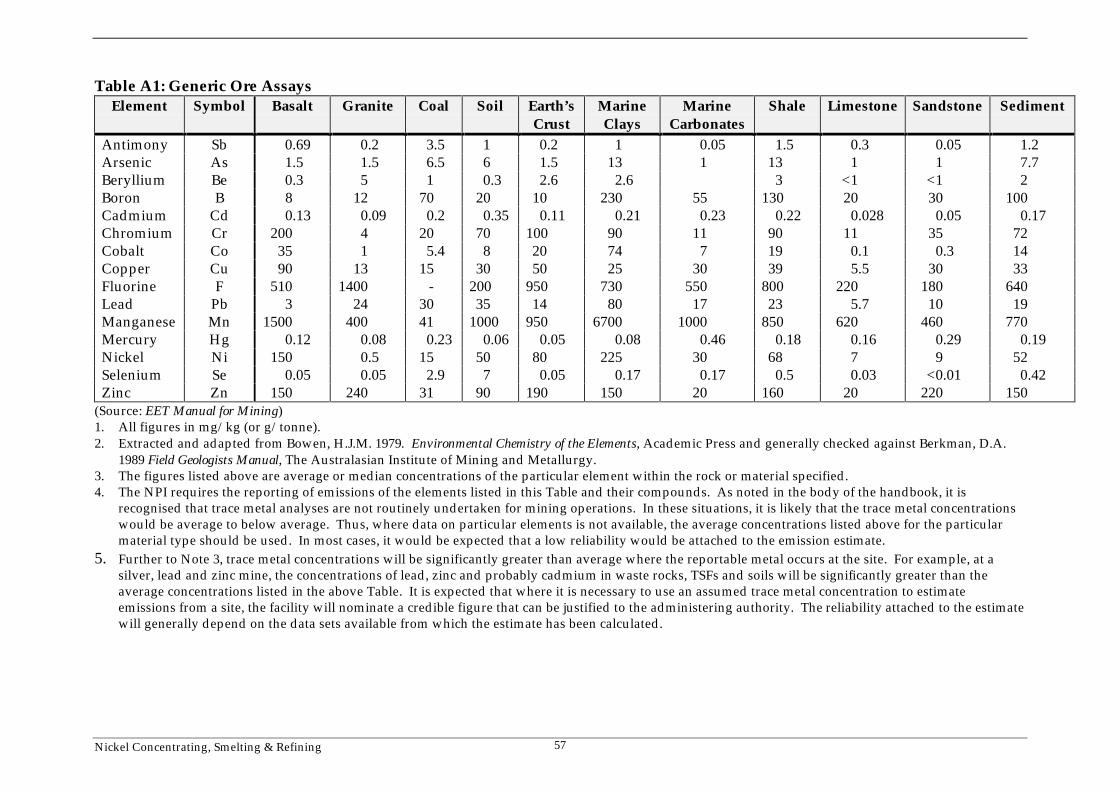
Nickel Concentrating, Smelting & Refining 57
Table A1: Generic Ore AssaysElement Symbol Basalt Granite Coal Soil Earth’s
CrustMarineClays
MarineCarbonates
Shale Limestone Sandstone Sediment
Antimony Sb 0.69 0.2 3.5 1 0.2 1 0.05 1.5 0.3 0.05 1.2Arsenic As 1.5 1.5 6.5 6 1.5 13 1 13 1 1 7.7Beryllium Be 0.3 5 1 0.3 2.6 2.6 3 <1 <1 2Boron B 8 12 70 20 10 230 55 130 20 30 100Cadmium Cd 0.13 0.09 0.2 0.35 0.11 0.21 0.23 0.22 0.028 0.05 0.17Chromium Cr 200 4 20 70 100 90 11 90 11 35 72Cobalt Co 35 1 5.4 8 20 74 7 19 0.1 0.3 14Copper Cu 90 13 15 30 50 25 30 39 5.5 30 33Fluorine F 510 1400 - 200 950 730 550 800 220 180 640Lead Pb 3 24 30 35 14 80 17 23 5.7 10 19Manganese Mn 1500 400 41 1000 950 6700 1000 850 620 460 770Mercury Hg 0.12 0.08 0.23 0.06 0.05 0.08 0.46 0.18 0.16 0.29 0.19Nickel Ni 150 0.5 15 50 80 225 30 68 7 9 52Selenium Se 0.05 0.05 2.9 7 0.05 0.17 0.17 0.5 0.03 <0.01 0.42Zinc Zn 150 240 31 90 190 150 20 160 20 220 150
(Source: EET Manual for Mining)1. All figures in mg/kg (or g/tonne).2. Extracted and adapted from Bowen, H.J.M. 1979. Environmental Chemistry of the Elements, Academic Press and generally checked against Berkman, D.A.
1989 Field Geologists Manual, The Australasian Institute of Mining and Metallurgy.3. The figures listed above are average or median concentrations of the particular element within the rock or material specified.4. The NPI requires the reporting of emissions of the elements listed in this Table and their compounds. As noted in the body of the handbook, it is
recognised that trace metal analyses are not routinely undertaken for mining operations. In these situations, it is likely that the trace metal concentrationswould be average to below average. Thus, where data on particular elements is not available, the average concentrations listed above for the particularmaterial type should be used. In most cases, it would be expected that a low reliability would be attached to the emission estimate.
5. Further to Note 3, trace metal concentrations will be significantly greater than average where the reportable metal occurs at the site. For example, at asilver, lead and zinc mine, the concentrations of lead, zinc and probably cadmium in waste rocks, TSFs and soils will be significantly greater than theaverage concentrations listed in the above Table. It is expected that where it is necessary to use an assumed trace metal concentration to estimateemissions from a site, the facility will nominate a credible figure that can be justified to the administering authority. The reliability attached to the estimatewill generally depend on the data sets available from which the estimate has been calculated.

Nickel Concentrating, Smelting & Refining 58
The table below presents the concentrations within the ore that will trigger the reportingthreshold for Category 1 NPI substances.
Metal conc. in ore(ppm)
Annual tonnage(millions of tonnes)
0.10.20.30.40.50.60.70.80.91
10100
1005033.3252016.714.312.511.11010.1
Nickel Concentrating, Smelting & Refining 59
Appendix B - Existing Data
Nickel Concentrating, Smelting & Refining 60
Existing DataThe emission estimation methods proposed in this manual require best available data.This data may be available within a corporation or facility in a range of forms and sharingthis data between facilities will aid reporting and allow for a greater level of accuracy inthe estimation of emissions.
This data may be used to:
• directly estimate emissions;• provide guidance on the most appropriate estimation methods to be used; and• provide guidance on where direct monitoring may be most beneficially carried out.
It is not intended that facilities disclose proprietary or sensitive information, rather thatthis information is used in-house to assist in the NPI reporting process.
Data sources may include the following.
Existing Data & ResearchResearch projects of interest to industry are often sponsored, such as university PhD’s andfinal year projects. These may be very directed areas of research, such as slag content andleachability or hydrogeological contamination, and may not be widely available within afacility or may be held at a corporate level.
Some mine sites currently address their dust emissions as three distinct components:
• the monitoring of ambient dust levels:• the assessment of dust sources; and• the implementation of dust control strategies.
Data of this type may be applied to emission estimation methods to increase their accuracyeither directly through the development of emission factors or indirectly by identifyingadditional process within mass balances.
Mines may also have carried out discrete monitoring studies to determine the health orenvironmental impacts of particular substances. While these studies may have shown thatminimal health or environmental risk is posed and hence ongoing monitoring is notrequired, it may also be used to allow more accurate estimation of NPI substances.
Many mines will have access to geotechnical data and groundwater data for the mine sitefrom exploration work carried out in the past. This data may provide information ongroundwater flows, the location of palaeochannels and other geological formations, andprovide useful data for deciding the location and depths of any monitoring boreholes.
Nickel Concentrating, Smelting & Refining 61
Process MonitoringElements of the process may be monitored regularly in order to optimise recovery of theproduct. This data may be applied to emission estimation methods such as mass balance,serving as a verification of the mass balance to that stage of the process and raw data.
Monitored areas may include:
• ore;• concentrate; and• TSFs water input and return.
Monitoring may also be undertaken for health and safety requirements and may include:
• ammonia;• cyanide;• acids; and• carbon monoxide.
Licenses & ReportingMine sites may be required to carry out monitoring which can be applied to therequirements of the NPI. This data may include the following parameters:
• sulfur dioxide;• sulfuric acid fumes;• arsenic (As);• dust and particulates;• metals; selenium, antimony. beryllium, cadmium. lead, mercury, chromium,
manganese, cobalt, copper, nickel, zinc;• chemical spills, including cyanide; and• dangerous goods licensing.
Facilities may monitor TSFs and storage ponds at regular intervals to ascertain reusepotential and treatment methods such as neutralisation. Where seepage from ponds andTSFs is suspected monitoring of bore holes may also be undertaken. Parameters may beexpressed as soluble or total, and may include:
• pH;• conductivity and TDS;• standing water level; and• metals.
This data may be used:
• directly where NPI substances are being monitored and reported;• indirectly such as dust monitoring where speciation of the dust component may be
required; and• relationally where the ratio of a monitored parameter can be related to the emissions of
an NPI substance.
Nickel Concentrating, Smelting & Refining 62
Approvals DataNickel mines may have Consultative Environmental Reviews (CERs), PublicEnvironmental Reviews (PERs), Notifications of Intent (NOIs) or other approvaldocuments that contain a range of facility characterisation and operational efficiency data.This may be applied to emission estimation methods to provide greater accuracy inreported data.
For example from March 1993 all proposal submitted to WA DoME require a detailedsummary and list of commitments. The range of information must be reported under theguidelines (NOI Guidelines, 1993) including:
• properties of TSFs;• TSF construction parameters;• decant or under drainage systems;• liner type; and• monitoring.
Regulatory DataRegulatory and government departments may hold extensive data relating to individualfacilities, state and territories, or national and international sources. This data may beaccessed to provide a more extensive database of available information with which todevelop facility or corporate emission estimation strategies.
SuppliersSuppliers should be able to provide in depth data regarding the fates of suppliedchemicals within the process.
A good example of this would be xanthates which breakdown to form carbon disulfide.Suppliers may be able to provide data relating to the proportional breakdown ofxanthates, environmental stability, and potential for carry through in the nickel processand to TSFs.
InventoryA facility inventory may be used to identify all inputs to the nickel process and the usagerates in relation to ore treated and product achieved. The inventory should be used as atool to assist in the estimating and reporting process and will not need to be submittedwith estimated emissions.
In addition to its use within the NPI framework a facility inventory may also be used todetermine material usage across the site assisting in:
• financial planning;• resource planning;• waste minimisation; and• environmental reporting.
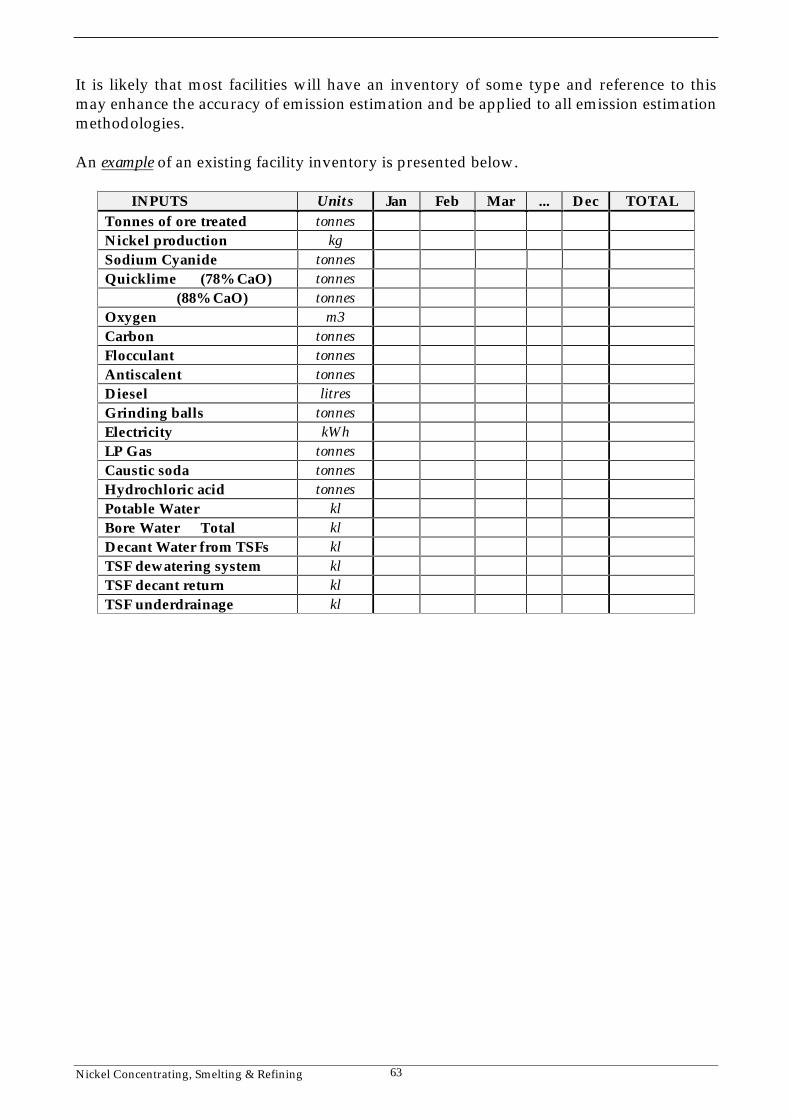
Nickel Concentrating, Smelting & Refining 63
It is likely that most facilities will have an inventory of some type and reference to thismay enhance the accuracy of emission estimation and be applied to all emission estimationmethodologies.
An example of an existing facility inventory is presented below.
INPUTS Units Jan Feb Mar ... Dec TOTALTonnes of ore treated tonnesNickel production kgSodium Cyanide tonnesQuicklime (78% CaO) tonnes
(88% CaO) tonnesOxygen m3Carbon tonnesFlocculant tonnesAntiscalent tonnesDiesel litresGrinding balls tonnesElectricity kWhLP Gas tonnesCaustic soda tonnesHydrochloric acid tonnesPotable Water klBore Water Total klDecant Water from TSFs klTSF dewatering system klTSF decant return klTSF underdrainage kl

Nickel Concentrating, Smelting & Refining 64
Appendix C - Transfers
Nickel Concentrating, Smelting & Refining 65
Transfers
Transfers are the movement of NPI waste substances from the facility. For the nickelindustry these may include:
• discharges of waste to sewer;• all material to managed landfill or waste treatment sites outside of the facility; and• all material leaving the facility to be reused, recycled, recovered, treated reprocessed or
destroyed.
The reporting of transfers is not a requirement of the NPI at this stage. However theconcept of transfers is being trialed and may become a requirement of the NPI followingthe 1999 review. If transfers are to be estimated the appropriate EETs detailed in thismanual may be used.
Examples of transfers of relevance to the nickel industry, if included in the NPI, mayinclude:
• Management of arsenic waste through its disposal at intractable waste sites.• Off-site disposal of wastewater and sludge from treatment processes will represent a
transfer.• Off-site disposal of solid wastes will represent a transfer.