emission inventory assessment for corpus...
TRANSCRIPT
Point Source Emission Inventory Assessment for Corpus Christi
2008-2009 REPORT The Neighborhood Air Toxics Modeling Project for Houston and Corpus Christi
Prepared for The Honorable Janis Graham Jack
U.S. District Court, Southern District of Texas Corpus Christi, Texas
Prepared by Elena McDonald-Buller
Hyun Suk Kim Gary McGaughey
David Sullivan David Allen
The University of Texas at Austin Center for Energy and Environmental Resources, MS R7100
10100 Burnet Road Austin, TX 78759
and
Lan Ma Greg Yarwood
ENVIRON International Corporation 773 San Marin Drive
Suite 2115 Novato, CA 94998
November 2009

2
TABLE OF CONTENTS
Page
1. Introduction .....................................................................................................................................3 2. Background......................................................................................................................................4
2.1 Toxics Release Inventory Program ...................................................................................................4 2.2 National Emissions Inventory ...........................................................................................................5 2.3 TCEQ STARS Database and Photochemical Modeling Inventories.................................................6 2.4 ACES Emission Inventory for the City of Corpus Christi ..............................................................12
3. Objectives.......................................................................................................................................13 4. Methodology ..................................................................................................................................14
5. Results ..........................................................................................................................................16
5.1 Annual Trends in Total Reported Air Toxics Emissions from the TRI Database ...........................16 5.2 Annual Trends in Reported Emissions of Individual Air Toxics form the TRI Database ..............18 5.3 Inventory Inter-comparison: Differences in the Magnitude of Emissions of Individual Air Toxcis .......................................................................................................................................26 5.4 Inventory Inter-comparison: Differences in the Spatial Allocation of Emissions ...........................37 6. Summary and Recommendations ................................................................................................50 Appendix A. Summary of Changes in VOC Emissions due to Rule Effectiveness ....................... A-1 Appendix B. Source Speciation Profile Development ......................................................................B-1 Appendix C. Comparison of the 2002 NEI Submittal with the 2002 HAP NEI ............................ C-1

3
1. Introduction A key element in performing neighborhood air quality modeling is the development of an inventory of emissions at a high-level of spatial resolution. Multiple emission inventories have been developed by environmental regulatory agencies for the Corpus Christi area, consequently a first step in this project was to assemble and compare the inventories. Emissions data from the National Emission Inventory (NEI), the Toxics Release Inventory (TRI) Program, the State of Texas Air Reporting System (STARS), and the Texas Commission on Environmental Quality’s (TCEQ) were assessed in order to support the Corpus Christi Neighborhood Air Toxic Modeling Project. These inventories were used to examine annual trends in point source emissions of toxic air pollutants, to identify differences between reported emissions and emissions used in state or national-level air quality modeling efforts, and to select emissions input data for future Gaussian dispersion modeling and photochemical modeling for the region. A total of eleven point source emission inventories were evaluated for both Nueces and San Patricio Counties:
1. 2002 TRI 2. 2003 TRI 3. 2004 TRI 4. 2005 TRI 5. 2006 TRI 6. Submittal by the State of Texas to the U.S. Environmental Protection Agency (EPA) for
the 2002 Hazardous Air Pollutant NEI 7. 2002 U.S. EPA Hazardous Air Pollutant NEI 8. Submittal by the State of Texas to the U.S. EPA for the 2005 Hazardous Air Pollutant
NEI 9. 2000 TCEQ Photochemical Modeling Emissions Inventory 10. 2005 TCEQ Photochemical Modeling Emissions Inventory 11. 2008 update to the City of Corpus Christi Emission Inventory prepared by Air
Consulting and Engineering Solutions, Ltd. (ACES)
These inventories have different origins, objectives and source resolution which are discussed below. This report also summarizes the methods used to analyze and compare the inventories, the results of the analysis, and the implications for neighborhood-scale air quality modeling efforts.

2. Background 2.1 Toxics Release Inventory Program The Toxics Release Inventory Program history and data are available from the U.S. EPA through the following website: http://www.epa.gov/tri/triprogram/whatis.htm. The TRI Program originated under the Emergency Planning and Community Right-to-Know Act (EPCRA) enacted in 1986. As described by the U.S. EPA, “EPCRA's primary purpose is to inform communities and citizens of chemical hazards in their areas. Sections 311 and 312 of EPCRA require businesses to report the locations and quantities of chemicals stored on-site to state and local governments in order to help communities prepare to respond to chemical spills and similar emergencies. EPCRA Section 313 requires EPA and the States to annually collect data on releases and transfers of certain toxic chemicals from industrial facilities, and make the data available to the public in the Toxics Release Inventory (TRI).” The Pollution Prevention Act of 1990 required further reporting on waste management and source reduction activities under the TRI. TRI data for toxic pollutants as well as compounds distinctly classified as persistent, bioaccumulative, and toxic chemicals (PBT chemicals including dioxin and dioxin-like compounds, mercury and mercury compounds, lead, and polycyclic aromatic compounds that have long environmental lifetimes and accumulate in body tissue) are compiled annually and are readily accessible to the public from the U.S. EPA on-line database TRI Explorer: http://www.epa.gov/triexplorer/ . The annual reporting process and schedule is fully described at http://www.epa.gov/tri/triprogram/bussinesscycle/busprocess.html and summarized in Figure 1 for a single annual cycle as an example.
Step 1: Reporters submit 2008 TRI data by July 1, 2009.
Step 2: e‐FDR makes individual reports available to public. September 2009.
Step 3: Public data release provides national data and analytic tool. March 2010.
Figure 1. TRI annual reporting and release process for a single annual cycle (Source: U.S. EPA, http://www.epa.gov/tri/triprogram/bussinesscycle/busprocess.html). The acronym e-FDR refers to the U.S. EPA’s electronic facility data release tool that enables retrieval of TRI data.
4

5
The TRI data cycle is a three step process. Step 1 includes reporting of listed toxic chemicals (http://www.epa.gov/tri/trichemicals/index.htm) by facilities that meet reporting requirements. Reporting can be done electronically, and reports are submitted simultaneously to the U.S. EPA and the state or tribal entity in which the site is located. The U.S. EPA offers a tutorial to facilities to determine whether they meet the requirements for reporting http://www.epa.gov/tri/threshold/ThresholdDetermination.htm. Criteria that must be met include 10 or more full-time employee equivalents annually (20,000 total hours or greater per year); if the facility is a federal facility or if a facility has a primary North American Industry Classification Code (NAICS) that is included on the EPCRA Section 313 list of covered codes (http://www.epa.gov/tri/TWebHelp/WebHelp/trilib.htm#naics_codes.htm ); and whether the site manufactures, processes, or otherwise uses any EPCRA Section 313 chemical over its threshold quantity. The EPCRA threshold for Section 313 chemicals that are not listed as PBT chemicals and are manufactured or processed at a site is 25,000 pounds per toxic chemical or category over a calendar year. The threshold for any EPCRA chemical that is not listed as a PBT chemical and otherwise used at the facility is 10,000 pounds per toxic chemical or category over the calendar year. Details and reporting requirements for PBT chemicals can be found at http://www.epa.gov/tri/TWebHelp/WebHelp/trilib.htm#tri_forms_and_instructions6_new_b_4_threshold_determinations.htm . Step 2 in the TRI data cycle is early release of reporting data to the public which occurs after data entry and data quality assurance activities. The third and final step in the process is TRI data publication through online mechanisms such as TRI Explorer, reports and fact sheets. The TRI documents many forms of toxic releases including air emissions, stream discharges, underground injections, landfills, surface impoundment, recycling, and other disposal processes. This project is concerned primarily with air emissions, which are segregated as stack and fugitive emissions in the TRI database. Facilities are identified in the TRI by name, TRI facility ID, NAICS code, latitude and longitude, and facility-wide total stack and fugitive emissions are provided by chemical. The TRI database does not provide any greater source resolution than the facility-wide summaries and does not include detailed stack parameters in contrast to other inventories listed above. Although the lack of source resolution precludes or severely limits its use in air quality modeling efforts that necessitate a high degree of spatial resolution, the TRI nonetheless provides a temporally continuous source of reported emissions and is readily available to the public. It is, therefore, useful in assessing annual trends in both total facility air emissions and emissions of historically important individual air toxics, such as benzene and 1,3-butadiene, in the Corpus Christi area. 2.2 National Emissions Inventory The U.S. EPA provides documentation for the most recent, complete NEI for point sources for 2002 at the following link: http://www.epa.gov/ttn/chief/net/2002inventory.html#documentation. Key elements from this documentation are repeated here. As its title implies, the NEI is a national-scale inventory of criteria air pollutants (CAPs) and hazardous air pollutants (HAPs) that was developed to support the mandates of the 1990 Clean Air Act Amendments (CAAA). Application of the NEI is broad, including use in State Implementation Plan (SIP) development, compliance demonstrations, photochemical modeling studies for evaluation of air pollutant concentrations and for use in the National Air Toxics Assessment (NATA), and risk assessments. CAP emissions are collected under the Consolidated Emissions Reporting Rule (CERR; 40 CFR Part 51). For the 2002 NEI, the U.S. EPA requested that states, local agencies, and tribes submit emissions data in June 2004 for carbon monoxide (CO), condensable particulate matter (PM-

6
CON), filterable and primary particulate matter less than 2.5 microns (PM2.5-FIL and PM2.5-PRI), filterable and primary particulate matter less than 10 microns (PM10-FIL and PM10-PRI), nitrogen oxides (NOx), sulfur dioxide (SO2), volatile organic compounds (VOC), and lead (Pb). Larger sources are required to report annually, while smaller sources are required by the CERR to submit data on a three-year reporting cycle. Both types of data were included in the 2002 NEI. The NEI also contains data on HAP emissions. Major HAP sources are defined as stationary sources that have the potential to emit 10 tons per year or more of one HAP or have the potential to emit 25 tpy or more of any combination of HAPs. Some states, including Texas, submit data on both CAPs and HAPs for the NEI. Other states submit data only for CAPs. The TCEQ does not have a reporting threshold for inclusion in their NEI submittal; thus, all data that is reported through the STARS database is included in the State’s submittal to the NEI (Brochi, personal communication, 2008). According to Brenda Shine of the U.S. EPA (personal communication, 2008), who has worked on the development of emission estimates for petroleum refineries, NEI submittals from Texas undergo a quality assurance/quality control assessment. The U.S. EPA has a refinery process model that is used for comparison with reported emissions to identify any obvious problems. Any changes are made in collaboration with the sites. No additional speciation of the VOC emissions other than the reported speciation is made. Ms. Shine indicated that some additional speciation is done for metals, such as chromium, because of variability in the health risks of different forms. For purposes of this project, the TCEQ provided their submittal to the U.S. EPA for the 2002 NEI in order to allow us to compare it with the U.S. EPA’s final publicly released version (Paul Brochi, personal communication, 2008). Because a primary end use of the NEI is in air quality modeling efforts, the inventory has greater source resolution than the TRI. Among the data elements that are requested by the U.S. EPA are facility name and address, NAICS code, latitude and longitude, emission unit descriptions, emission process descriptions, source classification codes (SCC), actual throughputs, emission process activities, pollutant codes, emission estimates, stack parameters, and control equipment device types and efficiencies. Texas and other states have recently submitted data to the U.S. EPA for the 2005 NEI. State submittals are available at http://www.epa.gov/ttn/chief/net/2005inventory.html. Implementation plans for the 2008 NEI are available at http://www.epa.gov/ttn/chief/eiinformation.html. 2.3 TCEQ STARS Database and Photochemical Modeling Inventories Annual point source emissions are reported by facilities to the State of Texas using the STARS electronic reporting system. Reporting requirements, emission inventory structure and estimation, and data submission guidelines are described in detail at http://www.tceq.state.tx.us/implementation/air/industei/psei/psei.html, and key elements are repeated here. The TCEQ is authorized to collect emissions inventory data under the CERR (40 CFR Part 51), the 1990 CAAA, Title 30 of the Texas Administrative Code (TAC), Section 101.10, and the Texas Clean Air Act, Health and Safety Code 382.014. In accordance with 30 TAC §101.10, a source is required to submit inventory data if
1. the account meets the definition of a major facility/stationary source, as defined by §116.12 of Title 30, or is in an ozone nonattainment areas emitting a minimum of 10 tpy of VOCs, 25 tpy of NOx, or 100 tpy or more of any pollutant subject to the National Ambient Air Quality Standards (NAAQS).
2. the account emits or has the potential to emit 100 tpy or more of any contaminant.

7
3. the account emits or has the potential to emit 10 tons of any single or 25 tons of aggregate hazardous air pollutants as defined by the FCAA, §112(a)(1); and
4. any minor industrial source, area source, non-road mobile source, or mobile source of emissions subject to special inventories under subsection (b)(3).
Nueces and San Patricio Counties are classified as near-nonattainment/affected counties per the Texas Health and Safety Code 386.001. Special inventory requirements apply for both counties. Reporting thresholds (reference Table 1-3 in the above documentation) are 10 tpy (actual) and 100 tpy (potential) for VOCs; 25 tpy (actual) and 100 tpy (potential) for NOx; 100 tpy (actual) and 100 tpy (potential) of any other contaminant subject to NAAQS; 10 tpy (actual) and 10 tpy (potential) of any individual HAP, and 25 tpy (actual) and 25 tpy (potential) of aggregate HAPs. Every site is assigned with a unique identification number known as an air-regulated entity reference number (RN). The TCEQ defines a facility as a source capable of generating emissions and an emission point as the physical location where emissions enter the atmosphere. Each facility must have a unique alphanumeric code of 10 characters or less known as a facility identification number (FIN). Every facility must be associated with at least one emission point in the inventory. Emission points have been classified into three different types: stack, fugitive, and flare; each must have a unique alphanumeric code of 10 characters or less known as an emission point number (EPN). The path is the link between the origin of the pollutant to its entrance into the atmosphere at the emission point. The abatement or control device is a piece of equipment or procedure that limits emissions; each abatement device must have a unique alphanumeric code of 10 characters or less known as a control identification number (CIN). Sources can be represented individually or if they meet all of the following criteria may be grouped and represented as a collective source under a common FIN: the source emits less than 1 ton of pollutant; the source emits less than 0.1 ton of any toxic chemical or HAP; and the source is not required to be included in the inventory’s structure under a TCEQ enforceable document. FINs should be created for distinct process types and equipment. According to the reporting requirements, all actual emissions for each regulated pollutant must be reported in the emissions inventory including: any VOC, as defined in 30 TAC §101.1; any pollutant subject to the 1990 CAAA; any pollutant listed as a HAP under the 1990 CAAA; each pollutant for which a primary NAAQS has been promulgated; and any other air pollutant subject to requirements under TCEQ rules regulations, permits, orders of the commission, or court orders. The TCEQ has established an order of preference of emissions determination methodologies: (1) continuous emissions monitoring system (CEMS); (2) predictive emissions monitoring system (PEMS); (3) measured –stack test data; (4) vendor-supplied emissions factors; (5) AP-42 or other EPA-approved factors; (6) material balance; (7) scientifically calculated; (8) estimated; and (9) other. The process of identifying and quantifying the individual chemical species within a chemical category is known as speciation. For Nueces and San Patricio Counties, and other counties in Texas that are east of 100º longitude, VOCs from each source emitting at least 5 tpy annually must be speciated. Emissions must be speciated to at least 90 percent of the total VOC emissions reported for each facility. If any speciated contaminant was emitted at a level below 0.1 ton, it can be reported under VOC-unclassified. All HAPs should be speciated. A five-digit contaminant code is used to identify each individual species. Both annual and ozone season emissions (June 1 – August 31) must be reported for Nueces and San Patricio Counties, and other counties in Texas that are east of 100º longitude. The TCEQ provides extensive instructions and forms required for inventory documentation http://www.tceq.state.tx.us/assets/public/comm_exec/pubs/rg/rg360/rg36007/rg-360b.pdf . The

8
source resolutions of the TCEQ STARS database and the State of Texas submittal to the NEI are the same. According to the TCEQ (Paul Brochi, personal communication, 2008), data that are sent to the U.S. EPA for the NEI are the data that are loaded into STARS as a result of TCEQ’s quality assurance process. TCEQ resolves any issues with the companies during their quality assurance process and does not manipulate the data after this process. Data are then extracted and sent as the submittal to the U.S. EPA NEI. The State of Texas also generates point source emission inventories suitable for photochemical modeling using the STARS database. It is important to recognize that the TRI and NEI are generally static in nature, i.e., data are submitted that represent a specific time period of operations, they are processed and quality assured, and then become publicly accessible. In contrast, emission inventories used for photochemical modeling by the State of Texas undergo nearly continuous evolution to improve the robustness of the data. Versions are generally tracked by the TCEQ; but the inventories are more fluid in nature and extensive documentation may not accompany each version. The photochemical modeling inventories have the same level of source resolution as the U.S. EPA NEI and the State of Texas submittals to the NEI. However, TCEQ’s air quality modeling group does additional processing of the STARS data to account for rule effectiveness (RE) as well as to further speciate emissions that are otherwise reported as VOC with unspecified composition. Using a fully speciated inventory for the Houston-Galveston-Brazoria area has been critical for assessing the effectiveness of control strategies because of regulations that target highly reactive VOCs in the region. RE attempts to account for actual in-use control efficiency, which is less than the assumed maximum destruction efficiency in the reported emissions. RE factors for VOC emissions generally applied by the TCEQ at the SCC/SIC level according to geographic regions in Texas (Ron Thomas and Paul Brochi, personal communication, 2009). Table 1 presents a summary of the emissions data used as the basis for the 2005 TCEQ Photochemical Modeling Inventory. The shaded columns in Table 1 include VOC emissions before and after the application of RE factors by group and FIN, as well as the percent increase in emissions after the application of RE factors. It also includes the total number of records in the inventory by group and FIN and the number of records binned by the percentage change due to the application of RE factors. This information provides an indication of the type and number of sources in the region as well as how many are particularly impacted by RE. Appendix A presents a similar summary by SCC. It is evident from Table 1 that accounting for RE primarily affects VOC emissions from flares, equipment leak fugitives, external floating roof tanks, internal floating roof tanks, and, to a lesser extent, vertical fixed tanks. VOC emissions from these FINs are among the largest sources in Nueces and San Patricio Counties and account for almost 70% of the total VOC after RE emissions. As expected, most of these FINS are associated with the petroleum industry as shown in Appendix A. Overall VOC emissions increase from approximately 6600 tpy to 8500 tpy (28.6%) after accounting for RE in the two counties. TCEQ’s process for speciating point source VOC emissions continues to evolve as better industrial source identification and speciation data become available. In 2001, Pacific Environmental Services (PES) under contract to ENVIRON conducted the first study aimed at developing source-specific and SCC-specific VOC speciation profiles using data from the 1999 Texas Natural Resource Conservation Commission (TNRCC; now known as the TCEQ) Point Source Database (now known as STARS) from the Houston/Galveston area as well as data from other areas in Texas. Gabriel Cantu of the TCEQ developed a modified speciation method in 2003, which is currently used to develop inventories for emissions throughout Texas for TCEQ’s photochemical modeling activities. Both the PES study and Cantu’s method are described in

9
detail in the references provided in Appendix B. A report by Thomas et al., presented at the 17th Annual International Emission Inventory Conference in June 2008, that discusses the implications of using the fully speciated inventory in air quality modeling is also included in Appendix B. Briefly, Thomas et al. (2008) describe an 8-step speciation procedure:
1. Extract the STARS data 2. Remove non-VOC compounds based on the methodology of PES. 3. Replace mixtures such as crude oil, gasoline, naphtha, etc. with refined profiles
developed by PES. 4. Import EPA default SCC profiles after removal of non-VOC and non-reactive
compounds and renormalization of the dataset. Replace profiles composed of only one compound with more appropriate profile obtained from the U.S. EPA’s SPECIATE database, the California Air Resources Board (CARB), or the TCEQ itself.
5. Assign a profile to each point that had unspeciated VOC. 6. Compare the reported speciated emissions with the profile assigned to each point. Retain
the reported speciated emissions and remove the common species from the assigned profile for each point. Normalize the resulting profile for each point to create a unique speciation profile for each point that is then applied to each emission point’s unspeciated VOC.
7. Substitute the resulting speciation in place of unspeciated VOC in the reported emissions. 8. Create a point-specific profile for each path in STARS.
Both the 2000 TCEQ Photochemical Modeling EI and the 2005 TCEQ Photochemical Modeling EI contain emission point specific information and detailed chemical speciation developed using this approach. The inventory inter-comparison study described below in Section 5 will elucidate the differences between the reported emissions and the fully speciated modeling inventories.

Table 1. Summary of changes in VOC emissions due to rule effectiveness by Group and FIN for Nueces and San Patricio Counties.
Group
FIN
VOC (tpy)
VOC
after RE (tpy)
Increase
(%)
No. of
Records
Number of Records Binned by Percentage Change in Emissions Due to RE
0 0-45 45-90 90-105 105-185 185-200 >200 CLEANING BARGE 76.54 111.01 45.0 2 1 -- -- -- -- 1 -- CLEANING DIP DEGREASING 42.56 42.60 0.1 10 9 1 -- -- -- -- -- CLEANING OTHER 0.73 0.73 0.0 1 1 -- -- -- -- -- -- CLEANING OTHER CLEANING 0.41 0.41 0.0 2 2 -- -- -- -- -- --
CLEANING VAPOR
DEGREASIN 0.12 0.12 0.0 1 1 -- -- -- -- -- -- COATING/PRINTING COATING AND PRI 59.87 59.87 0.0 19 19 -- -- -- -- -- -- COAT/INGPRINTING OTHER 5.19 5.19 0.0 1 1 -- -- -- -- -- --
COMBUSTION BOILER 84.81 84.81 0.0 47 47 -- -- -- -- -- -- COMBUSTION BOILER-ELECTRIC 26.86 26.86 0.0 4 4 -- -- -- -- -- -- COMBUSTION FLARE 389.24 521.41 34.0 28 21 -- -- 6 -- 1 -- COMBUSTION FLUIDIZED CAT. 97.40 97.40 0.0 4 4 -- -- -- -- -- -- COMBUSTION FURNACE 58.52 58.52 0.0 22 22 -- -- -- -- -- -- COMBUSTION HEATER 243.80 243.80 0.0 174 174 -- -- -- -- -- -- COMBUSTION I.C. ENGINE 351.55 351.55 0.0 124 124 -- -- -- -- -- -- COMBUSTION INCINERATOR 8.60 8.60 0.0 16 15 -- -- 1 -- -- -- COMBUSTION KILN 4.71 4.71 0.0 3 3 -- -- -- -- -- --
COMBUSTION OTHER
COMBUSTION 3.66 3.66 0.0 10 10 -- -- -- -- -- --
COMBUSTION THERMAL OXIDIZE 0.87 0.87 0.0 2 2 -- -- -- -- -- --
COMBUSTION TURBINE 82.66 82.66 0.0 21 21 -- -- -- -- -- --
COMBUSTION TURBINE-ELECTRI 8.60 8.60 0.0 4 4 -- -- -- -- -- --
COOLING TOWER COOLING TOWER 146.29 148.03 1.2 46 45 -- 1 -- -- -- -- EQUIPLKFUG EQUIPMENT LEAK 2157.77 2315.79 7.3 249 190 51 2 5 -- 1 --
LOADING MARINE 334.99 363.41 8.5 24 21 -- -- 2 -- 1 -- LOADING OTHER LOADING 11.45 11.72 2.4 3 2 1 -- -- -- -- --
LOADING RAILCAR AND
TANKS 3.02 3.08 1.9 3 2 -- 1 -- -- -- -- LOADING TANK TRUCK 35.24 42.95 21.9 14 10 2 -- 1 -- 1 --
OTHER BOILER 0.06 0.06 0.0 1 1 -- -- -- -- -- -- OTHER OTHER 222.02 276.35 24.5 199 164 6 6 14 3 6 --
OTHER OTHER
COMBUSTION 0.29 0.29 0.0 2 2 -- -- -- -- -- -- TANKS EXT FL ROOF: DB 494.48 1063.99 115.2 119 -- 1 89 1 28 -- TANKS EXT FL ROOF: PO 26.20 73.54 180.7 10 -- -- 2 1 7 --

11
TANKS HORIZONTAL
FIXED 3.58 3.58 0.0 18 18 -- -- -- -- -- --
TANKS INTERNAL FLOATING 618.45 1361.94 120.2 275 1 -- 3 195 4 72 --
TANKS OTHER TANK 0.52 0.52 0.0 5 5 -- -- -- -- -- -- TANKS PRESSURE TANK 4.47 4.47 0.1 37 37 -- -- -- -- -- --
TANKS UNDERGROUND
TANK 1.10 1.10 0.0 10 10 -- -- -- -- -- -- TANKS VERTICAL FIXED 669.94 708.03 5.7 331 296 1 2 28 -- 3 1
VOC PROCESS BLOWDOWN
OPER 10.61 10.61 0.0 1 1 -- -- -- -- -- -- VOC PROCESS GLYCOL STILL 19.41 19.41 0.0 4 4 -- -- -- -- -- -- VOC PROCESS MIXING VESSEL 1.71 1.71 0.0 1 1 -- -- -- -- -- --
VOC PROCESS OTHER VOC
PROCESS 188.27 253.73 34.8 39 29 1 -- 5 -- 4 -- WASTEWATER BASIN 4.56 4.56 0.0 3 3 -- -- -- -- -- -- WASTEWATER CLARIFIER 0.12 0.12 0.0 2 2 -- -- -- -- -- -- WASTEWATER CLOSED SUMP 0.00 0.00 0.0 1 1 -- -- -- -- -- -- WASTEWATER LIFT STATION 3.40 3.40 0.0 3 3 -- -- -- -- -- -- WASTEWATER OPEN SUMP 0.57 0.57 0.0 4 4 -- -- -- -- -- --
WASTEWATER OTHER
WASTEWATER 31.96 31.96 0.0 10 10 -- -- -- -- -- -- WASTEWATER REACTOR 0.09 0.09 0.0 2 2 -- -- -- -- -- -- WASTEWATER SEPARATOR 5.18 9.99 92.9 6 3 -- -- 3 -- -- -- WASTEWATER STRIPPER 0.12 0.12 0.0 1 1 -- -- -- -- -- -- WASTEWATER WASTEWATER 65.41 70.50 7.8 22 19 -- -- 1 -- 2 --
Total 6608.00 8499.02 28.6 1940 1372 63 16 352 9 127 1

2.4 ACES Emission Inventory for the City of Corpus Christi ACES prepared a 2008 update for the City of Corpus Christi Emission Inventory, which was provided to UT by Ron Barnard, Environmental Programs Specialist for the City of Corpus Christi. In the accompanying report, ACES noted that the 2005 TCEQ Point Source Database (i.e., now known as the STARS database as described above) was used as the source of emissions for major point sources. The ACES inventory for major point sources was found to match the 2005 NEI submittal by the TCEQ.
13
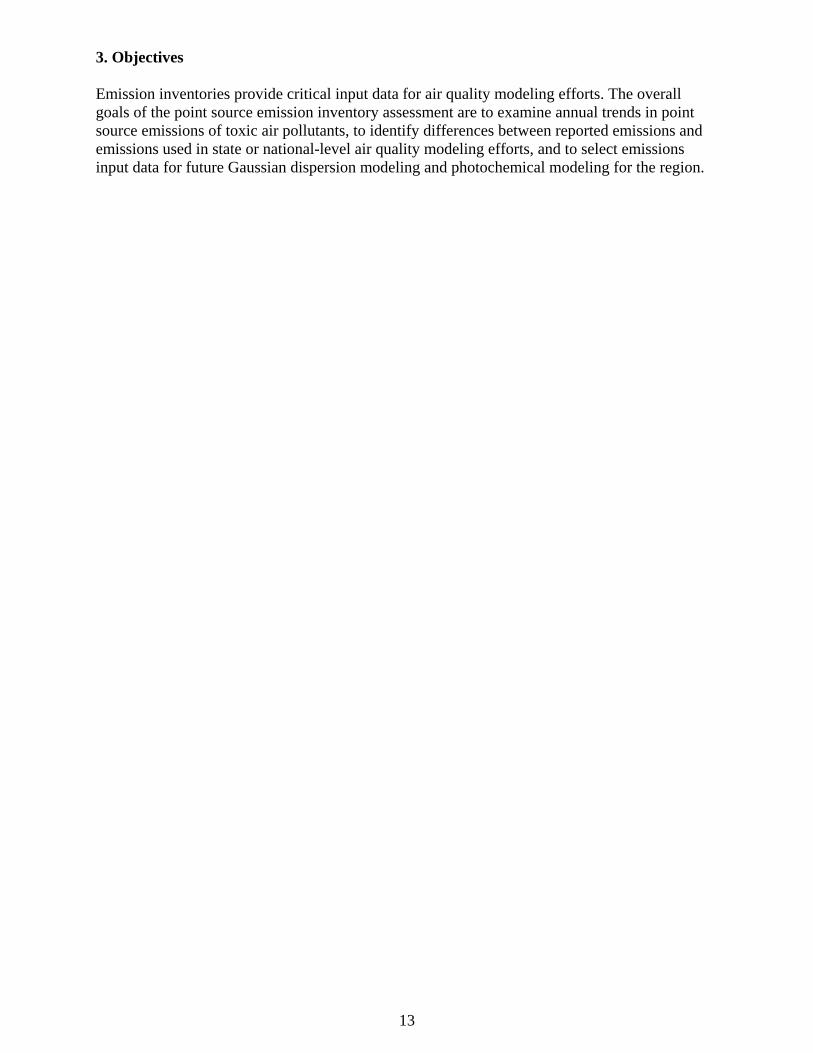
3. Objectives Emission inventories provide critical input data for air quality modeling efforts. The overall goals of the point source emission inventory assessment are to examine annual trends in point source emissions of toxic air pollutants, to identify differences between reported emissions and emissions used in state or national-level air quality modeling efforts, and to select emissions input data for future Gaussian dispersion modeling and photochemical modeling for the region.

14
4. Methodology The 2002-2006 TRI data were obtained directly from the EPA TRI program (http://www.epa.gov/tri/tridata/index.htm). Nueces and San Patricio counties data were filtered from the Texas state inventory. Total air emissions (stack and fugitive) were extracted and summed for each reporting source. This process was repeated for individual species of interest and available in the TRI data for the Corpus Christi area, including benzene, toluene, 1,3-butadiene, xylene, ethylbenzene, formaldehyde, tetrachloroethylene, trichloroethylene, and vinyl chloride. Emissions in the TRI are reported in units of lbs/yr, and were converted to units of short tons/yr for purposes of comparison with other inventories. The 2002 Corpus Christi HAP NEI data were obtained from the U.S. EPA NEI web site: (http://www.epa.gov/ttn/chief/net/2002inventory.html). The Texas submittal for the 2002 NEI was obtained from Paul Brochi and Ron Thomas of the TCEQ. The Texas submittal for the 2005 NEI was obtained from http://www.epa.gov/ttn/chief/net/2005inventory.html. Point source emissions for Nueces and San Patricio counties were extracted from the three inventories. Although facility addresses were included in the NEI datasets, owner names for many facilities were ambiguous. In contrast, the 2005 TCEQ Photochemical Modeling EI had detailed owner names, RNs - air-regulated entity reference numbers, and addresses. A list of RNs is provided at http://www4.tceq.state.tx.us/crpub/index.cfm?fuseaction=regent.RNSearch. In some cases in the 2005 Photochemical Modeling EI, owners reported different RNs, although, as described above, each is supposed to have a single unique RN. In these cases, the listed owner name by RN was used for purposes of identification. Owner names for the 2002 HAP NEI, 2002 NEI submittal, and 2005 NEI submittal were obtained using the 2005 Photochemical Modeling EI names and addresses as a reference. Emissions were summed by species for each facility in the 2002 HAP NEI and in the 2002 and 2005 Texas submittals to the NEI, and reported in units of tons/yr. The 2000 TCEQ Photochemical Modeling EI was originally provided to researchers participating in the Texas Air Quality Study 2000 on the TCEQ Web site in the form of SAS data sets. The pages linked to these data have since been removed from the TCEQ web site, but Dr. David Sullivan of the UT team obtained and archived the data at the time they were available. The 2000 files (one for speciated VOC and one for criteria + unspeciated VOC) were titled: afs_psdb_nonvoc_2000v15b.sas7bdat and afs_psdb_voc_2000v15b.sas7bdat, respectively. Although these data were not as current as the 2005 TCEQ Photochemical Modeling EI, they did provide a historical point of comparison. The 2005 TCEQ Photochemical Modeling EI was obtained by Dr. Sullivan upon request to TCEQ. These files (one for speciated VOC and one for criteria + unspeciated VOC) were titled: afs_voc_spec_re_2005_v4a.sas7bdat and afs_all_agg_re_2005_v4a.sas7bdat, respectively. Speciated, rule effective point source emissions for Neuces and San Patricio Counties were extracted from both the 2000 TCEQ Photochemical Modeling EI and the 2005 TCEQ Photochemical Modeling EI. Emissions were reported in tons/d and were converted to tons/yr using the reported number of hours of operation. Emissions were summed by species by owner name for the 2000 TCEQ Photochemical Modeling EI because RNs were not included in the data. Owner names from the 2000 TCEQ Photochemical Modeling EI were then matched with those from the 2005 Photochemical Modeling EI when possible. Emissions were summed by species and RN for the 2005 Modeling EI. It is important to note that while most major sites appear in all of the inventories, there are also a number of smaller sources that do not. This may be due to differences in reporting requirements or thresholds between the inventory programs or for other as yet unidentified reasons. Also, because facilities could not be matched by RN for the 2000 TCEQ Photochemical Modeling EI, there are cases where emissions in this inventory were reported broadly by owner (e.g. Valero Refining Company), but could not be attributed to a specific facility (e.g., East Plant, West

15
Plant). Nonetheless, the 2000 TCEQ Photochemical Modeling EI was useful for comparison purposes. We note also that in addition to differences in source resolution between the inventories, there are also differences between the number and type of species included in each. While many air toxics of interest such as benzene and 1,3-butadiene appear in all of the inventories, the photochemical modeling inventories have the most comprehensive level of VOC speciation relative to the other inventories. Finally, we note that caution should be used when summing emissions by species name. Small differences such as the presence of spaces or hyphens in names such as 1, 3-butadiene can cause these emissions to be sorted and summed as separate types. This is resolved by careful quality assurance during data processing.

16
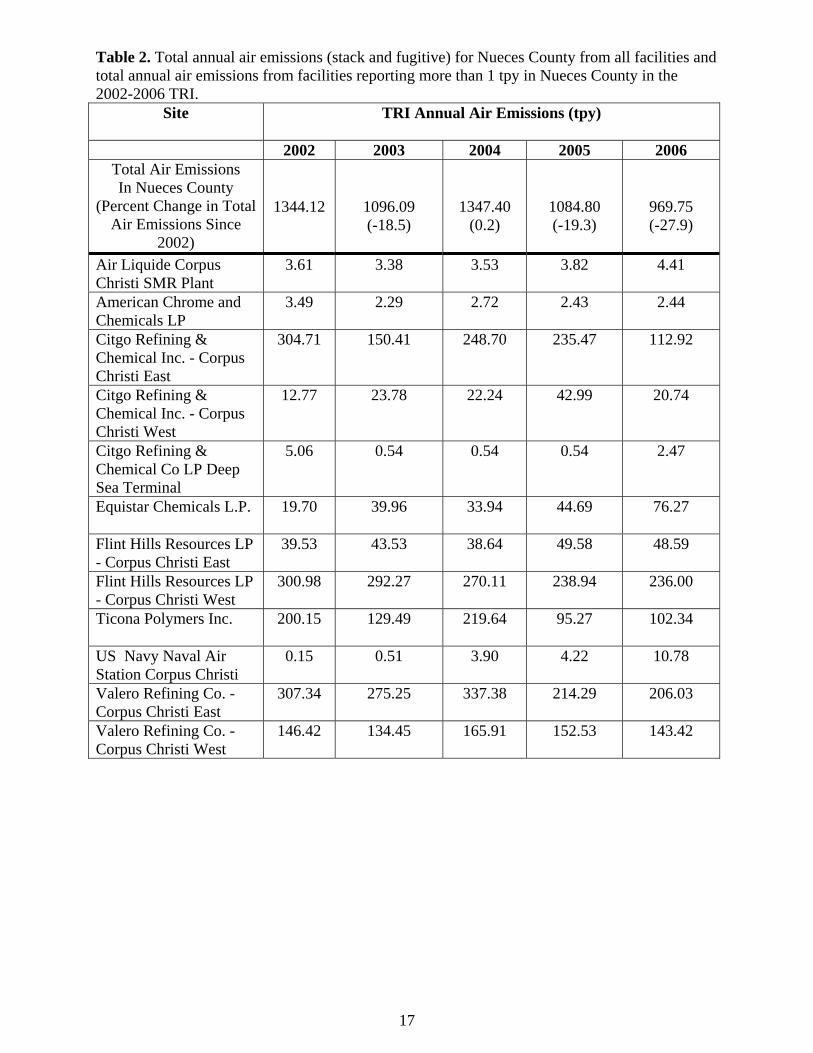
5. Results 5.1 Annual Trends in Total Reported Air Toxics Emissions from the TRI Database Although the TRI databases only provide facility-wide summaries of emissions of air toxics, they are useful for assessing annual trends in reported emissions. Total air emissions, which are the sum of all stack and fugitive emissions for reported species, for Nueces and San Patricio Counties and for facilities reporting more than 1 tpy of total air emissions in the TRI are presented in Tables 2 and 3. Other sources included in at least one of the annual TRI datasets, but reporting less than 1 tpy of total air emissions in Nueces County include AirGas-Southwest, Inc., American Electric Power Barney M. Davis, Celanese Ltd. Corpus Christi Technical Center, Champion Technologies, Inc., CMC Steel Fabricators Inc., Encycle Texas Inc., Excalibur Minerals, Inc., Hanson Pipe and Productive Inc. Robstown, International Resistive Co., Ohmstede Ltd., U.S. Ecology Texas, L.P., Valley Solvents & Chemicals, John Bludworth Shipyard LLC, Martin Operating PTNR LP (Corpus Barge Terminal), Midstream Fuel Service LLC (Harbor Island), Univar USA, and Trigeant LTD. Another source in San Patricio County reporting less than 1 tpy of total air emissions in San Patricio County includes the Sherwin Plant. Overall, reported air emissions in Nueces County over the past five years have ranged from approximately 970 to 1345 tpy, and have generally decreased over time. Reported air emissions in San Patricio County have ranged from 35 to 57 tpy with a recent increase in 2006 due to Occidental Chemical Corporation. The largest air emission sources in Nueces County are the Citgo East, Flint Hills West, Ticona Polymers, Valero East, and Valero West Plants. Occidental Chemical Corporation and Dupont are the two largest sources in San Patricio County. The variability in reported annual emissions can be more than a factor of two, and was most notable for Citgo East, Citgo West, Citgo Deep Sea Terminal, Ticona Polymers, Equistar, and Occidental Chemical Corporation. The three Citgo facilities did not show a consistent trend of increasing or decreasing emissions over time, although emissions for Citgo East and Citgo West decreased markedly in 2006 relative to the previous year. Total air emissions from Flint Hills West have continually decreased since 2002. There is some indication that emissions from Valero East are also decreasing. Reported emissions from Equistar and U.S. Navy Naval Air Station are generally increasing over time. Reported emissions from these two facilities as well as from Occidental Chemical nearly doubled between 2005 and 2006. Over time, new sources appeared in the more recent inventories such as Midstream Fuel Service and John Bludsworth Shipyard. Celanese did not report after 2002; TCEQ indicated that Celanese became part of Ticona Polymers Bishop Facility (Brochi, personal communication, 2008). Champion did not report in 2005, but did so in other TRI's between 2002 and 2006. Emissions from these facilities were less than 1 tpy.
17
Table 2. Total annual air emissions (stack and fugitive) for Nueces County from all facilities and total annual air emissions from facilities reporting more than 1 tpy in Nueces County in the 2002-2006 TRI.
Site TRI Annual Air Emissions (tpy)
2002 2003 2004 2005 2006 Total Air Emissions In Nueces County
(Percent Change in Total Air Emissions Since
2002)
1344.12
1096.09 (-18.5)
1347.40 (0.2)
1084.80 (-19.3)
969.75 (-27.9)
Air Liquide Corpus Christi SMR Plant
3.61 3.38 3.53 3.82 4.41
American Chrome and Chemicals LP
3.49 2.29 2.72 2.43 2.44
Citgo Refining & Chemical Inc. - Corpus Christi East
304.71 150.41 248.70 235.47 112.92
Citgo Refining & Chemical Inc. - Corpus Christi West
12.77 23.78 22.24 42.99 20.74
Citgo Refining & Chemical Co LP Deep Sea Terminal
5.06 0.54 0.54 0.54 2.47
Equistar Chemicals L.P.
19.70 39.96 33.94 44.69 76.27
Flint Hills Resources LP - Corpus Christi East
39.53 43.53 38.64 49.58 48.59
Flint Hills Resources LP - Corpus Christi West
300.98 292.27 270.11 238.94 236.00
Ticona Polymers Inc.
200.15 129.49 219.64 95.27 102.34
US Navy Naval Air Station Corpus Christi
0.15 0.51 3.90 4.22 10.78
Valero Refining Co. - Corpus Christi East
307.34 275.25 337.38 214.29 206.03
Valero Refining Co. - Corpus Christi West
146.42 134.45 165.91 152.53 143.42

18
Table 3. Total annual air emissions (stack and fugitive) for San Patricio County from all facilities and total annual air emissions from facilities reporting more than 1 tpy in San Patricio County in the 2002-2006 TRI.
Site TRI Annual Air Emissions (tpy)
2002 2003 2004 2005 2006 Total Air Emissions
In San Patricio County (Percent Change in Total Air Emissions
Since 2002)
45.58
48.28 (5.9)
42.08 (-7.7)
35.33 (-22.5)
56.71 (24.4)
Occidental Chemical Corp
13.56 18.22 10.60 11.82 27.94
DuPont Corpus Christi Plant
32.00 29.71 31.09 23.50 22.32
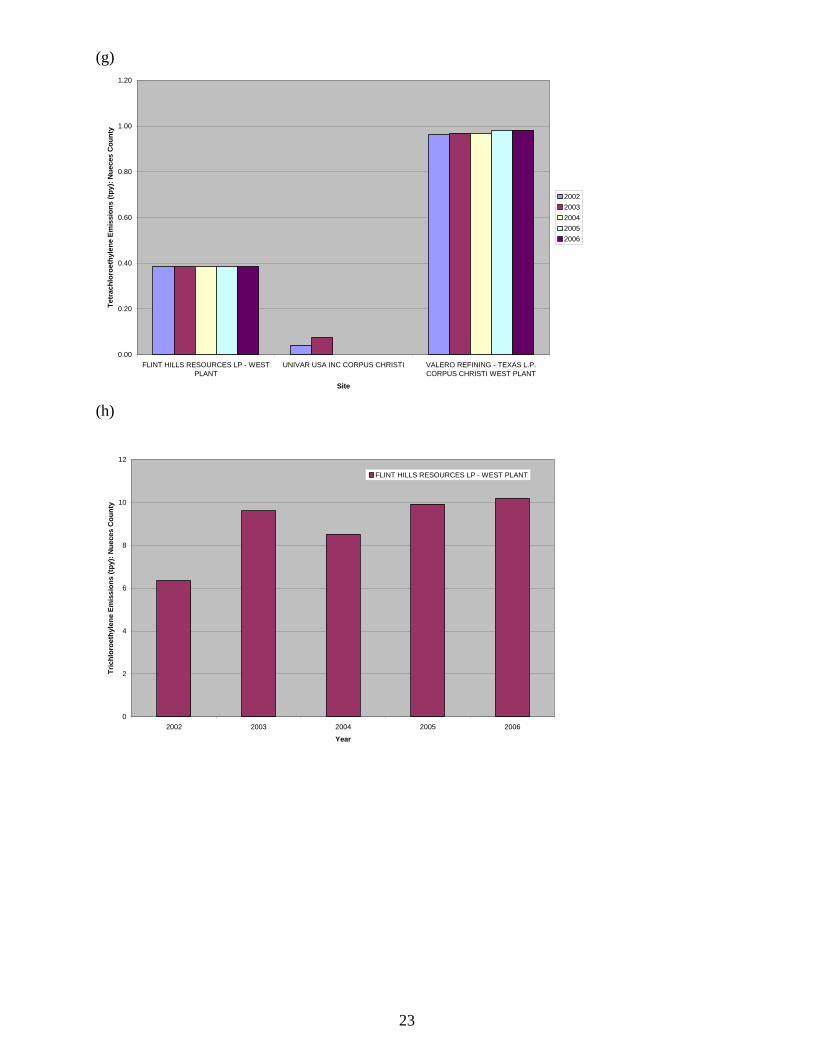
5.2 Annual Trends in Reported Emissions of Individual Air Toxics from the TRI Database In addition to trends in total annual air emissions from the TRI databases, annual emissions of benzene, toluene, ethylbenzene, xylene, 1,3-butadiene, formaldehyde, tetrachloroethylene, trichloroethylene, and vinyl chloride were also examined. Total annual emissions of these species in Nueces and San Patricio Counties are shown in Table 4 and Table 5, respectively. Total annual air emissions of these species by facility are shown in Figure 2 for Nueces County and Figure 3 for San Patricio County. Note that not all species appear in the inventories for both counties. For example, no facilities in San Patricio County reported emissions of benzene. Reported emissions of most species, with the exception of 1,3-butadiene and trichloroethylene have generally decreased over time in Nueces County. According to the TRI databases, annual emissions of benzene, toluene, ethylbenzene, and xylene (BTEX) species primarily originate from three sources in Nueces County: the Citgo East Plant, Flint Hills West Plant, and Valero East Plant. At all three sites, reported emissions of benzene and xylene have generally decreased since 2004, with the lowest emission levels reported in 2006. Annual emissions of ethylbenzene show a similar trend with the exception of emissions from the Valero East Plant, which have remained relatively constant at approximately 5 tpy since 2003. Emissions of toluene decreased in 2005 and 2006 at the Citgo East and Valero East Plants. However, toluene emissions at Flint Hills increased in 2006 (35 tpy) relative to previous years (28 to 30 tpy). Equistar is the largest source of 1,3-butadiene emissions in the TRI databases. Reported emissions have increased by approximately a factor of ten between 2002 and 2006 (1.2 tpy to 13 tpy). No sites reported emissions of acrolein to the TRI Program. A single site in Nueces County, Ticona Polymers, reported emissions of formaldehyde ranging from 37 tpy in 2004 to 15 tpy in 2006. Emissions of chlorinated hydrocarbons, including tetrachloroethylene, trichloroethyelene, and vinyl chloride, were also investigated. No facilities in Nueces County reported emissions of vinyl chloride. Two facilities in San Patricio County, DuPont and Occidental Chemical, reported emissions of vinyl chloride. Vinyl chloride emissions at Dupont have remained relatively constant between 2002 and 2006 at approximately 0.5 tpy. Emissions at Occidental Chemical have ranged from 0.5 to 1.5 tpy in earlier years to 2.4 tpy in 2006. Emissions of

19
tetrachloroethylene at sites in both San Patricio and Nueces Counties have remained relatively constant at around 1.5 tpy between 2002 and 2006. Univar reported emissions of tetrachloroethylene in 2002 and 2003, but not afterwards. A single site, Flint Hills West, reported emissions of trichloroethylene, which were relatively constant at 8-10 tpy between 2003-2006. The FHR Ingleside marine terminal reported emissions of trichloroethylene in 2002 and 2003 but not afterwards. It is recommended that reported emissions to the TRI be continually tracked as they become available from the U.S. EPA. Long term trends should be examined to identify significant changes in emissions. The variability in reported emissions should be considered in air quality modeling efforts. Table 4. Annual emissions (stack and fugitive) of 1,3-butadience, benzene, xylene, ethylbenzene, toluene, formaldehyde, tetrachloroethylene, and trichloroethylene in Nueces Country in the 2002-2006 TRI. No sites reported emissions of vinyl chloride in Nueces County.
Species
TRI Annual Air Emissions in Tons per Year
(Percent Change in Annual Emissions Since 2002)
2002 2003 2004 2005 2006 1,3-Butadiene
1.41
2.92 (106.8)
5.41 (282.8)
5.64 (298.9)
13.49 (854.4)
Benzene
108.95
123.76 (13.6)
120.43 (10.5)
104.92 (-3.7)
84.36 (-22.6)
Ethylbenzene
24.18
21.21 (-12.3)
21.33 (-11.8)
19.25 (-20.4)
16.36 (-32.3)
Xylene
119.35
104.14 (-12.7)
101.49 (-15.0)
96.73 (-19.0)
86.80 (-27.3)
Toluene
114.85
96.27 (-16.2)
116.56 (1.5)
100.23 (-12.7)
99.53 (-13.3)
Formaldehyde
28.59
20.17 (-29.5)
37.47 (31.1)
17.47 (-38.9)
14.70 (-48.6)
Tetrachloroethylene
1.39
1.43 (3.0)
1.36 (-2.3)
1.37 (-1.4)
1.37 (-1.5)
Trichloroethylene
6.35
9.60 (51.3)
8.52 (34.2)
9.92 (56.2)
10.19 (60.5)
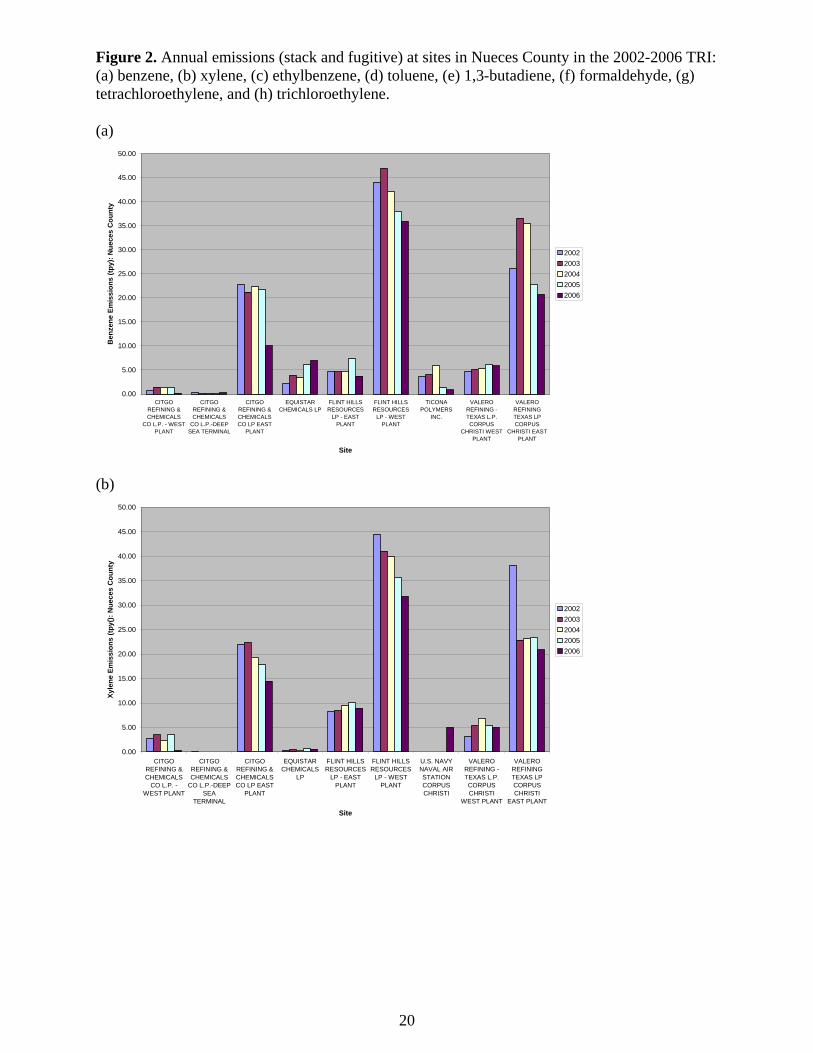
Figure 2. Annual emissions (stack and fugitive) at sites in Nueces County in the 2002-2006 TRI: (a) benzene, (b) xylene, (c) ethylbenzene, (d) toluene, (e) 1,3-butadiene, (f) formaldehyde, (g) tetrachloroethylene, and (h) trichloroethylene. (a)
0.00
5.00
10.00
15.00
20.00
25.00
30.00
35.00
40.00
45.00
50.00
CITGOREFINING &CHEMICALS
CO L.P. - WESTPLANT
CITGOREFINING &CHEMICALS
CO L.P.-DEEPSEA TERMINAL
CITGOREFINING &CHEMICALSCO LP EAST
PLANT
EQUISTARCHEMICALS LP
FLINT HILLSRESOURCES
LP - EASTPLANT
FLINT HILLSRESOURCES
LP - WESTPLANT
TICONAPOLYMERS
INC.
VALEROREFINING -TEXAS L.P.CORPUS
CHRISTI WESTPLANT
VALEROREFININGTEXAS LPCORPUS
CHRISTI EASTPLANT
Site
Ben
zene
Em
issi
ons
(tpy)
: Nue
ces
Cou
nty
20022003200420052006
(b)
0.00
5.00
10.00
15.00
20.00
25.00
30.00
35.00
40.00
45.00
50.00
CITGOREFINING &CHEMICALS
CO L.P. -WEST PLANT
CITGOREFINING &CHEMICALS
CO L.P.-DEEPSEA
TERMINAL
CITGOREFINING &CHEMICALSCO LP EAST
PLANT
EQUISTARCHEMICALS
LP
FLINT HILLSRESOURCES
LP - EASTPLANT
FLINT HILLSRESOURCES
LP - WESTPLANT
U.S. NAVYNAVAL AIRSTATIONCORPUSCHRISTI
VALEROREFINING -TEXAS L.P.CORPUSCHRISTI
WEST PLANT
VALEROREFININGTEXAS LPCORPUSCHRISTI
EAST PLANT
Site
Xyle
ne E
mis
sion
s (tp
y():
Nue
ces
Cou
nty
20022003200420052006
20

(c)
0.00
2.00
4.00
6.00
8.00
10.00
12.00
CITGO REFINING& CHEMICALS
CO L.P. - WESTPLANT
CITGO REFINING& CHEMICALSCO L.P.-DEEP
SEA TERMINAL
CITGO REFINING& CHEMICALSCO LP EAST
PLANT
EQUISTARCHEMICALS LP
FLINT HILLSRESOURCES LP -
EAST PLANT
FLINT HILLSRESOURCES LP -
WEST PLANT
VALEROREFINING -TEXAS L.P.CORPUS
CHRISTI WESTPLANT
VALEROREFINING TEXAS
LP CORPUSCHRISTI EAST
PLANT
Site
Ethy
lben
zene
Em
issi
ons
(tpy)
: Nue
ces
Cou
nty
20022003200420052006
(d)
0.00
10.00
20.00
30.00
40.00
50.00
60.00
CITGOREFINING &CHEMICALS
CO L.P. - WESTPLANT
CITGOREFINING &CHEMICALS
CO L.P.-DEEPSEA TERMINAL
CITGOREFINING &CHEMICALSCO LP EAST
PLANT
EQUISTARCHEMICALS LP
FLINT HILLSRESOURCES
LP - EASTPLANT
FLINT HILLSRESOURCES
LP - WESTPLANT
U.S. NAVYNAVAL AIRSTATIONCORPUSCHRISTI
VALEROREFINING -TEXAS L.P.CORPUS
CHRISTI WESTPLANT
VALEROREFININGTEXAS LPCORPUS
CHRISTI EASTPLANT
Site
Tolu
ene
Emis
sion
s (tp
y): N
uece
s C
ount
y
20022003200420052006
21

(e)
0.00
2.00
4.00
6.00
8.00
10.00
12.00
14.00
CITGO REFINING &CHEMICALS CO L.P.
- WEST PLANT
CITGO REFINING &CHEMICALS CO LP
EAST PLANT
EQUISTARCHEMICALS LP
FLINT HILLSRESOURCES LP -
EAST PLANT
FLINT HILLSRESOURCES LP -
WEST PLANT
VALERO REFINING -TEXAS L.P.
CORPUS CHRISTIWEST PLANT
VALERO REFININGTEXAS LP CORPUS
CHRISTI EASTPLANT
Site
1,3-
But
adie
ne E
mis
sion
s (tp
y): N
uece
s C
ount
y
20022003200420052006
(f)
0
5
10
15
20
25
30
35
40
2002 2003 2004 2005 2006
Year
Form
alde
hyde
Em
issi
ons
(tpy)
: Nue
ces
Cou
nty
TICONA POLYMERS INC.
22
(g)
0.00
0.20
0.40
0.60
0.80
1.00
1.20
FLINT HILLS RESOURCES LP - WESTPLANT
UNIVAR USA INC CORPUS CHRISTI VALERO REFINING - TEXAS L.P.CORPUS CHRISTI WEST PLANT
Site
Tetr
achl
oroe
thyl
ene
Emis
sion
s (tp
y): N
uece
s C
ount
y
20022003200420052006
(h)
0
2
4
6
8
10
12
2002 2003 2004 2005 2006
Year
Tric
hlor
oeth
ylen
e Em
issi
ons
(tpy)
: Nue
ces
Cou
nty
FLINT HILLS RESOURCES LP - WEST PLANT
23

24
Table 5. Annual emissions of vinyl chloride, tetrachloroethylene, and trichloroethylene in San Patricio Country in the 2002-2006 TRI. No sites reported emissions of benzene, tolune, xylenes, ethylbenzene, 1,3-butadiene, or formaldehyde in San Patricio County.
Species
TRI Annual Air Emissions in Tons per Year
(Percent Change in Annual Emissions Since 2002)
2002 2003 2004 2005 2006 Tetrachloroethylene
1.45 1.46 (0.2)
1.44 (-0.8)
1.01 (-30.6)
1.14 (-21.4)
Vinyl Chloride 2.08
1.84 (-11.5)
1.07 (-48.6)
0.97 (-53.3)
2.94 (40.9)
Trichloroethylene 0.68
0.05 (-92.4)
0.00 (-100.0)
0.00 (-100.0)
0.00 (-100.0)

Figure 3. Annual emissions (stack and fugitive) at sites in San Patricio County in the 2002-2006 TRI: (a) tetrachloroethylene and (b) vinyl chloride. (a)
0.00
0.20
0.40
0.60
0.80
1.00
1.20
1.40
1.60
DUPONT CORPUS CHRISTI PLANT OCCIDENTAL CHEMICAL CORPSite
Tetr
achl
oroe
thyl
ene
Emis
sion
s (tp
y): S
an P
atric
io C
ount
y
20022003200420052006
(b)
0
0.5
1
1.5
2
2.5
3
DUPONT CORPUS CHRISTI PLANT OCCIDENTAL CHEMICAL CORP
Site
Viny
l Chl
orid
e (tp
y): S
an P
atric
io C
ount
y
20022003200420052006
25

26
5.3 Inventory Inter-comparison: Differences in the Magnitude of Emissions of Individual Air Toxics The ACES 2008 update of the City of Corpus Christi Emission Inventory matched the 2005 NEI submittal and, therefore, is not presented separately. Because of the wide use and overall importance of the NEIs for air quality, exposure, and risk assessments, comparisons between the 2002 NEI submittal and the 2002 HAP NEI are discussed briefly here and in more detail in Appendix C. Although the 2002 HAP NEI is expected to soon be replaced by the 2005 HAP NEI, comparison of the 2002 NEI submittal by the TCEQ with the 2002 HAP NEI facilitated insights into the process used to create the NEIs. Consistent with the U.S. EPA’s assertion that the Texas submittals undergo a quality assurance review but no additional processing, the magnitudes of emissions between the 2002 NEI submittal and the 2002 HAP NEI were identical for most facilities with several notable exceptions. The most significant differences between the two inventories arose for the Flint Hills Resources West Plant. In this case, two state facility identification (SFID) codes were present in the 2002 HAP NEI, but only one of these was present in the 2002 NEI submittal. Although total emissions for the two SFIDs were very similar, their geographic locations were not. Our hypothesis is that during the quality assurance phase, an additional SFID was created for the 2002 HAP NEI to correct the erroneous location for Flint Hills in the 2002 NEI submittal and emissions were slightly modified to match the TRI, but the old records were not removed. It appeared that this resulted in a double counting of emissions for the Flint Hills West Plant in the 2002 HAP NEI. This same type of modification occurred for other facilities, as shown in Table 11, although the magnitudes of the impacts were far less significant than for the Flint Hills West Plant. Emissions of 1,3-butadiene were not included for the Citgo West and Valero East Plants in the 2002 NEI submittal, but were added under different SFIDs in the 2002 HAP NEI presumably to match the 2002 TRI. Similarly, emissions for tetrachloroethylene were not included for Univar USA and Occidental Chemical Corporation in the 2002 NEI submittal but were added under a new SFID in the 2002 HAP NEI. The other notable differences between the 2002 NEI submittal and the 2002 HAP NEI were the geo-coordinates (i.e., latitude and longitude) of the emission release points. For the same SFIDs, the 2002 submittal included many more coordinates (1673) than the 2002 HAP NEI (355) across all pollutants. Only 104 coordinates could be matched between the inventories for the same SFIDs. The total emissions for the facilities, with the exception of those described above, were largely identical, but it appeared that geo-coordinates for many release points were combined for the 2002 HAP NEI. There were no obvious relationships that could be used to explain the method for reduction in release points. Differences in the spatial allocation of emissions between the 2002 HAP NEI and the more recent 2005 NEI submittal and 2005 TCEQ Photochemical Modeling EI are explored in Section 5.4. Tables 6 and 7 present point source emissions by pollutant for nine of the inventories under consideration for Nueces and San Patricio Counties (i.e., all inventories except the ACES 2008 update of the City of Corpus Christi Emission Inventory and the 2002 NEI submittal discussed above). Tables 8 through 15 present summaries of emissions by site, county, and pollutant for the nine inventories. Emission summaries are included for eight species: benzene, xylene, ethylbenzene, toluene, 1,3-butadiene, acrolein, formaldehyde, and vinyl chloride. These species were selected as key air toxics of interest given the nature of the industrial operations in the Corpus Christi area and their health risks, but they are not intended to represent the hundreds of species that may be included in, for example, the TCEQ Photochemical Modeling Inventories. Thus, conclusions about differences between the inventories should be viewed in this context.
27
In some cases, which are evident in the tables, unambiguous site identification for the 2000 Photochemical Modeling EI could not be made. As an example, benzene emissions are attributed to the Valero East Plant, the Valero West Plant, and Valero Refining Corporation in the 2000 Photochemical Modeling EI. However, benzene emissions in all other inventories are attributed to either the Valero East or Valero West Plants. Because of these and other differences in how emissions are reported or changes in processes and ownership that may occur over time, the focus of the analysis presented here will be on the relative differences in the overall magnitude of emissions between the inventories and the relative contributions of specific sites rather than resolving differences at the level of emission points. Overall the most pronounced differences can be observed between the TCEQ Photochemical Modeling Inventories and the other inventories. This result was not unexpected given that the Photochemical Modeling Inventories include rule effectiveness and full chemical speciation, whereas the other inventories are based on reported emissions. The differences are more striking for some species than others. Benzene emissions in Nueces County in the 2002-2006 TRI databases and the 2005 NEI submittal range from approximately 85 to 120 tpy, whereas emissions for the 2002 HAP NEI are 166 tpy, and point source emissions from the 2000 and 2005 Photochemical Modeling Inventories are 250 to 260 tpy. Differences in point source emissions of formaldehyde are even more substantial with emissions reported to the TRI databases ranging from 15 to 30 tpy versus emissions of 250 to 415 tpy in the 2005 TCEQ Photochemical Modeling Inventories. Toluene emissions from point sources in the 2005 TCEQ Photochemical Modeling Inventory (225 tpy) were approximately a factor of two higher than in the other inventories for Nueces County. Vinyl chloride emissions from point sources in the 2005 NEI submittal and the 2005 TCEQ Photochemical Modeling EI (approximately 10 tpy) for San Patricio County were three to ten times higher than emissions reported in the other inventories even the more recent 2006 TRI inventory. Point source emissions of xylene and ethylbenzene show relatively better agreement between inventories. Acrolein emissions from point sources are small for the region. Although emissions of 1,3-butadiene show fairly good agreement; emissions increased dramatically in the 2006 TRI relative to the other inventories reflecting the reported increase at Equistar. Although there are substantial differences in the magnitude of emissions between the inventories, the relative magnitude of emissions from the sites is reasonably consistent for most species. For example, regardless of the inventory, the most significant sources of benzene, toluene, xylene, and ethylbezene are Flint Hills West, Citgo East, and Valero East. Occidental Chemical Corporation is the primary source of vinyl chloride in the inventories. Formaldehyde emissions are the notable exception. Ticona Polymers is the sole source of formaldehyde in the TRI, but numerous sources are included in the other inventories. Discrepancies in the emission inventories have potentially important consequences for assessing community health risks. Air quality, human exposure and health risk assessments have conventionally relied on modeled predictions of air toxics concentrations and, to a much more limited extent because of constraints on available resources, on ambient measurements. Differences in the emissions used as input for air quality modeling can lead to substantial differences in the magnitude and geographic location of model predictions of high air toxics concentrations. A key recommendation is that studies be conducted to evaluate the accuracy of the inventories against ambient data from the Corpus Christi network.

Table 6. Total annual emissions of selected air toxics in Nueces County in nine inventories included in the study.
Species 2000 TCEQ Photochemical Modeling EI
(tpy)
2002 HAP NEI (tpy)
2005 TCEQ PhotochemicalModeling EI
(tpy)
2005 NEI Submittal
(tpy)
TRI
(tpy) 2002 2003 2004 2005 2006 Benzene 248.23 166.78 259.29 93.52 108.95 123.76 120.43 104.92 84.36 Xylene 89.02 113.22 77.19 76.35 119.35 104.14 101.49 96.73 86.80 Ethylbenzene 18.82 30.92 25.28 17.27 24.18 21.21 21.33 19.25 16.36 Toluene 139.17 114.64 225.06 99.82 114.85 96.27 116.56 100.23 99.53 1,3-Butadiene 0.00 0.99 6.99 4.89 1.41 2.92 5.41 5.64 13.49 Acrolein 5.10 1.43 3.66 1.33 0.00 0.00 0.00 0.00 0.00 Formaldehyde 414.78 80.59 242.54 44.36 28.59 20.17 37.47 17.47 14.70 Vinyl Chloride 9.31 0.00 3.69 0.00 0.00 0.00 0.00 0.00 0.00 Tetrachloroethylene 0.00 0.44 0.00 0.04 1.39 1.43 1.36 1.37 1.37 Trichloroethylene 0.40 13.94 0.61 11.02 6.35 9.60 8.52 9.92 10.19

Table 7. Total annual emissions of selected air toxics in San Patricio County in nine inventories included in the study.
Species 2000 TCEQ
Photochemical Modeling EI
(tpy)
2002 HAP NEI (tpy)
2005 TCEQ PhotochemicalModeling EI
(tpy)
2005 NEI Submittal
(tpy)
TRI
(tpy) 2002 2003 2004 2005 2006 Benzene 30.31 2.08 5.76 1.28 0.00 0.00 0.00 0.00 0.00 Xylene 0.83 2.23 2.07 2.56 0.00 0.00 0.00 0.00 0.00 Ethylbenzene 0.40 0.88 0.89 0.79 0.00 0.00 0.00 0.00 0.00 Toluene 9.67 4.14 5.31 3.49 0.00 0.00 0.00 0.00 0.00 1,3-Butadiene 0.00 0.01 0.10 0.00 0.00 0.00 0.00 0.00 0.00 Acrolein 0.02 0.10 0.36 0.21 0.00 0.00 0.00 0.00 0.00 Formaldehyde 42.28 7.89 20.89 12.06 0.00 0.00 0.00 0.00 0.00 Vinyl Chloride 2.33 1.93 10.17 10.18 2.08 1.84 1.07 0.97 2.94 Tetrachloroethylene 0.00 1.45 0.00 1.66 1.45 1.46 1.44 1.01 1.14 Trichloroethylene 0.00 0.68 0.15 3.79 0.68 0.05 0.00 0.00 0.00
29
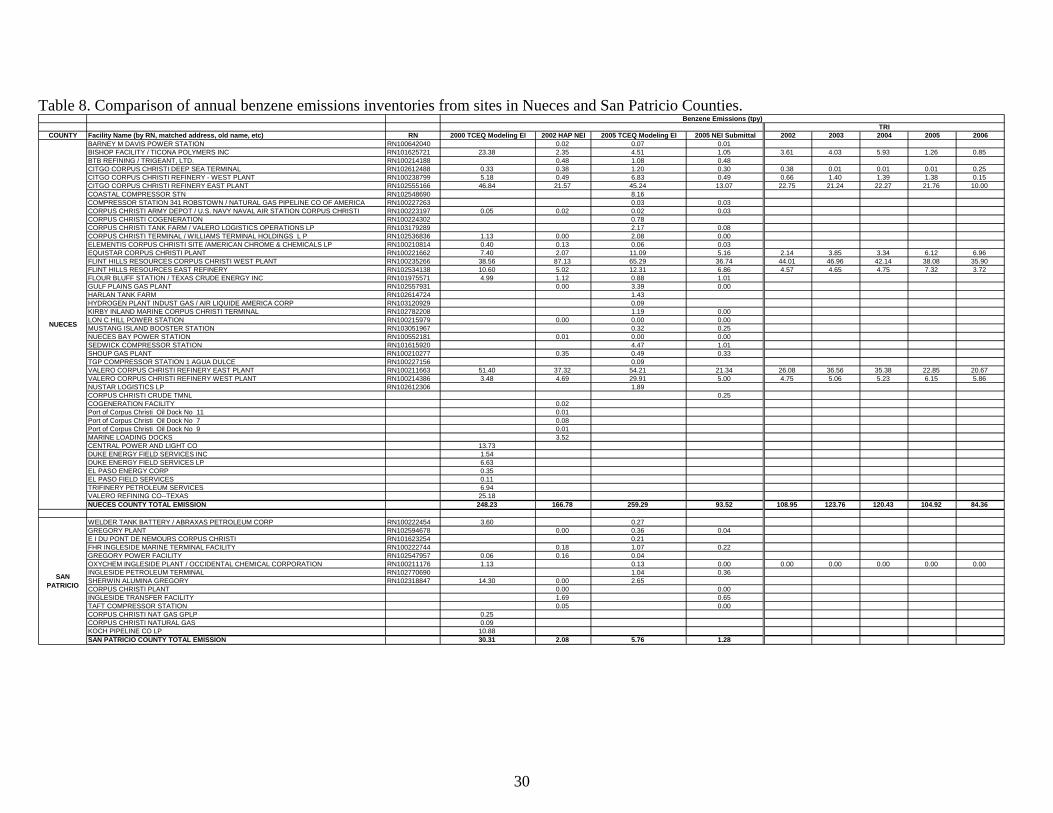
Table 8. Comparison of annual benzene emissions inventories from sites in Nueces and San Patricio Counties.
COUNTY Facility Name (by RN, matched address, old name, etc) RN 2000 TCEQ Modeling EI 2002 HAP NEI 2005 TCEQ Modeling EI 2005 NEI Submittal 2002 2003 2004 2005 2006BARNEY M DAVIS POWER STATION RN100642040 0.02 0.07 0.01BISHOP FACILITY / TICONA POLYMERS INC RN101625721 23.38 2.35 4.51 1.05 3.61 4.03 5.93 1.26 0.85BTB REFINING / TRIGEANT, LTD. RN100214188 0.48 1.08 0.48CITGO CORPUS CHRISTI DEEP SEA TERMINAL RN102612488 0.33 0.38 1.20 0.30 0.38 0.01 0.01 0.01 0.25CITGO CORPUS CHRISTI REFINERY - WEST PLANT RN100238799 5.18 0.49 6.83 0.49 0.66 1.40 1.39 1.38 0.15CITGO CORPUS CHRISTI REFINERY EAST PLANT RN102555166 46.84 21.57 45.24 13.07 22.75 21.24 22.27 21.76 10.00COASTAL COMPRESSOR STN RN102548690 8.16COMPRESSOR STATION 341 ROBSTOWN / NATURAL GAS PIPELINE CO OF AMERICA RN100227263 0.03 0.03CORPUS CHRISTI ARMY DEPOT / U.S. NAVY NAVAL AIR STATION CORPUS CHRISTI RN100223197 0.05 0.02 0.02 0.03CORPUS CHRISTI COGENERATION RN100224302 0.78CORPUS CHRISTI TANK FARM / VALERO LOGISTICS OPERATIONS LP RN103179289 2.17 0.08CORPUS CHRISTI TERMINAL / WILLIAMS TERMINAL HOLDINGS L P RN102536836 1.13 0.00 2.08 0.00ELEMENTIS CORPUS CHRISTI SITE /AMERICAN CHROME & CHEMICALS LP RN100210814 0.40 0.13 0.06 0.03EQUISTAR CORPUS CHRISTI PLANT RN100221662 7.40 2.07 11.09 5.16 2.14 3.85 3.34 6.12 6.96FLINT HILLS RESOURCES CORPUS CHRISTI WEST PLANT RN100235266 38.56 87.13 65.29 36.74 44.01 46.96 42.14 38.08 35.90FLINT HILLS RESOURCES EAST REFINERY RN102534138 10.60 5.02 12.31 6.86 4.57 4.65 4.75 7.32 3.72FLOUR BLUFF STATION / TEXAS CRUDE ENERGY INC RN101975571 4.99 1.12 0.88 1.01GULF PLAINS GAS PLANT RN102557931 0.00 3.39 0.00HARLAN TANK FARM RN102614724 1.43HYDROGEN PLANT INDUST GAS / AIR LIQUIDE AMERICA CORP RN103120929 0.09KIRBY INLAND MARINE CORPUS CHRISTI TERMINAL RN102782208 1.19 0.00LON C HILL POWER STATION RN100215979 0.00 0.00 0.00MUSTANG ISLAND BOOSTER STATION RN103051967 0.32 0.25NUECES BAY POWER STATION RN100552181 0.01 0.00 0.00SEDWICK COMPRESSOR STATION RN101615920 4.47 1.01SHOUP GAS PLANT RN100210277 0.35 0.49 0.33TGP COMPRESSOR STATION 1 AGUA DULCE RN100227156 0.09VALERO CORPUS CHRISTI REFINERY EAST PLANT RN100211663 51.40 37.32 54.21 21.34 26.08 36.56 35.38 22.85 20.67VALERO CORPUS CHRISTI REFINERY WEST PLANT RN100214386 3.48 4.69 29.91 5.00 4.75 5.06 5.23 6.15 5.86NUSTAR LOGISTICS LP RN102612306 1.89CORPUS CHRISTI CRUDE TMNL 0.25COGENERATION FACILITY 0.02Port of Corpus Christi Oil Dock No 11 0.01Port of Corpus Christi Oil Dock No 7 0.08Port of Corpus Christi Oil Dock No 9 0.01MARINE LOADING DOCKS 3.52CENTRAL POWER AND LIGHT CO 13.73DUKE ENERGY FIELD SERVICES INC 1.54DUKE ENERGY FIELD SERVICES LP 6.63EL PASO ENERGY CORP 0.35EL PASO FIELD SERVICES 0.11TRIFINERY PETROLEUM SERVICES 6.94VALERO REFINING CO--TEXAS 25.18NUECES COUNTY TOTAL EMISSION 248.23 166.78 259.29 93.52 108.95 123.76 120.43 104.92 84.36
WELDER TANK BATTERY / ABRAXAS PETROLEUM CORP RN100222454 3.60 0.27GREGORY PLANT RN102594678 0.00 0.36 0.04E I DU PONT DE NEMOURS CORPUS CHRISTI RN101623254 0.21FHR INGLESIDE MARINE TERMINAL FACILITY RN100222744 0.18 1.07 0.22GREGORY POWER FACILITY RN102547957 0.06 0.16 0.04OXYCHEM INGLESIDE PLANT / OCCIDENTAL CHEMICAL CORPORATION RN100211176 1.13 0.13 0.00 0.00 0.00 0.00 0.00 0.00INGLESIDE PETROLEUM TERMINAL RN102770690 1.04 0.36SHERWIN ALUMINA GREGORY RN102318847 14.30 0.00 2.65CORPUS CHRISTI PLANT 0.00 0.00INGLESIDE TRANSFER FACILITY 1.69 0.65TAFT COMPRESSOR STATION 0.05 0.00CORPUS CHRISTI NAT GAS GPLP 0.25CORPUS CHRISTI NATURAL GAS 0.09KOCH PIPELINE CO LP 10.88SAN PATRICIO COUNTY TOTAL EMISSION 30.31 2.08 5.76 1.28
TRI
NUECES
SANPATRICIO
Benzene Emissions (tpy)
30
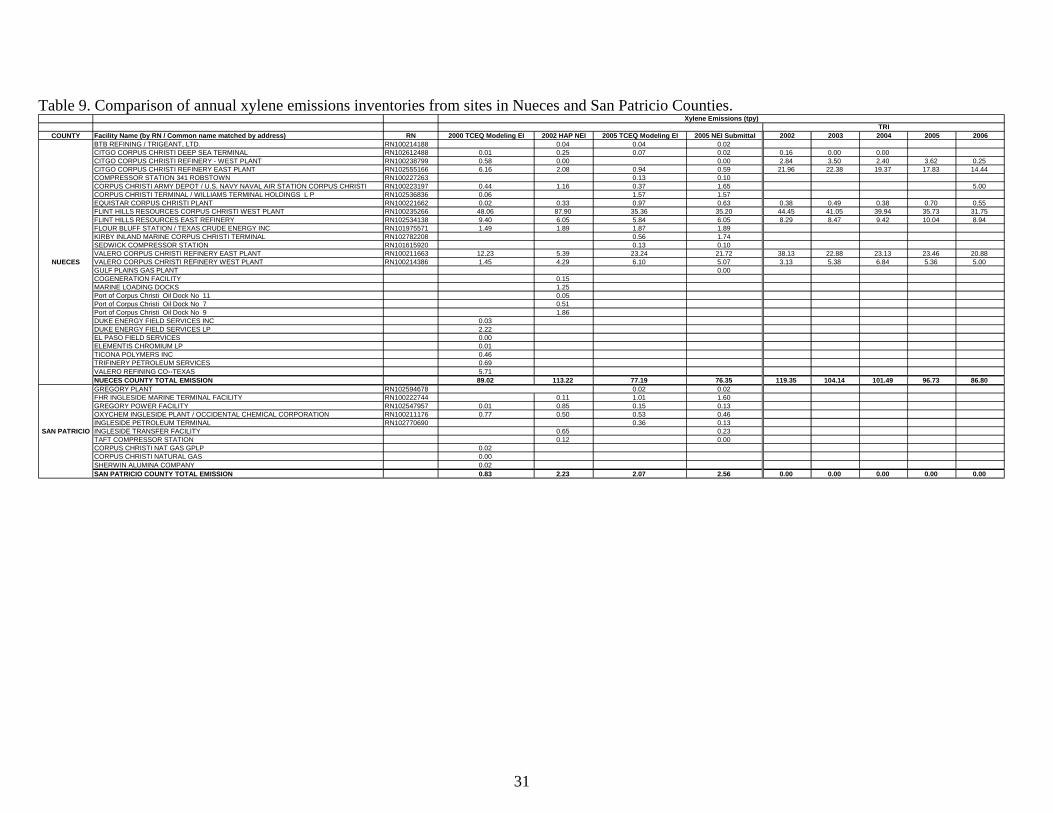
Table 9. Comparison of annual xylene emissions inventories from sites in Nueces and San Patricio Counties.
COUNTY Facility Name (by RN / Common name matched by address) RN 2000 TCEQ Modeling EI 2002 HAP NEI 2005 TCEQ Modeling EI 2005 NEI Submittal 2002 2003 2004 2005 2006BTB REFINING / TRIGEANT, LTD. RN100214188 0.04 0.04 0.02CITGO CORPUS CHRISTI DEEP SEA TERMINAL RN102612488 0.01 0.25 0.07 0.02 0.16 0.00 0.00CITGO CORPUS CHRISTI REFINERY - WEST PLANT RN100238799 0.58 0.00 0.00 2.84 3.50 2.40 3.62 0.25CITGO CORPUS CHRISTI REFINERY EAST PLANT RN102555166 6.16 2.08 0.94 0.59 21.96 22.38 19.37 17.83 14.44COMPRESSOR STATION 341 ROBSTOWN RN100227263 0.13 0.10CORPUS CHRISTI ARMY DEPOT / U.S. NAVY NAVAL AIR STATION CORPUS CHRISTI RN100223197 0.44 1.16 0.37 1.65 5.00CORPUS CHRISTI TERMINAL / WILLIAMS TERMINAL HOLDINGS L P RN102536836 0.06 1.57 1.57EQUISTAR CORPUS CHRISTI PLANT RN100221662 0.02 0.33 0.97 0.63 0.38 0.49 0.38 0.70 0.55FLINT HILLS RESOURCES CORPUS CHRISTI WEST PLANT RN100235266 48.06 87.90 35.36 35.20 44.45 41.05 39.94 35.73 31.75FLINT HILLS RESOURCES EAST REFINERY RN102534138 9.40 6.05 5.84 6.05 8.29 8.47 9.42 10.04 8.94FLOUR BLUFF STATION / TEXAS CRUDE ENERGY INC RN101975571 1.49 1.89 1.87 1.89KIRBY INLAND MARINE CORPUS CHRISTI TERMINAL RN102782208 0.56 1.74SEDWICK COMPRESSOR STATION RN101615920 0.13 0.10VALERO CORPUS CHRISTI REFINERY EAST PLANT RN100211663 12.23 5.39 23.24 21.72 38.13 22.88 23.13 23.46 20.88VALERO CORPUS CHRISTI REFINERY WEST PLANT RN100214386 1.45 4.29 6.10 5.07 3.13 5.38 6.84 5.36 5.00GULF PLAINS GAS PLANT 0.00COGENERATION FACILITY 0.15MARINE LOADING DOCKS 1.25Port of Corpus Christi Oil Dock No 11 0.05Port of Corpus Christi Oil Dock No 7 0.51Port of Corpus Christi Oil Dock No 9 1.86DUKE ENERGY FIELD SERVICES INC 0.03DUKE ENERGY FIELD SERVICES LP 2.22EL PASO FIELD SERVICES 0.00ELEMENTIS CHROMIUM LP 0.01TICONA POLYMERS INC 0.46TRIFINERY PETROLEUM SERVICES 0.69VALERO REFINING CO--TEXAS 5.71NUECES COUNTY TOTAL EMISSION 89.02 113.22 77.19 76.35 119.35 104.14 101.49 96.73 86.80GREGORY PLANT RN102594678 0.02 0.02FHR INGLESIDE MARINE TERMINAL FACILITY RN100222744 0.11 1.01 1.60GREGORY POWER FACILITY RN102547957 0.01 0.85 0.15 0.13OXYCHEM INGLESIDE PLANT / OCCIDENTAL CHEMICAL CORPORATION RN100211176 0.77 0.50 0.53 0.46INGLESIDE PETROLEUM TERMINAL RN102770690 0.36 0.13INGLESIDE TRANSFER FACILITY 0.65 0.23TAFT COMPRESSOR STATION 0.12 0.00CORPUS CHRISTI NAT GAS GPLP 0.02CORPUS CHRISTI NATURAL GAS 0.00SHERWIN ALUMINA COMPANY 0.02SAN PATRICIO COUNTY TOTAL EMISSION 0.83 2.23 2.07 2.56 0.00 0.00 0.00 0.00 0.00
TRI
SAN PATRICIO
NUECES
Xylene Emissions (tpy)
31

Table 10. Comparison of annual ethylbenzene emissions inventories from sites in Nueces and San Patricio Counties.
COUNTY Facility Name (by RN, matched address, old name, etc) RN 2000 TCEQ Modeling EI 2002 HAP NEI 2005 TCEQ Modeling EI 2005 NEI Submittal 2002 2003 2004 2005 2006HYDROGEN PLANT INDUST GAS / AIR LIQUIDE AMERICA CORP RN103120929 0.01CITGO CORPUS CHRISTI REFINERY EAST PLANT RN102555166 2.83 5.41 3.47 2.35 4.11 4.20 3.66 3.24 2.12CITGO CORPUS CHRISTI REFINERY - WEST PLANT RN100238799 1.04 0.46 0.25 0.53 0.68 0.70 0.70 0.07CITGO CORPUS CHRISTI DEEP SEA TERMINAL RN102612488 0.01 0.02 0.01 0.00 0.05 0.02 0.02 0.02 0.04CORPUS CHRISTI ARMY DEPOT RN100223197 0.07 0.00 0.06 0.25HARLAN TANK FARM RN102614724 0.31SEDWICK COMPRESSOR STATION RN101615920 0.49 0.03EQUISTAR CORPUS CHRISTI PLANT RN100221662 0.03 0.39 1.04 0.45 0.40 0.48 0.40 0.53 0.52FLINT HILLS RESOURCES CORPUS CHRISTI WEST PLANT RN100235266 4.60 21.12 7.45 6.56 10.70 8.34 8.52 6.99 6.18KIRBY INLAND MARINE CORPUS CHRISTI TERMINAL RN102782208 0.18FLINT HILLS RESOURCES EAST REFINERY / KOCH PETROLEUM GROUP LP RN102534138 5.52 1.81 1.76 1.49 1.31 1.32 1.39 1.57 1.29CORPUS CHRISTI TERMINAL / WILLIAMS TERMINAL HOLDINGS L P RN102536836 0.15 0.58 0.31COMPRESSOR STATION 341 ROBSTOWN RN100227263 0.03 0.02
RN102612306 0.13FLOUR BLUFF STATION / TEXAS CRUDE ENERGY INC RN101975571 0.58 0.74 0.70 0.71BISHOP FACILITY / TICONA POLYMERS INC RN101625721 1.52 0.49BTB REFINING / TRIGEANT, LTD. RN100214188 0.07 0.09 0.07CORPUS CHRISTI TANK FARM / VALERO LOGISTICS OPERATIONS LP RN103179289 0.06VALERO CORPUS CHRISTI REFINERY EAST PLANT RN100211663 0.63 0.05 5.56 4.13 6.53 5.22 5.19 5.13 5.16VALERO CORPUS CHRISTI REFINERY WEST PLANT RN100214386 0.17 0.77 2.63 0.87 0.54 0.95 1.45 1.06 0.97CORPUS CHRISTI CRUDE TMNL 0.02COGENERATION FACILITY 0.08Port of Corpus Christi Oil Dock No 9 0.00CENTRAL POWER AND LIGHT CO 0.00DUKE ENERGY FIELD SERVICES INC 0.01DUKE ENERGY FIELD SERVICES LP 0.66ELEMENTIS CHROMIUM LP 0.01TRIFINERY PETROLEUM SERVICES 0.09VALERO REFINING CO--TEXAS 0.87NUECES COUNTY TOTAL EMISSION 18.82 30.92 25.28 17.27 24.18 21.21 21.33 19.25 16.36WELDER TANK BATTERY RN100222454 0.03GREGORY PLANT RN102594678 0.00E I DU PONT DE NEMOURS CORPUS CHRISTI RN101623254 0.01FHR INGLESIDE MARINE TERMINAL FACILITY RN100222744 0.03 0.30 0.41GREGORY POWER FACILITY RN102547957 0.43 0.08 0.07OXYCHEM INGLESIDE PLANT / OCCIDENTAL CHEMICAL CORPORATION RN100211176 0.40 0.25 0.37 0.23INGLESIDE PETROLEUM TERMINAL RN102770690 0.10 0.03INGLESIDE TRANSFER FACILITY 0.17 0.06TAFT COMPRESSOR STATION 0.00 0.00SAN PATRICIO COUNTY TOTAL EMISSION 0.40 0.88 0.89 0.79 0.00 0.00 0.00 0.00 0.00
TRI
NUECES
SAN PATRICIO
Ethylbenzene Emissions (tpy)
32

Table 11. Comparison of annual toluene emissions inventories from sites in Nueces and San Patricio Counties.
COUNTY Facility Name (by RN / Common name matched by address) RN 2000 TCEQ Modeling EI 2002 HAP NEI 2005 TCEQ Modeling EI 2005 NEI Submittal 2002 2003 2004 2005 2006HYDROGEN PLANT INDUST GAS / AIR LIQUIDE AMERICA CORP RN103120929 0.02BARNEY M DAVIS POWER STATION RN100642040 0.03 0.65 0.01MUSTANG ISLAND BOOSTER STATION RN103051967 0.15 0.09CITGO CORPUS CHRISTI REFINERY EAST PLANT RN102555166 28.18 31.54 29.28 20.02 21.54 17.56 28.09 18.36 12.63CITGO CORPUS CHRISTI REFINERY - WEST PLANT RN100238799 1.72 1.26 3.38 1.01 1.41 2.71 2.75 2.74 0.38CITGO CORPUS CHRISTI DEEP SEA TERMINAL RN102612488 3.88 1.31 0.13 0.00 1.31 0.26 0.26 0.26 0.28CORPUS CHRISTI ARMY DEPOT/U.S. NAVY NAVAL AIR STATION CORPUS CHRISTI RN100223197 1.08 2.47 0.91 3.86 3.40 3.44 5.15CORPUS CHRISTI COGENERATION RN100224302 0.05COASTAL COMPRESSOR STN RN102548690 0.08GULF PLAINS GAS PLANT RN102557931 0.85 0.00HARLAN TANK FARM RN102614724 2.58SHOUP GAS PLANT RN100210277 0.05SEDWICK COMPRESSOR STATION RN101615920 4.67 0.58EQUISTAR CORPUS CHRISTI PLANT RN100221662 0.57 0.96 4.66 1.81 0.97 1.45 1.23 2.24 2.02FLINT HILLS RESOURCES CORPUS CHRISTI WEST PLANT RN100235266 25.39 54.78 45.74 25.42 29.28 29.20 30.02 27.95 35.53KIRBY INLAND MARINE CORPUS CHRISTI TERMINAL RN102782208 17.88 3.70FLINT HILLS RESOURCES EAST REFINERY RN102534138 15.83 7.74 12.25 7.09 6.89 7.48 7.96 7.80 6.13LON C HILL POWER STATION RN100215979 0.00 0.00CORPUS CHRISTI TERMINAL / WILLIAMS TERMINAL HOLDINGS L P RN102536836 1.34 4.85COMPRESSOR STATION 341 ROBSTOWN RN100227263 0.13 0.10NUECES BAY POWER STATION RN100552181 0.02 0.00NUSTAR LOGISTICS LP RN102612306 3.91FLOUR BLUFF STATION / TEXAS CRUDE ENERGY INC RN101975571 1.05 1.36 1.24 1.26BISHOP FACILITY / TICONA POLYMERS INC RN101625721 4.10 16.54BTB REFINING / TRIGEANT, LTD. RN100214188 0.40 0.87 0.41CORPUS CHRISTI TANK FARM RN103179289 0.78VALERO CORPUS CHRISTI REFINERY EAST PLANT RN100211663 18.93 2.39 45.94 28.75 49.43 33.59 38.13 31.38 30.20VALERO CORPUS CHRISTI REFINERY WEST PLANT RN100214386 7.16 4.15 27.47 4.32 4.02 4.03 4.73 6.07 7.21CORPUS CHRISTI CRUDE TMNL 1.40COGENERATION FACILITY 0.31MARINE LOADING DOCKS 5.60Port of Corpus Christi Oil Dock No 11 0.02Port of Corpus Christi Oil Dock No 7 0.15Port of Corpus Christi Oil Dock No 9 0.16CENTRAL POWER AND LIGHT CO 6.82DUKE ENERGY FIELD SERVICES INC 0.08DUKE ENERGY FIELD SERVICES LP 4.99EL PASO FIELD SERVICES 0.02ELEMENTIS CHROMIUM LP 0.09TRIFINERY PETROLEUM SERVICES 3.39VALERO REFINING CO--TEXAS 14.56NUECES COUNTY TOTAL EMISSION 139.17 114.64 225.06 99.82 114.85 96.27 116.56 100.23 99.53WELDER TANK BATTERY / ABRAXAS PETROLEUM CORP RN100222454 0.34 0.29GREGORY PLANT RN102594678 0.18 0.03E I DU PONT DE NEMOURS CORPUS CHRISTI RN101623254 0.06FHR INGLESIDE MARINE TERMINAL FACILITY RN100222744 0.13 0.70 0.14GREGORY POWER FACILITY RN102547957 0.02 1.74 0.32 0.28OXYCHEM INGLESIDE PLANT / OCCIDENTAL CHEMICAL CORPORATION RN100211176 2.03 0.68 1.52 2.15INGLESIDE PETROLEUM TERMINAL RN102770690 0.92 0.32SHERWIN ALUMINA GREGORY RN102318847 7.13 1.32INGLESIDE TRANSFER FACILITY 1.53 0.58TAFT COMPRESSOR STATION 0.06 0.00CORPUS CHRISTI NAT GAS GPLP 0.12CORPUS CHRISTI NATURAL GAS 0.03HEC PETROLEUM INC 0.00SAN PATRICIO COUNTY TOTAL EMISSION 9.67 4.14 5.31 3.49 0.00 0.00 0.00 0.00 0.00
TRI
NUECES
SAN PATRICIO
Toluene Emissions (tpy)
33
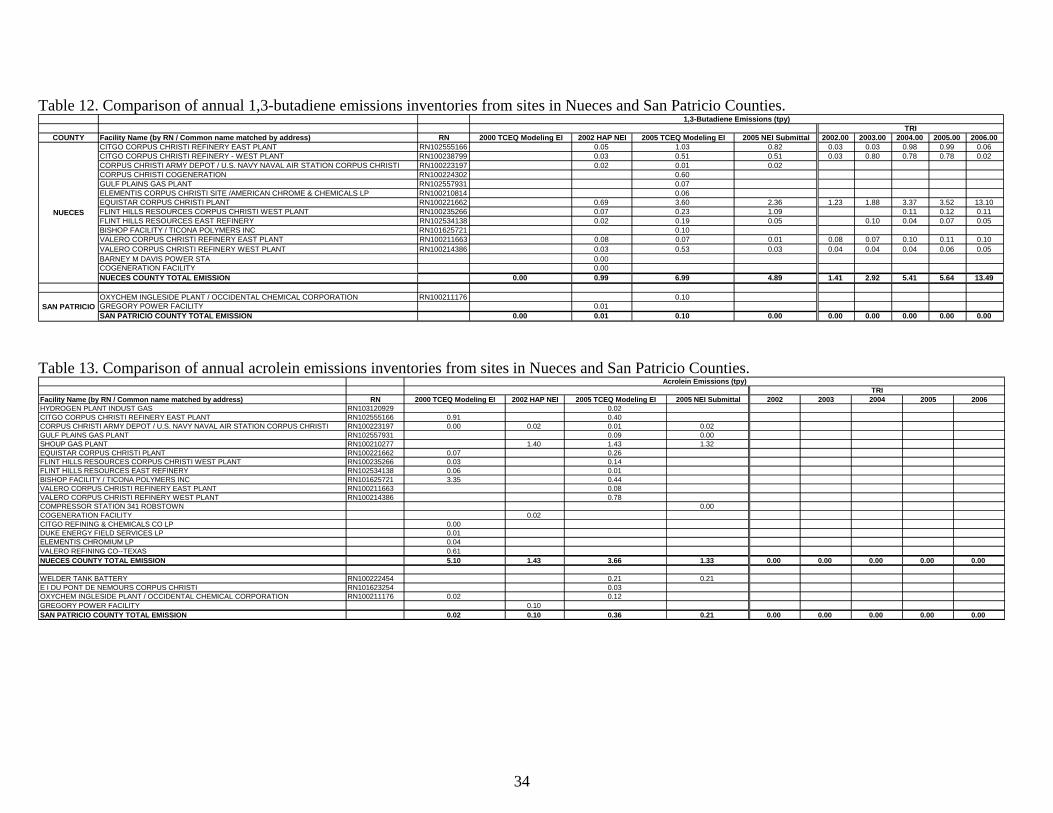
Table 12. Comparison of annual 1,3-butadiene emissions inventories from sites in Nueces and San Patricio Counties.
COUNTY Facility Name (by RN / Common name matched by address) RN 2000 TCEQ Modeling EI 2002 HAP NEI 2005 TCEQ Modeling EI 2005 NEI Submittal 2002.00 2003.00 2004.00 2005.00 2006.00CITGO CORPUS CHRISTI REFINERY EAST PLANT RN102555166 0.05 1.03 0.82 0.03 0.03 0.98 0.99 0.06CITGO CORPUS CHRISTI REFINERY - WEST PLANT RN100238799 0.03 0.51 0.51 0.03 0.80 0.78 0.78 0.02CORPUS CHRISTI ARMY DEPOT / U.S. NAVY NAVAL AIR STATION CORPUS CHRISTI RN100223197 0.02 0.01 0.02CORPUS CHRISTI COGENERATION RN100224302 0.60GULF PLAINS GAS PLANT RN102557931 0.07ELEMENTIS CORPUS CHRISTI SITE /AMERICAN CHROME & CHEMICALS LP RN100210814 0.06EQUISTAR CORPUS CHRISTI PLANT RN100221662 0.69 3.60 2.36 1.23 1.88 3.37 3.52 13.10FLINT HILLS RESOURCES CORPUS CHRISTI WEST PLANT RN100235266 0.07 0.23 1.09 0.11 0.12 0.11FLINT HILLS RESOURCES EAST REFINERY RN102534138 0.02 0.19 0.05 0.10 0.04 0.07 0.05BISHOP FACILITY / TICONA POLYMERS INC RN101625721 0.10VALERO CORPUS CHRISTI REFINERY EAST PLANT RN100211663 0.08 0.07 0.01 0.08 0.07 0.10 0.11 0.10VALERO CORPUS CHRISTI REFINERY WEST PLANT RN100214386 0.03 0.53 0.03 0.04 0.04 0.04 0.06 0.05BARNEY M DAVIS POWER STA 0.00COGENERATION FACILITY 0.00NUECES COUNTY TOTAL EMISSION 0.00 0.99 6.99 4.89 1.41 2.92 5.41 5.64 13.49
OXYCHEM INGLESIDE PLANT / OCCIDENTAL CHEMICAL CORPORATION RN100211176 0.10GREGORY POWER FACILITY 0.01SAN PATRICIO COUNTY TOTAL EMISSION 0.00 0.01 0.10 0.00 0.00 0.00 0.00 0.00 0.00
1,3-Butadiene Emissions (tpy)
SAN PATRICIO
TRI
NUECES
Table 13. Comparison of annual acrolein emissions inventories from sites in Nueces and San Patricio Counties.
Facility Name (by RN / Common name matched by address) RN 2000 TCEQ Modeling EI 2002 HAP NEI 2005 TCEQ Modeling EI 2005 NEI Submittal 2002 2003 2004 2005 2006HYDROGEN PLANT INDUST GAS RN103120929 0.02CITGO CORPUS CHRISTI REFINERY EAST PLANT RN102555166 0.91 0.40CORPUS CHRISTI ARMY DEPOT / U.S. NAVY NAVAL AIR STATION CORPUS CHRISTI RN100223197 0.00 0.02 0.01 0.02GULF PLAINS GAS PLANT RN102557931 0.09 0.00SHOUP GAS PLANT RN100210277 1.40 1.43 1.32EQUISTAR CORPUS CHRISTI PLANT RN100221662 0.07 0.26FLINT HILLS RESOURCES CORPUS CHRISTI WEST PLANT RN100235266 0.03 0.14FLINT HILLS RESOURCES EAST REFINERY RN102534138 0.06 0.01BISHOP FACILITY / TICONA POLYMERS INC RN101625721 3.35 0.44VALERO CORPUS CHRISTI REFINERY EAST PLANT RN100211663 0.08VALERO CORPUS CHRISTI REFINERY WEST PLANT RN100214386 0.78COMPRESSOR STATION 341 ROBSTOWN 0.00COGENERATION FACILITY 0.02CITGO REFINING & CHEMICALS CO LP 0.00DUKE ENERGY FIELD SERVICES LP 0.01ELEMENTIS CHROMIUM LP 0.04VALERO REFINING CO--TEXAS 0.61NUECES COUNTY TOTAL EMISSION 5.10 1.43 3.66 1.33 0.00 0.00 0.00 0.00 0.00
WELDER TANK BATTERY RN100222454 0.21 0.21E I DU PONT DE NEMOURS CORPUS CHRISTI RN101623254 0.03OXYCHEM INGLESIDE PLANT / OCCIDENTAL CHEMICAL CORPORATION RN100211176 0.02 0.12GREGORY POWER FACILITY 0.10SAN PATRICIO COUNTY TOTAL EMISSION 0.02 0.10 0.36 0.21 0.00 0.00 0.00 0.00 0.00
Acrolein Emissions (tpy)TRI
34

Table 14. Comparison of annual formaldehyde emissions inventories from sites in Nueces and San Patricio Counties.
COUNTY Facility Name (by RN / Common name matched by address) RN 2000 TCEQ Modeling EI 2002 HAP NEI 2005 TCEQ Modeling EI 2005 NEI Submittal 2002 2003 2004 2005 2006HYDROGEN PLANT INDUST GAS / AIR LIQUIDE AMERICA CORP RN103120929 0.01BARNEY M DAVIS POWER STATION RN100642040 0.65 0.35 0.35MUSTANG ISLAND BOOSTER STATION RN103051967 1.13 1.13CITGO CORPUS CHRISTI REFINERY EAST PLANT RN102555166 42.29 0.00 27.87CITGO CORPUS CHRISTI REFINERY - WEST PLANT RN100238799 22.03 0.00 17.15CORPUS CHRISTI ARMY DEPOT / U.S. NAVY NAVAL AIR STATION CORPUS CHRISTI RN100223197 0.05 0.05 0.04 0.06CORPUS CHRISTI COGENERATION RN100224302 1.75GULF PLAINS GAS PLANT RN102557931 0.00 17.08 14.61TGP COMPRESSOR STATION 1 AGUA DULCE RN100227156 0.54 0.35SHOUP GAS PLANT RN100210277 9.89 10.93 9.33SEDWICK COMPRESSOR STATION RN101615920 0.10EQUISTAR CORPUS CHRISTI PLANT RN100221662 0.33 0.00 8.23FLINT HILLS RESOURCES CORPUS CHRISTI WEST PLANT RN100235266 20.08 0.00 32.70FLINT HILLS RESOURCES EAST REFINERY RN102534138 10.61 0.00 14.10LON C HILL POWER STATION RN100215979 0.08 0.00 0.00CORPUS CHRISTI TERMINAL / WILLIAMS TERMINAL HOLDINGS L P RN102536836 0.01 0.00 0.01NUECES BAY POWER STATION RN100552181 0.37 0.00 0.00NUSTAR LOGISTICS LP RN102612306 0.05ROBSTOWN UTILITY SYSTEMS RN100224203 4.49 0.00FLOUR BLUFF STATION / TEXAS CRUDE ENERGY INC RN101975571 0.28 0.01BISHOP FACILITY / TICONA POLYMERS INC RN101625721 92.81 69.55 25.44 16.48 28.59 20.17 37.47 17.47 14.70BTB REFINING / TRIGEANT, LTD. RN100214188 0.00 0.18VALERO CORPUS CHRISTI REFINERY EAST PLANT RN100211663 117.88 0.00 40.03VALERO CORPUS CHRISTI REFINERY WEST PLANT RN100214386 72.57 0.00 44.82COMPRESSOR STATION 341 ROBSTOWN 0.00COASTAL COMPRESSOR STN 2.05AMERICAN CHROME & CHEMICALS LP 0.00COGENERATION FACILITY 0.00CENTRAL POWER AND LIGHT CO 13.85DUKE ENERGY FIELD SERVICES INC 1.13DUKE ENERGY FIELD SERVICES LP 10.22EL PASO ENERGY CORP 0.02EL PASO FIELD SERVICES 0.64ELEMENTIS CHROMIUM LP 0.89NATURAL GAS PIPELINE CO OF AMERICA 0.01TRIFINERY PETROLEUM SERVICES 4.59NUECES COUNTY TOTAL EMISSION 414.78 80.59 242.54 44.36 28.59 20.17 37.47 17.47 14.70
WELDER TANK BATTERY / ABRAXAS PETROLEUM CORP RN100222454 0.11 1.64 1.52GREGORY PLANT RN102594678 0.00 6.04 3.80E I DU PONT DE NEMOURS CORPUS CHRISTI RN101623254 0.12GREGORY POWER FACILITY RN102547957 0.36 0.38 1.78 1.56OXYCHEM INGLESIDE PLANT / OCCIDENTAL CHEMICAL CORPORATION RN100211176 10.45 7.51 6.01 5.18SHERWIN ALUMINA GREGORY RN102318847 29.23 0.00 5.30CORPUS CHRISTI NAT GAS GPLP 1.24 0.00CORPUS CHRISTI NATURAL GAS 0.69HEC PETROLEUM INC 0.20SAN PATRICIO COUNTY TOTAL EMISSION 42.28 7.89 20.89 12.06 0.00 0.00 0.00 0.00 0.00
Formaldehyde Emissions (tpy)
SAN PATRICIO
TRI
NUECES
35
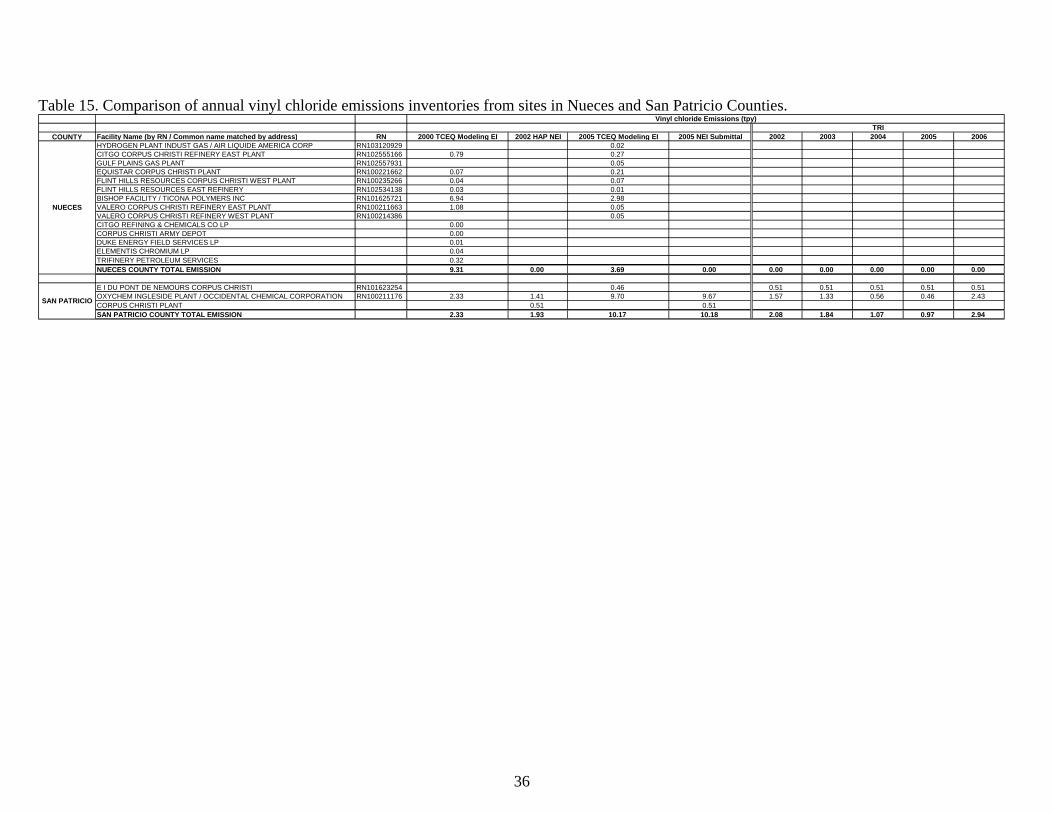
Table 15. Comparison of annual vinyl chloride emissions inventories from sites in Nueces and San Patricio Counties.
COUNTY Facility Name (by RN / Common name matched by address) RN 2000 TCEQ Modeling EI 2002 HAP NEI 2005 TCEQ Modeling EI 2005 NEI Submittal 2002 2003 2004 2005 2006HYDROGEN PLANT INDUST GAS / AIR LIQUIDE AMERICA CORP RN103120929 0.02CITGO CORPUS CHRISTI REFINERY EAST PLANT RN102555166 0.79 0.27GULF PLAINS GAS PLANT RN102557931 0.05EQUISTAR CORPUS CHRISTI PLANT RN100221662 0.07 0.21FLINT HILLS RESOURCES CORPUS CHRISTI WEST PLANT RN100235266 0.04 0.07FLINT HILLS RESOURCES EAST REFINERY RN102534138 0.03 0.01BISHOP FACILITY / TICONA POLYMERS INC RN101625721 6.94 2.98VALERO CORPUS CHRISTI REFINERY EAST PLANT RN100211663 1.08 0.05VALERO CORPUS CHRISTI REFINERY WEST PLANT RN100214386 0.05CITGO REFINING & CHEMICALS CO LP 0.00CORPUS CHRISTI ARMY DEPOT 0.00DUKE ENERGY FIELD SERVICES LP 0.01ELEMENTIS CHROMIUM LP 0.04TRIFINERY PETROLEUM SERVICES 0.32NUECES COUNTY TOTAL EMISSION 9.31 0.00 3.69 0.00 0.00 0.00 0.00 0.00 0.00
E I DU PONT DE NEMOURS CORPUS CHRISTI RN101623254 0.46 0.51 0.51 0.51 0.51 0.51OXYCHEM INGLESIDE PLANT / OCCIDENTAL CHEMICAL CORPORATION RN100211176 2.33 1.41 9.70 9.67 1.57 1.33 0.56 0.46 2.43CORPUS CHRISTI PLANT 0.51 0.51SAN PATRICIO COUNTY TOTAL EMISSION 2.33 1.93 10.17 10.18 2.08 1.84 1.07 0.97 2.94
Vinyl chloride Emissions (tpy)
SAN PATRICIO
TRI
NUECES
36

5.4 Inventory Inter-comparison: Differences in the Spatial Allocation of Emissions The spatial resolution of emission points in the TRI and other inventories differs as described above. The National Emission Inventories and the TCEQ Photochemical Modeling Inventories provide detailed stack parameters. In contrast, the Toxics Release Program Inventories provide only a facility address with no further resolution and thus, all emissions in these inventories can broadly be thought of as occurring from a single point within the property boundary as shown in Figure 4 for the 2006 TRI. Maps overlaying VOC emission points on site property boundaries for the 2002 NEI, the State of Texas submittal to the 2005 NEI, and the 2005 Photochemical Modeling EI 2005 are shown in Figures 5 through 7. These maps can be used to contrast differences in the inventories as well as to identify discrepancies between the location of emission points and site property boundaries. Emission points for both the 2005 TCEQ Photochemical Modeling EI and the 2005 NEI submittal show excellent agreement with each other and with respect to their placement within site property boundaries. The agreement between these 2005 inventories was not surprising based on their common origin of the 2005 STARS database; the additional processing that is done to account for rule effectiveness and to provide more detailed chemical speciation in the photochemical modeling inventories should not result in geographic shifts in the reference datum or stack parameters. In contrast, emission points in the 2002 HAP NEI clearly lie outside of property boundaries for some facilities, and it generally appears that the reference datum may be shifted towards the south. In addition, individual emission points are not distinguished for some facilities, such as the Flint Hills West Plant, in the 2002 HAP NEI. These problems with the 2002 HAP NEI coupled with its greater age suggest that the 2005 NEI submittal or 2005 TCEQ Photochemical Modeling EI’s may provide better representations of sources in the region for air quality modeling assessments. It is important to note, however, that the 2002 HAP NEI is still being used widely in air quality and risk assessments in the United States pending the official public release of the 2005 HAP NEI by the U.S. EPA. Figures 8 through 13 examine VOC emission points from the 2005 TCEQ Photochemical Modeling EI overlayed on aerial photographs of seven sites in Nueces County: Flint Hills West, Flint Hills East, Valero East, Valero West, Citgo East, Citgo West, and Citgo Deep Sea Terminal. These maps should not be construed as a substitute for process diagrams for the sites. Instead, these maps provide a broad indication of whether emission points in the inventories are located in close proximity to distinguishable sources such as tanks, whether they appear within property boundaries and not within roadways or other geographic or urban boundaries, and whether they are absent from large segments of a site. Overall the agreement between the emission points and the aerial photographs for all of the sites appears to be quite good, reference for example Flint Hills West in Figure 9. There are cases where a few emission points appear to be placed within or very close to the edge of roadways or appear in areas without any obvious structures, see for example the Valero sites in Figure 10 and 11 and the Citgo West and Deep Sea Terminal sites in Figures 12 and 13.

Figure 4. Site emissions included in the 2006 TRI.

Figure 5. Emission points and site property boundaries in the 2005 TCEQ Photochemical Modeling EI.
39
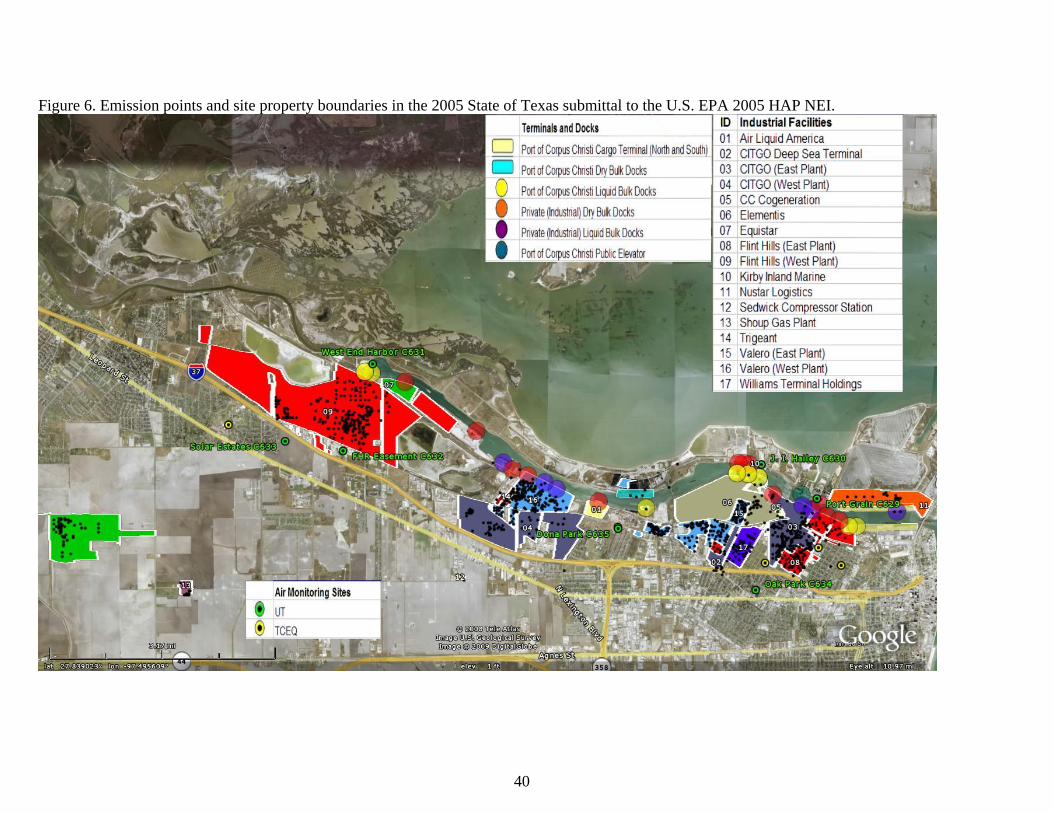
Figure 6. Emission points and site property boundaries in the 2005 State of Texas submittal to the U.S. EPA 2005 HAP NEI.
40

Figure 7. Emission points and site property boundaries in the 2002 NEI.
41

Figure 8. Emission points for the Flint Hills East site in the 2005 TCEQ Photochemical Modeling EI.
42
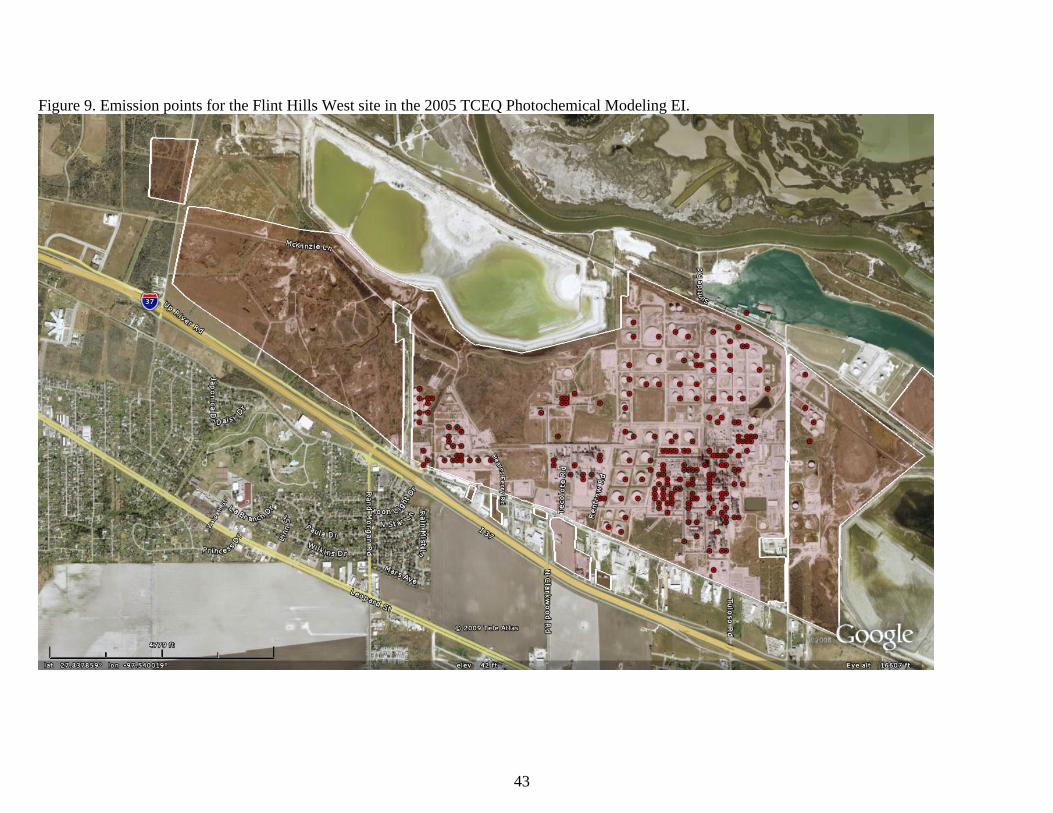
Figure 9. Emission points for the Flint Hills West site in the 2005 TCEQ Photochemical Modeling EI.
43
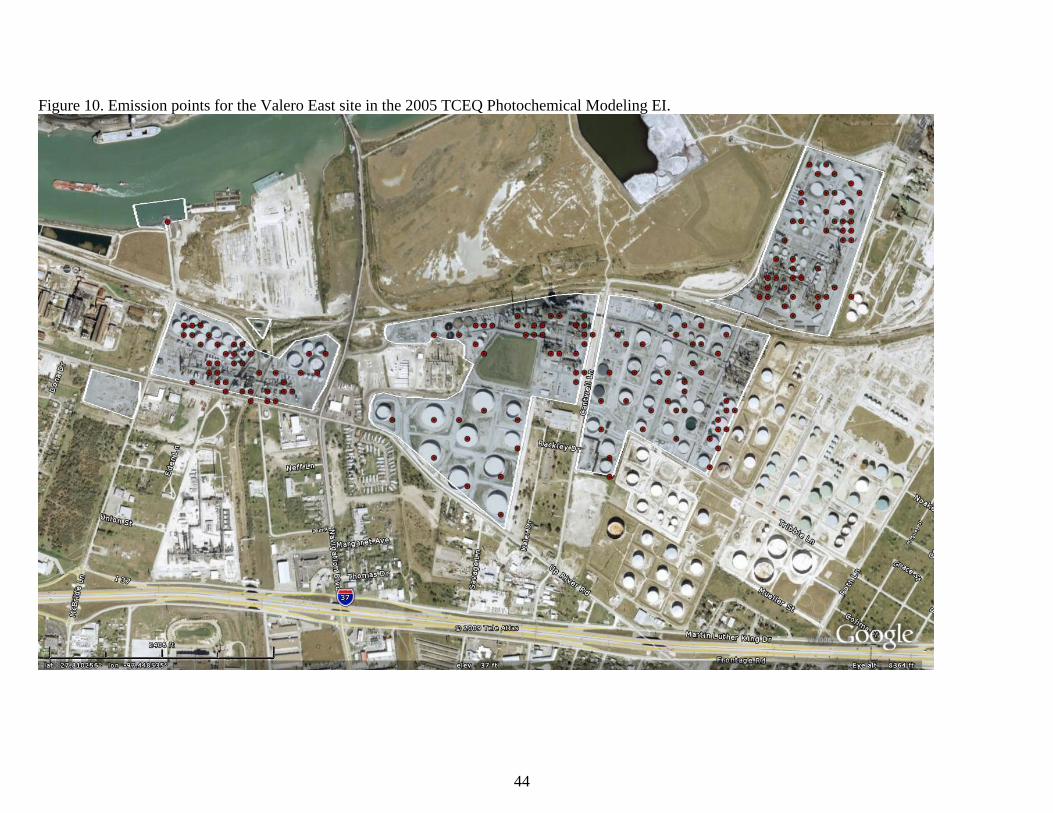
Figure 10. Emission points for the Valero East site in the 2005 TCEQ Photochemical Modeling EI.
44

Figure 11. Emission points for the Valero West site in the 2005 TCEQ Photochemical Modeling EI.
45

Figure 12. Emission points for the Citgo East site in the 2005 TCEQ Photochemical Modeling EI.
46
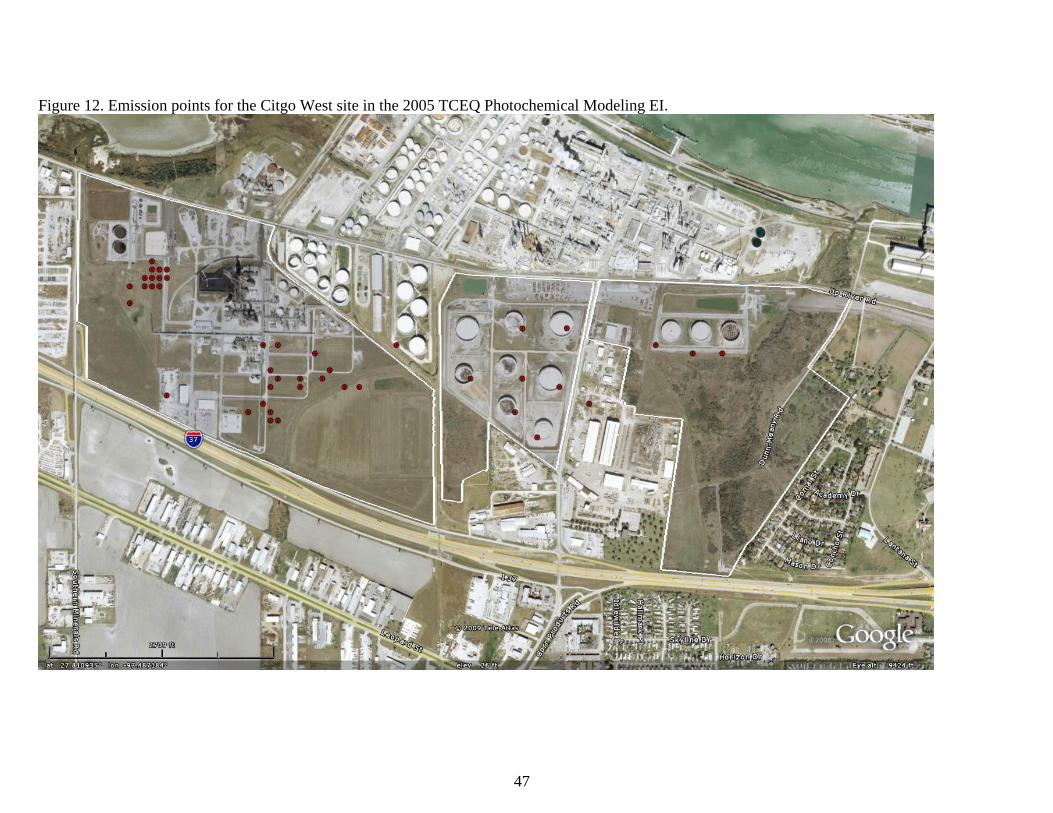
Figure 12. Emission points for the Citgo West site in the 2005 TCEQ Photochemical Modeling EI.
47
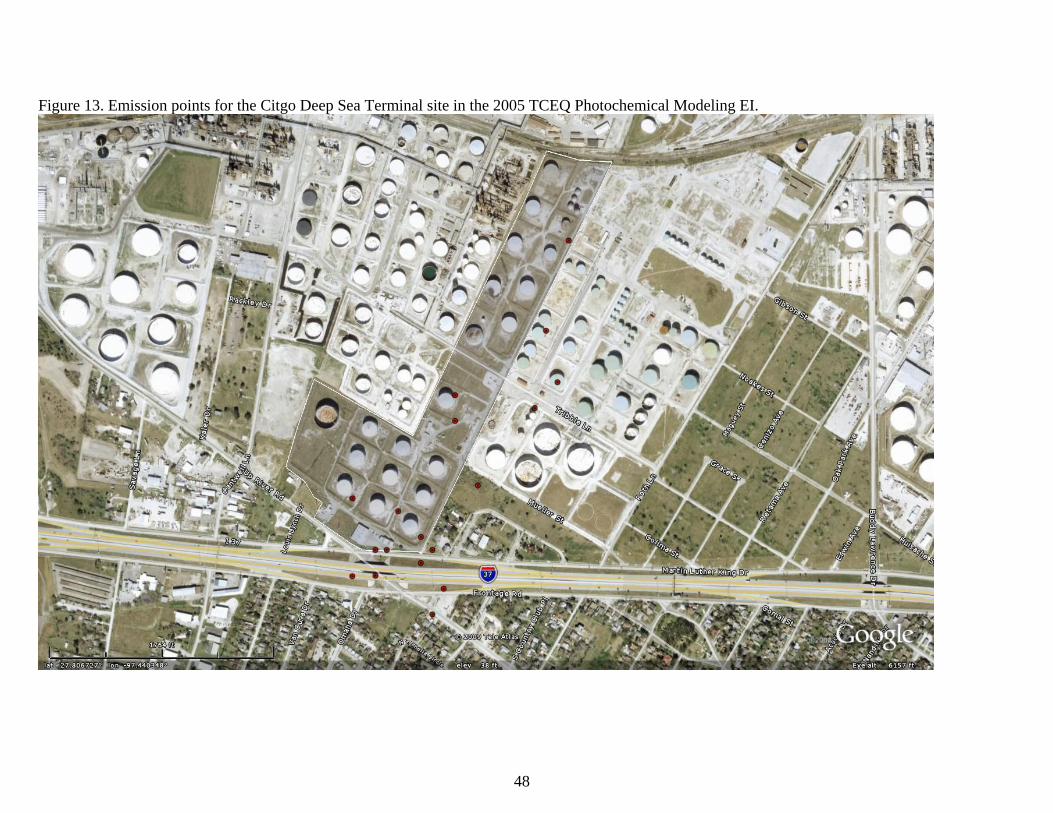
Figure 13. Emission points for the Citgo Deep Sea Terminal site in the 2005 TCEQ Photochemical Modeling EI.
48
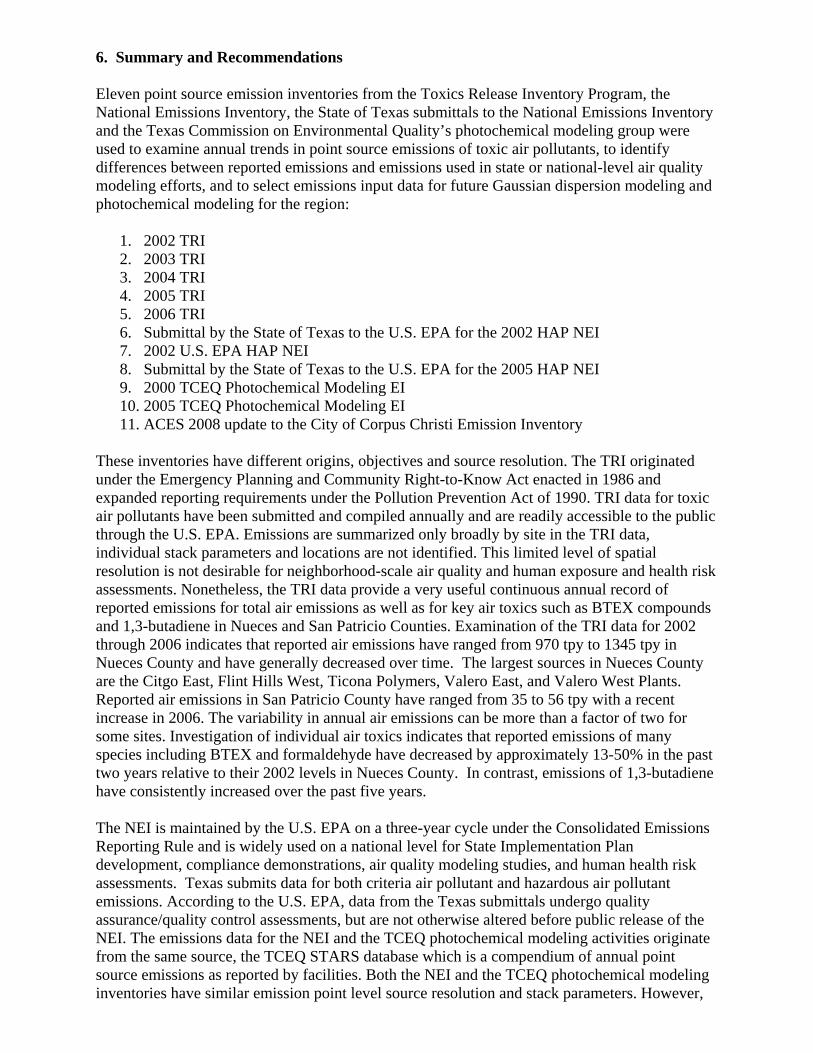
6. Summary and Recommendations Eleven point source emission inventories from the Toxics Release Inventory Program, the National Emissions Inventory, the State of Texas submittals to the National Emissions Inventory and the Texas Commission on Environmental Quality’s photochemical modeling group were used to examine annual trends in point source emissions of toxic air pollutants, to identify differences between reported emissions and emissions used in state or national-level air quality modeling efforts, and to select emissions input data for future Gaussian dispersion modeling and photochemical modeling for the region:
1. 2002 TRI 2. 2003 TRI 3. 2004 TRI 4. 2005 TRI 5. 2006 TRI 6. Submittal by the State of Texas to the U.S. EPA for the 2002 HAP NEI 7. 2002 U.S. EPA HAP NEI 8. Submittal by the State of Texas to the U.S. EPA for the 2005 HAP NEI 9. 2000 TCEQ Photochemical Modeling EI 10. 2005 TCEQ Photochemical Modeling EI 11. ACES 2008 update to the City of Corpus Christi Emission Inventory
These inventories have different origins, objectives and source resolution. The TRI originated under the Emergency Planning and Community Right-to-Know Act enacted in 1986 and expanded reporting requirements under the Pollution Prevention Act of 1990. TRI data for toxic air pollutants have been submitted and compiled annually and are readily accessible to the public through the U.S. EPA. Emissions are summarized only broadly by site in the TRI data, individual stack parameters and locations are not identified. This limited level of spatial resolution is not desirable for neighborhood-scale air quality and human exposure and health risk assessments. Nonetheless, the TRI data provide a very useful continuous annual record of reported emissions for total air emissions as well as for key air toxics such as BTEX compounds and 1,3-butadiene in Nueces and San Patricio Counties. Examination of the TRI data for 2002 through 2006 indicates that reported air emissions have ranged from 970 tpy to 1345 tpy in Nueces County and have generally decreased over time. The largest sources in Nueces County are the Citgo East, Flint Hills West, Ticona Polymers, Valero East, and Valero West Plants. Reported air emissions in San Patricio County have ranged from 35 to 56 tpy with a recent increase in 2006. The variability in annual air emissions can be more than a factor of two for some sites. Investigation of individual air toxics indicates that reported emissions of many species including BTEX and formaldehyde have decreased by approximately 13-50% in the past two years relative to their 2002 levels in Nueces County. In contrast, emissions of 1,3-butadiene have consistently increased over the past five years. The NEI is maintained by the U.S. EPA on a three-year cycle under the Consolidated Emissions Reporting Rule and is widely used on a national level for State Implementation Plan development, compliance demonstrations, air quality modeling studies, and human health risk assessments. Texas submits data for both criteria air pollutant and hazardous air pollutant emissions. According to the U.S. EPA, data from the Texas submittals undergo quality assurance/quality control assessments, but are not otherwise altered before public release of the NEI. The emissions data for the NEI and the TCEQ photochemical modeling activities originate from the same source, the TCEQ STARS database which is a compendium of annual point source emissions as reported by facilities. Both the NEI and the TCEQ photochemical modeling inventories have similar emission point level source resolution and stack parameters. However,

50
the TCEQ applies factors to account for rule effectiveness and to further chemically speciate VOC emissions. The rule effectiveness factors were found to primarily affect emissions from flares, equipment leak fugitives, external floating roof tanks, internal floating roof tanks, and vertical fixed tanks. Emissions of individual air toxics were compared for the inventories under consideration and pronounced differences were found. The most significant differences occurred between the TCEQ Photochemical Modeling Inventories and the other inventories, which was not unexpected given that the Photochemical Modeling Inventories include rule effectiveness and full speciation, whereas the other inventories are based on reported emissions only, and were more striking for certain species. For example, benzene emissions in Nueces County in the 2002-2006 TRI databases and the 2005 NEI submittal range from approximately 85 to 120 tpy, whereas emissions for the 2002 HAP NEI are 166 tpy, and emissions from the 2000 and 2005 Photochemical Modeling Inventories are 250 to 260 tpy. Differences in emissions of formaldehyde are even more substantial with emissions reported to the TRI databases ranging from 15 to 30 tpy versus emissions of 250 to 415 tpy in the TCEQ Photochemical Modeling Inventories. Toluene emissions in the 2005 TCEQ Photochemical Modeling Inventory (225 tpy) were approximately a factor of two higher than in the other inventories for Nueces County. Emissions of xylene and ethylbenzene show relatively better agreement between inventories. Although emissions of 1,3-butadiene show fairly good agreement; emissions increased dramatically in the 2006 TRI relative to the other inventories. Overall, there were substantial differences in the magnitude of emissions between the inventories, however, the relative magnitude of emissions from the sites is reasonably consistent for most species. Maps were developed to compare the location of emission points to site property boundaries focusing on the 2002 HAP NEI, the Texas submittal to the 2005 NEI, and the TCEQ 2005 Photochemical Modeling EI. Emission points in the 2002 HAP NEI were clearly outside of property boundaries for some facilities, and it appeared that the reference datum was shifted towards the south. In addition, individual emission points were not distinguished for some facilities in the 2002 HAP NEI. These problems with the 2002 NEI coupled with its greater age suggest that the 2005 NEI submittal or 2005 TCEQ Photochemical Modeling EI’s provide better representations of sources in the region for air quality modeling assessments. The higher level of chemical speciation in the 2005 Photochemical Modeling EI is desirable for neighborhood-scale modeling and assessment of air toxics in Corpus Christi. In addition, use of this inventory in Corpus Christi provides consistency with modeling activities being undertaken by the TCEQ. However, it is important to recognize that many national-level air quality and human exposure and health risk assessments are expected to eventually be conducted using the 2005 HAP NEI. It is recommended that both 2005 inventories be applied in air quality modeling studies in Corpus Christi initially as the team proceeds, and that both are evaluated against the ambient data from the Corpus Christi network. Future national and state-level emission inventories that include Nueces and San Patricio Counties should continue to be evaluated to track longer trends in reported emissions and to investigate whether trends in reported emissions are consistent with trends in ambient data for the region.