emission standards and control of pm from coal-fired power ... standards and... · iea clean coal...
TRANSCRIPT

Emission standards and control of PM2.5 from
coal-fired power plant Xing Zhang
CCC/267
July 2016
© IEA Clean Coal Centre
IEA Clean Coal Centre – Emission standards and control of PM2.5 from coal-fired power plant 2
Emission standards and control of PM2.5 from coal-fired power plants Author: Xing Zhang
IEACCC Ref: CCC/267
ISBN: 978–92–9029–590-7
Copyright: © IEA Clean Coal Centre
Published Date: July 2016
IEA Clean Coal Centre 14 Northfields London SW18 1DD United Kingdom
Telephone: +44(0)20 8877 6280
www.iea-coal.org

IEA Clean Coal Centre – Emission standards and control of PM2.5 from coal-fired power plant 3
Preface
This report has been produced by IEA Clean Coal Centre and is based on a survey and analysis of published literature, and on information gathered in discussions with interested organisations and individuals. Their assistance is gratefully acknowledged. It should be understood that the views expressed in this report are our own, and are not necessarily shared by those who supplied the information, nor by our member countries.
IEA Clean Coal Centre is an organisation set up under the auspices of the International Energy Agency (IEA) which was itself founded in 1974 by member countries of the Organisation for Economic Co-operation and Development (OECD). The purpose of the IEA is to explore means by which countries interested in minimising their dependence on imported oil can co-operate. In the field of Research, Development and Demonstration over fifty individual projects have been established in partnership between member countries of the IEA.
IEA Clean Coal Centre began in 1975 and has contracting parties and sponsors from: Australia, Austria, China, the European Commission, Germany, India, Italy, Japan, Poland, Russia, South Africa, Thailand, the UK and the USA. The Service provides information and assessments on all aspects of coal from supply and transport, through markets and end-use technologies, to environmental issues and waste utilisation.
Neither IEA Clean Coal Centre nor any of its employees nor any supporting country or organisation, nor any employee or contractor of IEA Clean Coal Centre, makes any warranty, expressed or implied, or assumes any legal liability or responsibility for the accuracy, completeness or usefulness of any information, apparatus, product or process disclosed, or represents that its use would not infringe privately-owned rights.
IEA Clean Coal Centre – Emission standards and control of PM2.5 from coal-fired power plant 4
Abstract
Fine particulate matter, PM2.5, can include SO2, NOx, toxic volatile organic compounds, heavy metals, water
and biogenic organic species. PM2.5 can be emitted directly or form in the atmosphere from the reactions of
other pollutants. Coal-fired power plants are a major source of PM2.5. There are international and national
emission standards to limit PM2.5. The standards for Australia, China, Germany, India, Indonesia, Japan,
South Africa, Thailand and the USA are described. There are various ways to measure PM2.5 in the
atmosphere. The emission of PM2.5 from coal-fired plants can be controlled pre-combustion, in-combustion
and post-combustion. Pre-combustion control is by coal selection and coal preparation. In-combustion
control is by optimising combustion and the injection of sorbents into the flame zone. There are various
methods of post-combustion control of PM2.5 emissions, including conventional particle emission control
devices (PECD) such as electrostatic precipitators (ESP) and fabric filters, and innovative PECDs such as
flue gas conditioning and wet ESPs. Other methods of post-combustion control include agglomeration,
various hybrid systems, and multi-pollutant control systems. Recent developments in PM emission control
technologies are reviewed.

IEA Clean Coal Centre – Emission standards and control of PM2.5 from coal-fired power plant 5
Acronyms and abbreviations AAQ ambient air quality
AAQS ambient air quality standards
AHPC Advanced Hybrid Collector
BACT best available control technology
BAT best available technology
BAT-AELs BAT associated emission levels
BHEL Bharat Heavy Electricals Limited (India)
BREF BAT reference document
CAA Clean Air Act (USA)
CAIR Clean Air Interstate Rule (USA)
CEN Comité European de Normalization
COHPAC Collector Compact Hybrid Particulate Collector
CPCB Central Pollution Control Board (India)
CPM condensable particulate matter
CSAPR Cross-State Air Pollution Rule (USA)
DEA Department of Environmental Affairs (South Africa)
EC European Commission
ELV emission limit value
EFF ESP-FF hybrid system
EPA Environmental Protection Agency (USA)
EPA Environment Protection Authority (Australia)
EPRI Electric Power Research Institute (USA)
ESFF electrostatically stimulated fabric filter
ESP electrostatic precipitators
EU European Union
FF fabric filter
FGC flue gas conditioning
IED Industrial Emissions Directive (EU)
IPPC integrated pollution prevention and control
ISO International Organization for Standardization
LCPD Large Combustion Plant Directive (EU)
LAER lowest achievable emissions rate
MEP Ministry of Environmental Protection (China)
MOE Ministry of the Environment (Japan)
MSC multistage collector
NAAQS National Ambient Air Quality Standards (USA)
NDRC National Development Reform Commission (China)
NEA National Energy Administration (China)
NEPC National Environment Protection Council (Australia)
NEPM National Environment Protection Measure (Australia)
NHMRC National Health and Medical Research Council (Australia)
NPC National People's Congress (China)
NSPS New Source Performance Standards (USA)
NSW New South Wales (Australia)
PCD Pollution Control Department (Thailand)
PJFF pulse jet fabric filter
PM particulate matter
IEA Clean Coal Centre – Emission standards and control of PM2.5 from coal-fired power plant 6
PM10 particulate matter below 10 μm in diameter
PM2.5 particulate matter below 2.5 μm in diameter
POEO Protection of the Environment Operations (Australia)
PSD Prevention of Significant Deterioration (USA)
SIP State Implementation Plan (USA)
SPL sound pressure level
TEOM tapered element oscillating microbalance
TNP Transitional National Plan (USA)
TSP total suspended particulate
VOC volatile organic compound
WESP wet electrostatic precipitator
WHO World Health Organisation

IEA Clean Coal Centre – Emission standards and control of PM2.5 from coal-fired power plant 7
Contents Preface 3
Abstract 4
Acronyms and abbreviations 5
Contents 7
List of Figures 8
List of Tables 9
1 Introduction 10
2 PM2.5 emission standards 12 2.1 Australia 13 2.2 China 17 2.3 European Union 20 2.4 Germany 24 2.5 India 26 2.6 Indonesia 27 2.7 Japan 27 2.8 South Africa 28 2.9 Thailand 30 2.10 USA 30 2.11 Comments 35
3 Standard methods for sampling and measurement 38 3.1 The basics of sampling and measuring 39 3.2 International and national standards 43
3.2.1 International standards 43 3.2.2 USA 48 3.2.3 Canada 51 3.2.4 Other countries 52
3.3 Comments 52
4 Control technologies 53 4.1 Pre-combustion control 54
4.1.1 Coal type selection 54 4.1.2 Coal preparation 54
4.2 In-combustion control 55 4.2.1 Combustion optimisation 55 4.2.2 Injection of sorbents into the flame zone 56
4.3 Post-combustion control 56 4.3.1 Conventional particle emission control devices 56 4.3.2 Innovations in PECD technologies 57 4.3.3 Agglomeration 62 4.3.4 Hybrid systems 64 4.3.5 Multi-pollutant control systems 69
4.4 Comments 70
5 Discussion and conclusions 71
6 References 74
IEA Clean Coal Centre – Emission standards and control of PM2.5 from coal-fired power plant 8
List of Figures Figure 1 PM2.5, NOx, and SO2 emissions by the sector group in Europe in 2013 11
Figure 2 A PM2.5 cyclone and how it works 40
Figure 3 An impactor and how it works 40
Figure 4 Separation curves of PM10 and PM2.5 specified in ISO 7708:1995 44
Figure 5 Design of PM2.5 in-stack sampling system by use of impactor 44
Figure 6 Design of virtual impactor sampling train 46
Figure 7 In-stack combined PM10 and PM2.5 cyclone basic sampling train 46
Figure 8 In-stack combined PM10 and PM2.5 cyclones with dilution sampling train 47
Figure 9 Schematic of US Method 201A sampling train 49
Figure 10 Schematic of US Method 202 CPM sampling train 50
Figure 11 Modification of conventional PECDs with WESP 59
Figure 12 Schematic flow of electrostatic FF 62
Figure 13 Schematics of COHPAC and COHPAC II 65
Figure 14 Schematic of EFIC installed at Baoshan power plant 66
Figure 15 Feida EFF system at Huaneng Taichang, left, and Anpeila, right, power plants 67
Figure 16 Schematic representation of the ESFF installation at Plant Miller 68

IEA Clean Coal Centre – Emission standards and control of PM2.5 from coal-fired power plant 9
List of Tables Table 1 Air quality guidelines for NO2, SO2 and PM 12
Table 2 Australian emission limits guidelines for NOx, SOx and PM from coal-fired power plants 14
Table 3 South Australian emission limits for NOx, SOx and PM from coal-fired power plants 15
Table 4 Tasmania emission limits for NOx, SOx and PM from new and upgraded coal-fired power plants 15
Table 5 Victoria emission limits for NOx, SOx and PM from stationary sources 16
Table 6 NSW emission limits for NOx, SOx and PM from coal-fired plants 17
Table 7 China AAQS for PM, SO2 and NOx for residential and industrial areas 18
Table 8 ELVs for air pollutants from coal-fired power plants 19
Table 9 Guideline on BAT and control levels for PM 20
Table 10 ELVs from IED (2010/75/EU) for NOx, SO2 and dust from existing coal and lignite combustion plants 21
Table 11 ELVs from IED (2010/75/EU) for NOx, SO2 and dust from new and retrofitted coal and lignite combustion plants 22
Table 12 Minimum rate of desulphurisation from IED (2010/75/EU) for combustion plants 22
Table 13 NOx emission BAT-ELVs from the draft LCP BREF 23
Table 14 SO2 emission BAT-ELVs from the draft LCP BREF 23
Table 15 Dust emission BAT-ELVs from the draft LCP BREF 23
Table 16 German ELVs for NOx, SO2 and PM for new coal-fired power plants with thermal input greater than 50 MW 25
Table 17 German ELVs for NOx, SO2 and PM for existing coal-fired power plants with thermal input greater than 50 MW 26
Table 18 Emission standards for NO2, SO2 and PM from Indian coal-fired power plants 27
Table 19 Emission standards for SO2, NOx and PM for Indonesian coal-fired power plants 27
Table 20 Emission standards for soot and dust emission from coal boilers 28
Table 21 South African AAQS for PM2.5 29
Table 22 South African emission standards for solid fuel combustion installations 29
Table 23 Emission standards for NOx, SO2 and PM for coal-fired power plants in Thailand 30
Table 24 History of the NAAQS for particulate matter 32
Table 25 EPA current NAAQS for SO2 and NOx 33
Table 26 NSPS for coal-fired power plant 34
Table 27 International and national air quality standards 36
Table 28 Selected countries’ emission standards for NOx, SOx and PM from coal-fired power plants 37
Table 29 Major design differences between a wet and dry ESP 60

Introduction
IEA Clean Coal Centre – Emission standards and control of PM2.5 from coal-fired power plant
10
1 Introduction
Considerable efforts have been made over the years to regulate, control and prevent the emission of
pollutants from coal-fired power plants. The coal industry is facing stringent emission regulations, to limit
the release of sulphur dioxide (SO2), oxides of nitrogen (NOx), toxic volatile organic compounds (VOCs),
heavy metals such as mercury, and particulate matter (PM). PM can contain any or all of the aforementioned
chemical species or their compounds, plus water and biogenic organic species. The chemical composition
of PM varies with coal type, power plant design and location, and also with ambient conditions such as
temperature and wind direction.
PM is usually classified by particle size because of the wide variation and complexity of its chemical
composition. In this report, the following definitions are used:
PM1 particles less than 1 m in diameter, known as ultra-fine or submicron particles;
PM2.5 particles less than 2.5 m in diameter, fine particles;
PM10 particles less than 10 m in diameter, coarse particles.
The surface area of the smallest particles is greater than that of larger ones. For example, one gramme of
0.1 μm particles has a surface area of 60 square metres, 10 times the surface area of a gramme of 1 μm
particles. The large surface area means that fine PM2.5 can be enriched in toxic substances. Due to their
small size, PM2.5 particles can remain suspended in the air for several days to a week or more, and tend to
be more homogeneously distributed with distance from the emission source. PM2.5 can be inhaled into
human respiratory systems and travel deep into the lungs causing health problems, such as lung cancer
and other cardiopulmonary diseases. A significant fraction of the PM2.5 particles have a diameter near the
wave length of light, so that they scatter light efficiently and reduce visibility (Pui and others, 2014). This
makes PM2.5 a major cause of smog in cities and elsewhere.
PM2.5 are usually classified as primary and secondary particles. Primary PM2.5 particles are those that are
emitted directly to the air from stationary or moving sources. Secondary PM2.5 are formed from reactions
with gaseous pollutants, such as SOx, NOx, NH3, and VOCs, through nucleation, condensation, coagulation
and evaporation of water droplets in which the gases are dissolved and reacted. Primary PM2.5 and the
precursors of secondary fine particulates, SO2 and NOx, are emitted into the atmosphere from various
sources, including coal-fired power plants. Figure 1 shows the share of PM2.5, NOx and SO2 emissions by
sector group in the European Union (EU) emitted in 2013. Only 6% of PM2.5 was from energy production
and distribution, but 56% of SO2 and 21% of NOx came from this source (European Environment Agency,
2015). However, the composition of PM2.5 is mostly dominated by sulphates and nitrates formed from SOx
or NOx precursors. Therefore, coal-fired power plants contribute significantly to PM2.5 concentrations in
the air through the emission of SOx and NOx. According to the Chinese National Bureau of Statistics, in 2005,
PM emissions from coal-fired power plants accounted for 44.6% of total PM emissions in China (Yao and
others, 2009). Control of PM emissions and their precursors from coal-fired power plant are necessary to

Introduction
IEA Clean Coal Centre – Emission standards and control of PM2.5 from coal-fired power plant
11
mitigate their environmental and health impacts, especially in countries where coal is the main energy
source for power generation, such as China, India and South Africa.
Figure 1 PM2.5, NOx, and SO2 emissions by the sector group in Europe in 2013 (European Environment Agency, 2015)
During the last decade, a large amount of research and development has been carried out on PM, especially
on PM2.5. Emission regulations and testing and measuring standards for PM2.5 have been developed and
implemented. Following the 2005 World Health Organisation (WHO) guidelines on PM2.5, some countries
and the EU have implemented emission standards for stationary sources. The International Organization
for Standardization (ISO) has issued three PM2.5 measurement standards, and the US Environmental
Protection Agency (EPA) has also updated its measuring methods to specifically include PM2.5. These
developments are reviewed in this report.
The report begins by describing international and selected countries’ national air quality and PM emission
standards for stationary sources that are relevant to coal-fired power plants. Emission standards for SO2
and NOx are included since they are precursors of secondary fine PM. International and national
measurement standards are summarised in Chapter 3. Finally, recent developments in PM emission control
technologies are reviewed.

PM2.5 emission standards
IEA Clean Coal Centre – Emission standards and control of PM2.5 from coal-fired power plant
12
2 PM2.5 emission standards
Clean air is considered to be a basic requirement for human health and well-being. The World Health
Organisation (WHO) has produced air quality guidelines for reducing the health impacts of air pollution
worldwide. The WHO guidelines updated in 2005 include thresholds and limits for PM, NO2 and SO2, shown
in Table 1 (WHO, 2006). Based on known health effects, both 24-hour (short-term) and annual mean (long-
term) guidelines are needed as indicators of PM pollution. For SO2, the recommended guideline values are
not linked to those for PM. The 24-hour guideline might be difficult for some countries to achieve, so a
stepped approach using an interim goal of 50 μg/m3 for controlling vehicle emissions, industrial emissions
and/or emissions from power production is recommended.
Table 1 Air quality guidelines for NO2, SO2
and PM (WHO, 2006)
Pollutants Time period ELVs, μg/m3
NO2 1 hour 200
annual 40
SO2 10 minutes 500
24 hours 20
PM2.5 24 hours 25
annual 10
PM10 24 hours 50
annual 20
Air quality standards are regulatory measures designed to achieve a desired level of air quality by
regulating the amount of pollutants that can be emitted from a facility. Emission standards have had a major
influence on cutting emissions from coal-fired power plants and other sources. Most commonly, parties
establish emission standards and emission limit values (ELVs) based on the best available technologies
(BAT), and require emission data to be reported as specified in the standards.
When Sloss (2004) reviewed the importance of PM10/2.5 for IEA CCC in 2004, there were no international
emission standards or guidelines which applied directly to emissions of PM2.5 from coal-fired utilities. The
WHO did not have guidelines for PM2.5 emission control. In Europe, a working group under the Clean Air
Europe programme had issued a draft recommendation that PM2.5 should be made the principle metric for
assessing exposure to particles, and suggested in 2010 an annual average limit of 12‒20 g/m3 and a
24-hour average limit of 35 g/m3 that should not be exceeded on more than 10 days per year. Few
countries had set up a national limit for fine particulates. The US EPA issued national ambient air quality
standards in 1997 with annual limits of 15 g/m3 and daily limits of 65 g/m3 for PM2.5. But the Supreme
Court ruled that the US EPA could not start implementing the standards until the US EPA and the states had
collected at least three years of monitoring data to determine areas of non-compliance.

PM2.5 emission standards
IEA Clean Coal Centre – Emission standards and control of PM2.5 from coal-fired power plant
13
During the last decade, particulate matter emission regulations, especially for PM10 and PM2.5, have
developed rapidly. Today, PM2.5 from coal-fired power plants are regulated as PM in many countries. Ten
countries and regions have been selected for further discussion. They are either IEA CCC member countries
or amongst the 15 top coal consuming countries in the world (IEA, 2014). The emission standard
information is mainly taken from the IEA CCC emission standards database, unless otherwise stated. Since
a large portion of total PM2.5 is made up of secondary particles, such as sulphate and nitrate particles formed
through chemical reactions, legislation on SO2 and NOx emissions are relevant to PM2.5 control, and
therefore are included. Standards for power plants smaller than 50 MW are not covered in this report.
2.1 Australia
Australia does not have national air quality emissions standards. Instead Environment Protection
Authorities in the States and Territories set such standards. The Australian National Environment
Protection Measures (NEPMs) were set up by the National Environment Protection Council (NEPC).
Implementation of these measures falls to State and Territory Environment Protection Authorities (EPAs).
These can adopt broader or more stringent standards than those provided for by the NEPMs, but may not
adopt lower standards. The two NEPMs relevant to air pollutants are the National Environment Protection
(Ambient Air Quality) Measure (Australian NEPC, 2003) and the National Environment Protection (National
Pollutant Inventory) Measure 1998 (Australian NEPC, 2008).
The National Environment Protection (Ambient Air Quality) Measure (Air NEPM) was established in June
1998. It provides a nationally consistent framework for monitoring and reporting six criteria air pollutants,
namely carbon monoxide, nitrogen dioxide, ozone, sulphur dioxide, lead and particulate matter (PM10). In
2003 it was amended to include fine particulate matter, PM2.5. The Air NEPM sets national air quality
standards for each of these pollutants, which are legally binding, except the standards for PM2.5 which are
only advisory. A review was released by the Australian NEPC (2011) in September 2011 which lists
23 recommendations, including the introduction of compliance standards for PM2.5. In April 2014,
Ministers signalled their intention to vary the Air NEPM for particles to reflect the latest scientific
understanding of the health risks. Consequently, a more stringent reporting standard for particle pollution
(PM2.5 and PM10) may be established. The Environment Ministers are working towards establishing a
National Clean Air Agreement. This will focus on actions to reduce air pollution and improve air quality
through cooperative action between industry and government at the national, state and local level. The
Agreement will incorporate a range of existing, new and complementary measures to improve air quality.
The discussion paper, Working towards a National Clean Air Agreement, was released in February 2015. On
15 July 2015, the State Environment Ministers committed to finalise the Agreement and its initial work plan
before the end of 2015 (Australian Department of Environment, 2015).
The Air NEPM set a current goal for ambient air quality. The guidelines for PM2.5 are 25 μg/m3 for annual
and 8 μg/m3 for 24 hours which are in line with the WHO. The guidelines for NOx and SO2 concentrations
in air are measured in ppm and are weaker than those for the WHO and the EU. The annual average for NOx
is 62 μg/m3 comparing to 40 μg/m3 for both the WHO and the EU.

PM2.5 emission standards
IEA Clean Coal Centre – Emission standards and control of PM2.5 from coal-fired power plant
14
The current National Environment Protection (National Pollutant Inventory) Measure, published in 2008,
lists 93 reportable substances. Industrial facilities that use or produce any of these substances (according
to specified thresholds) are required to estimate and report emissions every year. These include emissions
of nitrogen oxides, sulphur dioxide, PM10 and PM2.5 from power plants.
The National Guidelines for Control of Emission of Air Pollutants from New Stationary Sources was first
published by the National Health and Medical Research Council (NHMRC) in 1985 and was rescinded on
29 February 2000 (NHMRC, 2000). The guidelines set emission limits from industrial processes but only
covered new plants and installations. The limits for coal-fired power plants are listed in Table 2 as reference.
However, unlike other countries, the limit for SOx only covers sulphuric acid mist and sulphur trioxides,
measured as SO3.
Table 2 Australian emission limits guidelines for NOx, SOx and PM from coal-fired power plants (Australia NHMRC, 2000)
Pollutant Plant type Emission limits, mg/m3
NOx (as NO2) Power generating boiler >30 MWe 800
SOx (as SO3) Fuel burning equipment 200
PM All power plant boilers 80
As mentioned above, each Australian state and territory has its own Environmental Protection Act under
which regulations and emission standards are set up by the independent statutory body, namely the EPA.
Victoria introduced its Environment Protection Act in 1970, while the Northern Territory’s Act only came
into force in November 2014. The rest of the states and territories issued their Environment Protection
Acts between 1986 to 1997. There are no specific regulations for emissions from stationary sources in the
Australian Capital Territory and Queensland. The Northern Territory follows the national AQS of the
Ambient Air Quality NEPM, and has set up a monitoring plan for the six criteria air pollutants (Australian
Northern Territory EPA, 2001). Western Australia only has a limit of 0.25 ppm per year for SO2 emissions
in the Goldfields residential area (Australian WA EPA, 2003).
Under the Environment Protection Act 1993, the EPA in South Australia set out the Environment Protection
(Air Quality) Policy 1994 and amended it in 2005 (Australian SA EPA, 2005). The emission limits relevant
to coal combustion equipment are listed in Table 3.

PM2.5 emission standards
IEA Clean Coal Centre – Emission standards and control of PM2.5 from coal-fired power plant
15
Table 3 South Australian emission limits for NOx, SOx and PM from coal-fired power plants (Australian SA EPA, 2005)
Pollutant Plant size Emission limits, mg/m3
NOx (as NO2) ≥250 MWe 7001
Sulphuric acid mist and SO3 (as SO3) any 100
PM ≥100 MJ/h 2502 1 Reference conditions are 0°C, 101.3 kPa on a dry flue gas basis with 7% O2 in the flue
gas (calculated as NO2) 2 Reference conditions are 0°C, 101.3 kPa on a dry flue gas basis with 12% CO2 in the
flue gas
The jurisdiction of the EPA in Tasmania includes environmental management and pollution control matters
deriving from the Environmental Management and Pollution Control Act 1994. The emission limit (specified
as in-stack concentrations) for pollutants discharged to the atmosphere are set out in the Environment
Protection Policy (Air Quality) 2004 (Australian TAS EPA, 2004). It was reviewed in May 2015 but no
changes were made. The emission limits given in the policy relevant to coal combustion equipment are
shown in Table 4 but only apply to new installations and facility upgrades.
Table 4 Tasmania emission limits for NOx, SOx and PM from new and upgraded coal-fired power plants (Australian TAS EPA, 2004)
Pollutant Plant size Emission limits, mg/m3
NOx (as NO2) <30 MWe 500
≥30 MWe 800
Sulphuric acid mist and SO3 (as SO3) any 100
PM any 100
Reference conditions are 0°C, 101.3 kPa on a dry flue gas basis with 7% O2 in the flue gas (calculated as NO2).
The limits do not apply to boilers with a heating capacity (as determined by the apparatus by which it is heated) of less than 110 MJ/h.
In Victoria, the State Environment Protection Policy (Ambient Air Quality) sets air quality objectives and
goals for Victoria (Victoria Government, 1999). Victoria adopted the requirements of the National
Environment Protection (Ambient Air Quality) Measure, discussed earlier.
The State Environment Protection Policy (Air Quality Management) established the framework for managing
emissions into the air in Victoria from all sources (Australian Victoria Government, 2001). It addresses
ambient (or regional) air quality, the management of particular sources such as industry, and local air
quality impacts. Emission limits applicable for coal combustion equipment are given in Table 5. More
stringent emission limits have been set for new stationary sources in the Air Quality Control Regions,
namely Port Philip Air Quality Control Region and Latrobe Valley Air Quality Control Region. There is a
separate NOx emission limit for new coal-fired power plants. A new stationary source is one in which
development works are yet to commence. (Reference conditions for the emission limit values are 0°C, 101.3
PM2.5 emission standards
IEA Clean Coal Centre – Emission standards and control of PM2.5 from coal-fired power plant
16
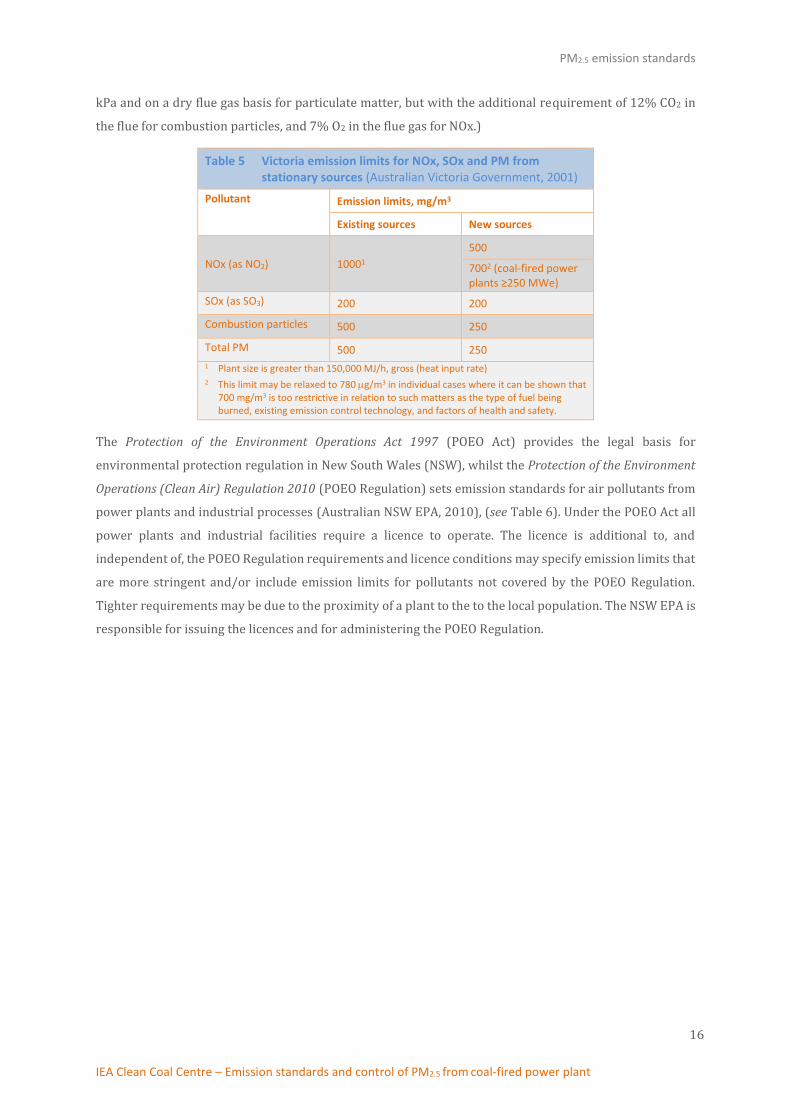
kPa and on a dry flue gas basis for particulate matter, but with the additional requirement of 12% CO2 in
the flue for combustion particles, and 7% O2 in the flue gas for NOx.)
Table 5 Victoria emission limits for NOx, SOx and PM from stationary sources (Australian Victoria Government, 2001)
Pollutant Emission limits, mg/m3
Existing sources New sources
NOx (as NO2) 10001
500
7002 (coal-fired power plants ≥250 MWe)
SOx (as SO3) 200 200
Combustion particles 500 250
Total PM 500 250 1 Plant size is greater than 150,000 MJ/h, gross (heat input rate) 2 This limit may be relaxed to 780 g/m3 in individual cases where it can be shown that
700 mg/m3 is too restrictive in relation to such matters as the type of fuel being burned, existing emission control technology, and factors of health and safety.
The Protection of the Environment Operations Act 1997 (POEO Act) provides the legal basis for
environmental protection regulation in New South Wales (NSW), whilst the Protection of the Environment
Operations (Clean Air) Regulation 2010 (POEO Regulation) sets emission standards for air pollutants from
power plants and industrial processes (Australian NSW EPA, 2010), (see Table 6). Under the POEO Act all
power plants and industrial facilities require a licence to operate. The licence is additional to, and
independent of, the POEO Regulation requirements and licence conditions may specify emission limits that
are more stringent and/or include emission limits for pollutants not covered by the POEO Regulation.
Tighter requirements may be due to the proximity of a plant to the to the local population. The NSW EPA is
responsible for issuing the licences and for administering the POEO Regulation.

PM2.5 emission standards
IEA Clean Coal Centre – Emission standards and control of PM2.5 from coal-fired power plant
17
Table 6 NSW emission limits for NOx, SOx and PM from coal-fired plants (Australian NSW EPA, 2010)
Pollutant Plant type ELV, mg/m3
NOx (as NO2)
Any activity or plant (except boilers, gas turbines and stationary reciprocating internal combustion engines listed below)
Group 1, 2, 3, or 4 2500
Group 5 2000
Group 6 350
Boiler used in connection with an electricity generating system with a capacity of less <30 MW
Group 1, 2, 3, or 4 2500
Group 5 or 6 500
Turbine used in connection with an electricity generating system with a capacity of ≥10 MW but < 30 MW
Group 1, 2, 3, or 4 2,500
Group 5 150
Group 6 90
SOx (as SO3)
Group 1 200
Group 2, 3, 4, 5 or 6 100
Total PM
Group 1 400
Group 2, 3, 4 250
Group 5 100
Group 6 50
The emission values are measured hourly. Reference conditions for the emission limit values relating to:
Group 1, 2, 3 or 4 facilities are 0°C, 101.3 kPa and on a dry flue gas basis with 12% CO2 in the flue gas
for particulate and 0°C, 101.3 kPa and on a dry flue gas basis for NOx
Group 5 or 6 facilities are 0°C, 101.3 kPa and on a dry flue gas basis with 7% O2 in the flue gas.
The plants in the different groups are classified by the date they started operation and the date of their
pollution control approval was granted. Group 5 power plants started operation on or after 1 August 1997,
and group 6 power plants started on or after 1 September 2005. Details can be found in NSW EPA POEO
Regulation (2010) and on the IEA CCC emission standards database.
2.2 China
In China the Ministry of Environmental Protection (MEP is responsible for setting air quality standards.
The Committee of the National People’s Congress (NPC) issues the law.
In 1987, the NPC council enacted the Law on the Prevention and Control of Atmospheric Pollutants, which
was revised in 1995 and 2000. China implemented the Environmental Protection Law in 1989 and made a
first amendment in 2014, after 25 years. It established the framework for protecting the environment,
including setting standards, assessing and limiting environmental impacts, fines for pollution, and bans on
polluting technologies and facilities.
PM2.5 emission standards
IEA Clean Coal Centre – Emission standards and control of PM2.5 from coal-fired power plant
18
The Air Pollution Protection Law was implemented in 2000. In August 2015, draft amendments of this law
were passed by the NPC with the purpose of strengthening pollution treatment from the source. The new
law requires local governments to adjust the energy structure, promote clean and efficient use of coal, and
ban low-quality coal for residential and domestic use. It also requires all coal-fired power plants to install
emission control devices rather than only control emissions when the limits are exceeded. Mercury
emission control was introduced for the first time (China NPC, 2015).
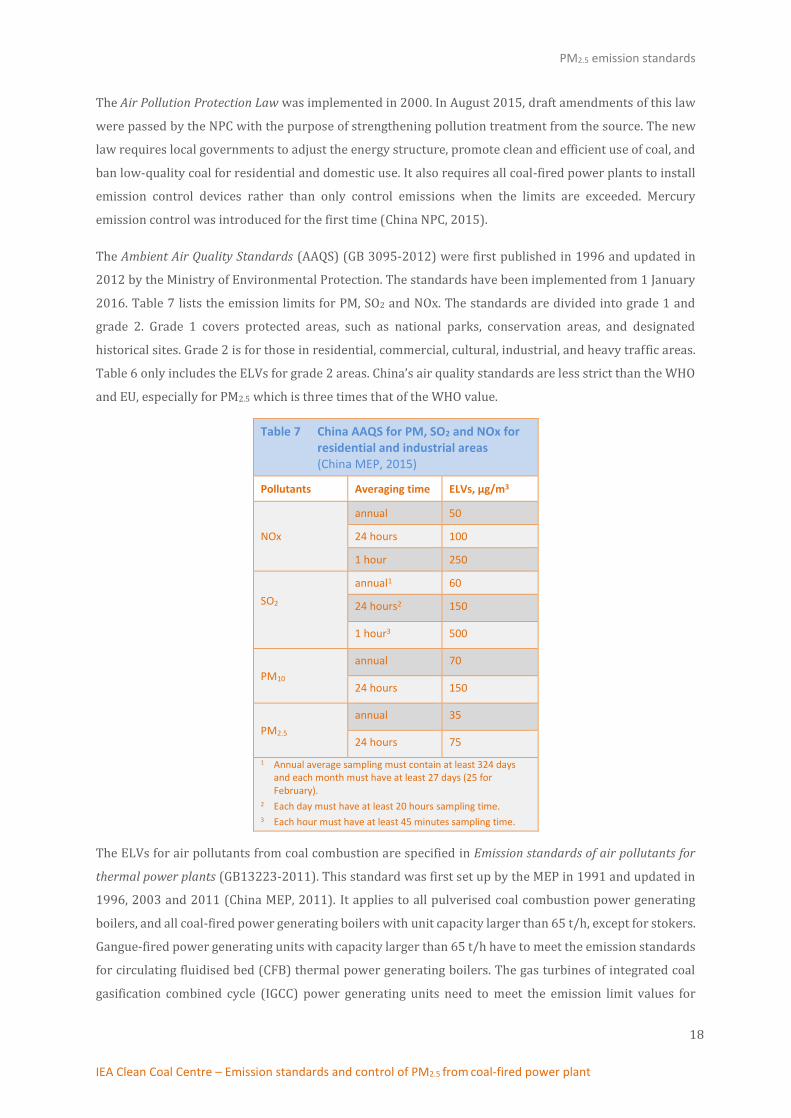
The Ambient Air Quality Standards (AAQS) (GB 3095-2012) were first published in 1996 and updated in
2012 by the Ministry of Environmental Protection. The standards have been implemented from 1 January
2016. Table 7 lists the emission limits for PM, SO2 and NOx. The standards are divided into grade 1 and
grade 2. Grade 1 covers protected areas, such as national parks, conservation areas, and designated
historical sites. Grade 2 is for those in residential, commercial, cultural, industrial, and heavy traffic areas.
Table 6 only includes the ELVs for grade 2 areas. China’s air quality standards are less strict than the WHO
and EU, especially for PM2.5 which is three times that of the WHO value.
Table 7 China AAQS for PM, SO2 and NOx for residential and industrial areas (China MEP, 2015)
Pollutants Averaging time ELVs, μg/m3
NOx
annual 50
24 hours 100
1 hour 250
SO2
annual1 60
24 hours2 150
1 hour3 500
PM10
annual 70
24 hours 150
PM2.5
annual 35
24 hours 75
1 Annual average sampling must contain at least 324 days and each month must have at least 27 days (25 for February).
2 Each day must have at least 20 hours sampling time. 3 Each hour must have at least 45 minutes sampling time.
The ELVs for air pollutants from coal combustion are specified in Emission standards of air pollutants for
thermal power plants (GB13223-2011). This standard was first set up by the MEP in 1991 and updated in
1996, 2003 and 2011 (China MEP, 2011). It applies to all pulverised coal combustion power generating
boilers, and all coal-fired power generating boilers with unit capacity larger than 65 t/h, except for stokers.
Gangue-fired power generating units with capacity larger than 65 t/h have to meet the emission standards
for circulating fluidised bed (CFB) thermal power generating boilers. The gas turbines of integrated coal
gasification combined cycle (IGCC) power generating units need to meet the emission limit values for

PM2.5 emission standards
IEA Clean Coal Centre – Emission standards and control of PM2.5 from coal-fired power plant
19
natural gas-fired turbines. The ELVs for PM, SO2 and NOx are given in Table 8. Key economic regions have
stricter standards. The key regions include Beijing City, Tianjin City, Hebei Province, Yangzi River Delta,
Pearl River Delta, Central Liaoning Province, Shandong Province, Wuhan City and surrounding areas,
Changsha City, Zhuzhou City, Xiangtan City, Chengdu and Chongqing City, coastal areas of Fujian Province,
Central and Northern Shanxi Province, Guanzhong Region of Shaanxi Province, Gansu Province, Ningxia
Province, and Wulumuqi (Ürümqi, Xinjiang Uyghur Autonomous Region). The ELVs came into effect from
1 January 2012 for new plants and 1 July 2014 for existing plants. Existing plants are those which were in
operation or had environmental permissions granted before 1 January 2012. New plants refer to new,
upgraded or retrofitted plants whose environmental permissions were granted after 1 January 2012. All
ELVs are calculated at reference conditions of 0°C, 101.3 kPa and dry flue gas basis with 6% O2.
Table 8 ELVs for air pollutants from coal-fired power plants (China MEP, 2011)
Pollutant Application ELV, mg/m3 Location of monitoring
NOx (as NO2) all 100 (2001)
Stack and flue
key regions 100
SO2
new 100 (2002)
existing 200 (4002)
key regions 50
PM
all 30
key regions 20 1 ELVs apply to arch fired furnaces, existing CFB power generating boilers, and
power generating boilers commissioned or received approval for construction before 31 December 2003.
2 ELVs apply to plants in Guangxi Zhuang Autonomous Region, Chongqing Municipality, Sichuan Province and Guizhou Province.
China MEP (2010) issued a Guideline on Best Available Technologies of Pollution Prevention and Control for
Coal-fired Power Plant Industry (on Trial). It listed the best available technologies to control PM, SOx and
NOx, including their control efficiency.
The National Development Reform Commission (NDRC), MEP and National Energy Administration (NEA)
jointly issued an action plan for coal-fired power plants for the same period on 12 September 2014 to
reinforce the Energy Development Strategy Action Plan (2014-2020) which was published by the Chinese
State Council (2014), The aim is to reduce China’s high energy consumption through a set of measures and
mandatory targets, and to promote more efficient, self-sufficient, green and innovative energy production
and consumption. The plan specifies even stricter emission limits for future coal-fired power plants in
11 provinces in the developed eastern region: PM 10 mg/m3, SO2 35 mg/m3, and NOx 50 mg/m3. All the
existing coal power plants are required to upgrade and reconstruct their equipment and systems to meet
these emission limits by 2020. For the central region, future plants shall meet these ELVs in principle.
Western China is encouraged to meet these ELVs (NDRC and others, 2014). In order to speed up the air
quality improving process, NDRC, MEP and NEA jointly issued another document on 11 December 2015
called the Working Programme to Implement Ultralow Emission and Energy Saving Reconstruction for Coal
PM2.5 emission standards
IEA Clean Coal Centre – Emission standards and control of PM2.5 from coal-fired power plant
20
Power Plants. In this working programme, the date to meet the ELVs has been brought forward to 2017 for
the developed eastern region, 2018 for the central region, and 2020 for the less developed western region.
By 2020, the whole country should meet these strict emission limits. All the power generation plants should
be ultra-supercritical with capacity ≥ 600 MW (NDRC and others, 2015).
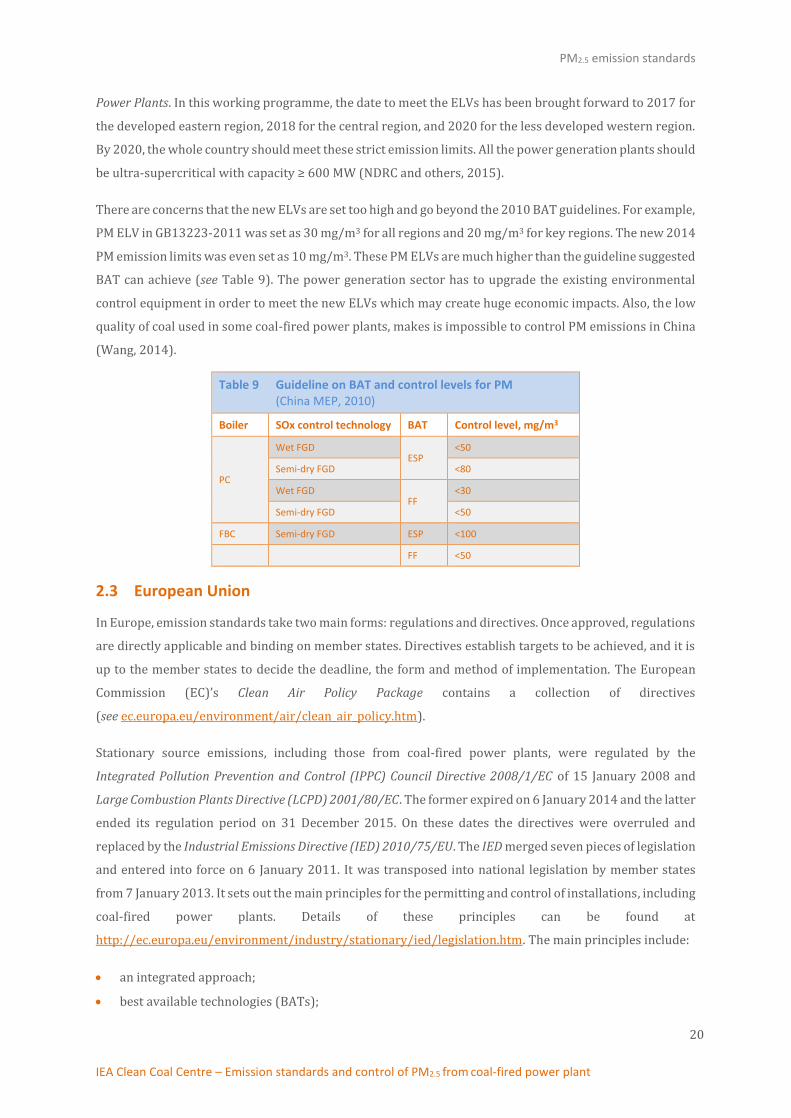
There are concerns that the new ELVs are set too high and go beyond the 2010 BAT guidelines. For example,
PM ELV in GB13223-2011 was set as 30 mg/m3 for all regions and 20 mg/m3 for key regions. The new 2014
PM emission limits was even set as 10 mg/m3. These PM ELVs are much higher than the guideline suggested
BAT can achieve (see Table 9). The power generation sector has to upgrade the existing environmental
control equipment in order to meet the new ELVs which may create huge economic impacts. Also, the low
quality of coal used in some coal-fired power plants, makes is impossible to control PM emissions in China
(Wang, 2014).
Table 9 Guideline on BAT and control levels for PM (China MEP, 2010)
Boiler SOx control technology BAT Control level, mg/m3
PC
Wet FGD ESP
<50
Semi-dry FGD <80
Wet FGD FF
<30
Semi-dry FGD <50
FBC Semi-dry FGD ESP <100
FF <50
2.3 European Union
In Europe, emission standards take two main forms: regulations and directives. Once approved, regulations
are directly applicable and binding on member states. Directives establish targets to be achieved, and it is
up to the member states to decide the deadline, the form and method of implementation. The European
Commission (EC)’s Clean Air Policy Package contains a collection of directives
(see ec.europa.eu/environment/air/clean_air_policy.htm).
Stationary source emissions, including those from coal-fired power plants, were regulated by the
Integrated Pollution Prevention and Control (IPPC) Council Directive 2008/1/EC of 15 January 2008 and
Large Combustion Plants Directive (LCPD) 2001/80/EC. The former expired on 6 January 2014 and the latter
ended its regulation period on 31 December 2015. On these dates the directives were overruled and
replaced by the Industrial Emissions Directive (IED) 2010/75/EU. The IED merged seven pieces of legislation
and entered into force on 6 January 2011. It was transposed into national legislation by member states
from 7 January 2013. It sets out the main principles for the permitting and control of installations, including
coal-fired power plants. Details of these principles can be found at
http://ec.europa.eu/environment/industry/stationary/ied/legislation.htm. The main principles include:
an integrated approach;
best available technologies (BATs);

PM2.5 emission standards
IEA Clean Coal Centre – Emission standards and control of PM2.5 from coal-fired power plant
21
flexibility;
inspections; and
public participation.
The binding emission limits in IED are based on what the BATs can achieve. BAT conclusions set out what
BAT should be for a particular sector and give a set of associated emission levels (BAT-AELs). The BATs
and BAT-AELs are defined in BAT reference documents (BREF). The member states permit writers in the
relevant authorities have to set emission limit values (ELVs) on the basis of BAT-AELs to ensure full
compliance with the LCP BREF.
Chapter III (with Annex V) of the IED sets out special provisions for certain pollutant emissions from
combustion plants with a total rated thermal input equal to or greater than 50 MW, irrespective of the type
of fuel used. The new ELVs set by IED for large combustion plants are more stringent than the values set
within the old LCPD. These legislated ELVs are valid from 7 January 2014 for new installations and
retrofitted plants and from 1 January 2016 for existing installations. However, during the interim period,
individual member states can introduce a Transitional National Plan (TNP) for existing plants to ease the
transition. There is still no specific limit for PM2.5 from coal-fired power plant, just an overall PM (dust)
limit. Table 10 lists ELVs from the IED for dust, SO2 and NOx from existing coal- and lignite-fired power
plants, and Table 11 does the same for new and retrofitted power plants. Existing plants refer to
installations where their permit was granted before 7 January 2013 or the operator of which had submitted
a complete application prior to this date and such plants were put into operation no later than 7 January
2014. New plants refer to installations entering into operation after 7 January 2014. Retrofitted plants refer
to those plants which had been granted an exemption by Directive 2001/80/EC, but had been retrofitted
and would be in operation after 1 January 2016. The concentrations of dust, SO2, and NOx have to be
measured continuously. All ELVs are calculated at a temperature of 0°C, 101.325 kPa and on a dry flue gas
basis with 6% of O2 (European Commission, 2010, European Commission, 2001).
Table 10 ELVs from IED (2010/75/EU) for NOx, SO2 and dust from existing coal and lignite combustion plants (European Commission, 2010)
Total rated thermal input, MW
ELV, mg/m3
NOx SO2 Dust
50‒100 3001 400 30
100‒300 200 250 25
>300 200 200 20 1 450 mg/m3 in case of pulverised lignite combustion.
Notes:
Combustion plants using solid fuels put into operation no later than 27 November 2003, and which do not operate more than 1500 operating hours per year as a rolling average over a period of 5 years, shall be subject to an ELV for SO2 of 800 mg/m3.
Combustion plants using solid fuels, with a total rated thermal input not exceeding 500 MW, put into operation no later than 27 November 2003, and which do not operate more than 1500 operating hours per year as a rolling average over a period of 5 years, shall be subject to an ELV for NOx of 450 mg/m3.
Combustion plants using solid fuels with a total rated thermal input greater than 500 MW, which were granted a permit before 1 July 1987 and which do not operate more than 1500 operating hours per year as a rolling average over a period of 5 years, shall be subject to an ELV for NOx of 450 mg/m3.

PM2.5 emission standards
IEA Clean Coal Centre – Emission standards and control of PM2.5 from coal-fired power plant
22
Table 11 ELVs from IED (2010/75/EU) for NOx, SO2 and dust from new and retrofitted coal and lignite combustion plants (European Commission, 2010)
Total rated thermal input, MW
ELV, mg/m3
NOx SO2 Dust
50‒100 3001 400 20
100‒300 200 200 20
>300 1502 1503 10 1 400 mg/m3 in case of pulverised lignite combustion. 2 200 mg/m3 in case of pulverised lignite combustion. 3 200 mg/m3 in case of circulating or pressurised fluidised bed combustion.
The IED allows combustion plants firing indigenous solid fuel that cannot comply with the ELVs for SO2 due
to the characteristics of the fuel, to instead apply the minimum rates of desulphurisation, given in Table 12.
Table 12 Minimum rate of desulphurisation from IED (2010/75/EU) for combustion plants (European Commission, 2010)
Total rated thermal input, MW
Minimum rate of desulphurisation, %
Existing and in operation prior to 20031
Other existing New and retrofitted
50‒100 80 92 93
100‒300 90 92 93
>300 96 96 97 1 Plants which were granted a permit before 27 November 2002 or the operators of which had submitted a complete
application for a permit before that date, provided that the plant was put into operation no later than 27 November 2003.
The standards in the LCP BREF are scheduled to be revised every eight years. The latest one was published
in 2006 which was two years behind the update schedule. The updating process started in 2011 and a draft
updated LCP BREF was published in July 2013 (European IPPC Bureau, 2016). In April 2015, the EC’s IPPC
Bureau released a new draft LCP BREF for the technical working group to discuss. EU member states were
expected to vote on the proposal by the end of 2015, followed by formal adoption in January 2016. The new
ELVs in the LCP BREF are expected to be implemented by member states between January 2016 and
January 2020. By the end of this period, new ELVs need to be applied at the plant level. One significant
change in the new draft is that the BAT-ELVs are to be measured by yearly average and daily average
(averaged over the sampling period) rather than continuously. It also creates a new power plant thermal
capacity category of 1000 MW for dust emissions. Tables 13, 14, 15 list the BAT-AELs for NOx, SO2 and dust,
respectively for coal- and lignite-fired power plants taken from the new draft LCP BREF downloaded from
the Ministry of Environment of Poland website:
http://ippc.mos.gov.pl/ippc/custom/LCPBATconclusionsfinal(1).pdf. The definition for ‘new plant’ is a
combustion plant first permitted (pursuant to the provisions in Articles 4 and 5 of Directive 2010/75/EU)
at the installation, or a complete replacement of a combustion plant on the existing foundations of the
installation after the publication of the new LCP BREF. ‘Existing plant’ refers to a combustion plant which
is not a new plant.

PM2.5 emission standards
IEA Clean Coal Centre – Emission standards and control of PM2.5 from coal-fired power plant
23
Table 13 NOx emission BAT-ELVs from the draft LCP BREF (European IPPC Bureau, 2016)
Total rated thermal input, MW
Annual average1, mg/m3 Daily average or average over the sampling period, mg/m3
New plants Existing plants1 New plants Existing plants
<100 100‒150 100‒270 155‒200 165‒330
100‒300 50‒100 100‒180 80‒130 155‒210
≥300 FBC boiler firing coal and/or lignite and lignite-fired PC boiler
50‒85 85‒150 80‒125 140‒165
≥300 coal-fired PC boiler 65‒85 65‒150 80‒125 2002 1 These BAT-ELVs do not apply when plants operate at <1500 h/y. 2 In the case of plants put into operation no later than 7 January 2014, the higher end of the range is 200 mg/m3.
Table 14 SO2 emission BAT-ELVs from the draft LCP BREF (European IPPC Bureau, 2016)
Total rated thermal input, MW
Annual average1, mg/Nm3 Daily average for new plants, mg/m3
Daily average or average over the sampling period for existing plants, mg/m3
New plants Existing plants1
<100 150‒200 150‒360 170‒220 170‒400
100‒300 80‒150 80‒200 135‒200 135‒220
≥300 PC boiler 10‒75 10‒130 25‒110 25‒1652
≥300 FBC boiler3 20‒75 20‒180 25‒110 50‒220 1 These BAT-ELVs do not apply to plants operated at <1500 h/y. 2 The higher end of the BAT-AEL range is 220 mg/m3 in the case of plants operated in peak or emergency load modes. 3 For circulating fluidised bed boilers, the lower end of the range can be achieved by using a high efficiency wet FGD system.
The higher end of the range can be achieved by using boiler in-bed sorbent injection.
Table 15 Dust emission BAT-ELVs from the draft LCP BREF (European IPPC Bureau, 2016)
Total rated thermal input, MW
Annual average, mg/m3 Daily average or average over the sampling period, mg/m3
New plants Existing plants New plants Existing plants
100‒300 2‒5 2‒14 3‒15 4‒22
300‒1000 2‒5 2‒10 3‒10 3‒11
≥1000 2‒5 2‒8 3‒10 3‒11
These BAT-ELVs do not apply to plants operated at <1500 h/y.
At the time of writing this report (February 2016), the draft LCP BREF is still under discussion. The
European Environmental Bureau thinks that the standards are set at too low a level and will constitute a
lowering of environmental standards in force in the 2006 LCP BREF for existing large coal- or lignite-fired
power plants (Wates, 2015). However, some think that the new ELVs are stricter than the old ones (Flynn,
2015; Ottery, 2015). This means that coal plant operators will have to invest in technologies to clean up
their emissions. For instance, as ENDS Europe reported, the Czech Republic has warned that the draft BREF
could have a severe economic impact on some countries, with particular concern over the BAT associated

PM2.5 emission standards
IEA Clean Coal Centre – Emission standards and control of PM2.5 from coal-fired power plant
24
emission levels for SOx on lignite-fired power plants. The Polish energy lobby group has also recently
voiced its strong concerns that the LCP BREF will cost the Polish power sector almost €5 billion to update
its ageing coal-burning fleet – with NOx and SO2 emissions the main areas of dispute (Flynn, 2015).
2.4 Germany
Germany is a member state of the European Union and is therefore bound by the emission legislation
summarised in Section 2.3. Its air quality and energy related policies are created and managed by the
Federal Ministry for Environment, Nature Conservation and Nuclear Safety and revolve around the Federal
Immission Control Act. Following the initial enforcement in 1974, there have been many multiple
amendments and ordinances to the Act, affecting a wider range of industries. In May 2013, the regulations
for the implementation of the EU Industrial Emissions Directive (2010/75/EU) came into force. These
contain rules on authorisation, operation, closure and monitoring of industrial plants. Approximately
9,000 units are affected (IEA CCC, 2014; Infozentrum UmweltWirtschaft, 2013). To meet the requirements
of European law the following EU legislation has been transposed and enacted into German law:
1. National Emission Ceilings for Certain Atmospheric Pollutants Directive (NECD - 2001/81/EC) via
the 39 BlmSchV, Regulation on ambient air quality standards and emission ceilings.
2. Regulations for the implementation of the EU directive of the European Parliament and the Council
on Industrial Emissions (Integrated Pollution Prevention and Control) (Recast) (2010/75/EU) has
been transposed and separated into three parts, a legislative Act and two regulations:
i. Act for the Implementation of the Directive on Industrial Emissions from 8 April 2013,
published in Bundesgesetzblatt Teil I 2013 Nr, 17 vom 12.04.2013 pg 734-752;
ii. Regulation to Implement the Directive on Industrial Emissions, Amending the Regulations on
Pollution Control and Fault Advisor Ordinance and adopting the Decree from 2 May 2013,
published in Bundesgesetzblatt Teil I 2013 No, 21 vom 02.05.2013 pg 973-1020.
3. Large Combustion Plant Directive (LCPD – 2001/80/EC) via 13 BImSchV, Ordinance on Large
Combustion Plants, Gas Turbines and Internal Combustion Engine Systems.
Power plants with a thermal input greater than 50 MW are regulated by the 13 BImSchV, Ordinance on
Large Combustion Plants, Gas Turbines and Internal Combustion Engine Systems (see Table 16) for new
plants and Table 17 for existing plants). This document was updated recently, on 31 August 2015. New
plants are those built after 7 January 2014. Existing plants refer to plants which were in operation before
7 January 2014 or had a license granted before 7 January 2013 and were in operation after 7 January 2014.
By 31 December 2012, plants which did not meet the regulation had to close. All of the above emission limit
values are obtained at 0°C and 101.3 kPa at 6% O2 in flue gas.

PM2.5 emission standards
IEA Clean Coal Centre – Emission standards and control of PM2.5 from coal-fired power plant
25
Table 16 German ELVs for NOx, SO2 and PM for new coal-fired power plants with thermal input greater than 50 MW (IEA CCC, 2015)
Pollutants Plant size, MWth ELV, mg/m3
24 hours Half hourly Annual
NOx1(as NO2)
50‒100 300 (400 pulverised lignite) 600 (800 pulverised lignite) 250
100‒300 200 400 100
>300 150 (200 pulverised lignite) 300 (400 pulverised lignite) 100
SOx2 (as SO2)
50‒100 4003 (3504 fluidised bed) 8003 (7004 fluidised bed)
100‒300 2005 4005
>300 150 (200 circulating or pressurised fluidised bed)6
300 (400 circulating or pressurised fluidised bed)6
Dust all 10 20 10 (>300 MWth) 1 NOx includes NO and NO2. 2 SOx includes SO2 and SO3. 3 An alternative desulphurisation rate of 93% must be achieved if the stated ELV cannot be met by reasonable effort due to the sulphur
content of the indigenous fuels. 4 A desulphurisation rate of at least 75% must also be achieved. 5 A desulphurisation rate of at least 85% must also be achieved. An ELV value of 300 mg/m3 for the daily mean value and 600 mg/m3 for
the half-hourly mean value shall apply and additionally a desulphurisation rate of at least 93% of the daily mean value must be achieved, if the stated daily and half-hourly mean ELV cannot be met by reasonable effort due to the sulphur content of the indigenous fuels.
6 A desulphurisation rate of at least 85% must also be achieved. An ELV of 400 mg/m3 for the daily mean value and 800 mg/m3 for the half-hourly mean value applies and additionally a desulphurisation rate of at least 97% of the daily mean value must be achieved, if the stated daily and half-hourly mean ELV cannot be met by reasonable effort due to the sulphur content of the indigenous fuels.

PM2.5 emission standards
IEA Clean Coal Centre – Emission standards and control of PM2.5 from coal-fired power plant
26
Table 17 German ELVs for NOx, SO2 and PM for existing coal-fired power plants with thermal input greater than 50 MW (IEA CCC, 2015)
Pollutants Plant size, MWth ELV, mg/m3
24 hours Half hourly Annual
NOx1
50‒100 3003 (450 pulverised lignite) 6003 (900 pulverised lignite)
100‒300 2004 4004
>300 200 400
SOx2
50‒1005 4006 (3507 fluidised bed) 8006 (7007 fluidised bed)
100‒300 2008 4008
>300 2009 4009
Dust all 20 40 10 (>300 MWth) 1 NOx includes NO and NO2. 2 SOx includes SO2 and SO3. 3 For plants which do not operate for more than 1500 operating hours per year as a rolling average over a period of 5 years, an ELV of
450 mg/m3 for the daily mean value and 900 mg/m3 for the half-hourly average must be achieved. 4 For plants which do not operate for more than 1500 operating hours per year as a rolling average over a period of 5 years, an ELV of
400 mg/m3 for the daily mean value and 800 mg/m3 for the half-hourly average must be achieved. 5 An alternative desulphurisation rate of at least 92% of the daily mean value must be achieved if the stated ELV cannot be met by
reasonable effort due to the sulphur content of the indigenous fuels. 6 For plants which do not operate for more than 1500 operating hours per year as a rolling average over a period of 5 years, an ELV of
800 mg/m3 for the daily mean value and 1600 mg/m3 for the half-hourly average must be achieved. 7 A desulphurisation rate of at least 75% must be achieved. 8 A desulphurisation rate of at least 75% for fluidised bed combustion and at least 60% for other combustion types must also be
achieved. For plants (except fluidised bed combustion) which do not operate for more than 1500 operating hours per year as a rolling average over a period of 5 years, an ELV of 800 mg/m3 for the daily mean value and of 1600 mg/m3 for the half-hourly average must be achieved. The requirements for the rate of desulphurisation remain unaffected. An ELV of 300 mg/m3 for the daily mean value and 600 mg/m3 for the half-hourly mean value applies and additionally a desulphurisation rate of at least 92% of the daily mean value must be achieved, if the stated daily and half-hourly mean ELV cannot be met by reasonable effort due to the sulphur content of the indigenous fuels.
9 A desulphurisation rate of at least 85% must also be achieved. For plants which do not operate for more than 1500 operating hours per year as a rolling average over a period of 5 years, an emission limit value of 300 mg/m3 for the daily mean value and 600 mg/m3 for the half-hourly average must be achieved. The requirements for the rate of desulphurisation remain unaffected. An ELV of 400 mg/m3 for the daily mean value and 800 mg/m3 for the half-hourly mean value shall apply and additionally a desulphurisation rate of at least 96% of the daily mean value must be achieved, if the stated daily and half-hourly mean ELV cannot be met by reasonable effort due to the sulphur content of the indigenous fuels.
2.5 India
The Indian national ambient air quality standards were implemented in 2009 by the Central Pollution
Control Board (CPCB), a division of the Ministry of Environment and Forests (Indian CPCB, 2009).
Compared to those of the WHO and EU, the Indian PM2.5 standard is less strict (60 g/m3 for 24 hours and
40 g/m3 for annual) but the NOx and SO2 standards are in line. According to the Environment (Protection)
Act, 1986 (Ministry of Environment and Forests, 1986), the CPCB set the Standards for emission or discharge
of environmental pollutants from various industries, which covers particulate matter from thermal power
plants (Indian CPCB, 2015). The PM emission limit is 150 mg/m3 for power plants with a capacity of equal
or greater than 210 MW and 350 mg/m3 for those smaller than 210 MW. There are no emission limits for
SO2 and NOx. However, minimum stack heights are specified in order to disperse sulphur dioxide. New
emission standards for coal-fired power plants are currently being debated (see Table 18).

PM2.5 emission standards
IEA Clean Coal Centre – Emission standards and control of PM2.5 from coal-fired power plant
27
Table 18 Emission standards for NO2, SO2 and PM from Indian coal-fired power plants (Muthukrishnan, 2015)
Pollutants ELV, mg/m3
Plants installed before 2003
Plants installed between 2003 and 2016
Plants installed after January 2017
NOx 600 300 100
SO2 600 (<500MW) 200 (≥500MW) 100
PM 100 50 30
2.6 Indonesia
In the national ambient air quality standards for Indonesia, PM is measured as total suspended particulate
(TSP). The annual measurement for TSP is 90 g/m3, which is very high compared to 10 g/m3 for the WHO
(even though it is for PM2.5). The NOx and SO2 standards (24 hours average 150 g/m3 and 365 g/m3
respectively) are also weak compared to the WHO and EU. Emission standards for stationary sources,
including coal-fired power plants, were first introduced by the Ministry of Environment (MOE) in 1988 and
were updated in 1995 and 2008 (see Table 19). Existing power plants and those in development before the
decree was issued should comply with the 1995 standards. The standards for new power plants are stricter
and those under construction before 1 January 2015 have to comply with the 2008 standards. Power plants
must meet these emission standards 95% of the time over 3 months. The reference conditions are different
from some other countries being 25°C at 101.3kPa on a dry flue gas with 7% of O2 in the flue gas.
Table 19 Emission standards for SO2, NOx and PM for Indonesian coal-fired power plants (IEACCC, 2015)
Power plant SO2, mg/m3 NOx (as NO2), mg/m3
PM, mg/m3
Old coal-fired power plants and those in development before enactment
750 850 150
New coal-fired power plants and those under construction before enactment by 1 January 2015
750 750 100
2.7 Japan
Formed in 2001 the Ministry of the Environment (MOE) in Japan is responsible for establishing and
implementing environmental policy, regulations on air pollution control, monitoring and management,
setting up the basic environmental plan, the regional environmental pollution control programme, and so
on. The Basic Environment Law was enacted in November 1993. In December 1994, an action plan called
the Basic Environment Plan was adopted. The plan systematically clarifies the measures to be taken by
national and local governments, as well as actions to be carried out by citizens, businesses and private
organisations. It also defines the roles of parties involved, and the ways and means for effectively pursuing
environmental policies. The Air Quality Standards have been amended over the years, and the current
standard for PM2.5 is 35 g/m3 for 24 hours and 15 g/m3 for annual. NOx and SO2 are measured in ppm
and are in line with the WHO guidelines (Japan MOE, 2015a).

PM2.5 emission standards
IEA Clean Coal Centre – Emission standards and control of PM2.5 from coal-fired power plant
28
The emission standards for coal-fired power plants are given in the Regulatory measures against air
pollutants emitted from factories and business sites and the outline of regulation (Japan MOE, 2015b). All
ELVs are calculated at a temperature of 0°C, and a pressure of 101.3 kPa. For soot and dust, there is a
general standard and a special standard. General standards are national standards that apply to existing
plants. Special standards are tighter and apply to new plants in the defined areas (see Table 20). According
to Myllyvirta (2015), the best performing power plants in Japan can achieve emissions of 4‒5 mg/m3 for
PM.
Table 20 Emission standards for soot and dust emission from coal boilers (Japan MOE, 2015b)
Capacity, m3/h General standard, mg/m3 Special standard, mg/m3
≥200,000 100 50
40,000–200,000 200 100
<40,000 300 150
Heating area:10 m2 or above
The same NOx ELVs apply to both existing and new power plants as below (the NOx ELVs have been
converted into mg/m3 for comparison purposes):
Capacity, m3/h Emission standard, mg/m3
≥700,000 410 (200 ppm)
40,000–700,000 513 (250 ppm)
<40,000 614 (300 ppm)
The Japanese emission standard for sulphur oxides is more complicated. The allowable discharge amount
of sulphur oxides (as SO2) depends on the area in which the plant is situated, and is calculated according to
the following equation:
q = K x 10-3 x He2
where: q is the permissible hourly emission volume of sulphur oxides (m3/h); He is the effective height (in
metres) of the stack and equals the sum of the actual height of the stack and the smoke (exhaust gas) ascent
height; and K is a constant - its value varies according to the region where the plant is located.
The advantage of this standard is that it allows more stringent regulations in vulnerable areas by making
K smaller. Limits on the total amount of SO2 are also set for each area and/or plant based on the total
emission reduction plan. The K values are listed at the MOE website:
https://www.env.go.jp/en/air/aq/air/air3_table.html.
2.8 South Africa
The South African National Environmental Management Air Quality Act (No. 39 of 2004) was issued in
February 2005 (South Africa, 2005). It mandates the norms, standards, mechanisms, systems and
procedures for air quality improvement. It also establishes the national framework within which these

PM2.5 emission standards
IEA Clean Coal Centre – Emission standards and control of PM2.5 from coal-fired power plant
29
standards will be created, giving the Minister of Environmental Affairs or the members of the Executive
Council of a province (MEC) the authority to issue standards, enforce regulations and other measures and
implement penalties for noncompliance, and establish ‘funding arrangements’. Schedule 2 of the Act No. 39
of 2004 gave the ambient air quality standards. It was repealed in the Act No. 20 of 2014: National
Environmental Management: Air Quality Amendment Act, 2014 (South Africa, 2014). But no report can be
found mentioning the repeal of the National Ambient Air Quality Standard for Particulate Matter of
Aerodynamic Diameter Less Than 2.5 Micron Metre (PM2.5) (see Table 21) which was issued by the
Department of Environment Affairs (DEA) in June 2012 (DEA, 2012a).
Table 21 South African AAQS for PM2.5 (DEA, 2012a)
Averaging time
ELV, μg/m3 Frequency of exceedance
Compliance date
24 hours
65
4
Immediate – 31 December 2015
40 1 January 2016 – 31 December 2029
25 1 Jan 2030
1 year
25
0
Immediate – 31 December 2015
20 1 January 2016 – 31 December 2029
15 1 January 2030
ELV is expressed at 25°C and 101.3 kPa
Under Act No. 39 of 2004, the Department of Environmental Affairs set up regulations relating to Listed
Activities and Associated Minimum Emission Standards in which the emission limit values for combustion
plants with a thermal input greater than 50 MW are included (see Table 22). The Minimum Emission
Standards were first issued in 2010, and then amended in November 2012 (South Africa DEA, 2012b). The
standards apply to both permanently operated plants and experimental (pilot) plants. New plants in the
standards refer to plants that applied for authorisation on or after 1 April 2010, while existing plants are
those operating or that had applied for authorisation before 1 April 2010. New plants had to comply with
the standards as soon as they were issued. Existing plants had until 1 April 2015 to comply, but have to
meet the emission standards for new plants by 1 April 2020 (DEA, 2015b). However, these compliance
timeframes have been postponed because industries felt the standards were too strict to be met by the
2015 deadline.
Table 22 South African emission standards for solid fuel combustion installations (DEA, 2012b)
Pollutant ELV, mg/m3
New plants Existing plants
NOx (as NO2) 750 1100
SO2 500 3500
PM 50 100
Continuous monitoring under reference conditions of 0°C, 101.3 kPa and dry flue gas basis with 10% of O2

PM2.5 emission standards
IEA Clean Coal Centre – Emission standards and control of PM2.5 from coal-fired power plant
30
2.9 Thailand
The ambient air quality standards for Thailand have separate values for PM2.5, PM10, and total suspended
particulates. The PM2.5 value for Thailand is the same as the EU’s but the standards for NOx (320 g/m3 for
1 hour and 57 g/m3 for annual) and SO2 (780 g/m3 for 1 hour and 300 g/m3 for 24 hours) are weaker
(Thailand PCD, 2015).
In Thailand, emission standards are set by the Pollution Control Department of the Ministry of Natural
Resources and Environment under the authority of the Enhancement and Conservation of National
Environmental Act, B.E. 2535 (1992). Emission limits for new power plants operating after 5 January 2010
were published in the Royal Thai Government Gazette (volume 127, section 7D on 15 Jan 2010). New power
plants refer to plants generating, transmitting or distributing electricity that acquired a permit for
operation or expansion after 15 January 2010. Emission standards for existing power plants are also
covered in the Royal Thai Government Gazette (volume 121, section 113D, 7 Oct 2004), with special mention
of the Mae Moh power plant (see Table 23). Units 4-7 of the Mae Moh power plant are going to be replaced
by a single ultra-supercritical unit, which is planned to be operational in 2019. The ELVs are calculated at
25°C at 101.3kPa on a dry flue gas base, with 50% of excess air or 7% of O2 during combustion (IEA CCC,
2015).
Table 23 Emission standards for NOx, SO2 and PM for coal-fired power plants in Thailand (IEA CCC, 2015)
Power plant, MW NOx (as NO2), mg/m3 (ppm)
SO2,mg/m3 (ppm)
PM, mg/m3
New power plants
≤50 410 (200) 1030 (360) 80
>50 410 (200) 515 (180) 80
Existing power plants
Mae Moh units 4‒7 (4 x 150) and units 8‒13 (6 x 300)
1025 (500) 915 (320) 180
Other coal-fired plants of any size 820 (400) 2002 (700) 180
2.10 USA
The USA was the first country in the world to start regulating PM2.5. The air pollution control systems are
quite comprehensive; hence they will be discussed in detail. The Clean Air Act (CAA) of 1963 and its 1970
amendments form the basis for air pollution control legislation in the United States, authorising the
development of federal and state regulations to limit emissions from industrial sources and transportation.
The CAA requires the US Environmental Protection Agency (EPA) to set National Ambient Air Quality
Standards (NAAQS) for ambient levels of a range of pollutants (including particulate matter, SO2, NOx,
carbon monoxide, ozone, and lead), as well as emissions limits known as New Source Performance
Standards (NSPS) for new industrial sources of pollutants, such as coal plants.

PM2.5 emission standards
IEA Clean Coal Centre – Emission standards and control of PM2.5 from coal-fired power plant
31
Following a 1997 revision of the CAA in which the EPA issued the final PM2.5 NAAQS, further regulation of
new sources was introduced based on whether the NAAQS were met within their administrative region.
For ‘attainment areas’, a ruling for Prevention of Significant Deterioration (PSD) of the air quality requires
that the best available control technology (BACT) be implemented for new sources, while those in ‘non-
attainment areas’ are subject to the more stringent ‘lowest achievable emissions rate’ (LAER). These are
case-by-case assessments which essentially use the NSPS as baseline emissions limits, but usually require
much higher levels of abatement. A BACT assessment will determine the maximum degree of control that
can be achieved by a source within reasonable energetic and economic bounds, whether by abatement
technology or process changes such as fuel switching. This is based on analysis of emissions already
achieved by existing plants within the same category (for example pulverised coal plant). For LAER, a strict
limit is imposed without consideration of the economic or energetic penalty to the plant, and emissions
must often be offset against other emissions reductions in the region. These assessments, known
collectively as New Source Reviews, are generally conducted at the state level as part of State
Implementation Plans (SIP) for achieving and maintaining the NAAQS. These plans may also include limits
on plants built before 1971 that are exempt from the NSPS.
For PM, the first rules were promulgated in 1971 under the CAA. Since then, the PM standards have been
updated continually as the law requires EPA to periodically review them to ensure that they provide
adequate health and environmental protection. The development history of the NAAQS for PM during the
period 1971-2012 is given in Table 24. In December 2012, the EPA strengthened the primary annual
NAAQS for PM2.5 by setting the standard at 12 μg/m3, replacing the previous standard of 15 μg/m3, which
was set in 1997. The EPA retained the previous annual secondary standards at 15 μg/m3. The Agency also
retained the primary and secondary 24-hour standard at 35 μg/m3.

PM2.5 emission standards
IEA Clean Coal Centre – Emission standards and control of PM2.5 from coal-fired power plant
32
Table 24 History of the NAAQS for particulate matter (EPA, 2015a)
Final rule Primary/ secondary
Indicator Averaging time
Level, μg/m3
Form
1971
36 FR 8186
30 April 1971
Primary TSP1
24 hours 260 Not to be exceeded more than once per year
annual 75 Annual geometric mean
Secondary TSP
24 hours 150 Not to be exceeded more than once per year
annual 60 Annual geometric mean
1987
52 FR 24634
1 July 1987
Primary and secondary
PM10
24 hours 150 Not to be exceeded more than once per year on average over a 3-year period
annual 50 Annual arithmetic mean, averaged over 3 years
1997
62 FR 38652
18 July 1997
Primary and secondary
PM2.5
24 hours 65 98th percentile, averaged over 3 years
annual 15.0 Annual arithmetic mean, averaged over 3 years2, 3
PM10
24 hours 150 Initially promulgated 99th percentile, averaged over 3 years; when 1997 standards for PM10 were vacated, the form of 1987 standards remained in place (not to be exceeded more than once per year on average over a 3-year period)
annual 50 Annual arithmetic mean, averaged over 3 years
2006
71 FR 61144
17 Oct 2006
Primary and secondary
PM2.5
24 hours 35 98th percentile, averaged over 3 years4
annual 15.0 Annual arithmetic mean, averaged over 3 years5
PM10 24 hours6 150 Not to be exceeded more than once per
year on average over a 3-year period
2012
Primary
PM2.5
annual 12.0 Annual arithmetic mean, averaged over 3 years
Secondary annual 15.0 Annual arithmetic mean, averaged over
3 years
Primary and secondary
24 hours 35 98th percentile, averaged over 3 years
Primary and secondary
PM10 24 hours6 150 Not to be exceeded more than once per
year on average over a 3-year period 1 TSP = total suspended particles. 2 The level of the annual standard is defined to one decimal place (that is 15.0 µg/m3) as determined by rounding. 3 The level of the standard was to be compared to measurements made at sites that represent ‘community-wide air quality’
recording the highest level, or, if specific requirements were satisfied, to average measurements from multiple community-wide air quality monitoring sites (‘spatial averaging’).
4 The level of the 24-hour standard is defined as an integer (zero decimal places) as determined by rounding. 5 EPA tightened the constraints on the spatial averaging criteria by further limiting the conditions under which some areas may
average measurements from multiple community-oriented monitors to determine compliance. 6 EPA revoked the annual PM10 NAAQS in 2006.
After taking the important step on PM2.5 regulation in 2012, the EPA proposed a rule in November 2013 to
clarify PM2.5 implementation requirements to the states for 1997 and 2006 non-attainment areas. In April
2014, EPA classified as ‘moderate’ non-attainment areas for the 1997 and 2006 fine particle pollution
standards and set 31 December 2014 as the deadline for states to submit remaining implementation plan

PM2.5 emission standards
IEA Clean Coal Centre – Emission standards and control of PM2.5 from coal-fired power plant
33
requirements. In March 2015, EPA proposed requirements for implementing the NAAQS for PM2.5 in areas
that were designated non-attainment for these standards. These requirements would apply to current and
future fine particle pollution standards (EPA, 2015b). The new PM2.5 standard could lead to further
reductions in NOx and SO2 emissions. Current NAAQS for NOx and SO2 are listed in Table 25. The states
would have until 2020 to meet the 2012 revised annual PM2.5 standards.
Table 25 EPA current NAAQS for SO2 and NOx (EPA, 2015a)
Final rule Primary/ secondary
Averaging time
Level Form
NOx [75 FR 6474, 9 Feb 2010] [61 FR 52852, 8 Oct 1996]
primary 1 hour 100 ppb 98th percentile of 1-hour daily maximum concentrations, averaged over 3 years
primary and secondary
annual 53 ppb1 Annual mean
SO2
[75 FR 35520, 22 Jun 2010] [38 FR 25678, 14 Sept 1973]
primary 1 hour 75 ppb2 99th percentile of 1-hour daily maximum concentrations, averaged over 3 years
secondary 3 hours 0.5 ppm Not to be exceeded more than once per year
1 The official level of the annual NO2 standard is 0.053 ppm, equal to 53 ppb, which is shown here for the purpose of clearer comparison to the 1 hour standard.
2 Final rule signed 2 June 2010. The 1971 annual and 24 hour SO2 standards were also revoked in that same rulemaking. However, these standards remain in effect until one year after an area is designated for the 2010 standard, except in areas designated non-attainment for the 1971 standards, where the 1971 standards remain in effect until implementation plans to attain or maintain the 2010 standard are approved.
The NSPS have applied to all coal plants constructed, reconstructed, or significantly modified since
September 1971, and have become progressively more stringent since their first incarnation, with the most
recent revision applying to plants constructed after May 2011 (see Table 26). The NSPS are determined
under ISO conditions (namely temperature of 0°C, a relative humidity of 60%, and a pressure of 101.3 kPa
and average over a 24-hour period). Significantly, since 1978 the standards have required a percentage
reduction of SO2 emissions from unabated levels in addition to an absolute limit. The EPA generally
concentrates on enforcing the stricter, latter regulation.

PM2.5 emission standards
IEA Clean Coal Centre – Emission standards and control of PM2.5 from coal-fired power plant
34
Table 26 NSPS for coal-fired power plant (IEACCC, 2014)
Plant age NOx SO2 Particulate matter (PM)
1971 – 1978 300 ng/J heat input 520 ng/J heat input 43 ng/J heat input
Sep 1978–1997
Subbituminous: 210 ng/J heat input; Other coal types*: 260 ng/J heat input
520 ng/J heat input and 90% reduction (or 70% reduction where <260 ng/J);
180 ng/J gross output;
65 ng/J heat input
13 ng/J heat input
1978 – March 2005
New plant: 200 ng/J gross output;
Reconstructed: 65 ng/J heat input
Commenced construction: March 2005 – May 2011
130 ng/J gross output; 95% reduction
180 ng/J gross output 18 ng/J gross output;
6.4 ng/J heat input.
Or: 13 ng/J input and 99.9% reduction
Commenced reconstruction:
March 2005 – May 2011
130 ng/J gross output;
47 ng/J heat input; 95% reduction
180 ng/J gross output;
65 ng/J heat input
Modified: March 2005 – May 2011
180 ng/J gross output;
65 ng/J heat input; 90% reduction
180 ng/J gross output;
65 ng/J heat input
18 ng/J gross output;
6.4 ng/J heat input.
Or: 13 ng/J input and 99.8% reduction
Construction or reconstruction after: 3 May 2011
88 ng/J gross output;
95 ng/J net output
130 ng/J gross output;
140 ng/J net output;
97% reduction
11 ng/J gross output;
12 ng/J net input
Modified after: 3 May 2011
140 ng/J gross output 180 ng/J gross output;
90% reduction
18 ng/J gross output; 6.4 ng/J heat input.
Or: 13 ng/J input and 99.8% reduction
* except slag tap furnaces firing more than 25% lignite mined in North Dakota, South Dakota, or Montana (340 ng/J)
PM standard exceptions: Plant constructed before 2005 and without continuous emissions monitoring can meet an opacity limit of 20% (including 6 min/h of 27%).
NOx standard exceptions: Plant firing >75% coal refuse is exempt from NOx limits if constructed before 1997, and limits of 110 ng/J gross output and 120 ng/J net output apply if constructed after May 2011. For IGCC constructed 2005–2011, 130 ng/J gross output applies. Plant constructed after May 2011 can chose to meet alternative combined NOx and CO limits of 140 ng/J gross output and 150 ng/J net output.
SO2 standard exceptions: Plant using solid-solvent refined coal (520 ng/J and 85% reduction). Plant using 100% anthracite, classified as a resource recovery unit, or in a non-continental area (520 ng/J). Plant firing ≥75% coal refuse and, constructed since March 2005 (180 ng/J gross output, 94% reduction), reconstructed since March 2005 (180 ng/J gross output, 65 ng/J input, 94% reduction), modified since March 2005 (180 ng/J gross output, 65 ng/J input, 90% reduction).
A major amendment to the CAA in 1990 included the Acid Rain Program (ARP) aimed at significantly
reducing SO2 and NOx emissions from existing emitters through a cap-and-trade system. The first phase of
this programme ran from 1995 to 1999 and applied to 110 major sources. Allocated emissions allowances
were based on an emission rate of 2.5 lb/MBtu of SO2 and a plant’s average fuel consumption in the base
year, and were aimed at achieving an annual cap of 8.95 Mt/y (EPA, 2015c). A second phase from 2000
expanded the programme to all fossil fuel-fired boilers over 75 MWe and based allowances on 1.2 lb/MBtu
SO2. NOx emissions for coal-fired boilers were limited to:
tangentially-fired 0.40 lb/Mbtu dry bottom wall-fired 0.46 lb/Mbtu
cell burners 0.68 lb/Mbtu wet bottom 0.84 lb/Mbtu
cyclones 0.86 lb/Mbtu verticals 0.80 lb/Mbtu

PM2.5 emission standards
IEA Clean Coal Centre – Emission standards and control of PM2.5 from coal-fired power plant
35
The CAA's ‘good neighbour’ provision requires the EPA and the states to address interstate transport of air
pollution that affects downwind states' ability to attain and maintain the NAAQS. The EPA has administered
the NOX Budget Trading Program (NBP), the Clean Air Interstate Rule (CAIR), and the Cross-State Air
Pollution Rule (CSAPR). The NBP was a cap-and-trade programme created to reduce the regional transport
of NOx emissions from power plants and other large combustion sources in the eastern USA. The NBP began
in 2003 and was designed to reduce emissions during the warm summer months, referred to as the ozone
season, when ground level ozone concentrations are highest. It was a central component of the NOx SIP
Call, promulgated in 1998. From the beginning of its implementation in 2003 to 2008, the NBP dramatically
reduced NOx emissions from power plants and industrial sources during the summer months, contributing
significantly to improvements in levels of ozone in air quality. Beginning in 2009, the NBP was effectively
replaced by the ozone season NOx programme under the CAIR, which required further summertime NOx
reductions from the power sector (EPA, 2015d).
CAIR is a variant on the cap-and-trade system introduced in 2005 to respond to the fact that emissions can
also contribute to NAAQS violations in states downwind of the emitting source. It essentially lowered the
SO2 cap for 27 states and the District of Columbia by 70% by requiring three SO2 allowances in place of one.
Although finally implemented in 2008, legal proceedings by states and utilities have led the EPA to propose
the CSAPR as its replacement. The CSAPR was finalised by the EPA in July 2011 but vacated by the US Court
of Appeals for the District of Columbia (D.C.) Circuit in 2012. The EPA appealed the decision to the Supreme
Court, which reversed the D.C. Circuit’s decision in April 2014. CSAPR has been reinstated and the EPA
began to implement the Phase 1 SO2 and NOx requirements in January 2015. Phase 2 will begin in 2017.
However, on 28 July 2015, a ruling by the D.C. Circuit Court ordered the EPA to redo the overly strict SO2
and NOx standards for 13 upwind states, mostly in the South and Midwest. Texas and South Carolina would
see limits for both forms of pollution adjusted, while new limits for either SO2 or NOx would be set in
11 other states. In addition, the EPA proposed Federal Implementation Plans (FIPs) requiring more
stringent SO2 emission requirements for coal-fired power plants.
2.11 Comments
PM2.5 is made up of primary and secondary PM2.5. Secondary PM2.5 is formed from SOx, NOx, VOC and
ammonia that react chemically in the air. There is no a method yet to calculate or model secondary PM2.5
other than using SOx and NOx as surrogates. However, the impacts of SO2 and NOx controls on PM2.5
reduction are nonlinear and are dependent on location, magnitude, season, temperature and other factors.
All of the countries discussed in this chapter, apart from Indonesia, have regulated PM2.5 in their ambient
air quality standards (see Table 27). However, no country has a separate emission limit for PM2.5 from
coal-fired power plants. PM2.5 from coal combustion is still regulated as part of particulate matter.
Different countries base their standards on different time periods, ranging from hourly average to annual
averages. Germany also has half hourly average emission limit values. This affects the actual emission levels
resulting from a standard. For example, if a power plant had to stay below a certain limit for every hour of

PM2.5 emission standards
IEA Clean Coal Centre – Emission standards and control of PM2.5 from coal-fired power plant
36
the year, the operator would have to leave the room for hour-to-hour variations, resulting in a much lower
annual average than if the same limit had to be met on a yearly average basis. In fact, although the time
average period for ambient air quality standard is specified in detail, many countries do not clearly specify
the time average period for their emission standards for coal-fired power plants.
Table 27 International and national air quality standards
Country NOx, µg/m3 SOx, µg/m3 PM2.5, µg/m3
24 hrs annual 1 hr 24 hrs 24 hrs annual
WHO 200 40 200 20 25 10
EU 200 40 350 125 25
Australia 246 62 572 220 25 10
China 250 50 500 150 75 35
India 40 80 60
Indonesia 400 100 900 365 230 90
Japan 286 114 35 15
South Africa 200 40 350 125 40 20
Thailand 320 57 780 300 50 25
USA 205 109 214 35
The reference conditions vary from country to country. Most countries use 0°C and 101.3 kPa in dry flue
gas as the reference condition. But Indonesia and Thailand carry out their tests at 25°C. For NOx
measurement, the EU, China and South Africa, allow 6% O2 in dry flue gas while Australia, Indonesia and
Thailand allow 7% O2. Australia measures SOx as SO3, while other countries as SO2. Japan regulates sulphur
oxide emissions on the basis of a value estimated from a constant K, which varies according to the
designated area and the effective stack height.
Different countries also use different units. The USA set limits based emissions per unit of electricity
produced, while Japan and Thailand use parts per million in flue gas. The EU, Australia, China, Germany,
India, Indonesia and South Africa regulate pollutant concentration per cubic metre of flue gas.
Generally speaking, new plants have tougher ELVs. However, the definitions for new and existing power
plants are different from country to country. But most of the countries regulate pollutant emissions based
on the plant’s age. America has the most complicated age (eight) variations in their emission standard.
All these differences make the comparison of different countries’ emission standards almost impossible.
Based on the discussion in this chapter (see Table 28), currently, China has the toughest rules for coal-fired
power plants, although its air quality standards are less strict than those for the WHO and EU.
The emission standards for each country and region changes frequently. Each time it changes, it becomes
stricter. The binding emission limits should be based on what the BATs can achieve, and relate to associated
emission levels of BAT. The authorities set the emission limit values on the bases of BAT-AELs. ELVs that
exceed BAT-AELs, as they are unlikely to be met.
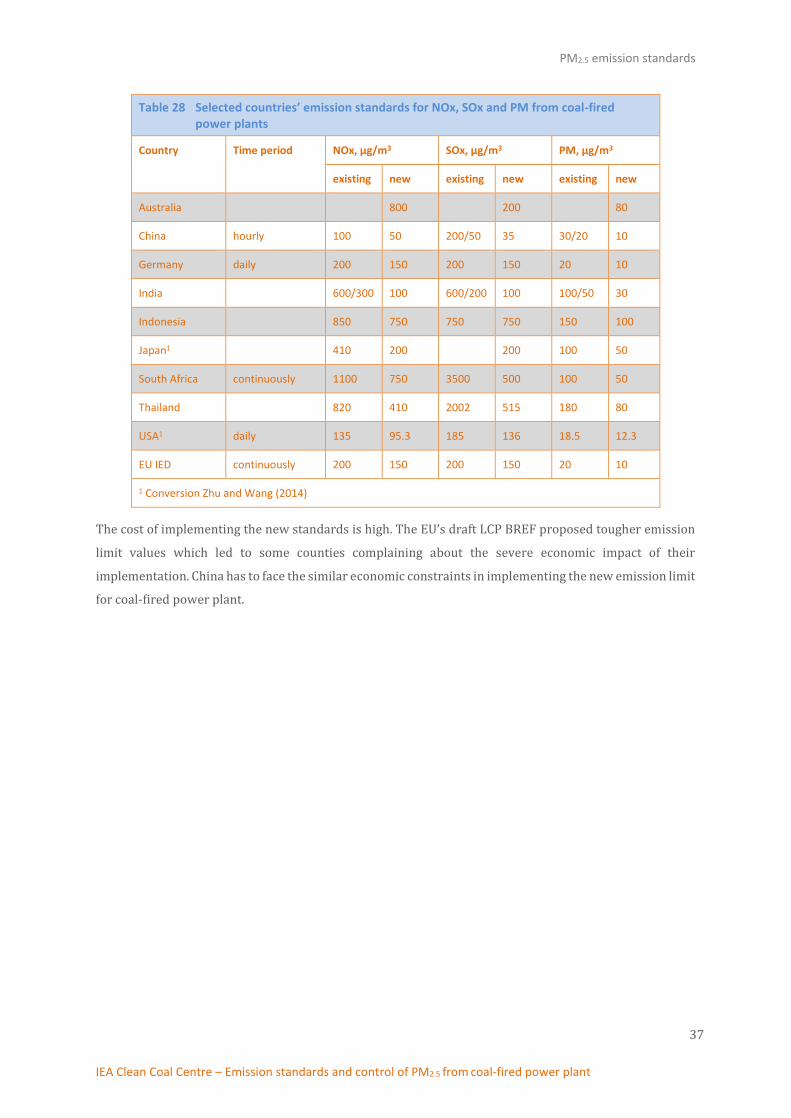
PM2.5 emission standards
IEA Clean Coal Centre – Emission standards and control of PM2.5 from coal-fired power plant
37
Table 28 Selected countries’ emission standards for NOx, SOx and PM from coal-fired power plants
Country Time period NOx, µg/m3 SOx, µg/m3 PM, µg/m3
existing new existing new existing new
Australia 800 200 80
China hourly 100 50 200/50 35 30/20 10
Germany daily 200 150 200 150 20 10
India 600/300 100 600/200 100 100/50 30
Indonesia 850 750 750 750 150 100
Japan1 410 200 200 100 50
South Africa continuously 1100 750 3500 500 100 50
Thailand 820 410 2002 515 180 80
USA1 daily 135 95.3 185 136 18.5 12.3
EU IED continuously 200 150 200 150 20 10
1 Conversion Zhu and Wang (2014)
The cost of implementing the new standards is high. The EU’s draft LCP BREF proposed tougher emission
limit values which led to some counties complaining about the severe economic impact of their
implementation. China has to face the similar economic constraints in implementing the new emission limit
for coal-fired power plant.

Standard methods for sampling and measurement
IEA Clean Coal Centre – Emission standards and control of PM2.5 from coal-fired power plant
38
3 Standard methods for sampling and measurement
Emissions legislation can only be complied with if sources of pollution are identified and appropriate
control measures taken. Without standard sampling and measurement methods, data from different
studies are not directly comparable. However, sampling and measuring of particulate matter, especially
PM2.5, at any source is not easy. Because of the presence of volatile and semi-volatile species, there is no
definitive description of what does and does not comprise PM2.5. It is assumed that all material caught in a
designated PM2.5 sampler will be PM2.5 and will not react with other captured species or re-volatilise
between sampling and final analysis. Sampling conditions must be controlled to avoid the formation of
artefacts because some of the sample may be reaction products and/or temperature or moisture sensitive
species. It is important that the results of any particulate measurement study make it clear which sampling
method was used and which species (particulate and/or condensable species, primary or secondary
particulates) are included in the measurement. Sloss (1998, 2004) carried out comprehensive reviews on
sampling and measuring methods for PM10 and PM2.5 emissions from coal-fired power plants and PM10 and
PM2.5 in ambient air. This chapter briefly summaries her findings and updates on developments since 2004.
As secondary PM2.5 sources, NOx and SO2 are relatively simple to measure and the methods are well
established. Over the years, IEA CCC has carried out a number of studies on various aspects of NOx and SOx
emission control at coal-fired power plants, including sampling, measuring and testing methods (visit
www.iea-coal.org for details). This report concentrates on primary PM2.5 and total PM2.5 sampling and
measuring methods, and on condensable PM2.5.
The sampling and measurement of fine particulates at sources such as coal-fired power plants is
problematic for several reasons:
particulates measured in ambient air downstream of a source are actually a combination of primary
particles and secondary particles formed from precursors in the stack, as well as from reactions with
other pollutants in the ambient air. Particulates in the stack gases are cooling and therefore also
represent a combination of primary and secondary particles, but not necessarily those that would
form when the plume mixes with polluted air;
the primary particles are small and tend to bounce in standard particulate capture systems;
the particles are present in very low concentrations. Testing for compliance is even more challenging
now with the lower emission limits;
precursor species and other emitted gases can form secondary products in the measurement systems
which may, or may not, represent those which would genuinely have formed in the ambient air
(Sloss, 2004).
In order to compare results from different studies, it is necessary to have a standard PM2.5 sampling and
testing technique. Since Sloss’s review in 2004, three ISO standards have been issued and adopted by some
countries. The US EPA has updated their method 201 and 201A. After a brief introduction of the technical
terms for sampling and measuring equipment and systems, this chapter summarises the three new

Standard methods for sampling and measurement
IEA Clean Coal Centre – Emission standards and control of PM2.5 from coal-fired power plant
39
international standards. Some countries’ national sampling method standards, such as the US EPA’s
methods, are also covered.
3.1 The basics of sampling and measuring
PM2.5 measurement can be divided into two distinct types, those which:
collect the sample in a form which may be weighed and, sometimes, subjected to chemical analysis;
measure the particles directly, but do not collect any sample, or at least do not collect the sample in a
form which may be weighed and/or otherwise analysed.
An efficient PM2.5 sampling system should include a 2.5 m size selective inlet, nitric acid removal denuders,
filter holders or collection substrates, flow controllers and pumps. Cyclones and impactors are commonly
used as 2.5 m size cut-off inlets to separate fine particles from larger ones.
Cyclones (see Figure 2) use centrifugal force in a conical shaped chamber to remove larger particles from
the swirling gas stream. The incoming gas stream is forced into a circular motion as it passes down the
cyclone. At the bottom of the cyclone, the gas spirals up through the centre tube and out at the top. Particles
in the gas stream are forced to the wall by the centrifugal force, but retarded by the drag of the gas stream.
The larger particles impact the inside surface of the cyclone, whilst smaller particles travel through to the
downstream collection system. Cascade and sharp-cut cyclones are often used to select PM2.5.
An impactor is any device which is used as a deposition site for particles. It consists of a series of nozzles
and impaction plates, which separate particles according to their aerodynamic diameter. The sample stack
gas is drawn through a nozzle onto a plate at a previously determined volumetric flow rate. The plate causes
the gas to be deflected at 90 degrees along its surface. The selective deposition of particles onto impactors
is based on sampling effectiveness curves. Larger particles have longer stopping distances than smaller
ones. Inert objects, such as particles, cannot effect a change of direction of 90 degrees in a distance less than
their stopping distance. A curve or bend can therefore be used to select larger particles by collecting them
in the ‘corner’, whilst smaller particles complete the turn and continue to the sampling device (see Figure 3).
Each impactor plate has a cut-off point where the rest of the particles of a certain aerodynamic diameter,
for example 2.5 m, are deposited on the plate and 50% pass through to the next stage. Types of impactors
include slot-type, round nozzle, and virtual (ISO, 2009; Sloss, 2004).

Standard methods for sampling and measurement
IEA Clean Coal Centre – Emission standards and control of PM2.5 from coal-fired power plant
40
Figure 2 A PM2.5 cyclone and how it works
Figure 3 An impactor and how it works
The equipment commonly used to sample/collect PM2.5 includes filters, impactors, cyclones, and tapered
element oscillating microbalance (TEOM). One of the most common collection methods is a filter. A
selection of filter materials is available, for example glass fibre, quartz, polymer, nylon, Teflon and
Nucleopore. The selection depends on what species are to be targeted and which analysis method will be
used. Apart from their use as size selection inlets, impactors can also be used to classify particles into
sub-groups by size. For example, the ISO 23210:2009 standard method (see Section 3.2.1) uses two-stage
cascade impactors to divide particles into three factions. Cyclones are used as collection systems as well,
for example in ISO 25597:2013 (see Section 3.2.1). TEOM is based on an oscillating filter attached to the tip
of a hollow, tapered, oscillating glass rod. The change in oscillating frequency is used to measure directly
the accumulation of mass on the filter over time. By relating the increasing weight to the gas flow rate, a
value for the particulate matter concentration can be determined every two seconds. TEOMs have been
used extensively for ambient monitoring of fine particulates. In-stack TEOM systems are also available.

Standard methods for sampling and measurement
IEA Clean Coal Centre – Emission standards and control of PM2.5 from coal-fired power plant
41
Sampling and measuring within stacks are particularly difficult due to the elevated temperatures (>260°C)
and high moisture conditions. PM2.5 contains both volatile and semi-volatile materials. At a temperature up
to 260°C, many organic species are in gaseous form, but could condense onto particles or form secondary
species as the flue gas disperses and cools. Problems can arise with many PM2.5 sampling systems when the
stack gases are moist or wet with entrained or condensed water. Water may be attached to the particles
and change the flow characteristics in addition to adding weight to the sample being measured. These
problems can be dealt with in one of three ways:
a dilution sampling system can be used to avoid the condensation of water;
the sample may be cooled and conditioned to allow conventional equipment to be used; or
the system can be operated at a suitable elevated temperature to avoid moisture condensation.
PM2.5 must be measured by different techniques since it exists in different forms. For example, filtration or
impaction methods are for primary particles and condensation methods are for the secondary particles.
Sloss (2004) classified measuring methods as:
primary particles methods – manual and automated;
condensable/secondary particles method – dilution systems; and
total measurement systems – sampling trains and dilution sampling trains.
Sloss’s definition of ‘primary particles’ here is similar to the US EPA’s ‘filterable particulate matter’ which
means particles are emitted directly by a source as a solid or liquid at stack or release conditions, and are
captured on the filter of a stack test train. Condensable particulate matter (CPM) is emitted to a stack in
vapour form, but condenses upon cooling and dilution in the ambient air to form a solid or liquid particulate
immediately after discharge from the stack. Condensable particulates are generally smaller than 2.5 m.
Furthermore, condensable particulates may react with air stream components as they condense. In fact,
the ISO method defines CPM as particulate matter formed at temperature below 30°C due to physical
and/or chemical processes. Total particulate matter, also known as primary particulate matter, are the
particles entering the atmosphere as a direct emission from a stack or an open source. It has two
components: filterable particulate matter and condensable particulate matter.
Manual methods used to measure filterable PM2.5 include gravimetric (weighing) systems which collect
the particles on filters, cyclones and impactors for subsequent weighing and/or chemical analysis. Most
gravimetric sampling systems involve a nozzle and probe which is inserted into the stack. The sample is
withdrawn isokinetically through the sample probe and into the particle collection device (such as a filter,
cyclone or impactor). The collection device can be located inside the stack or outside. If the system is
outside, then it must be heated to stack temperature to prevent condensation. In order to ensure that a
representative sample is obtained, samples must be taken isokinetically from several locations across the
stack and the total averaged.
Automated systems are usually used for particulate monitoring and do not collect a sample for analysis.
They include TEOM, beta attenuation, and optical techniques.

Standard methods for sampling and measurement
IEA Clean Coal Centre – Emission standards and control of PM2.5 from coal-fired power plant
42
Sampling trains to measure total particulates are formed by placing a filterable particle sampling system,
such as a filter or impactor, to collect the filterable PM followed by an impinger to capture the condensable
particles.
The dilution sampling train uses in-stack sampling cyclones to measure filterable particles in the same
manner as the basic sampling train, but in addition, utilises extra PM2.5 and/or PM10 cyclones in the
sampling train to measure particles formed in the dilution chamber. To determine both filterable and
condensable PM10 and PM2.5, the sample gas is rapidly mixed and cooled with non-reactive gases such as
nitrogen and oxygen or dilution air. The dilution system simulates the dilution and cooling processes that
occur in the near field of a stack plume as it mixes with the atmosphere. These processes impact the
homogeneous and heterogeneous nucleation of stack gas constituents. The diluted sample can then be
analysed for particulate matter or gases, depending upon the requirements of the test. More details about
the dilution sampling train are described in Section 3.2 (US EPA Method 202 and ISO 25597:2013).
Since the dilution sampling system was selected by the US EPA to measure condensable PM and total PM,
various types of dilution systems for the measurement of PM2.5 have been developed. The compact sampler
designed by Li and others (2011) enhances mixing of dilution air with the stack gas, and thus shortens the
length of the mixing section. It decreases the nominal flow rate through the aging section and reduces the
size of the residence chamber accordingly. Sampling gas enters the residence chamber under pressure, and
air pressure in the chamber is micro-positive. Uncollected redundant gas is automatically discharged
through unused sampling ports, which keeps the unit stable. Kong and others (2013) designed a dilution
sampling system to study the emission and profile characteristic of polycyclic aromatic hydrocarbons
(PAHs) in particles, especially for PM10 and PM2.5 emitted from stationary sources. Natural Resources
Canada (Win Lee, 2013) has produced four dilution based prototype systems for measurement and
characterisation of fine PM emissions from stationary combustion sources. The third generation sampler,
known as CETC-3, uses a regular stack sampling probe, and particulate size segregation is done using
sampling cyclones with different cut sizes installed external to the ageing chamber. CETC-3 measures the
dilution ratio using a CO2 tracer gas technique, moisture injection to provide variable sample humidity, and
longer residence time. The latest prototype CETC-4 has an optional in-stack PM2.5 cyclone on the probe. The
CETC-4 sampler is simpler to operate, and more compact than CETC-3 as it has no humidification system.
It also has an interchangeable mixing section that allows variable residence times.
Finland Dekati Ltd designed an Electrical Low Pressure Impactor (ELPI) to test aerosol particle size
distribution, concentration and size-classified particle charge distribution measurements in a coal-fired
power plant (Niemelä and others, 2008). The ELPI is coupled with a sampling and dilution system, called
FPS, to form a complete measurement system for fine particle emissions measurements from power plants.
The dilution system allows sampling from hot flue gas and provides a controlled temperature decrease
with minimal losses. Its operation is based on an ejector pump where compressed dilution air is used to
create sample suction in a conical nozzle. Dilution air flow is kept constant using critical flow control

Standard methods for sampling and measurement
IEA Clean Coal Centre – Emission standards and control of PM2.5 from coal-fired power plant
43
orifices. Sample flow is dependent on the pressure drop across the ejector, which is measured by two
pressure sensors. Results from ELPI measurements are comparable to those from gravimetric techniques.
3.2 International and national standards
This section describes various international and national measuring standards.
3.2.1 International standards
Standards are developed internationally by ISO and by the Comité European de Normalization (CEN). A
standard developed by ISO is prefixed ‘ISO’ and by CEN is prefixed with ‘EN’. ISO standards are accepted on
a case-by-case principle; it is not mandatory for a member country in the European Union to adopt an ISO
standard. However, CEN standards must be implemented by member countries.
During the last few years, ISO has standardised three measurement methods which use impactors, virtual
impactors or cyclones to determine the mass concentration of PM10 and PM2.5 in flue gas in the stack. One
of these has also been adopted by CEN.
EN ISO 23210:2009 Stationary source emissions – determination of PM10/PM2.5 mass concentration in flue gas – measurement at low concentrations by use of impactors
A standard reference method for the determination of PM10 and PM2,5 mass concentrations at stationary
emission sources using two-stage cascade impactors is specified. During sampling, the particles are divided
into three factions:
first impactor: particles with aerodynamic diameters greater than 10 m;
second impactor: particles with aerodynamic diameters between 10 m and 2.5 m; and
backup filter: particles with aerodynamic diameters smaller than 2.5 m.
First, greased collecting plates are used to increase the adhesion and to reduce possible rebound of
particles to evaluate the optimum separation efficiency under laboratory conditions. Second, quartz-fibre
filters (with the smooth surface towards the top) are used as collecting plates, as in the intended operation
of the impactor. Tests with at least six different particle diameters between 1 m and 10 μm are required
at the PM2.5 stage. The separation curves of PM10 and PM2.5 emission measurements correspond to the
separation curves for PM10 and PM2.5 ambient air quality measurements specified in ISO 7708:1995
(see Figure 4).

Standard methods for sampling and measurement
IEA Clean Coal Centre – Emission standards and control of PM2.5 from coal-fired power plant
44
Figure 4 Separation curves of PM10 and PM2.5 specified in ISO 7708:1995 (BS EN ISO, 2009)
Figure 5 shows an example design of the sampling system. A straight entry nozzle is recommended for
in-stack measurement. In-stack measurements with a goose-neck nozzle in front of the impactor can cause
higher particle losses in the probe. Furthermore, out-stack measurements require an exact external
thermal control of the impactor to meet the exact cut-off diameter. In-stack measurements with a goose-
neck nozzle in front of the impactor require extensive validation experiments to be performed, including
the quantification of losses related to coarse and fine particles. These measurement setups are only used if
losses of particles in the sampling train are below 10% of the total mass of fine particles collected on the
collecting plate and backup filter. ISO 23210:2009 standard describes the design, use and theory of
round-nozzle impactors. It does not exclude other types of impactors, provided these systems meet the
performance criteria specified in the standard in a validation of the impactor performed by an independent
testing laboratory.
Figure 5 Design of PM2.5 in-stack sampling system by use of impactor (BS EN ISO, 2009)

Standard methods for sampling and measurement
IEA Clean Coal Centre – Emission standards and control of PM2.5 from coal-fired power plant
45
The preparation, measurement procedure and post-treatment are also described in the ISO 23210:2009
standard. In general, the dimensions of the measurement ports should allow straight insertion of the
impactor into the flue gas duct without any contact with the inner duct walls. The flue gas conditions should
be constant during sampling to ensure that the isokinetic rate is kept between 90% and 130% of the
calculated value. The sampling point must be representative of the flue gas velocity, and the cut-off
diameter should not change during sampling. A blank sample is taken as a quality control measure after
each measurement series, or at least once a day. The calculation method, performance characteristics, and
reporting method are also included in the standard.
This measurement method is especially suitable for the determination of mass concentrations below
40 mg/m3 as half-hourly averages under standard conditions (0℃, 101.3 kPa, dry gas). It is not applicable
to the sampling of flue gases that are saturated with water vapour. The stack gas dew point must also be
below the stack gas temperature.
ISO 13271:2012 Stationary source emissions – determination of PM10/PM2.5 mass concentration in flue gas – measurement at higher concentrations by use of virtual impactors
This method is based on the principle of gas stream separation using two-stage virtual impactors without
impaction plates. It is especially suitable for in-stack measurement of particle mass concentrations in flue
gas, including those with higher dust concentration than ISO 23210:2009. It can also be used for flue gas
which contains highly reactive compounds (sulphur, chlorine, and nitric acid) at a high temperature or in
the presence of high humidity.
The first stage of the two-stage virtual impactor separates the largest particles using a particle collection
nozzle. The coarse particles are collected on a plane filter. Smaller particles are then divided into the same
three fractions as ISO 23210:2009 by the two-stage virtual impactor for sampling. PM2.5 particles are
collected on a backup filter (see Section EN ISO 23210:2009). The separation curves are as specified in ISO
7708:1995 (see Figure 4). Figure 6 shows the design of the sampling system for this method. Nozzle
specification and test requirements are similar to ISO 23210:2009, as described previously. The impactor
must be operated with a constant sample volume flow rate, which depends on the flue gas conditions.
Equipment and working materials are specified in the standard. For example, the virtual impactor must be
made of corrosion proof material, such as titanium or stainless steel. Preparation, measurement procedure
and post-treatment requirements are also given.

Standard methods for sampling and measurement
IEA Clean Coal Centre – Emission standards and control of PM2.5 from coal-fired power plant
46
Figure 6 Design of virtual impactor sampling train (BS ISO, 2012)
ISO 25597:2013 Stationary source emissions – test method determining PM2.5 and PM10 mass in stack gases using cyclone samplers and sample dilution
Standard ISO 25597 was published in 2013 (BS ISO, 2015). It specifies procedures for the extraction and
measurement of flue gas from stationary sources:
filterable particulate matter by the use of basic cyclone samplers; and
filterable and condensed particulate matter by the use of dilution samplers.
The basic sampling train (see Figure 7) measures filterable particles using sampling cyclones that can
distinguish between particle sizes in the range of 2.5 μm and 10 μm. The first cyclone separates the PM10
particles and the second one separates PM2.5. Sampling is conducted isokinetically at sampling points on
the sampling cross-section determined according to ISO 9096. This method is especially suitable for
measurements of particle mass concentrations above 50 mg/m3 as a half-hourly average at standard
conditions (293 K, 101.3 kPa, dry gas).
Figure 7 In-stack combined PM10 and PM2.5 cyclone basic sampling train (BS ISO, 2015)

Standard methods for sampling and measurement
IEA Clean Coal Centre – Emission standards and control of PM2.5 from coal-fired power plant
47
The dilution sampling train (see Figure 8), as described in Section 3.1, uses in-stack sampling cyclones to
measure filterable particles in the same manner as the basic sampling train, but in addition, utilises extra
PM2.5 and/or PM10 cyclones to measure particles formed in the dilution chamber. PM10 and/or PM2.5
cyclones are attached to the probe. The sample then passes into the mixing section of the dilution chamber
where it is mixed and cooled with humidified air at a ratio of at least 20:1. After dilution, the aerosols are
aged in the aging zone for a minimum residence time of 10 seconds. The aged gas is then pulled through a
secondary PM2.5 cyclone, a single stage PTFE membrane filter or equivalent, and the particulate and
condensable matter are collected for subsequent gravimetric measurement.
Figure 8 In-stack combined PM10 and PM2.5 cyclones with dilution sampling train (BS ISO, 2015)
The dilution sampling train can be used in combination with the basic sampling train. The dilution sampling
system is intended for applications where measurement is required of particles similar in characteristics
to materials formed when a flue gas exhaust mixes with ambient air. Particulate matter filter samples
collected using dilution sampling can be further analysed to provide chemical composition.
Near-isokinetic sampling within 80% to 120% of the isokinetic sampling rate is allowed for PM2.5 sampling.
This method has been applied to emission sources with a low moisture content and to saturated moisture
stack gases. However, the method is not applicable to effluents where entrained water droplets are present.
There are some combustion processes and situations that can limit the applicability of this standard. Where
such conditions exist, caution and competent technical judgment are required, especially when dealing
with any of the following:
high vacuum, high pressure or high temperature gas streams above 260 °C;
fluctuations in velocity, temperature or concentration due to uncontrollable variation in the process;
and
gas stratification due to the non-mixing of gas streams.
There are also limitations specific to each sampling technique. Stacks with entrained moisture droplets can
have droplet sizes larger than the cyclone cut sizes for the cyclones. These water droplets normally contain
Standard methods for sampling and measurement
IEA Clean Coal Centre – Emission standards and control of PM2.5 from coal-fired power plant
48
particles and dissolved solids that become PM10 and PM2.5 following evaporation of the water. For dilution
sampling, this method concerns the presence of particles in the dilution air at very low concentrations,
contributing to measurement background. This can be significant for certain very clean sources. Dilution
air system blanks are necessary when sampling sources with anticipated PM2,5 or PM10 mass
concentrations of less than or equal to about 1.0 mg/m3.
Ways of avoiding measurement bias are described. For example, maintaining the sample probe at a
temperature at or slightly above the stack gas temperature may minimise thermophoretic losses. Also,
sharp changes in flow direction should be avoided to minimise inertial losses. Finally, the humidity of the
diluted sample should be kept below 70% to maintain particle growth conditions.
3.2.2 USA
The USA was the first country to standardise the sampling and measuring methods for fine PM emissions.
Therefore, its methods are reviewed before other countries in this report. The EPA issued two standard
reference methods for measuring PM2.5, namely Method 201A for Filterable PM2.5 and Method 202 for
condensable PM. Combining the two methods could obtain total PM2.5 emissions. The historic sampling
method, CTM – 039, which is still being used is also described.
Method 201A ‒ Determination of PM10 and PM2.5 emissions from stationary sources (constant sampling rate procedure)
Method 201A was first developed prior to 1990 for PM10 sampling. The old method was reviewed by Sloss
in 2004. The EPA revised Method 201A in December 2010 by adding a PM2.5 cyclone to measure both PM10
and PM2.5 emissions (see Figure 9). The revised Method 201A categorises three classes of particles:
diameter larger than10 m;
diameter equal to or smaller than 10 m but larger than 2.5 m; and
PM diameter equal to or smaller than 2.5 m.
With the exclusion of the PM10 cyclone, the sampling train can be used to measure total and PM2.5 emissions.
80% to 120% of isokinetic flow is needed to obtain PM10 and PM2.5, and 90% to 110% for total filterable
particulate. Well-defined limits must be established to minimise variations in the isokinetic sampling
conditions. In-stack filterable particulate samples are taken from a recommended maximum of 12 sampling
points, at a constant flow rate through the sampling train, and with a filter at the stack temperature.
This method has some limitations. First, it is not applicable to wet sources. The EPA recommends that for
those sources the total filterable PM is reported as filterable PM2.5. Second, train blank correction is not
permitted (although the EPA reported that the blank was 0.9 mg). Consequently, results have a positive
bias.

Standard methods for sampling and measurement
IEA Clean Coal Centre – Emission standards and control of PM2.5 from coal-fired power plant
49
Figure 9 Schematic of US Method 201A sampling train (EPA, 2010a)
Method 202 – Dry impinger method for determining condensable particulate emissions from stationary sources
This standard method addresses the equipment, preparation and analysis necessary to measure only
condensable particulate matter (CPM). CPM is measured after removal from the stack and after passing
through a filter.
Method 202 was first promulgated in December 1991 and reviewed by Sloss in 2004. It was reported that
the results had a significant positive bias and lacked the requisite reproducibility. The primary source of
the bias was sulphur dioxide, which is collected in the sampling train impinger water. There it reacts with
the water to forms sulphate, which is detected as PM2.5.
The EPA published the revised method in December 2010. It eliminates the use of water as the collection
medium in impingers and includes the addition of a condenser followed by a water dropout impinger
immediately after the final in-stack or heated filter. It also includes the addition of one modified Greenburg
Smith impinger (back-up impinger) and a CPM filter after the water dropout impinger. CPM is collected in
the water dropout impinger, the modified Greenburg Smith impinger, and the CPM filter. Using dry
impingers is intended to eliminate any sulphate artefacts. Figure 10 presents a schematic of the sampling
train configured with these changes.

Standard methods for sampling and measurement
IEA Clean Coal Centre – Emission standards and control of PM2.5 from coal-fired power plant
50
Figure 10 Schematic of US Method 202 CPM sampling train (US EPA, 2010a)
The impinger contents are purged with nitrogen immediately after sample collection to remove dissolved
SO2 gases from the impinger. The CPM filter is extracted with water and hexane. The impinger solution is
then extracted with hexane. The organic and aqueous fractions are dried and the residues are weighed. The
total of the aqueous and organic fractions represents the CPM.
The potential artefacts from SO2 are reduced using a condenser and water dropout impinger to separate
CPM from reactive gases. No water is added to the impingers prior to the start of sampling. To improve the
collection efficiency of CPM, an additional filter (‘CPM filter’) is placed between the second and third
impinger. The isokinetic sampling conditions of the filterable PM test method must be met.
The new Method 202 is an improvement on the old method, especially for low-concentration sources, but
it is more expensive.
Yang and others (2014) used the two methods 201A and 202 to measure and characterise PM2.5 emissions
from 5 different stationary sources. One of these was a coal-fired power plant. The results showed that it is
necessary to collect both filter and cyclone holder residue particulates to avoid underestimation of PM2.5
emissions, especially for stacks with low PM2.5 concentrations. The stack temperature was the most
important factor affecting the percentage of condensable PM. The SO2 and other condensable materials are
easier to condense on the filter at the cooler temperatures, resulting in higher percentages of filterable PM.
This again indicates the importance of including condensable PM in the measurement of PM2.5 emissions
since stack temperature can affect filterable PM measurements in Method 201A.
CTM-039 Measurement of PM2.5 and PM10 emissions by dilution sampling (constant sampling rate procedures)
In 2004, long before the EPA revised Method 201A, they added a PM2.5 cyclone between the PM10 cyclone
and in-stack filter of Method 201A, and added and modified various Method 201A procedures. Initially, the
new method was called Preliminary Method PRE 4, and then changed to CTM-040 (conditional test method).
CTM-039 expanded and replaced method CTM-040 by:

Standard methods for sampling and measurement
IEA Clean Coal Centre – Emission standards and control of PM2.5 from coal-fired power plant
51
incorporating a PM2.5 sizer cyclone behind (or replacing) the PM10 sizer cyclone as in CTM-040;
removing the in-stack filter;
diluting the sample gas utilising a mixing cone and residence chamber;
using a dilution air system to supply clean air at a temperature less than 30°C (low enough to achieve
a filtration temperature of less than 30°C) and a relative humidity less than 50%;
adding a 142 mm filter to the residence chamber exit to capture any particulate that passes through
the residence chamber; and
providing a sample stream and extraction location for speciating PM2.5 in a manner similar to that
used for ambient PM2.5 speciation.
The results from CTM-39 are encouraging but the equipment is expensive. CTM-039 belongs to EPA’s
‘Historic Conditional Methods’ category. This category is closed and no new methods will be added to it.
However, the procedure is still being used.
3.2.3 Canada
Canada has three reference methods for measuring PM2.5 emissions from stationary sources. They may be
used separately or jointly to determine filterable and condensable particulate matter, which are considered
as primary PM2.5 (Environment Canada, 2013).
Method G: Determination of filterable PM2.5 and filterable particulate matter
Method G is similar to US Method 201A. PM samples are withdrawn at a near-constant rate, but
isokinetically, from pre-determined traverse points. The filterable PM2.5 is separated with an in-stack
cyclone, and deposited in the probe and on an out-of-stack heated filter maintained at a temperature of
120 ± 14°C or at such other temperature as is necessary to prevent blinding of the filter by condensation.
The filterable PM2.5 and filterable PM are determined gravimetrically after removal of un-combined water.
Three valid tests are required for their determination. Each test must last a minimum of two hours and
collect at least 1.5 m3 of stack gas on a dry basis at reference conditions. Stack gas temperatures must be
lower than 260°C to avoid damage to the PM2.5 cyclone.
Method H: Determination of condensable particulate matter (CPM)
This method is similar to US EPA Method 202. PM is isokinetically withdrawn from the stack and filtered at
a temperature of 120 ±14°C. The filtered gas sample is then cooled in an ice-water jacketed coil condenser
and any moisture that may condense is collected in a condensate trap or stemless impinger. Ethanol is
added to the impinger to inhibit the oxidation of SO2 that may be dissolved in the condensate. Any aerosol
formed during the cooling is collected by a secondary or mist filter held at ambient temperature. At the
completion of the test, the sample is recovered quantitatively and the condensate is extracted with
dichloromethane. The organic fraction is evaporated at ambient temperature, whereas the aqueous
fraction is evaporated to near-dryness in a 105°C oven. Drying is completed in a desiccator and the residue
weighed.

Standard methods for sampling and measurement
IEA Clean Coal Centre – Emission standards and control of PM2.5 from coal-fired power plant
52
Three valid tests are required for the determination of condensable particulate matter. Each test must run
for a minimum of two hours and collect at least 1.7 m3 of stack gas on a dry basis at reference conditions.
This method has not been evaluated for sampling times over four hours and condensate catches beyond
250 g.
Method I: Options
This method is used to measure the mass concentration and mass emission of filterable PM2.5 and CPM
released from stationary sources. The front-half of Method G is combined with the back-half of Method H
to form a method for sampling total PM2.5 from stationary sources. The method is subject to the limitations
of Methods G and H.
3.2.4 Other countries
Many countries have not set up their own standard methods for sampling and measuring. Most of the EU
member countries have adopted ISO or EU standards. Other countries follow either the US EPA’s or ISO’s
standard methods or both. For example, the UK Environment Agency issued a Technical Guidance Note M15
for monitoring PM10 and PM2.5 emissions from stacks (UK EA, 2012) and Technical Guidance Note M2 for
monitoring stack emissions (UK EA, 2013). The UK has adopted all three ISO standards but only mentioned
EN ISO 23210 in Technical Guidance Note 15 to monitor PM2.5. EN ISO 23210 and ISO 25597 are
recommended in Technical Guidance Note M2 for particulate matter testing. ‘The determination of
particulates and sampling methods of gaseous pollutants from exhaust gas of stationary source (GB/T 16157-
1996)’ is the official standard method in China. However, the previously mentioned ISO and US EPA
methods have commonly been used in recent years (Shi and others, 2015; Wang and others, 2013).
3.3 Comments
Sampling and analysis of source emissions is crucial for compliance monitoring, and for source
appropriation and epidemiological studies. ISO has developed three standard methods, whilst the USA and
Canada have their own standardised methods. However, the measurement of PM2.5 still remains a challenge.
Further work is required to determine the best approach to measure fine particulates accurately so that all
research groups can use the same approach to produce comparable and reliable data.
The majority of fine particulate sampling and measuring methods still concentrate on total mass or particle
distribution. High quality and comprehensive measurements of the chemical components of PM2.5 are still
an important goal for the future. A full analysis of the complete chemistry of fine particulates requires the
measurement of almost every known atmospheric pollutant. The measurement of the chemical
components of PM2.5 needs to be reviewed and the evidence requirements clearly stated.
Errors can be introduced easily. For example, between sampling and final weighing, the filter is exposed to
various ambient conditions of temperature and humidity which could lead to additional variation in the
measured concentration of semi-volatile and hygroscopic materials. Storage and treatments, such as
equilibration, also lead to loss of some chemical species. As the sample sizes collected from PM10 and PM2.5
studies are so small, weighing and handling of filters can also be a major source of error.

Control technologies
IEA Clean Coal Centre – Emission standards and control of PM2.5 from coal-fired power plant
53
4 Control technologies
As discussed in the previous chapters, PM2.5 is made up of two fractions – primary and secondary particles.
The formation and behaviour of these two fractions are so distinct that their control tends to be dealt with
separately. Part of primary PM2.5, also known as filterable particulate matter in the measurement standards,
can be controlled as fine particulate matter. Secondary PM2.5 which is mainly formed from SO2 and NOx,
can be controlled as acid gases. Technologies are now available that efficiently remove two or more
pollutants simultaneously in a single system. Pollution control technologies at coal-fired power plants have
been extensively reviewed by IEA CCC. Selected reports are listed below. Information about the reports can
be found at: www.iea-coal.org/site/2010/publications-section/reports.
PM control
Nicol (2013) Recent developments in particulate control, CCC/218
Zhu (2003) Developments in particulate control, CCC/72
Wu (2000) Prevention of particulate emissions, CCC/40
Soud (1995) Developments in particulate control for coal combustion, IEACR/78
NOx control
Nalbandian (2009) NOx control for coal-fired plant, CCC/157
Wu (2002) NOx control for pulverised coal-fired power stations, CCC/69
Nalbandian and Fukasawa (1996) Developments in NOx abatement and control, IEACR/89
Sloss (1991) NOx emissions from coal combustion, IEACR/36
SO2 control
Carpenter (2012) Low water FGD technologies, CCC/210
Zhu (2010) Non-calcium desulphurisation technologies, CCC/170
Zhu (2006) Trends in SO2 emissions, CCC/115
Fernando (2003) SO3 issues for coal-fired plant, CCC/72
Multi-pollutants control
Carpenter (2013) Advances in multi-pollutant control, CCC/227
Nalbandian (2004) Air pollution control technologies and their interactions, CCC/92
This chapter discusses recent developments in particulate control technologies from a primary PM2.5
control angle. Technologies controlling particles with diameters greater than 2.5 m are not included. The
impact that one technology has on other technologies is also not discussed.
For the purpose of this report, the technologies used to control primary PM2.5 emissions from coal-fired
power plants are classified under the following categories:

Control technologies
IEA Clean Coal Centre – Emission standards and control of PM2.5 from coal-fired power plant
54
Pre-combustion control
Coal type selection
Coal preparation
In-combustion control
Optimisation of combustion processes
Injection of sorbents into flame zone
Post-combustion control
conventional particle emission control devices (PECD)
innovative PECD technologies
agglomeration
hybrid systems
multi-pollutant control systems
Some case studies are used to demonstrate the technologies. For most of the technologies discussed, the
fundamentals, such as concept, operation theory, and system components, were covered in detail in
previous IEA CCC reports mentioned above, and therefore will not be covered.
4.1 Pre-combustion control
The first place where the formation of fine particulates can be controlled is in the selection of the coal and
preparation method.
4.1.1 Coal type selection
Fly ash resistivity plays a key role in the efficiency of PM2.5 capture processes. Resistivity is dependent on
the flue gas temperature and chemistry, and the chemical composition of the ash itself. Low resistivity fly
ash is produced from coals that contain higher sodium levels (Miller, 2015). Also, high coal ash and sulphur
contents are related to high values of PM2.5/PM10 ratios (Lu and Ren, 2014; Yao and others, 2009). Low
sulphur coals contain higher amounts of ash, thus increasing the fly ash loading (Nicol, 2013). Hence,
appropriate screening of coal types could reduce the formation of fine PM in power plants. The general
method to determine the suitable coal type is a combustion test on a specific furnace. Goto and others
(2009a,b) describe a series of modified coal type selection methods, which take into account not only the
combustion test results, but also the combustion state in an actual coal-fired power plant.
4.1.2 Coal preparation
The particle size of coal affects PM emissions significantly. Decreasing fineness leads to higher formation
of fine PM, because of the direct transfer of more excluded minerals. PM formed during combustion of
pulverised coal with a particle size below 63 m show a bimodal size distribution, including a fine mode at
about 0.5 m resulting from fragmentation of inherent minerals and vaporisation of heavy metals. Larger
coal particles (125–250 m) resulted in a single-mode distribution at about 4 m (Ninomiya and others,
2004). The finer the pulverised coal, the finer the fly ash, and the large amount of fine particles are in the
emitted fly ash (Li and others, 2013). Moreover, combustion of finer coal tends to emit PM containing more

Control technologies
IEA Clean Coal Centre – Emission standards and control of PM2.5 from coal-fired power plant
55
volatile trace elements. Therefore, it is important to prepare the coal with appropriate fineness before
combustion (Lu and Ren, 2014).
4.2 In-combustion control
In-combustion control to reduce PM2.5 emissions can be achieved through controlling the particle
fragmentation and the vaporisation of organic matter in the furnace. Usually these are adjusted by
optimising the combustion process and injecting sorbents into the furnace.
4.2.1 Combustion optimisation
Optimising the combustion of coal includes adjusting combustion temperature, burning time, and boiler
load.
PM emissions increase with increasing temperature of combustion. Li and others (2013) report that the
emissions of PM2.5 and PM10 were the highest at 1100°C. On the one hand, coal particles swell extensively
at high temperatures, causing fragmentation and high vaporisation of elements - this favours formation of
more fine particles. On the other hand, higher temperatures create a greater possibility of coalescence
between small particles to form agglomerated ash, which reduces the amount of fine particles. However,
many studies indicate that the overall effect of high temperatures is to increase fine PM emissions.
Therefore, under conditions of high coal burnout and high boiler thermal efficiency, it is feasible to reduce
the formation and emissions of fine PM by decreasing the combustion temperature or local temperature in
the furnace (Lu and Ren, 2014).
The longer the burning time, the more fine PM is produced. This is because longer burning times can cause
not only severe fragmentation of coke and minerals, but also a more thorough vaporisation of volatile
matter and refractory oxides, which result in the formation of more fine PM. In a furnace, a longer burning
time benefits the burnout rate and reduces the unburned carbon content in the resultant fly ash. Hence the
optimisation of burning time should consider both PM emissions and combustion efficiency (Lu and Ren,
2014).
As the boiler load drops, air supply and flue gas volume decline and the velocity of flue gas decreases. The
large ash particles in the flue gas become more likely to deposit or adhere to the furnace surface. A lower
flue gas velocity also increases the efficiency of dust precipitators (Li and others, 2013; Lu and Ren, 2014).
Although the emission of total PM could be reduced, a low boiler load results in a larger ratio of fine PM to
total particulates. In addition, most of the trace elements tend to deposit on the surface of smaller particles.
The smaller the particle, the higher the relative enrichment of trace elements. Hence with deficient oxygen
and a short residence time, coal particles in a low load boiler cannot be burned sufficiently, resulting in a
higher proportion of fine PM enriched with trace elements after combustion. Thus, high load factors can
help with PM2.5 emission reduction.

Control technologies
IEA Clean Coal Centre – Emission standards and control of PM2.5 from coal-fired power plant
56
4.2.2 Injection of sorbents into the flame zone
Another effective approach to reduce fine PM formation is to inject high temperature sorbents, such as
kaolinite, lime, limestone, silica, and alumina, into the flame zone. Lu and Ren’s (2014) work showed that
the addition of calcium oxide to pulverised coal could reduce the ratio of fine PM to total particles. In
addition, injection of the sorbents could selectively reduce the emissions of metal trace elements, such as
lead, sodium, cadmium, copper, beryllium, nickel, and mercury. Under normal combustion conditions, only
a small fraction of particles ever has contact with another particle while suspended in the flue gas. But
under high temperatures, with the injection of solid sorbents, additional agglomeration between fine coal
particles and sorbent particles can occur. Moreover, sorbents with a high porosity provide large surface
areas for condensation and further chemical reactions of trace elements into large ash particles. Therefore,
as a combined result of physical changes in particles and chemical reactions of trace elements, the injection
of sorbents into the furnace zone leads to increasing emissions of coarse PM, while the emissions of fine
PM and trace elements are reduced (Lu and Ren, 2014; Yao and others, 2009). This technique has been
recommended in the EU BAT for large combustion plants to reduce SOx and dust emissions (European IPPC
Bureau, 2015).
4.3 Post-combustion control
After combustion, fine particulates suspended in the flue gas can be captured by a series of physical and
chemical methods. Technologies that are effective at controlling fine particulate emissions from coal-fired
power plants are well established and already in use on numerous power plants. Major conventional
particle emission control devices (PECD) include cyclones, wet scrubbers, electrostatic precipitators, and
fabric filters/baghouses. Some technical modifications of conventional PECD have been made to improve
PM2.5 removal efficiency.
4.3.1 Conventional particle emission control devices
Particulate collection equipment basically consists of gravity settling chambers, impingement separators,
cyclones, electrostatic precipitators (ESPs), fabric filters (FFs), and wet collectors/scrubbers. Gravity
settling chambers are for large particles. Impingement collecting performance is not sufficient for coal-fired
power plants to meet emission standards. Cyclones and wet scrubbers have been used since the early days
of emission control to remove particulates but have a low collection efficiency for PM2.5. In fact, the US EPA
recommended that all industrial and commercial sources currently controlling PM with cyclones or
multi-cyclones should upgrade to high efficiency collection devices to collect fine PM (US EPA, 2006). ESPs
are the dominant PECD and have been used to control particulate emissions from coal-fired power plants
for about 60 years. In the 1970s, nearly 90% of US coal-based electric utilities used ESPs. Currently, more
than 90% coal-fired power plants in China have ESPs installed. But their PM2.5 removal efficiency is low.
The PM2.5 collection efficiency can reach ~98%, when combined with wet FGD, but this is not high enough
to meet the new emission standards. Developed in the 1970s, fabric filters, also known as baghouses,
operate on relatively simple principles compared to ESPs but have a high collection efficiency, 99.9 to
99.99% over a broad range of particle sizes, and ~99.7% for PM2.5 (Miller, 1014; Pui and others, 2014).

Control technologies
IEA Clean Coal Centre – Emission standards and control of PM2.5 from coal-fired power plant
57
There has been a trend globally to replace ESPs with FFs in recent years. In America most ESPs are being
taken out of service, and replaced with FFs. Indian power plants are looking at converting their existing
ESPs into FFs. FFs have been improved to make them more efficient and to extend the operational lifespan
of the filter bags. Efforts have been made to increase the number of filters and their depth in order to
enlarge the filter in the same sized space. New filter materials are being developed. Traditionally FFs were
made of glass, cellulose, and synthetic and polymer fibres. New developments use nanofibre technology,
and membrane-type fibres, such as polytetrafluoroethylene (PTFE) (Appleyard, 2015). A review of
developments in ESPs and FFs can be found in the IEA CCC reports listed at the beginning of the chapter.
4.3.2 Innovations in PECD technologies
Although conventional PECDs have outstanding performance in the removal of coarse PM from coal
combustion flue gas, there are limitations that prevent them from achieving high removal efficiencies for
fine particles such as PM2.5. During the past decade, some modified technologies based on conventional
PECDs have been developed and successfully demonstrated at coal-fired power plants. These
developments are introduced in this and the following sections.
Flue gas conditioning
Most of the older ESPs are designed to capture fly ash with a medium resistivity. Collection efficiency
decreases when the resistivity becomes too high. However, fly ash resistivity can be decreased and the
collection efficiency enhanced by injecting chemical agents and/or water into the flue gas stream to alter
the physico-electrical properties of fly ash (Shanthakumar, 2008). This process is called flue gas
conditioning (FGC). The most common conditioning agents are sulphur trioxide (SO3), ammonia (NH3), and
their compounds, and sodium compounds. Sulphur trioxide is widely applied to cold-side ESPs, while
sodium compounds are used for hot-side ESPs. An ESP placed after the combustion air pre-heater but
before the induced draught fan, and which operates within 130–180°C is known as cold-side ESP. The
majority of the installed ESP fleet is cold-side. A hot-side ESP is located before the combustion air preheater
and operates at 300–450°C. Sulphur trioxide is by far the most common type of flue gas conditioning, with
over 600 installations worldwide. The installation of an SO3 FGC system is relatively low cost and requires
only a short outage period, primarily because the system is not restricted by space on site. While results
vary between coals and systems, the injection of 10–20 ppm of SO3 can reduce the fly ash resistivity to a
value that will permit a good collection efficiency. In some cases, the injection of 30–40 ppm of SO3 has
resulted in reductions of fly ash resistivity by 2–3 orders of magnitude. Disadvantages of SO3 injection
systems include the possibility of plume colour degradation, fouling and corrosion. Some are concerned
that the use of SO3 as a conditioning agent (and slip of SO3 into the treated flue gas) may significantly
compromise the performance of a downstream amine-based carbon capture facility. SO3 is considered to
be a ‘bad actor’ in such a capture facility and may lead to conditions of high amine carryover in the treated
flue gas (Oettinger, 2016). Therefore, different FGC chemicals can be favourable. Combined SO3-NH3
conditioning is used as the SO3 adjusts the resistivity downwards while the NH3 modifies the space-charge
effect, improves agglomeration, and reduces rapping re-entrainment losses.

Control technologies
IEA Clean Coal Centre – Emission standards and control of PM2.5 from coal-fired power plant
58
The FGC system requires no modifications to the ESP, but its installation entails a moderate capital cost and
an additional operating cost. A short outage is required for the installation of the injection equipment.
Previous IEA CCC reports have covered the majority of FGC processes (Fernando, 2003; Nicol, 2013; Wu,
2000; Zhu, 2003). Two recent successful installations are described below.
Chemithon Engineers PvtLtd (CEPL) successfully tested and implemented FGC systems at 23 units at
11 thermal power stations in India during the period 2003-2008 (Trivedi and Phadke, 2008). The change
in PM levels before and after FGC were measured during the trial and performance runs. The FGC systems
were shown to be a cost-effective and reliable way of reducing fly ash resistivity.
Pentol GmbH has more than 100 SO3 FGC units operating in Europe (Pentol GmbH, 2015). China Fujian
Longking Co Ltd imported their technology and has been installing the system in China since 2006. In 2010,
Fujian Longking installed a sulphur trioxide FGC system at Guangdong Pinghai coal-fired power plant. The
system has proved to be reliable, with low operating and maintenance costs, and the sulphur trioxide
injection rate has been fully automated. The plant can meet ELV of less than 45 mg/m3 with collection
efficiencies peaking at 99.65%, when burning coals that produce highly resistive fly ash (Liu and others,
2008). Also in 2010, Fujian Longking installed another FGC system on Unit 2 of Shannxi Qingshuichuan
coal-fired power plant. Both 300 MWe units achieved a 99.80% removal efficiency (Lu and others, 2015).
Improvements to ESP
Considerable research has been put into improving ESP efficiency and the reduction of its power
consumption. Some concepts have been developed, including pulse energisation, intermittent energisation,
and electrode modified ESP. Pulse energisation is where a high-voltage pulse is superimposed on the base
voltage to enhance ESP performance during operation under high resistivity conditions. Intermittent
energisation is where the voltage to the ESP is turned off during selected periods, allowing a longer period
between each energisation cycle and limiting the potential for back corona. The ESP can be configured with
modified discharge and collection electrodes, which improve the inhomogeneous current distribution of
traditional wire-to-plate ESPs and thus provide better control of fine particles (Miller, 2015; Pui and others,
2014).
Electro-mechanical multi-duplex dual-zone ESPs were developed and patented by China Fujian
Longking Co Ltd in 2005. This technology separates the charging zone from the collecting zone; both zones
have a separate power source, which allows a high voltage direct current (HVDC) of 80 kV to be used
without sparking. This technology has a high collection efficiency for PM10 and PM2.5, for both high and low
resistivity fly ash. By 2011, there were 74 electro-mechanical double-zone ESP units installed in China,
eight in 660 MWe applications, 42 in 300 MWe and 24 in 300 MWe (Zhang and others, 2011).
Ion Blast is the commercial name and trademark for the ESP developed by GEA Bischoff in Germany. This
technology utilises an ionic wind to increase collection efficiency. Ionic wind is the wind produced from the
flow of flue gas towards the plate electrodes caused by the macroscopic migration of particulates. The
capture of PM2.5 should also be increased due to capture in the ionic wind (Seppala and Skroch, 2011).

Control technologies
IEA Clean Coal Centre – Emission standards and control of PM2.5 from coal-fired power plant
59
The Lentoid ESP was developed by Wuhan Science and Technology University and Wuhan University in
China. The conventional collection plates were replaced by hollow collection electrodes with the holes
facing the discharge electrode. Under the lentoid electric field, charged particles are focused into the hollow
chambers, undergoing agglomeration by Coulomb force and turbulent flow and enabling a higher collection
efficiency. Compared with the conventional designs, this ESP has the electric wind pass through the lentoid
electrode, which can decrease the re-entrainment and increase the migration velocity of particles (Lin and
Liu, 2011).
Wet ESP (WESP) systems have been in service for more than 30 years to control sulphuric acid and
particulate emissions. Thousands of individual WESP modules are currently in worldwide commercial
operation. Although operating in the same three-steps as a dry ESP (charging, collecting, and cleaning of
the particles from the collecting electrode), a wet ESP washes the collecting electrode with liquid rather
than mechanically rapping the collection plates. WESPs can be installed in coal-fired plants after the wet
FGD (see Figure 11) as a final ‘polishing’ stage to remove very fine particulates, sulphuric acid and any other
mist. Fine particulates are removed more effectively in a WESP because of the humidity in the flue gas
stream. Humidity reduces the resistivity of the particle. WESPs continually wet the collection surface and
create a dilute slurry that flows down the collecting wall to a recycle tank, preventing the build-up of a layer
of particle cake. As a result, captured particulates are not re-entrained and the concentration of fine PM is
reduced. Also, when firing low sulphur coal, which produces a high resistivity fly ash, the electrical field
does not deteriorate and power levels within a WESP can be higher than in a dry ESP (Lu and Ren, 2014;
Miller, 2015; Moretti and Jones, 2012).
Figure 11 Modification of conventional PECDs with WESP (Lu and Ren, 2014)
Wet ESPs have a number of advantages over dry ones. Firstly, there is no rapping, thus eliminating the
emission peaks created during rapping. Secondly, higher corona power can be used to increase charging.
Finally, the high humidity lowers the temperature of the flue gas; this increases the specific collection area
and lowers fly ash resistivity. WESPs have a high collection efficiency for PM10, PM2.5, sulphuric acid and
other soluble acid aerosols (Nicol, 2013). They have moderate energy consumption and a robust
performance that is unaffected by the properties of the particles (Lu and Ren, 2014). However, water
consumption is high and wastewater is generated that requires remediation in complex treatment systems.
Flue gas exiting the WESP is cooler than that from a cold-side dry ESP, and this could prove problematic for
downstream gas clean-up systems and require the addition of a heat exchanger. In some applications, the

Control technologies
IEA Clean Coal Centre – Emission standards and control of PM2.5 from coal-fired power plant
60
sulphur trioxide mist can be at a pH of 0.5 – this is extremely corrosive and will require the WESP materials
to be fabricated from corrosion resistant alloys, which are expensive. It is not unusual for a wet ESP to use
electrode materials such as Hastelloy® C-276, or 6% Molybdenum (Mo) alloys, while a dry ESP may use
carbon steel materials. Continuous and intermittent washing of the wet ESP are the most common types of
water washing methods used. Atomized water is continuously sprayed in the gas passage or on the plate
to create a film of water on the collector plate during the continuous wash process. This film of water will
flow down, keeping the plate wetted to maintain the pH above 5. Spraying water onto the plate electrodes
creates mists, which can create a short circuit from the corona discharge to the plate electrodes, and thus
adversely affect collection efficiency. A water delivery system that drips water onto the plate electrode can
overcome the problem of short circuits, whilst reducing the parasitic load associated with high pressure
water (Nicol, 2013; Silva and others, 2015). Major differences between wet and dry ESPs are shown in
Table 29.
Table 29 Major design differences between a wet and dry ESP (Silva and others, 2015)
Parameter Dry ESP Wet ESP
Gas temperature 121–454°C 48–54°C
Gas humidity <10% typical 100% (Saturation conditions after wet FGD)
Power density Variable with coal sulphur content and ash chemistry
Significantly higher than dry ESP
Resistivity Critical design factor Not a design factor
Gas velocity ~1.5 m/s ~3 m/s
Treatment time >10 seconds ~1–5 seconds
Re-entrainment Important factor Not a factor
Materials of construction Mild steel (typical) Specialty metals, plastic or conductive materials
Historically, WESPs have not been used on large coal-fired power plants. They were mainly used on
chemical and mineral facilities to capture fine particulates and acid aerosols. Applications also include
wood chip, glass ovens and incineration plants. However, the additional benefits, such as keeping SO3 at
low levels and possible benefits of mercury, NH3, and HCl control, make WESP a potential choice when
considering the available options for fine PM control. WESPs could have favourable economics in smaller
scale installations, such as on smaller coal-fired power plant or as an additional fine PM measure to other
particulate control devices on larger plants (Seyfert, 2011). WESPs can be designed for either horizontal or
vertical flow configurations. The choice of which to use is usually driven by arrangement and cost. Plants
with limited footprint areas typically use a vertical design since it takes less space. With no space limitations,
the horizontal design is usually preferred as a lower cost option (Silva and others, 2015).
A WESP system was installed after a dry ESP and a wet FGD system at the AES Deepwater high sulphur
coal-fired power plant in Texas, USA, in 2008. The collection efficiency of particulates was in the range of
95–97% and for sulphuric acid it was over 90% (Snyder and others, 2008). With no dry ESP installed, the
WESP used in unit 1 and 2 at Xcel Energy’s Northern States Power Sherco coal-fired power plant achieved
Control technologies
IEA Clean Coal Centre – Emission standards and control of PM2.5 from coal-fired power plant
61
a particulate collection efficiency of over 90% and a stack opacity below 10% (Staehle and others, 2003).
Amec Foster Wheeler has installed a few WESP systems in coal-fired power plants in America (Amec Foster
Wheeler, 2014). For example, a WESP was installed in a 200 MWe unit at Springfield Dallman power plant
in 2009, the 750 MWe Unit 2 at LG&E’s Trimble County, KY, power station in 2010, and in 2 x 800 MWe
units at Peabody Prairie State in Lively Grove, IL, in 2011. China has shown an interest in WESP in recent
years. The 350 MWe Unit 4 at Shenhua Guohua Zhoushan 2 power plant has SCR, dry ESP, seawater FGD,
and WESP installed by Baoding Meitian Environmental Equipment Co.
(www.meitianep.com/shownews1281.html) in June 2014. PM emission is 16.53 mg/m3 from the dry ESP,
10.76 mg/m3 from FGD, and 2.55 mg/m3 from the WESP. Unit 6 at Datang Huangdao coal-fired power plant
added a WESP after the FGD system in August 2014. PM emissions from the WESP were 2 mg/m3. Zhejiang
Feida Environmental Science & Technology Co Ltd is another Chinese company manufacturing WESPs.
Their latest installation is at the Shenhuan Guohua Sanhe coal-fired power plant. The system started
operation on 6 July 2015 and the PM emissions were 0.41 mg/m3 (Feida, 2015).
With low temperature ESPs, the temperature of the flue gas is reduced from 120–160°C to 90–110°C
(usually 10°C above the acid dew point) by a low temperature economiser before it enters the ESP. The
condensed water from the steam engine exchanges heat with the hot flue gas. Extra heat is transferred to
the condensed water to reduce the vapour consumption of the low pressure heater. Due to the lower
temperature, the volume of flue gas entering the ESP is reduced, the dust-resistance ratio is decreased, and
the precipitation efficiency is increased correspondingly. So utilisation of waste heat and improvement of
precipitation efficiency are achieved at the same time. There were three installations of low temperature
ESPs on 1000 MW units and one installation on a 600 MW unit in China in 2013. Ultra-low temperature
precipitation technology has also been developed, but it is more for the purpose of SOx control (Shu and
others, 2013).
Improvements to fabric filters
Although fabric filters have a high dust collection efficiency, they have the following issues:
pressure losses are significant;
the collection efficiency for fine particulates, especially PM1 particles, is low; and
there are blowing leaks during initial operation.
The electrostatically-aided fabric filter deals with these issues by providing an electrostatic charger before
the fabric filter (see Figure 12). By charging incoming particles using a corona discharge, the collection
efficiency of FFs can be increased, particularly for particles in the submicron size range. In addition, the
electric forces cause particles to deposit primarily on the surface of FFs, forming dendrite-like structures,
which lead to a lower pressure drop and more efficient pulse-jet cleaning (Pui and others, 2014; Tomitatsu,
2013).

Control technologies
IEA Clean Coal Centre – Emission standards and control of PM2.5 from coal-fired power plant
62
Figure 12 Schematic flow of electrostatic FF (Tomitatsu and others, 2013)
Gas conditioning has also been explored for improving FF performance. Low concentrations of ammonia
and/or sulphur trioxide have been added in test programmes to control fine particulate emissions and
reduce pressure drop when firing low-rank coals. There are no commercial applications yet (Miller, 2015).
4.3.3 Agglomeration
Using various chemical and physical techniques, agglomeration can bind fine particulates into larger ones,
thus making their collection by PECD easier. Some agglomeration techniques have been reviewed by Nicol
(2013) and Zhu (2003). The following section describes development in some particle agglomeration
techniques since 2003, among which acoustic and electrostatic agglomerators are the most popular.
Acoustic agglomeration
By using high intensity sound waves to improve the turbulence intensity of the gas, acoustic agglomeration
can promote collisions between fine particles. It can change the size distribution of fly ash particles in a
relatively short time, making them more likely to be captured by the PECD. In the sound field, the
orthokinetic and hydrodynamic interactions are believed to be the two most important effects involved in
the agglomeration process. The efficiency is affected by many factors such as frequency, sound pressure
level (SPL), and the initial aerosol concentration. The majority of the studies on this topic in recent years
have been carried out by Chinese researchers. Liu and others (2009) and Zhou and others (2015) found
that the optimum operating conditions of acoustic agglomeration can be achieved by adjusting the acoustic
frequency, SPL, and residence time. According to orthogonal analysis results from Liu and others (2011),
frequency is the dominant factor of coal-fired fly ash acoustic agglomeration and the optimum frequency is
1400 Hz.
Although acoustic agglomeration has been widely studied, the development of this process into an
industrial application has been slow. This is probably because of the lack of suitable high-intensity,
high-efficiency sound sources and appropriate full-scale agglomeration chambers. The latest trial was
carried out by Chen and others (2016). They installed two large agglomerators in the flue gas duct
immediately upstream of one of the two ESPs of a 330 MWe coal-fired unit in Leiyang Power Plant, Hunan
Province, China. A reduction of 56.7% and 62.3% in volume of PM2.5 and PM10 in the flue gas, was achieved
respectively. The average amount of PM2.5 and PM10 in hoppers of ESP with acoustic agglomerators
increased by around 14% and 10% respectively, in comparison with those of ESP without this technology.

Control technologies
IEA Clean Coal Centre – Emission standards and control of PM2.5 from coal-fired power plant
63
The ash particle removal efficiencies are 99.8% with an acoustic agglomerator and 99.7% without. This
demonstrates that fine ash particles in the flue gas can be decreased by the use of acoustic agglomerators.
Electrostatic agglomeration
By utilising a combination of electrostatic agglomeration and electrostatic precipitators, the collection
efficiency of conventional PECD for fine sub-micrometre PM can be increased. This renovated type of PECD
can be divided into three stages:
first stage ‒ collecting coarse ash particles and charging the fine particles;
middle stage ‒ promoting the agglomeration of fine particles by the installation of electrodes that are
charged by alternating or direct current voltage
final stage ‒ collecting the aggregated particles.
Studies show that after applying electrostatic agglomeration, the mass percentage of sub-micrometre size
particles in the emissions decreased by 20%, and the collection efficiency of particles in the range of
0.06-12 m increased to 98% (Watanabe and others, 1995).
Another type of electrostatic agglomeration process with two stages, called the Indigo agglomerator, has
been developed by Indigo Technologies of Australia. The system comprises:
a bipolar charger, which charges half of the dust with a positive charge and half with a negative
charge via alternating charged parallel passages; and
a mixing system, which combines the charged particles from each parallel passage causing the
oppositely charged particles to attach to form agglomerates.
The large particles created by this treatment are then easy to capture in the existing particulate control
system. The agglomeration system can be retrofitted into existing plants upstream of the dust collection
device. This system has been discussed in past IEA CCC reports by Nicol (2013), Sloss (2004), and Zhu
(2003) including examples at coal-fired power plants worldwide. A bipolar electrostatic agglomeration
system was installed before a conventional ESP in a 300 MW coal-fired unit by a team from Indigo
Technologies of Australia in December 2007. Trials burning Chinese and Indonesian coals showed a
30-40% drop in stack PM emissions. By 2008, there were eight commercial installations of the Indigo
Agglomerator, in various applications across Australia, the USA and China (Wilkins and others, 2008).
Unfortunately, the company was placed into liquidation in February 2011. Yao and others (2009)
commented that bipolar electrostatic agglomeration with ESP could be regarded as an alternative to hybrid
ESP/FF technology (see Section 4.3.4).
Magnetic aggregation
Fly ash particles from coal have a relatively high content of iron oxides, such as Fe3O4 and Fe2O3.
Consequently, these ash particles are easy to magnetise, due to their high saturation magnetisation.
Ferromagnetic particles possess remnant magnetisation, which allow them to remain magnetised even
after the removal of the external magnetic field. Through a combined effect of magnetic dipole force,

Control technologies
IEA Clean Coal Centre – Emission standards and control of PM2.5 from coal-fired power plant
64
Brownian motion, and shear forces, the collision and aggregation between fly ash particles can be enhanced,
leading to a transformation from fine to coarse PM (Lu and Ren, 2014). Li and others (2007) carried out an
aggregation of coal ash particles in the size range of 0.023‒9.32 µm in a gradient magnetic field formed by
permanent magnet rings. Results indicated that particles of 0.1–1 µm had higher removal efficiencies than
the smaller (<0.1 µm) and bigger (>1 µm) ones. PM capture efficiencies increased with increasing particle
mass concentration and particle aggregation time. The technology is not yet commercially available.
Wet agglomeration
Wet agglomeration, or wet granulation, refers to the process of agglomerating particles by spraying liquid
binders onto the particles as they are agitated in a fluidised bed, high shear mixer, or similar device. When
the liquid binders are sprayed into the agglomerating zone, they collide with dry particles and are
distributed throughout them. Then the binders begin to wet the particles, forming the initial agglomerates.
As the wetting process proceeds, the fluid penetrates into the pores of the particle surface, forms a nucleus,
and migrates outward as the nucleus grows. Further growth of agglomerates occurs when fine particles
collide with them and adhere to the surface. Therefore, through a combined effect of wetting, nucleation,
and growth, the particle size distribution can be changed into a coarse mode, which is of benefit to the
ultimate PM removal process. Application of wet agglomeration in a circulating fluidised bed (CFB) is
thought to be a feasible and promising approach for fine PM control because of its ability to remove both
sulphur dioxide and fly ash (Lu and Ren, 2014)
Thermophoretic deposition
Particle thermophoretic deposition in gas flowing over tube surfaces is an old technology. Zhou and others
(2005) from Tsinghua University China carried out a series of experiments to study particle deposition
behaviour in a rectangular channel with a designed temperature gradient. Phase Doppler anemometry was
used to measure the distribution and concentration of fine particles. As the ratio of the inlet temperature
to the cool wall temperature increased from 1.35 to 1.60, the capture efficiency by the wall increased from
7.5% to 12.5%. An empirical correlation was developed for calculating the efficiency of the thermophoresis
deposition based on the experiments. Furthermore, the concept of potential capacity and its variation was
adopted to establish a model to analyse the PM2.5 thermophoretic deposition efficiency (Yao and others,
2009). However, no further work has been found in the literature.
4.3.4 Hybrid systems
The most common hybrid systems are the combination of electrostatic precipitation with fabric filtration
to benefit from the advantages of both technologies. There are several hybrid systems that have been
developed, namely the Advanced Hybrid Collector (AHPC), Compact Hybrid Particulate Collector (COHPAC),
Electrostatically stimulated fabric filter (ESFF) ‒ Max-9™, Multi-stage Collector (MSC), Electrostatic Fabric
Integrated Collector (EFIC) and ESP-FF hybrid system (EFF). Of these, COHPAC, EFIC, and EFF are
commercially available. There are also other types of combinations of two or more PECDs, such as
electro-cyclone and electro-scrubber.

Control technologies
IEA Clean Coal Centre – Emission standards and control of PM2.5 from coal-fired power plant
65
Compact Hybrid Particulate Collector (COHPAC)
The Compact Hybrid Particulate Collector was developed and patented by Electric Power Research
Institute (EPRI), in the USA, in 1991. This technology has been reviewed by IEA CCC (Nicol, 2013; Zhu,
2003). The fabric filter is located in a separate casing downstream of the ESP (known as COHPAC I) or
within the existing ESP's casing by replacing one or more fields of collecting plates with fabric filter
modules (COHPAC II) (see Figure 13). Since the pulse-jet collector operates as a polisher to achieve lower
emissions of particulates, the low dust loading to the baghouse enables the filter to be operated at high
air-to-cloth (A/C) ratios (17.7 m/min), allowing a small footprint on-site, longer bag life, lower pressure
drops, and lower parasitic load. The system can be retrofitted on existing units and achieve high PM
removal efficiencies at relatively low cost (Miller, 2015).
Figure 13 Schematics of COHPAC and COHPAC II (www.hamonusa.com)
Full-scale demonstrations of COHPAC technology were conducted at the 272 MWe Unit 3 of E.C. Gaston low
sulphur coal-fired power plant and 2 x 575 MWe units at the Big Brown Plant. Results from COHPAC
operations have been positive, achieving 99.9% collection efficiencies, allowing fuel flexibility, reducing
opacity, increasing bag filter life, and decreasing operating costs. This has led to units being installed
commercially since 2000.
EPRI further developed COHPAC by coupling it with a sorbent injection system upstream of the FF. This
technology is called TOXECON™. Carpenter (2013) included this technology in her multi pollutant control
report (see section 4.3.5).
Hamon Research-Cottrell (www.hamonusa.com) is a licensed supplier of EPRI's COHPAC™ and TOXECON™
systems. To date, Hamon Research-Cottrell has installed over 1,700 MW of COHPAC™ systems, on both
coal-fired boilers and waste-to-energy incinerators.

Control technologies
IEA Clean Coal Centre – Emission standards and control of PM2.5 from coal-fired power plant
66
Electrostatic-Fabric Integrated Collector (EFIC)
The Electrostatic-Fabric Integrated Collector (EFIC) developed by China Fujian Longking is similar to
COHPAC II in that the ESP fields are removed and replaced with a pulse jet fabric filter system. The system
includes pulsing valves, step-down arrangement of bag compartments, sizing of clean air chamber exit
valves, a large clean gas chamber, and a filter bag bypass system for online overhaul. Utilising electric fields
causes particle agglomeration and enables easier capture. EFIC can effectively avoid the pressure drop
caused by the fine particles penetrating into the bag so that the PM2.5 particle collection efficiency is
improved (Huang and others, 2013).
The first EFIC was installed in the last three fields of a four-field ESP on a 660 MWe unit at the Boasham
coal-fired power plant in 2009 in China (see Figure 14). Historical ESP efficiencies averaged 80% due to
varying coal types. After the retrofit, EFIC collection efficiency reached 99.8% (30 mg/m3 outlet emission)
with low pressure drops of 900–1000 Pa, and a lower parasitic load. According to its website
(http://www.longking.com.cn) (December 2015) Fujian Longking had successfully installed EFIC on nine
600 MWe units, forty 300 MWe units, and forty units below 300 MWe. Fifty units are currently in operation.
Figure 14 Schematic of EFIC installed at Baoshan power plant (www.longking.com.cn)
ESP-FF hybrid system (EFF)
Zhejiang Feida Environmental Science & Technology Co Ltd developed an ESP-FF hybrid system (EFF),
which has a split level filter. This special design can even out gas flow inside an ESP, improve the dust
cleaning efficiency of fabric filters and fundamentally change the conventional flue gas guidance pattern.
Stable and long term operation with high efficiency and low resistivity has been achieved. Feida’s EFF has
two types: integrated and separated. The integrated type has the ESP and FF in one case, with a direct
connection between the two elements. The dust collector is separated into several passages; each chamber
has an exit damper. In the separated type, the ESP and FF are connected by a duct, and the FF area acts as
the independent dust collector consisting of several separated chambers. Each chamber is designed with a
built-in bypass duct, and entrance and exit dampers (Feida, 2015; Zhu and others, 2013).

Control technologies
IEA Clean Coal Centre – Emission standards and control of PM2.5 from coal-fired power plant
67
Feida’s first EFF system was installed at the Tianjin Chentang coal-fired power plant achieving PM
emissions of 5 mg/m3. Feida also installed EFF at the Huaneng Taichang 630 MWe, Tianjiaan 300 MWe in
China and at the Anpeila 2 x 600 MWe coal-fired power plant in India (see Figure 15).
Figure 15 Feida EFF system at Huaneng Taichang, left, and Anpeila, right, power plants (www.feida.biz)
Advanced Hybrid Collector (AHPC)
AHPC was developed in the late 1990s by the Energy and Environmental Research Center at the University
of North Dakota, USA, with funding from US DOE. The FF and ESP are integrated into the same unit,
providing a collection efficiency of >99.99% for all particle sizes ranging from 0.01 to 50 µm. Details of this
technology are described by Sloss (2004) and Zhu (2003). Following a successful pilot test in 2001, the US
DOE funded a full-scale AHPC demonstration at the Big Stone coal-fired power plant from 2002 to 2004
under the DOE Power Plant Initiative Program. Initially the AHPC achieved good results. However,
problems were soon encountered with high pressure drops, bag failure within six months, and emissions
and opacity limits not being met due to the bag failure. The reason for these problems is that high resistivity
ash was not eliminated which severely limited the effectiveness of the electrostatic zone. Big Stone decided
to replace the AHPC with a new pulse jet fabric filter (PJFF) (Lugar, 2010). The technology has not received
funding for further development since 2004.
Electrostatically stimulated fabric filter (ESFF) ‒ Max-9™
The electrostatically stimulated fabric filter (ESFF) is patented by the US EPA. General Electric is the
exclusive licensee for the ESFF, marketed as Max-9™. The operating and cleaning principles are exactly the
same as a FF, but with the addition of an electrostatic charge for enhanced collection. It combines
high voltage discharge electrodes and fabric filters in a common casing. When installed after a particulate
control device, Max-9™ can be used as a polishing filter for fine particulates and for mercury removal.
An existing pilot-scale FF at Unit 2 of Alabama Power Company’s Plant Miller in the USA was adapted to
continue the development of ESFF. Figure 16 shows the layout of the ESFF installation. Collection
efficiencies of 99.99% of particulates were achieved in the field tests. No further information about any
commercial scale installations can be found.
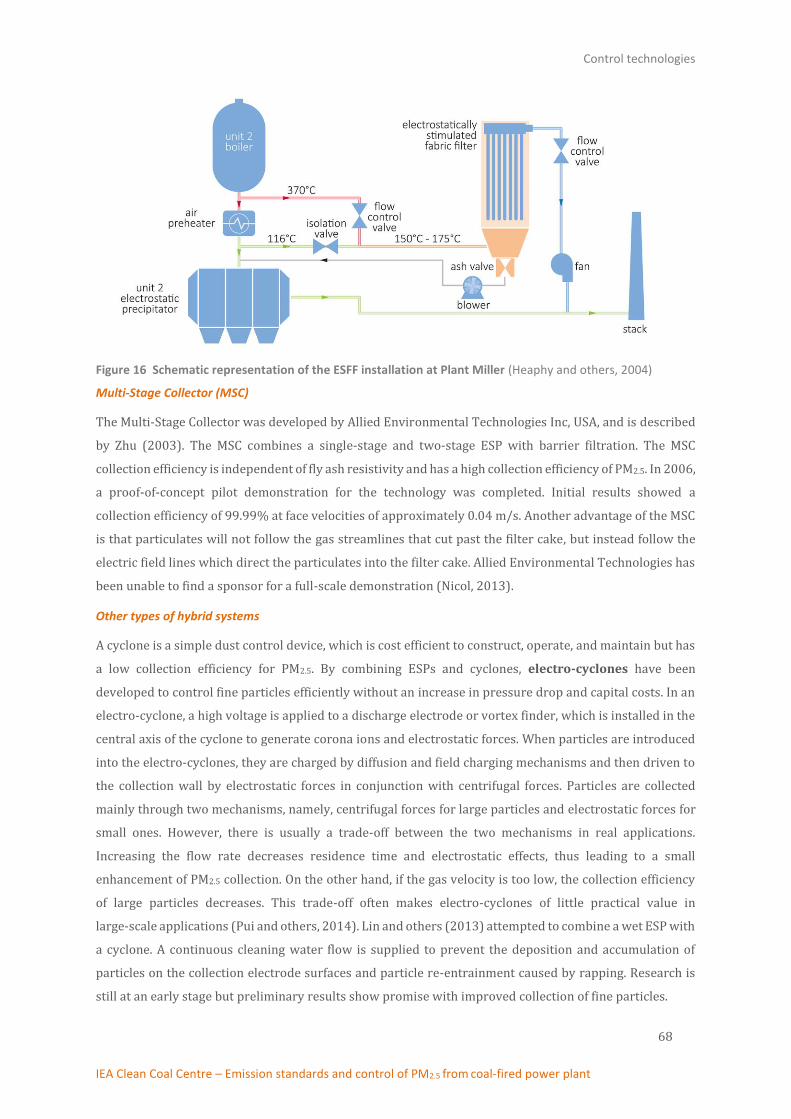
Control technologies
IEA Clean Coal Centre – Emission standards and control of PM2.5 from coal-fired power plant
68
Figure 16 Schematic representation of the ESFF installation at Plant Miller (Heaphy and others, 2004)
Multi-Stage Collector (MSC)
The Multi-Stage Collector was developed by Allied Environmental Technologies Inc, USA, and is described
by Zhu (2003). The MSC combines a single-stage and two-stage ESP with barrier filtration. The MSC
collection efficiency is independent of fly ash resistivity and has a high collection efficiency of PM2.5. In 2006,
a proof-of-concept pilot demonstration for the technology was completed. Initial results showed a
collection efficiency of 99.99% at face velocities of approximately 0.04 m/s. Another advantage of the MSC
is that particulates will not follow the gas streamlines that cut past the filter cake, but instead follow the
electric field lines which direct the particulates into the filter cake. Allied Environmental Technologies has
been unable to find a sponsor for a full-scale demonstration (Nicol, 2013).
Other types of hybrid systems
A cyclone is a simple dust control device, which is cost efficient to construct, operate, and maintain but has
a low collection efficiency for PM2.5. By combining ESPs and cyclones, electro-cyclones have been
developed to control fine particles efficiently without an increase in pressure drop and capital costs. In an
electro-cyclone, a high voltage is applied to a discharge electrode or vortex finder, which is installed in the
central axis of the cyclone to generate corona ions and electrostatic forces. When particles are introduced
into the electro-cyclones, they are charged by diffusion and field charging mechanisms and then driven to
the collection wall by electrostatic forces in conjunction with centrifugal forces. Particles are collected
mainly through two mechanisms, namely, centrifugal forces for large particles and electrostatic forces for
small ones. However, there is usually a trade-off between the two mechanisms in real applications.
Increasing the flow rate decreases residence time and electrostatic effects, thus leading to a small
enhancement of PM2.5 collection. On the other hand, if the gas velocity is too low, the collection efficiency
of large particles decreases. This trade-off often makes electro-cyclones of little practical value in
large-scale applications (Pui and others, 2014). Lin and others (2013) attempted to combine a wet ESP with
a cyclone. A continuous cleaning water flow is supplied to prevent the deposition and accumulation of
particles on the collection electrode surfaces and particle re-entrainment caused by rapping. Research is
still at an early stage but preliminary results show promise with improved collection of fine particles.

Control technologies
IEA Clean Coal Centre – Emission standards and control of PM2.5 from coal-fired power plant
69
Jaworek and his colleagues (2006) have described an electro-scrubber, which combines the advantages
of electrostatic precipitators and wet scrubbers. Unlike conventional wet scrubbers, electro-scrubbers use
spray droplets that are charged by corona discharges, induction, and electrosprays. Due to the additional
electrostatic attraction/repulsion forces between dust particles and charged scrubbing droplets,
electro-scrubbers have a high collection efficiency, especially for PM1 particles. Compared with
conventional wet scrubbers, they are also cheaper to operate, due to the lower water consumption and
pressure drop. Because of these advantages, they have been recommended as a complementary PECD
following the last stage of a conventional ESP to help remove submicron particles (Pui and others, 2014).
However, no pilot or demonstration scale test can be found for this technique.
4.3.5 Multi-pollutant control systems
Many coal-fired units now have a combination of pollution control equipment fitted. Together, these
systems can reduce emissions of both primary and secondary PM2.5 significantly. Multi-pollutant systems
remove two or more pollutants in a single reactor or a single system designed for the purpose. They can
have lower capital and operating costs than a series of traditional systems to remove the same number of
pollutants. Their footprint is often smaller than conventional single pollutant counterparts treating a
similar volume of flue gas, making them easier to install in retrofit applications. IEA CCC has produced
reports on this fast developing topic, most recently in 2013 by Carpenter. This section abstracts a few
examples from her report which are relevant to PM2.5 emissions. Developments since 2013 are included.
TOXECON™ (toxic emission control process)
EPRI has developed two technologies, TOXECON™ and TOXECON II™, for removing mercury and fine
particulates. As mentioned previously in Section 4.3.4, TOXECON™ consists of a sorbent injection system
and a compact pulse jet fabric filter, where the sorbent is injected into the duct before the fabric filter. In
TOXECON II™, the sorbent is injected into the back portion of a cold-side ESP. The TOXECON process is
suitable for many existing plants where new emissions regulations are pushing the existing ESPs beyond
their capabilities. It offers some of the benefits of COHPAC™ but at a lower capital cost. In both technologies,
fine solid particulates (PM2.5) are effectively controlled with the addition of a polishing fabric filter. Sorbent
can be added for acid gas control such as H2SO4 (PM2.5 aerosol). TOXECON™ has been installed at eight
plants. Two of the installations are described by Snyder and Wise (2015). Licensed suppliers of the
TOXECON™ technologies include Babcock & Wilcox and Hamon Research-Cottrell.
ECO® technology
Powerspan’s Electro-Catalytic Oxidation (ECO®) technology is an integrated process that removes NOx, SO2,
SO3, HCl and other acid gases, mercury and other heavy metals, and fine particulate matter in a single
system. This is achieved in three steps by using a dielectric barrier discharge (DBD) reactor, an
ammonia-based scrubber and a wet ESP. The flue gas then enters the integral wet ESP where aerosols
created in the discharge reactor and ammonia scrubbing process steps, along with mercury, other air toxics
and fine particulate matter, are captured and returned to the lower loop. The clean flue gas is emitted to
the atmosphere through the wet stack or sent on to an ECO2® unit to remove carbon dioxide. The ECO®
Control technologies
IEA Clean Coal Centre – Emission standards and control of PM2.5 from coal-fired power plant
70
technology removes significant amounts of the criteria pollutants SO2, NOx, mercury, PM2.5 and acid gases,
in most cases, to below the regulated limits.
The first demonstration of the ECO® process was built at First Energy’s R E Burger coal-fired power plant
at Shadyside, OH, USA. The ECO® unit treated a 50 MWe (equivalent) slipstream from a 156 MW front wall
boiler from February 2004 to December 2010. The ECO2® technology was tested on a 1.3 MWe slipstream
from the 50 MWe ECO® unit from December 2008 to 2010. Over 90% NOx, >98% SO2, 85% oxidised
mercury and 10 mg/m3 particulate matter were achieved over six months of testing of the ECO® system.
None of the ECO® technologies have yet been demonstrated at full-scale on a coal-fired power plant.
4.4 Comments
Both ESPs and FFs can efficiently remove fine particulates from coal-fired power plants and control PM
concentration at the stack below 20 mg/m3, with efficiency ranging from 90% to 99.9%. In order to improve
the performance of ESPs, a number of innovations have been developed. For example, China Fujian
Longking’s FGC treatment increased ESP efficiency at the Shanxi Qingshuichuan coal-fired power plant to
99.8%. Using a WESP after a dry ESP and wet FGD system, the American AES Deepwater Power Plant
achieved 97% removal efficiency for fine particulates. PM emissions from Chinese coal-fired power plants
with WESP installed are reduced to as low as 0.41 mg/m3, well below their new strict emission regulation
limit of 10 mg/m3. Hybrid systems have also improved fine PM emission control. For example, COHPAC
achieved a 99.9% collection efficiency at the Big Brown power plant in the USA. China Fujian Longking’s
EFIC has a collection efficiency of 99.8% and Feida’s EFF at Tianjin Chentang power plant has limited PM
emissions to 5 mg/m3. Therefore, with current available emission control technologies, the emission
standards for PM2.5 can be achieved.

Discussion and conclusions
IEA Clean Coal Centre – Emission standards and control of PM2.5 from coal-fired power plant
71
5 Discussion and conclusions
PM2.5 are generally classified into primary and secondary particles. Primary PM2.5 particles are those that
are directly emitted to the air. Secondary PM2.5 particles are formed from gaseous pollutants, such as SOx,
NOx, NH3, and VOCs, through nucleation, condensation, coagulation and evaporation of water droplets in
which the gases have dissolved and reacted. Secondary sulphate and nitrate particles formed from SOx or
NOx precursors are usually the dominant component in PM2.5 particles. However, when measuring PM2.5,
both the International Organization for Standardization (ISO) and US Environmental Protection Agency
(EPA) classify primary PM2.5 into filterable and condensable components.
During the last decade, regulations on PM2.5 emissions have been implemented around the world. After the
World Health Organisation (WHO) issued a guideline in 2005, PM2.5 emission limits have been included in
the air quality standards of most countries. However, all the countries covered in this report regulate PM2.5
from coal-fired power plant as part of particulate matter, that is, including PM10. This includes China which
has recently taken more interest in PM2.5 because of the smog problems in its cities.
The monitoring time periods and reference conditions for PM2.5 emission limit values (ELVs) vary from
country to country. Different countries also use different units for the ELVs. This makes it difficult to
compare emission standards. Although China’s air quality standards for PM2.5 and its precursors are less
strict than WHO’s guidelines and the European Union standards, it has stricter PM emission limits for new
coal-fired power plants. This is a challenge for plant operators as the current available emission control
technologies have to operate at an optimum level or update to new technologies in order to meet the PM
limit of under 10 mg/m3.
The most commonly used PM2.5 measuring methods were developed by the US EPA. Their methods 201A
and 202 were promulgated in the early 1990s for PM10. They were revised in 2010 by adding PM2.5
measurements. The ISO also issued three testing and measuring standards over 2009, 2012 and 2013.
Canada developed their own three measuring methods for PM2.5 emissions in 2013. Other countries are
using either the US EPA or ISO methods. Further work is required to globally standardise the measuring
methods so that research results from different countries can be accurately compared.
The majority of fine PM testing and measuring methods, such as those mentioned above, concentrate on
determining the total mass of PM2.5. High quality and comprehensive measurement methods for the
determination of the chemical components of PM2.5 need to be developed. Since the chemical composition
of PM2.5 is still not completely understood, a full chemical analysis of PM2.5 remains a challenge.
PM2.5 emissions from coal-fired power plants can be controlled before, during and after combustion.
Pre-combustion, that is, choosing a suitable coal type can be carried out through a combustion test on a
specific furnace. Fine pulverised coal tends to emit more fine ash than coarser particles. Therefore, burning
coal with the appropriate fineness can help mitigate PM2.5 emissions. Optimising combustion temperature,
burning time, and boiler load can reduce the formation and emission of fine PM. A low boiler load generates

Discussion and conclusions
IEA Clean Coal Centre – Emission standards and control of PM2.5 from coal-fired power plant
72
a larger ratio of fine PM to total particulates. Consequently, avoiding low load conditions can help reduce
PM2.5 emissions. However, post-combustion control systems are needed to meet emission limit regulations.
Electrostatic precipitators (ESP) and fabric filters (FF) are the two most commonly used conventional
particulate emission control devices. An ESP can collect 98% of PM2.5 when combined with flue gas
desulphurisation (FGD) and/or other pollutant control systems. But FFs are becoming more popular since
they are relatively simple to operate and have a higher collection efficiency – up to ~99.7% for PM2.5.
In order to improve the removal efficiency of ESPs, several innovations have been made. Of these, flue gas
conditioning (FGC) and wet ESPs (WESP) are the most successful. Injecting chemical agents and/or water
or steam into the flue gas steam can alter the physico-electrical properties of fly ash, consequently reducing
fly ash resistivity. The most common conditioning agents are sulphur trioxide, ammonia, and sodium
compounds. The SO3 FGC system is relatively easy to retrofit as it has a small footprint and a low capital
cost, and only a short outage period is needed for its installation. But use of SO3 for PM2.5 control is not
recommended if an amine-based carbon capture is contemplated in the future from the modified facility.
There are over 600 FGC installations worldwide.
The removal efficiency for fine particles can be improved by employing a WESP after the FGD system.
Additional benefits such as keeping SO3 at a low level and capturing mercury, NH3, and HCl can make WESPs
a desirable choice when considering the available options for fine PM control. WESPs could have favourable
economics for smaller coal-fired power plants or act as a final polishing stage on larger plants. There are
numerous WESP installations, especially in China.
Low temperature ESPs have drawn attention in recent years, especially ultra-low temperature
precipitation technology, which has the co-benefit of SOx control.
Agglomeration can bind fine particulates into larger ones, thus making their collection easier. Acoustic and
electrostatic agglomerators have been studied the most. The development of acoustic agglomeration into
an industrial application has been slow. This is probably because of the lack of a suitable high-intensity,
high-efficiency sound source and appropriate full-scale agglomeration chambers. A two-stage electrostatic
agglomeration process was developed by Indigo Technologies of Australia, and installed on several power
plants in Australia, the USA and China. Unfortunately, the company has gone into liquidation.
Hybrid systems combine the advantages of ESP and FF. This technology has improved PM collection
efficiency to 99.99%. The US EPRI’s Compact Hybrid Particulate Collector (COHPAC), China Fujian
Longking’s Electrostatic Fabric Integrated Collector (EFIC), and China Feida’s ESP-FF hybrid system (EFF)
are all commercially available. The Advanced Hybrid Collector (AHPC), Electrostatically Stimulated Fabric
Filter, and Multi-Stage Collector (MSC) all have promise but need further investment and demonstration
trials before they can be brought to the market.
Multi-pollutant control systems that include a FF or ESP element are commercially available. As well as
achieving a high PM2.5 collection efficiency, they can capture additional pollutants and can have lower

Discussion and conclusions
IEA Clean Coal Centre – Emission standards and control of PM2.5 from coal-fired power plant
73
capital and operating costs than a series of traditional systems to remove the same number of pollutants.
Commercially available technologies with the most benefit for fine particulate control are the TOXECON™
and ECO® systems.
In the early 1990s, the USA led the world in PM2.5 research. As a result, PM2.5 was first regulated in this
country and technologies developed for its control. In the last decade, China has renewed interest in PM2.5.
They have carried out a large amount of research, and imported and made innovations to a number of
technologies for emissions control. China has also developed and installed a number of modern
technologies, such as flue gas conditioning and hybrid ESP/FF systems. About 90% of the literature on PM2.5.
published since 2010 originated in China. This obviously shows the Chinese determination to control PM2.5
emissions and clean the air. However, China still has a huge air pollution problem. Beijing issued its first
‘red’ air pollution alert on 7 December 2015, suspending schools, restricting car travel and banning outdoor
barbecuing and fireworks.
There are no miracle technologies for PM2.5 emission control. Individual coal-fired power plants vary in
aspects, such as type of coal used, location, water resources, space availability, funding and local labour
cost. Consequently, performance from a certain particulate control technology on a specific plant may not
be achieved on other plants. However, providing correct assessments and management are undertaken,
the emission standards set up by each country and region will be achievable with currently available
pollution control technologies.

References
IEA Clean Coal Centre – Emission standards and control of PM2.5 from coal-fired power plant
74
6 References
Amec Foster Wheeler (2014) Innovative technologies for clean air. Available at: https://www.amecfw.com/documents/downloads/sector-service-documents/technologies-for-clean-air.pdf, 12 pp (2014)
Appleyard D (2015) Filtering out power plant emissions. Power engineering international; 10; 18-21 (Oct 2015)
Australian Department of Environment (2015) Working towards a national clean air agreement – discussion paper. Available at: http://www.environment.gov.au/protection/air-quality/national-clean-air-agreement/consultation, 19 pp (Mar 2015)
Australian NHMRC (2000) National guidelines for control of emission of air pollutants from new stationary sources. Avaiable at: , http://www.nhmrc.gov.au/guidelines-publications/eh4, 16 pp (2000)
Australian NEPC (2003) National environment protection (ambient air quality) measure. Office of Legislative Drafting, Attorney-General’s Department, Canberra. Available at: http://www.scew.gov.au/nepms/ambient-air-quality, 20 pp (Jul 2003)
Australian NEPC( 2008) National environment protection (national pollutant inventory) measure 1998. Available at: http://www.legislation.gov.au/Details/F2008C00620, 32 pp (Nov 2008)
Australian NEPC (2011) National environment protection (ambient air Quality) measure review. ADELAIDE SA, Australia, National Environment Protection Council Service Corporation, 55 pp (May 2011)
Australian NSW EPA (2010) Protection of the environment operations (clean air) regulation 2010. Available at: http://www.legislation.nsw.gov.au/maintop/view/inforce/subordleg+428+2010+cd+0+N, v pp (2010)
Australian Northern Territory EPA (2001) National protection measure for ambient air quality – mornitoring plant for Northern Territory. Available at: http://www.scew.gov.au/resource/national-environment-protection-ambient-air-quality-measure-annual-reporting, 52 pp (May 2001)
Australian SA EPA (2005) South Australia environment protection (air quality) policy 1994 under the environment protection act 1993. Available at: http://www.legislation.sa.gov.au/LZ/C/POL/ENVIRONMENT%20PROTECTION%20%28AIR%20QUALITY%29%20POLICY%201994.aspx, 7 pp (2005)
Australian TAS EPA (2004) Environment protection policy (air quality) 2004. Available at: http://epa.tas.gov.au/documents/epp_air_quality_2004.pdf, 21 pp (Dec 2004)
Australian Victoria Government (2001) State environment protection policy (air quality management) established the framework for managing emissions into the air in Victoria from all sources. Available at: http://www.gazette.vic.gov.au/gazette/Gazettes2001/GG2001S240.pdf, 52 pp (Dec 2001)
Austalian WA EPA (2003) Environmental protection (Goldfields residential areas) (sulfur dioxide) policy order 2003. Available at: http://www.slp.wa.gov.au/legislation/statutes.nsf/main_mrtitle_304_homepage.html, 8 pp (Feb 2003)
BS EN ISO (2009) Stationary source emissions – determination of PM10/PM2.5 mass concentration in flue gas – measurement at low concentrations by use of impactors (ISO 23210:2009). British standards BS EN ISO 23210:2009, 54 pp (Aug 2004)
BS ISO (2012) Stationary source emissions – determination of PM10/PM2.5 mass concentration in flue gas – measurement at higher concentrations by use of virtual impactors (ISO 13271:2012). British standards BS ISO13271:2012, 52 pp (15 Jun 2012)

References
IEA Clean Coal Centre – Emission standards and control of PM2.5 from coal-fired power plant
75
BS ISO (2015) Stationary source emissions – test method determining PM2.5 and PM10 mass in stack gases using cyclone samplers and sample dilution (ISO 25597:2013). British standards BS ISO 25597:2013, 79 pp (Sep 2015)
Carpenter A M (2013) Advances in multi-pollutant control. CCC/227, London UK, IEA Clean Coal Centre, 54 pp (Nov 2013)
Chen D, Wu K, Mi J (2016) Experimental investigation of aerodynamic agglomeration of fine ash particles from a 330MW PC-fired boiler. Fuel; 165; 86-93 (Jan 2016)
China MEP (2010) Guideline on Best Available Technologies of Pollution Prevention and Control for Coal-fired Power Plant Industry (on Trail). Available at: http://www.mep.gov.cn/gkml/hbb/bwj/201003/W020100302496220984514.pdf, 33 pp (Feb 2010)
China MEP (2011) Emisson standard of air pollutants for thermal power plants. Available at: http://english.mep.gov.cn/standards_reports/standards/Air_Environment/Emission_standard1/201201/W020110923324406748154.pdf, 11 pp (29 Jul 2012)
China MEP (2012) Ambient air quality standards. Available at: http://kjs.mep.gov.cn/hjbhbz/bzwb/dqhjbh/dqhjzlbz/201203/W020120410330232398521.pdf, 12 pp (29 Feb 2012)
China MEP (2014) Emission standard of air pollutants for boiler. Available at: http://kjs.mep.gov.cn/hjbhbz/bzwb/dqhjbh/dqgdwrywrwpfbz/201405/t20140530_276318.htm, 9 pp (16 May 2012)
China NDRC, MEP, and NEA (2014) Action plan of upgrade and renovation of coal power for energy Conservation and emission Reduction (2014-2020). Available at: http://bgt.ndrc.gov.cn/zcfb/201409/t20140919_626242.html, 19 pp (12 Sep 2014)
China NDRC, MEP, and NEA (2015) Working programme for implementation of the ultralow emission and energy saving renovation for Coal Power Plants. Available at: http://www.mep.gov.cn/gkml/hbb/bwj/201512/t20151215_319170.htm, 11 pp (11 Dec 2015)
China NPC (2015) Air Pollution Control Law. Available at: http://www.npc.gov.cn/npc/xinwen/2015-08/31/content_1945589.htm, (29 Aug 2015)
China State Council (2014) Energy Development Strategy Action Plan (2014-2020). Available at: http://www.gov.cn/zhengce/content/2014-11/19/content_9222.htm, v pp (7 Jun 2014)
Daly M (2015) Court orders EPA to redo air-pollution limits in 13 states. Available at: http://www.power-eng.com (28 Jul 2015)
Environment Canada (2013) Reference method for source testing: measurement of releases of fine particulate matter from stationary sources. Environment Canada, Ottawa ON, Canada, Science & Technology Branch. Available at: https://www.ec.gc.ca/lcpe-cepa/default.asp?lang=En&n=62C9AB21-1, Reference Method EPS 1/RM/55, 51 pp (Dec 2013)
European Commission (2001) Directive 2001/80/EC of the European Parliament and of the Council of 23 October 2001 on the limitation of emissions of certain pollutants into the air from large combustions plants. Available at: http://eur-lex.europa.eu/legal-content/EN/TXT/?uri=CELEX:32001L0080, Official Journal of the European Union, Seville, Spain, European Commission, 21 pp (27 Nov 2010)
European Commission (2006) Integrated Pollution Prevention and Control Reference Document on Best Available Techniques for large combustion plants. Available: http://eippcb.jrc.ec.europa.eu/reference/BREF/lcp_bref_0706.pdf, 618pp (Jul 2006)
European Commission (2008) Directive 2008/50/EC of the European Parliament and of the Council of 21 May 2008 on ambient air quality and cleaner air for Europe. Available at: http://eur-lex.europa.eu/legal-content/EN/TXT/?uri=CELEX:32008L0050, Official Journal of the European Union, Seville, Spain, European Commission, 44 pp (11 Jun 2008)

References
IEA Clean Coal Centre – Emission standards and control of PM2.5 from coal-fired power plant
76
European Commission (2010) Directive 2010/75/EU of the European Parliament and of the Council of 24 November 2010 on industrial emissions (integrated pollution prevention and control) (Recast). Available at: http://eur-lex.europa.eu/legal-content/EN/TXT/?uri=CELEX:32010L0075, Official Journal of the European Union, Seville, Spain, European Commission, 103 pp (17 Dec 2010)
European Commission (2015) Directive 2015/2193 of the European Parliament and of the Council of 25 November 2015 on the limitation of emissions of certain pollutants into the air from medium combustion plants. Available at: http://eur-lex.europa.eu/legal-content/EN/TXT/?uri=CELEX:32015L2193, Official Journal of the European Union, Seville, Spain, European Commission, 19 pp (25 Nov 2015)
European Environment Agency (2015) European Union emission inventory report 1990–2013 under the UNECE Convention on Long-range Transboundary Air Pollution (LRTAP). European Environment Agency, Copenhagen, Denmark. EEA Technical report No 8/2015, ISBN 978-92-9213-655-0, 127 pp (2015)
European IPPC Bureau (2013) Best Available Techniques (BAT) Reference Document for the large combustion plants (draft 1). Report number TL/MC/AP/EIPPCB/LCP_Draft 1. Available at: http://eippcb.jrc.ec.europa.eu/reference/BREF/LCP_D1_June_online.pdf, European IPPC Bureau of the Commission's Joint Research Centre, 884 pp (17 Dec 2010)
European IPPC Bureau (2015) Chapter 10 Best available techniques (BAT) conclusions for large combustion plants. Report number TL/JFF/EIPPCB/Revised LCP_draft. Available at: http://ippc.mos.gov.pl/ippc/custom/LCPBATconclusionsfinal(1).pdf, 113 pp (Apr 2015)
Feida (2015) Feida breaks international low PM emissions record. Available at: http://www.feida.biz/news/shownews.php?lang=cn&id=144, (9 Oct 2015)
Fernando R (2003) SO3 issues for coal-fired plant. CCC/72, London UK, IEA Clean Coal Centre, 54 pp (Sep 2003)
Flynn V (2015) New large plant pollution standards under fire. ENDS Europe; 12 June 2015, available at: http://www.endseurope.com/41649/new-large-plant-pollution-standards-under-fire?referrer=search, 1 pp (Jun 2015)
Goto S, Masuda K, Nakanura M, Sueyoshi M, Future T, Uchida Y, Hatazaki H (2009a) A study of coal type selection for a coal fired power plant considering coal and fly ash properties. International Journal of Innovative Computing, Information and Control; 5(1); 215-223 (Jan 2009)
Goto S, Katafuchi S, Sueyoshi M, Furue T, Uchida Y, Hatazaki H, Nakamura M (2009b). Coal type selection for thermal power plants through combustion state estimation. In 2009 ICROS-SICE International Joint Conference, Fukuoka, Japan, 18–21 Aug 2009. pp 2888-2893(Aug 2009)
Heaphy R F, Cushing K M, Harrison WA (2004) Improved Control of Primary Fine Particulate Emissions with Electrostatically Augmented Fabric. Filtration. In 9th international conference on electrostatic precipitation (ICESP XII), Mpumalanga, South Africa, 17 - 21May 2004, 15 pp (May 2004)
Huang W, Xiu H, Lin H, Zheng K, Chen K, Zhu Z, Deng X, Han Z (2013) Experimental Research on EFIP Technology. In 13th international conference on electrostatic precipitation (ICESP XII), Bangalore, India, 16-21Sep 2013. 12 pp (2013)
IEA (2014) Coal information 2014. Paris, France, OECD/IEA, v pp (Aug 2014)
IEA CCC (2015) Emission standards database. Available at: http://www.iea-coal.org.uk/site/2010/database-section/emission-standards, retrieved on Sep 2015
India CPCB (2009) National air quality standards. Available at: http://cpcb.nic.in/images/nationalabiant.gif, retrieved on 15 Sep 2015
India CPCB (2015) Standards for emission or discharge of environmental pollutants from thermal power plants. Available at: http://cpcb.nic.in/Industry-Specific-Standards/Effluent/425.pdf, retrieved on 15 Sep 2015

References
IEA Clean Coal Centre – Emission standards and control of PM2.5 from coal-fired power plant
77
Indian Ministry of Environment and Forests (1986) Environment (Protection) Act, 1986. Available at: http://www.moef.nic.in/sites/default/files/eprotect_act_1986.pdf, 15 pp (May 1986)
Infozentrum UmweltWirtschaft (2013) Provisions aimed at transposing the EU Directive on industrial emissions. Available at: http://www.izu.bayern.de/aktuelles/detail_aktuelles.php?pid=01060101002301, retrieved on 15 Sep 2015
Japan MOE (2015a) Environmental Quality Standards in Japan - Air Quality. Available at: http://www.env.go.jp/en/air/aq/aq.html, retrieved on 1 Sep 2015
Japan MOE (2015b) Regulatory measures against air pollutants emitted from factories and business sites and the outline of regulation. Available at: http://www.env.go.jp/en/air/aq/air.html, retrieved on 1 Sep 2015
Jaworek A, Balachandran W, Krupa A, Kulon J, Lackowski M (2006) Wet electroscrubbers for state of the art gas cleaning. Environmental science & technology, 40(20); 6197-6207 (2006)
Kong S, Ji Y, Li Z, Lu B, Bai Z (2013) Emission and profile characteristic of polycyclic aromatic hydrocarbons in PM2.5 and PM10 from stationary sources based on dilution sampling. Atmospheric Environment; 77; 155-165 (2013)
Li Y, Zhao C, Wu X, Lu D, Han S (2007) Aggregation experiments on fine fly ash particles in uniform magnetic field. Powder technology; 174(3), 93-103 (2007)
Li X, Wang X, Duan L, Hao J, Long Z (2011) Design of a compact dilution sampler for stationary combustion sources. Journal of the Air & Waste Management Association; 61;1124–1130 (Nov 2011)
Li F Q, Zhang X F, Ren J X, Li Y C, Cui H, Li Z (2013) Emissions and control technology of PM2.5 in coal-fired power plant. Advanced materials research; 610; 2058-2062 (Feb 2013)
Lin Y, Liu W (2011) Development of Chinese Electrostatic Precipitator Technology. In 12th international conference on electrostatic precipitation (ICESP XII), Nuremburg, Germany, 9-13 May 2011. Available from: www.isesp.org/ICESP%20Confernence%20Papers.htm, 14 pp (2011)
Lin G Y, Cuc L T, Lu W, Tsai C J, Chein H M, Chang F T (2013) High-efficiency wet electrocyclone for removing fine and nanosized particles. Separation and Purification Technology; 114; 99-107 (2013)
Liu Q, Chen X, Chen W (2008) The Technical and Economical Analysis on the Application of FGC in Large Scale Coal-fired Units. In 11th International Conference on Electrostatic Precipitation, Hangzhou, China, Oct 2008. Available at: www.isesp.org/ICESP%20XI%20PAPERS/ICESP%20XI%20Papers%20TOC.htm, p 412-415 (Oct 2008)
Liu J, Zhang G., Zhou J, Wang J, Zhao W, Cen K (2009) Experimental study of acoustic agglomeration of coal-fired fly ash particles at low frequencies. Powder Technology; 193(1); 20-25 (2009)
Liu J Z, Wang J, Zhang G X, Zhou J H, Cen K F (2011) Frequency comparative study of coal-fired fly ash
acoustic agglomeration. Journal of Environmental Sciences; 23(11);1845–1851 (2011)
Liu Q, Zou B, Chen W, Zhang F, Guo J (2011) Successful application and economical analysis of home-produced flue gas conditioning equipment. In 12th international conference on electrostatic precipitation (ICESP XII), Nuremburg, Germany, 9-13 May 2011. Available from: www.isesp.org/ICESP%20Confernence%20Papers.htm, 7 pp (2011)
Lu J, Ren X (2014) Analysis and discussion on formation and control of primary particulate matter generated from coal-fired power plants. Journal of the Air & Waste Management Association; 64(12); 1342-1351 (2014)
Lu B, Wang X, Lin X (2015) The successful application of SO3 flue gas conditioning system in the ShanXi Qingshuichuan power plant. Huandian technologies; 1; 1-4 (Jan 2015)

References
IEA Clean Coal Centre – Emission standards and control of PM2.5 from coal-fired power plant
78
Lugar T (2009) The ultimate ESP rebuild: casing conversion to a pulse jet fabric filter, a case study. In APC/PCUG conference, The Woodlands, TX, USA, 12-16 Jul 2009. 53 pp (2009)
Moretti A L, Jones C S (2012) Advanced Emissions Control Technologies for Coal-Fired Power Plants. In Power-Gen Asia, Bangkok, Thailand, 3-5 October 2012. 11 pp (Oct 2012)
Miller B (2015) Fossil fuel emissions control technologies - stationary heat and power systems. 1st edition. Elsevier, UK, Oxford. ISBN 9780128015667, 514 pp (May 2015)
Myllyvirta L (2015) Smoke & mirrors How Europe’s biggest polluters became their own regulators. Brussels, Belgium, Greenpeace European Unit, 38 pp (Apr 2015)
Nicol K (2013) Recent developments in particulate control. CCC/218, London UK, IEA Clean Coal Centre, 54 pp (Mar 2013)
Niemelä V, Lamminen E, Laitinen A (2008) A novel method for particle sampling and size-classified electrical charge measurement at power plant environment. In 11th International Conference on Electrostatic Precipitation, Hangzhou, China, Oct 2008. Available at: www.isesp.org/ICESP%20XI%20PAPERS/ICESP%20XI%20Papers%20TOC.htm, p 228-233 (Oct 2008)
Ninomiya Y, Zhang L, Sato A, Dong Z (2004) Influence of coal particle size on particulate matter emission and its chemical species produced during coal combustion. Fuel processing technology; 85(8); 1065-1088 (Jul 2004)
Ottery C (2015) Q&A: Large combustion plants ‘BREF’ standards. Available at: http://energydesk.greenpeace.org/2015/03/05/qa-large-combustion-plants-bref-standards/, 1 pp (5 Mar 2015)
Oettinger M (2016) Private communication (Apr 2016)
Patdu K (2012) Compliance and enforcement of air quality standards in Asia. Implications to climate change mitigation. In 2012 AECEN Forum, Bangkok, Thailand, 28-30 Mar 2012. 24 pp (Mar 2012)
Pentol GmbH (2015) Flue gas conditioning. Available at: www.pentol.net, 12 pp (2015)
Pui D Y, Chen S C, Zuo Z (2014) PM2.5 in China: Measurements, sources, visibility and health effects, and mitigation. Particuology; 13; 1-26 (2014)
Seyfert N (2011) WESP (wet precips) for CCS and utility market increasing business opportunities for large scale WESPs. In 12th international conference on electrostatic precipitation (ICESP XII), Nuremburg, Germany, 9-13 May 2011. Available from: www.isesp.org/ICESP%20Confernence%20Papers.htm, 13 pp (May 2011)
Snyder RE, Wise T J (2015) Examination of the TOXECON® process at large U.S. utility plants. In Power-Gen Asia, Bangkok, Thailand, 1-3 Sep 2015, 18 pp (Sep 2015)
Seppälä T, Skroch R (2011) Ion blast precipitator. In 12th international conference on electrostatic precipitation (ICESP XII), Nuremburg, Germany, 9-13 May 2011. Available from: www.isesp.org/ICESP%20Confernence%20Papers.htm, 5 pp (2011)
Shanthakumar S, Singh D N, Phadke R C (2008) Flue gas conditioning for reducing suspended particulate matter from thermal power stations. Progress in Energy and Combustion Science; 34(6); 685-695 (Dec 2008)
Shu Y G, Li J G, Zhao Y S, Zhang H, Liu W P (2013) Review on the Development of Electrical Precipitation Industry in China. In 13th international conference on electrostatic precipitation (ICESP XII), Bangalore, India, 16-21 Sep 2013. 5 pp (2013)
Silva A A, Moretti A L, Liu T (2015) Wet electrostatic precipitator (ESP) designs to achieve ultra-low particulate emissions. In Power-Gen Asia, Bangkok, Thailand, 1-3 Sep 2015. 21 pp (2015)

References
IEA Clean Coal Centre – Emission standards and control of PM2.5 from coal-fired power plant
79
Sloss L L (2004) The importance of PM10/2.5 emissions. CCC/89, London UK, IEA Clean Coal Centre, 76 pp (Oct 2004)
Snyder R E, Moretti A L, Tonn D P, Silva A A, Kumar S, Lau A (2008) SO3 and Fine Particulate Mitigation at AES Deepwater. In 7th Power Plant Air Pollutant Control Mega Symposium, Baltimore, Maryland, USA, 25-28 Aug 2008. 9 pp (Aug 2008)
Snyder R E, Wise T J (2015) Examination of the TOXECON ® process at large U.S. utility plants. In Power-Gen Asia, Bangkok, Thailand, 1-3 Sep 2015. 18 pp (2015)
Staehle R C, Triscori R J, Kumar K S, Ross G, Cothron R (2003) Wet electrostatic precipitators for high efficiency control of fine particulates and sulfuric acid mist. In Institute of Clean Air Companies (ICAC) Forum, Nashville, TN, USA, 14–15 Oct 2003, 17 pp (Oct 2003)
Thailand PCD (2015) Air quality and noise standard. Available at: http://www.pcd.go.th/info_serv/en_reg_std_airsnd01.html, 1 pp (retrieved Dec 2015)
Trivedi S N, Phadke R C (2008) Flue Gas Conditioning. In 11th international conference on electrostatic precipitation, Hangzhou, China, 20-25 Oct 2008. Available at: www.isesp.org/ICESP%20XI%20PAPERS/ICESP%20XI%20Papers%20TOC.htm, p 389-394 (Oct 2008)
UK EA (2012) Technical guidance note (monitoring) M15 - Monitoring PM10 and PM2.5. Available at: https://www.gov.uk/government/publications/m15-monitoring-pm10-and-pm25, 16 pp (Jul 2012)
UK EA (2013) Technical guidance note (monitoring) M2 - Monitoring of stack emissions to air. Available at: https://www.gov.uk/government/publications/m2-monitoring-of-stack-emissions-to-air, 89 pp (Oct 2013)
US EPA (2004) Conditional test method (CTM) 039 measurement of PM2.5 and PM10 emissions by dilution sampling (constant sampling rate procedures). Available at: http://www3.epa.gov/ttn/emc/promgate.html, 77 pp (Jul 2004)
US EPA (2006) Lists of potential control measures for PM2.5 and precursors. Available at: http://www3.epa.gov/pm/measures.html, 59 pp (2006)
US EPA (2010a) Method 201A - Determination of PM10 and PM2.5 emissions from stationary sources (constant sampling rate procedure). Available at: http://www3.epa.gov/ttn/emc/promgate.html, 44 pp (Dec 2010)
US EPA (2010b) Method 202 -. Dry impinger method for determining condensable particulate emissions from stationary sources. Available at: http://www3.epa.gov/ttn/emc/promgate.html, 27 pp (Dec 2010)
US EPA (2015a) Particulate matter (PM) standards - table of historical PM NAAQS. Available at: http://www.epa.gov/ttn/naaqs/standards/pm/s_pm_history.html, retrieved on 23 July 2015
US EPA (2015b) Regulatory Actions. Available at: http://www.epa.gov/pm/actions.html, retrieved on 23 July 2015
US EPA (2015c) Acid Rain Program. Available at: http://www.epa.gov/airmarkets/programs/arp/index.html, retrieved on 23 July 2015
US EPA (2015d) Interstate Air Pollution Transport. Available at: http://www.epa.gov/airtransport, retrieved on 23 July 2015
Wang Z (2014) Facing the smog. Beijing, China, China Electric Power Press, 365 pp (Aug 2014)
Watanabe T, Tochikubo F, Koizurni Y, Tsuchida T, Hautanen J, Kauppinen E I (1995) Submicron particle agglomeration by an electrostatic agglomerator. Journal of Electrostatics; 34(4); 367-383 (1995)
Wates J (2015) Re: Revision of Best Available Techniques Reference Documents (BREF) for large combustion plants. Brussels, Belgium, European Environmental Bureau, 1 pp (23 Mar 2015)
References
IEA Clean Coal Centre – Emission standards and control of PM2.5 from coal-fired power plant
80
WHO (2006) WHO air quality guidelines for particulate matter, ozone, nitrogen dioxide and sulfur dioxide, Global update 2005, Summary of risk assessment. Geneve, Switzerland, World Health Organisation, report number WHO/SDE/PHE/OEH/06.02, 22 pp (2006)
Wilkins J, Wilkinson L, Li D (2008) Emission reductions at a Chinese power station. In 11th international conference on electrostatic precipitation, Hangzhou, China, 20-25 Oct 2008. Available at: www.isesp.org/ICESP%20XI%20PAPERS/ICESP%20XI%20Papers%20TOC.htm, p 215-222 (Oct 2008)
Win Lee S, Herage T, Dureau R, Young B (2013) Measurement of PM2.5 and ultra-fine particulate emissions from coal-fired utility boilers. Fuel; 108; 60-66 (2013)
Wu Z (2001) Air pollution control costs for PCC. CCC/53, London, UK, IEA Clean Coal Centre, 42 pp (Oct 2001)
Yang H, Lee K, Hsieh Y, Luo S, Li M (2014) Filterable and condensable fine particulate emission from stationary sources. Aerosol and air quality research, 14, 2010-2016, (2014)
Yao Q, Li, S Q, Xu, H W, Zhuo J K, Song Q (2009) Studies on formation and control of combustion particulate matter in China: A review. Energy; 34(9); 1296-1309 (Sep 2009)
Zhang H, Meng, Guo J (2011) Industrial application of electromechanical double-zone ESP. In 12th international conference on electrostatic precipitation (ICESP XII), Nuremburg, Germany, 9-13 May 2011. Available from: www.isesp.org/ICESP%20Confernence%20Papers.htm, 5 pp (2011)
Zhou T, Wang Z H, Yang R C (2005) Optimization and improvement of PM2.5 thermophoretic deposition efficiency in turbulent gas flowing over tube surfaces. Journal of Colloid and Interface Science; 289(1); 36-41 (Sep 2005)
Zhou D, Luo Z, Fang M, Xu H, Jiang J, Ning Y, Shi Z (2015) Preliminary Experimental Study of Acoustic Agglomeration of Coal-fired Fine Particles. Procedia Engineering, 102, 1261-1270 (2015)
Zhu Q (2003) Developments in particle control. CCC/73, London, UK, IEA Clean Coal Centre, 50 pp (Sep 2003)
Zhu J, Du Y, Luo S (2013) The application of ESP-FF hybrid dust collector in India coal-fired power plant 600MW unit. In 13th international conference on electrostatic precipitation (ICESP XII), Bangalore, India, 16-21 Sep 2013. 5 pp (2013)
Zhu F, Wang L (2014) Analysis on technology-economy and environment benefit of ultra-low emission from coal-fired power units. Environmental Protection; 42(21); 28-33 (2014)