emissions from biodiesel blends and neat biodiesel · emissions frombiodiesel blends and neat...
TRANSCRIPT

r-
FINAL REPORT
EMISSIONS FROM BIODIESEL BLENDS AND NEAT BIODIESELFROM A 1991 MODEL SERIES 60 ENGINE
OPERATING AT HIGH ALTITUDE
TO
NATIONAL RENEWABLE ENERGY LABORATORY
BY
COLORADO INSTITUTE FOR FUELS AND HIGH ALTITUDE ENGINERESEARCH
SEPTEMBER, 1994

1.0 INTRODUCTION AND SUMMARY
The purpose of this study was to investigate the effect of adding methylsoyester,biodiesel, to a base diesel tiel on emissions from a Detroit Diesel Series 60 engine. Theengine chosen is a modern four stroke engine with 1991 calibration. The hardware istypical of current on-road engine technology and has been extensively used for fielemission studies (Unman, et al., 1990). Thus, the impact of various fhel compositions onemissions from the series 60 is well established. The 1991 Series 60 is also the enginespecified by the California Air Resources Board for California diesel fiel certification.
In the current investigation, regulated emissions NO,, CO, THC, and PM weredetermined for five fiels. These were a reference diesel, and candidate 200A, 35’Yo, 650)4and 100°/0 methyl soyester blends in the reference diesel.
The reference diesel, a low sulfhr, 30% aromatic content, commercial Number 2diesel fiel without additives, was obtained from Colorado Petroleum, Inc. Soyester wassupplied by Interchem, Kansas City, MO, and manufactured by Procter and Gamble. Fuelanalyses are reported in the body of the report. Testing was conducted following the EPAheavy duty transient test protocol. Composite testing was performed; for the referenceand each candidate be], one cold test and up to three hot tests were conducted. Eachcandidate fiel was also bracketed by three hot tests on the reference diesel. In this way,the effect of engine drill on emissions could be separated from fiel effects.
All testing was performed against the reference diesel map. This does not conformwith the Code of Federal Regulations which requires a separate map for each fiel forengine certification purposes. However, this has become the accepted way to examine theeffect of fiel properties on emissions by EPA, industry groups like CRC, and stateagencies like CARB
The results of the testing are in general agreement with studies on other engines.As the soyester composition increased, the NOX emission increased, while the THC, COand PM decreased. For 350/0 biodiesel, the composite NOX emission increased by 0.97°/0while the composite particulate emission decreased by 26. 13°/0 relative to the referencediesel. The NOX change is statistically significant at the 99% level. For the neat ester, thecomposite NOX increased by 1 1.50/0 while PM was decreased by 66.0°/0. CO was reducedby 47. O’?40 and total hydrocarbon by 43 .8’XO. For the neat ester, the composite NOX
emission exceeded the 1991-1994 NOX emission standard of 5 gm/bhp-hr NOX. Thecomposite PM emission met the 1994 standard of 0.1 gm/bhp-hr. Altitude does notincrease NOX emissions to a measurable effect. However, PM is typically increased bymore than 1.5 times. The test engine is calibrated at low altitude for 0.25 gm/bhp-hr PMand typically emits O. 18 gm/bhp-hr. Thus, the O. 1 PM level with no atlertreatment fromthis engine is considered remarkable

2
A preliminary emissions model describing the effect of aromatics content, cetanenumber, and oxygen content has been developed by us in this report. The model allowsprediction of how base diesel fhel properties should be changed for formulation of NO,neutral biodiesel blends as compared to certification diesel fiel. Modest to substantialchanges in aromatics content or cetane number should lead to NOX neutral 20°/0 and 3 5°/0biodiesel blends.
Engine efficiency was found to be the same for biodiesel and biodiesel blends asfor the reference fiel. Fuel consumption for biodiesel blends can therefore be calculatedfrom diesel fiel economy data.
2.0 TEST MATRIX AND FUELS
In the test program, four different biodiesel fiels were compared against areference diesel fhel. The reference fhel was a commercial Number 2 diesel fiel whichwas obtained additive-free from the supplier. Biodiesel manufactured by Procter andGamble was blended by weight to 20%, 35’?40, 65% and 100% levels. No analysis of themethyl soyester content of the biodiesel was obtained, However, the supplier, Interchem,indicated that the fuel was double distilled and the ester content of the biodiesei exceeded99!/0.
All fiels were prepared gravimetrically by blending from single lots of thereference diesel with ester. Table 1 provides a summary of the fiels used in this study.The cetane numbers reported in Table 1 were measured for the actual blends by CoreLaboratories in Houston, Texas. Other fiel analyses were conducted by HauserLaboratories, Boulder, Colorado, including the biodiesel elemental analysis. Hauserdetermines chemical oxygen directly by oxidative coulometry. The oxygen content ofblends was determined from the measured oxygen content of the two fiel stocks and thevery accurately known weight percent of each stock in a given blend.
2.1 TEST MAP
The test matrix was carried out against the torque map for the diesel referencefiel. The map is used to generate the transient cycle commands. By using a single map,all measurements were made against an identical test cycle. Because of the greater energydensity of diesel fiel, the engine is capable of generating both the greatest torque andgreatest horsepower on the reference diesel at wide open throttle. Running other fiels onthe diesel map would force them to perform from a load perspective as equal to diesel aspossible. Because the blend fhels are lower in energy density, they will not generate thesame wide open throttle power as Number 2 diesel, but can meet all intermediate load setpoints.

2.2 MAPPING CONDITIONS
The engine was mapped according to parameters provided by Detroit Diesel with asingle exception. The rated idle speed for engine at sea level is 600 RPM. We found thatthe engine generated excessive hydrocarbon and particulate emissions due to misfire at thislow idle speed. We elected to map at 650 RPM for idle; this eliminated the emissionsproblem.
The engine was mapped at the nominal conditions in Table 2. Temperature andpressure settings are reported for the engine operating at rated speed and wide openthrottle.
Prior to running each fbel, the engine was filly warmed and the map conditionswere checked to insure that the engine operated on the fbel blend. No adjustments weremade in the map parameters, however, since the reduced power generated on the otherfiels results by necessity in lower pressures and temperatures. Importantly, the diesel mapwas checked several times to confirm that there was an insignificant petiormance changeover the campaign for Number 2 diesel.
At the completion of the 20% biodiesel run, the Number 2 diesel map wasinadvetiently destroyed. The engine was remapped on Number 2 and the test programcontinued. The cycle performance between the first map and second map was comparedand considered acceptably close (less than 10/0 in cycle work) so that the 20°/0 biodieselblend was not rerun.
Table 3 presents a summary of map data for the various fhels at even speedincrements. As Table 3 shows, the torque values at all speed ranges are a weak fimctionof biodiesel content. Torque at wide open throttle appears to be increased at speeds nearidle and reduced at higher speeds.
2.3 TEST RUNS
Table 4 shows the test plan for the program. Each blend tested was bracketed by aseries of reference diesel tests. This protocol, while time consuming, provides for theability to correlate emissions while engine drift is occurring. Drift is natural and may evenbe enhanced by the detergent action of oxygenates. The effect is small but very importantfor NOX emissions since the NOX change is on the order of l% for the lower biodieselconcentrations.
PROPERTYCARBON, WTO/o
HYDROGENOXYGEN
NITROGENSULFUR
FIA SATURATES, VOLOAOLEFINS
AROMATICSAPI GRAVITY
H3P, F10”A50%90°AEP
4
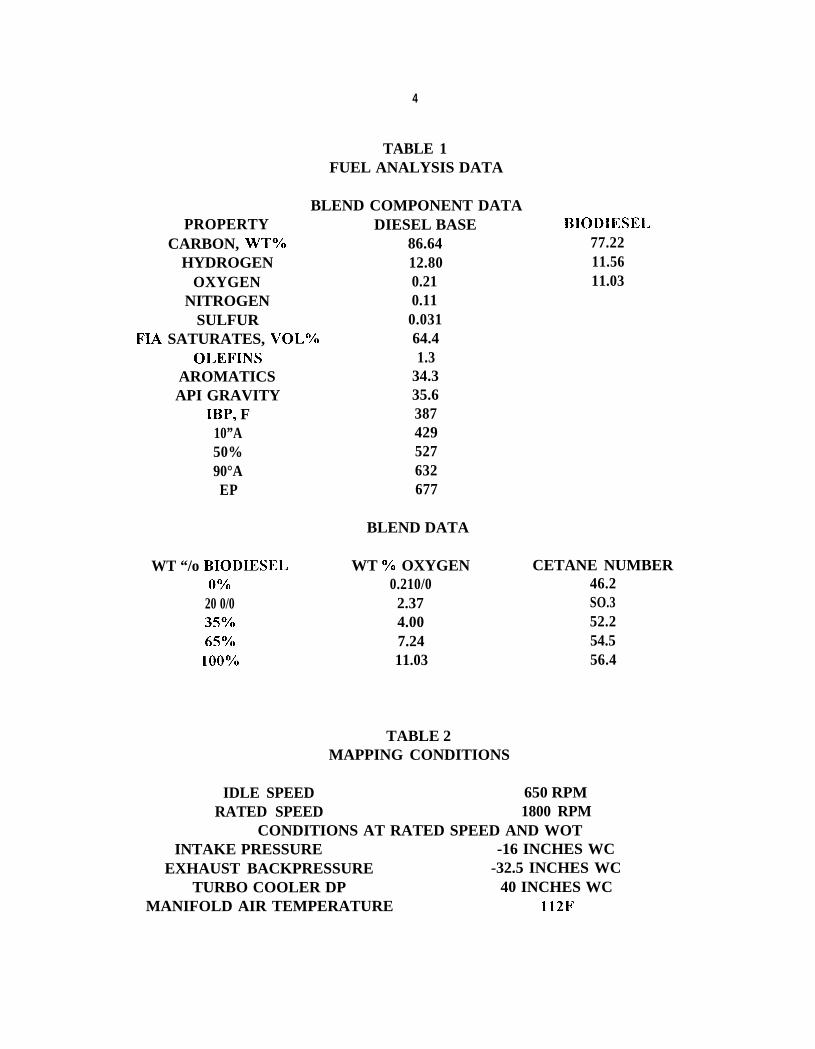
TABLE 1FUEL ANALYSIS DATA
BLEND COMPONENT DATA
WT “/o BIODIESELO“h
20 0/035”A65°h100”A
DIESEL BASE86.6412.800.210.110.03164.41.3
34.335.6387429527632677
BLEND DATA
WT ~“ OXYGEN0.210/02.374.007.2411.03
BIODIESEL77.2211.5611.03
CETANE NUMBER46.2SO.352.254.556.4
TABLE 2MAPPING CONDITIONS
IDLE SPEED 650 RPMRATED SPEED 1800 RPM
CONDITIONS AT RATED SPEED AND WOTINTAKE PRESSURE -16 INCHES WC
EXHAUST BACKPRESSURE -32.5 INCHES WCTURBO COOLER DP 40 INCHES WC
MANIFOLD AIR TEMPERATURE 112F

RUN 1056OYO(REF)
SPEED, RPM6507008009001000110012001300
14001500
1600170018001900
61863371784196911361283125112091168111810511014465
TABLE 3MAP SUMMARY DATA FOR FUELS
TORQUE , FT-LBS
10710?40(REF)
62564071884696511281279125012141161111210521o11468
1085O?LO(REF)
62263872183097111181278124012021155110010381003337
WT yO BIODIESEL
1111 1064OYO(REF) 20%
626 619641 642720 715839 824970 9711124 11231286 12751249 12361208 12011160 11451110 11031044 1040999 993330 466
110535%
6406487328329781113127012401194114410971035991354
111765%
6376447248099731096125612221172112510791o11974288
1091100%
624631661732802107712101184113410791042985940430

6
2.4 KEY TEST PARAMETERS
In actual transient testing, a number of variables besides speed and torque must beclosely controlled to eliminate their effects on emissions.
TABLE 4TEST PLAN MATRIX FOR BIODIESEL RUNS
1 FUEL I COLD RUN I HOT RUN0?40 I I 3
I m o/. I 1 I 3----
0 ‘A 3100% 1 30 ‘/0 1 3
35°h 1 300/0 1 3
65% 1 30 %0 I I 3
2.4.1. INTAKE HUMIDITY
Intake humidity affects emissions because increased water vapor results inincreased heat capacity in the cylinder and thus lower temperatures at injection and duringburning. We have measured the effect of humidity on emissions from this enginepreviously and confirmed the Code of Federal Regulations correction factor for lowaltitude performance. To minimize any humidity effect, all test runs were made as close tothe EPA reference humidity of 75 grains water per pound of dry air as possible. Cast as aNOX correction factor, the majority of the data were corrected for humidity by about +/-1 ‘%.. The extreme correction was +3!4.. All particulate data were corrected to thereference humidity using the EMA correction factor which has also been shown by us inprevious testing to be applicable at high altitude. While EPA does not recognize thiscorrection for certification emissions, it is applied to insure that all emissions comparisonsare made at constant engine test conditions.
2.4.2. INTAKE MANIFOLD
In on road applications, the Series 60 engine 1s equipped with an air-cooledaftercooler. For testing, the engine is supplied with a water-cooled exchanger. SAEprocedure J-1937 describes the procedure to simulate on road intake manifoldtemperature as a fimction of load using a water cooled unit.
Intake air temperature after the turbocharger aflercooler depends on theturbocharger load and the cooling water temperature. The NOX emission is dependent onthe manifold temperature history over a test run. We establish the “proper” manifold

7
temperature behavior by providing 75 F+/- 2F (allowed range 68 to 86F) water to theturbo aftercooler. The coolant flow is set during mapping to achieve 1 12F at rated enginespeed and wide open throttle. During each test run, the manifold temperature is allowedto swing between these limits based upon the local demand on the cooler.
2.4.3. FUEL TEMPERATURE
Fuel temperature can have an impact on NOX emissions since fhel density andhence the power generated will vary with temperature. In our system, we control the fieltemperature via a fiel cooler so that a natural variation of about 10F occurs over the hottest ( 85 to 95 F). During cold start, the fhel is typically 75F until the fiel is warmed byengine heat loss. The maximum fhel temperature is adjusted during mapping at ratedspeed and wide open throttle at about 10OF.
2.4.4. COLD START
For this engine, an oil temperature below about 70F causes the engine to start oncold assist. Since the transient test is run nominally at 77F but can be run between 68 and86F, this is an important issue since emissions with cold assist may differ from emissionswithout assist. Thus, all cold runs are initiated with 75F to 77F oil to eliminate the coldassist fimction. In this program, the exception is the 20°/0 biodiesel cold run whichcontained 24 seconds of cold assist operation. This may have produced slightly high PM,NOX, CO and THC emissions for this cold run.
2.4.5. EMISSIONS CALIBRATION
During the entire test program, emissions were measured against the same set ofspan gases.
3.0 TEST DATA
3.1 RAW TEST DATA
Table 5 provides a summa~ of all test data collected during this study. The runnumber is a chronological marker which shows where in the campaign the run wasconducted. The order of running was 20°/0, 100°/0, 3 5°/0, and 65°/0 biodiesel. Aspreviously mentioned, each fiel was bracketed using the reference.
Table 5 presents data on fiel consumption and carbon balances. The fiel data arethe average of direct measurements made using a difference from a weigh cell and atotalized mass determined from a Micromotion mass flow meter respectively. The weighcell accuracy is known to be better than O. 5°/0 of the fhel weight difference for a giventransient test with the Series 60. The Micromotion meter is accurate to 0.3 5°/0 of mass

TABLE 5RAW EMISSION DATA SUMMARY, ALL FUELS
BASE DIESEL FUELCARBON BALANCE DATA
RUN # TYPE
1112110310591061106310741081108810901098110011021104111411151116
COLDCOLDHOTHOT
HOT
HOTHOTHOT
HOTHOT
HOT
HOT
HOTHOTHOTHOT
HOT AVERAGEHOT STANDARD DEVIATION
COMPOSITE
1065 COLD
1 0 6 8 HOT
1069 HOT1070 HOT
HOT AVERAGE
HOT STANDARD DEVIATION
COMPOSITE
BHP-HR
22,25922s17222.36622.37922.33522.35122.29922.23422.27422.23722.22222.24522.25022.29522.26222.303
22.2900.052
22.70322.34122.33622.368
22.3480.017
THC
0.772
0 . 1 8 6
0 . 1 5 00 . 1 6 5
0 . 1 5 5
0 . 1 4 50 . 1 2 7
0 . 1 2 8
0 . 1 3 0
0.731
0.131
0 . 1 4 6
0 . 1 1 3
0 . 1 2 0
0 . 1 3 6
0.111
0 . 1 3 5
0 . 0 1 6
0.141
0 . 2 1 6
0.121
0 . 1 2 3
0 . 1 2 9
0 . 1 2 4
0 . 0 0 4
0 . 1 3 8
NOX
5.011
4 . 9 5 5
4 . 5 7 64 . 5 2 6
4.591
4 . 5 5 94 . 6 3 8
4 . 5 9 3
4 . 5 5 2
4 . 5 8 5
4 . 5 9 8
4 . 5 9 2
4 . 5 2 0
4 . 5 7 3
4 . 5 9 8
4 . 5 7 9
4 . 5 7 7
0.031
4 . 6 3 5
5 . 0 4 4
4 . 6 0 0
4 . 6 4 0
4 . 6 4 6
4 . 6 2 9
0 . 0 2 5
4 . 6 8 8
GM/BHP-HR
c o
5 . 3 5 7
5 . 0 0 6
4 . 2 2 44 . 3 5 6
4 . 3 3 3
4 . 0 1 64 . 1 7 4
4 . 1 3 6
4 . 1 1 8
3 . 8 9 4
3 . 8 4 7
3 . 9 9 5
3.971
3 . 9 5 0
4 . 0 2 8
3 . 9 5 8
4.071
0 . 1 5 7
4.230
C 0 2
5 7 8 . 6 4
5 7 8 , 2 6
5 5 0 . 1 5
5 4 5 . 9 4
5 4 9 . 8 4
5 5 5 . 9 65 5 5 . 8 5
5 5 7 . 4 0
5 5 7 . 9 3
5 6 6 . 5 6
5 6 2 . 6 3
5 6 2 . 1 0
5 5 7 . 8 0
5 5 8 . 2 0
5 6 0 . 4 7
5 5 7 . 7 9
5 5 7 . 0 4
5 . 4 6
5 6 0 . 1 0
PM
0 . 3 2 5
0 . 3 1 5
0 . 2 9 5
0 . 2 9 7
0 . 3 0 0
0 . 2 8 90 . 2 7 8
0 . 2 9 4
0.291
0 . 2 8 0
0 . 2 8 2
0 . 2 9 0
0 . 2 8 4
0.281
0 . 2 8 7
0.281
0 . 2 8 8
0 . 0 0 7
0 . 2 9 2
2 0 % BIODIESEL
5 . 7 8 7 5 6 9 . 3 5 0 . 3 2 2
3 . 7 4 6 5 4 8 . 8 0 0 . 2 4 3
3 . 8 1 0 5 4 9 . 9 5 0 . 2 4 7
3 . 8 4 6 5 5 3 . 0 6 0 . 2 4 9
3.801 5 5 0 . 6 0 0 . 2 4 6
0.051 2 . 2 0 0 . 0 0 3
4 . 0 8 4 5 5 3 . 2 8 0 . 2 5 7
LB/BHP-HR
BSFC
0 . 4 0 4
0 . 4 0 6
0 . 3 8 5
0 . 3 8 3
0 . 3 8 5
0 . 3 8 7
0.391
0 . 3 9 8
0 . 3 9 6
0 . 3 8 7
0 . 4 0 3
0 . 3 9 50.391
0 . 3 9 3
0 . 3 9 3
0 . 3 9 2
0.391
0 . 0 0 6
0 . 3 9 3
0 . 4 1 4
0 . 3 9 4
0 . 3 9 4
0 . 3 9 6
0 . 3 9 5
0.001
0 . 3 9 8
CIN
7 . 7 8 5
7 . 7 9 3
7 . 4 6 87 . 4 1 6
7,451
7 . 4 9 47 . 5 6 4
7 . 6 6 8
7 . 6 5 0
7 . 4 6 0
7 . 7 5 0
7 . 6 2 0
7 . 5 4 2
7 . 5 9 8
7 . 5 8 5
7 . 5 7 7
7 . 5 6 0
7 . 5 9 3
7 . 9 7 6
7 . 4 5 9
7 . 4 6 7
7 . 5 0 9
7 . 4 7 8
7 . 5 4 9
LB/TEST
COUT
7 . 8 6 4
7 . 8 2 2
7 . 4 9 47 . 4 4 5
7 . 4 8 2
7 . 5 6 27 . 5 4 6
7 . 5 4 4
7 . 5 6 4
7 . 6 6 3
7 . 6 0 4
7 . 6 0 8
7.551
7.571
7 . 5 9 3
7 . 5 6 8
7 . 5 5 7
7 . 5 9 8
7 . 9 0 6
7 . 4 5 6
7.471
7 . 5 2 5
7 . 4 8 4
7 , 5 4 4
Yo DIFF
-1 ,02%
-0.37?40
-0.35?J0-0.39V0
-0.42’Yo
- 0 . 9 7 %
0 . 2 4 %
1 . 6 2 %
1 .12%
-2.72’Yo
1.899!0
o.15yo-0.129(0 %
0 . 3 5 %
- 0 . 1 0 %
0 . 1 2 %
o.03?io
-0.079/0
0 . 8 8 %
o.04yo
-0.060)6
-0.21 Vo
-0.08Y0
0 . 0 6 %

RUN # TYPE
1 1 0 6 COLD
1 1 0 8 HOT
1 1 0 9 HOT
1 1 1 0 HOT
HOT AVERAGE
HOT STANOARD DEVIATION
COMPOSITE
1 1 1 8 COLD
1 1 2 0 HOT
1121 HOT
HOT AVERAGE
HOT STANDARD OEVIATION
COMPOSITE
1 0 9 2 COLD
1 0 9 4 HOT
1 0 9 5 HOT
1 0 9 6 HOT
HOT AVERAGE
HOT STANDARD DEVIATION
COMPOSITE
BHP-HR
2 2 . 1 1 9
2 2 . 2 6 0
2 2 . 2 2 8
2 2 . 2 1 4
2 2 . 2 3 4
0 . 0 2 3
2 2 . 0 6 8
2 2 . 1 3 6
2 2 . 1 3 0
2 2 . 1 3 3
2 1 . 8 8 7
21.921
2 1 . 9 6 0
2 1 , 9 3 5
2 1 . 9 3 9
0 . 0 2 0
THC
0 . 1 6 6
0 , 1 1 7
0 . 1 1 5
0 . 1 0 2
0.111
0 . 0 0 8
0 . 1 1 9
0.141
0 . 0 7 3
0 . 0 9 3
0 . 0 8 3
0 . 0 1 5
0,091
0 . 1 1 2
0 . 0 5 2
0 . 0 9 0
0 . 0 7 8
0 . 0 7 3
0 . 0 1 9
0 . 0 7 9
NOX
5 . 0 0 8
4 . 6 0 4
4 , 6 2 9
4 . 6 4 2
4 . 6 2 5
0 . 0 1 9
4 . 6 8 0
5 . 1 9 8
4 . 7 5 8
4 . 8 2 0
4 . 7 8 9
0 . 0 4 3
4 . 8 4 8
5 . 5 2 5
5 . 0 8 7
5 . 1 1 5
5 . 1 1 5
5 . 1 0 6
0 . 0 1 6
5 . 1 6 6
TABLE 5 CUNTINUED
3 5 % BIODIESEL
GM/BHP-HR
c o C 0 2 PM
4 . 4 7 9 5 7 7 . 9 5 0 . 2 4 7
3.231 5 5 6 . 3 4 0 . 2 1 3
3 . 2 3 8 5 5 6 . 1 3 0 , 2 0 8
3.191 558.41 0.201
3.220 5 5 6 . 9 6 0 . 2 0 7
0 . 0 2 5 1.26 0 . 0 0 6
3.400 5 5 9 . 9 6 0 . 2 1 3
65% BIODIESEL
3.851 5 8 0 . 4 7 0 . 1 9 9
2 . 7 4 8 5 5 7 . 8 4 0 . 1 4 9
2 . 7 1 4 5 5 8 . 0 2 0.151
2.731 5 5 7 . 9 3 0 . 1 5 0
0 . 0 2 4 0 . 1 2 8 0 . 0 0 2
2.891 5 6 1 . 1 5 0 . 1 5 7
100% BIODIESEL
2 . 9 3 8 5 8 7 . 6 6 0 . 1 1 9
1.936 5 6 8 . 8 6 0 . 0 8 0
2 . 2 3 7 568.11 0 . 1 0 7
2.196 5 7 0 . 3 4 0 . 1 0 0
2 . 1 2 3 5 6 9 . 1 0 0 . 0 9 6
0 . 1 6 3 1.14 0 . 0 1 4
2.239 5 7 1 . 7 5 0 . 0 9 9
LB/BHP-HR
BSFC
0 . 4 2 0
0 . 4 0 3
0 . 3 9 3
0 . 4 0 7
0.401
0 . 0 0 7
0 . 4 0 4
0 . 4 3 9
0.421
0.421
0.421
0 . 0 0 0
0 . 4 2 4
0 . 4 5 5
0.441
0.441
0 . 4 3 9
0.441
0.001
0 . 4 4 3
CARBON BALANCE DATA
CIN
7.751
7 . 4 6 8
7 . 3 1 8
7 . 5 3 4
7 . 4 4 0
7.484
7 . 8 0 2
7 . 5 0 0
7 . 5 0 8
7.504
7 . 5 4 7
7.691
7 . 4 6 7
7 . 4 8 3
7 . 4 4 0
7 . 4 6 3
7 . 4 9 6
LBITEST
COUT
7 . 7 8 7
7 . 5 1 9
7 . 5 0 6
7 . 5 3 0
7 . 5 1 8
7 . 5 5 7
7 . 7 8 8
7 . 4 8 5
7 . 4 8 6
7 . 4 8 6
7 . 5 2 9
7 , 7 9 9
7 . 5 4 0
7,551
7.571
7 . 5 5 4
7 . 5 8 9
Yo DIFF
-0.46?40
-0.68?40
-2.56Y0
0.05?40
.1 .06%
.0.98?40
0 . 1 8 %
0 . 2 0 % g
0 . 3 0 %
0 . 2 5 %
0.24?40
-1.41V0
- 0 . 9 8 %
- 0 . 9 1 %
-1.76?40
1 .22%
-1 .24%

flow except at idle where errors of 4% are possible. From these two measurements, themaximum expected fiel error is thus under 10/O.
Based upon the analytical data in Table 1, the H/C ratio of the base diesel andbiodiesel are 0.148 and 0.150 respectively. Thus, the heating value of the blend should beto a very good approximation a linear fimction of fiel oxygen content. The fhelconsumption was regressed against weight percent oxygen in the fuel. The best fit wasfound to be:
BSFC= 0.386+ 0.00482*WT% OX
The standard error of the regression 1s 0.8’ZO of the maximum fiel consumptionwhich is equivalent to the expected fhel error. Since the fhel consumption is proportionalto the iiel heating value, it is concluded that the engine efficiency is the same for biodieseland biodiesel blends as for the reference fhel. It is concluded that for the Series 60 engine,the fiel consumption for biodiesel blends is directly calculable from diesel fuel economydata.
The carbon balances in Table 5 were closed using the analytical data for the fielsin Table 5, the total fiel consumption for a given test, and the emissions for C02, CO,THC, and PM for a given test. PM was assumed to be 10O?AO carbon and totalhydrocarbon was assumed to be the same as diesel fiel. No change in response foroxygenated fiels was used in the hydrocarbon measurement and no correction was madeto the hydrocarbon for oxygen content. If the hydrocarbon in the exhaust is oxygenated,its total mass might be underestimated. The carbon balance closure is generally within1 ‘Yo. This substantiates the fiel consumption estimates and demonstrates that nosubstantial systematic errors exist in the emission measuring
The data in Table 5 were recast into Table 6 to provide average hot and compositetest emissions for each fuel. The composite emissions were determined by weighting thecold average by l/7 and the hot average by 6/7 according to the Code of Federalregulations. In all cases, NOX and PM emissions were corrected for humidity using thefollowing corrections:
NOx FACTOR= l/(l-0.0026*(H-75))
PM FACTOR= l/(1+0 .0017 *(H-75))
where H is the absolute intake air humidity m grams water per pound of dry air,
Table 7 presents the change in emissions for biodiesel addition as a fimction ofbiodiesel content. Except for NOX, biodiesel effectively reduces regulated emissions. Upto 3 5°A biodiesel, the NOX change appears to be on the order of 10A. Beyond 350A, theNOX increases rapidly to more than 1 l% for neat biodiesel.

THC ColdTHC HotTHC Composite
Nox ColdNox HotNOX Composite
CO ColdCO HotCO Composite
C02 ColdC02 HotC02 Composite
PM ColdPM HotPM Composite
O% (REF)
0.1790.1350.141
4.9834.5774.635
5.1824.0714.230
578.45557.04560.10
0.3200.2880.292
TABLE 6SUMMARY OF RESULTS, RAW DATA
20.00%
0.2160.1240.138
5.0444.6294.688
5.7873.8014.084
569.35550.60553.28
0.3220.2460.257
FUEL, PERCENT BIODIESEL35.00’% 65.00%
0.166 0.1410.111 0.0830.119 0.091
5.008 5.1984.625 4,7894.680 4.848
4.479 3.8513.220 2.7313.400 2.891
577.95 580.47556.96 557.93559.96 561.15
0.247 0.1990.207 0,1500,213 0.157
100.00%
0.1120.0730.079
5.5255.1065.166
2.9382.1232.239
587.66569.10571.75
0.1190.0960,099

THC ColdTHC HotTHC Composite
Nox ColdNOX HotNOX Composite
CO ColdCO HotCO Composite
C02 ColdC02 HotC02 Composite
PM ColdPM HotPM Composite
TABLE 7SUMMARY OF RESULTS, RAW DATA
20.00%
2 0 . 8 8 %-7.69Y0-2.51?L0
1 .22?L01 .12%1.14%
1 1 . 6 8 %-6.65’Yo-3,44940
-1 .57%-1.16Y0-1 .22?40
.70’%-14.39?40-12.03’ZO
FUEL, PERCENT BIODIESEL3 5 . 0 0 % 6 5 . 0 0 %
-7.30?40 -21 .26%-17.70Y0 -38.46Y0-15.71Y0 -35.54V0
.50% 4.32’%1 .05% 4 . 6 3 %.97?40 4 . 5 8 %
-13.56Y0 -25.68Y0-20.91 yO -32.92Y0-19.62Y0 -31 ,65?Z0
-.09Y0 ,35Y0-.o~ % .16’%0-.0370 .19%
-22.63Y0 -37.79Y0-28.02% -47.87Y0-27.18Y0 -46.30’Yo
100.0070
-37.45?(0-45.87Y0-44.04%
10,88?4011 .55%11.45%
-43.3070-47.86’Yo-47.069fo
1.59%2 . 1 6 %2 . 0 8 %
-62.67?40(-66.81 yO- 6 6 . 1 6 %

13
Over the course of testing, there was an observed emissions drifl as determinedfrom the reference fhel emission data. In order to estimate the impact of drift on theemissions, the hot emissions for the reference fiel wqmnegressed against test numberwhich was used as a surrogate for test time. The data were corrected to zero time (run1059) by the following linear equations, whose coefficients are presented in Table 8.
ADJUSTED/RAW= 1/(1 +A(RUN#- 1059)
TABLE 8TIME CORRECTION OF TEST DATA
EMISSION A R SQUAREDTHC -3.943 E-3 0.591NOx o 0.014
c o -1.479E-3 0.654C 0 2 3.784E-4 0.587PM -8 166 E-4 0.477
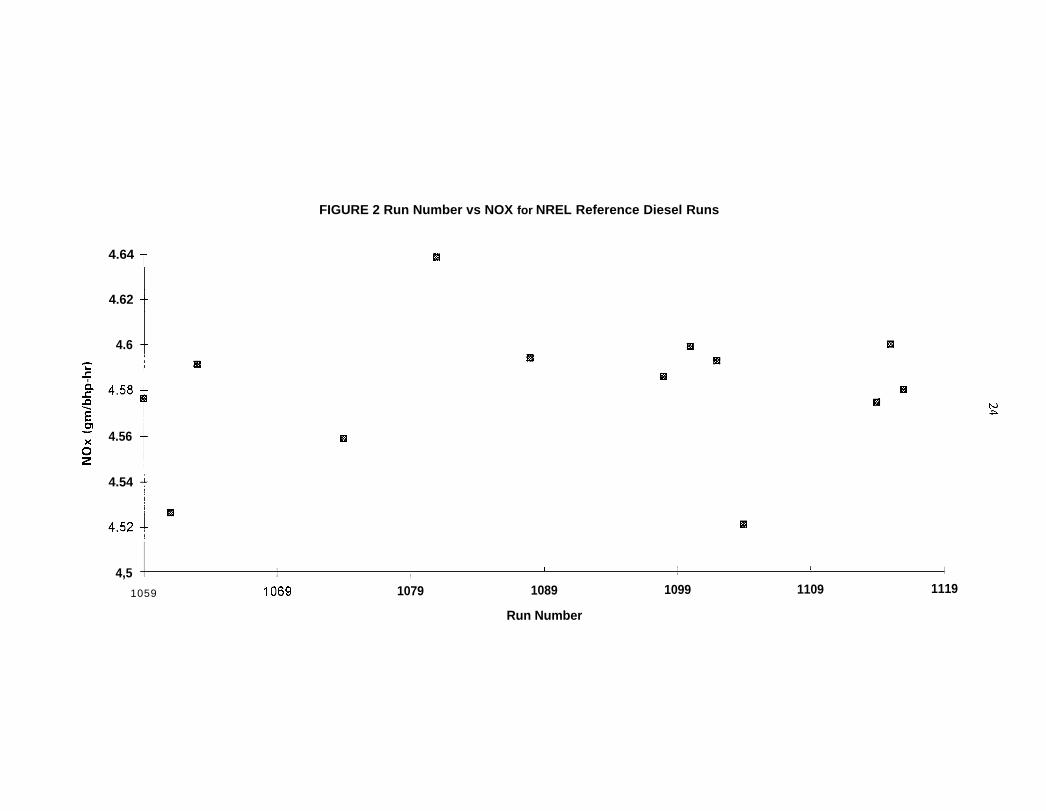
The regression results show that all emissions except for NOX showed a small driftIn the case where drift was evident, the regression was able to account for about 50°A ofthe variation in the data. The remainder of the unexplained variation is most like] yexperimental error. Figures 1 through 5 show emission trends as a fimction of time.Figures 6 through 10 show the regression results. Table 9 and Table 10 present thesummary of corrected emissions and the percentage change in emissions as a finction ofoxygen content. Figures 11 through 14 show plots of emissions as a fhnction of oxygencontent.
3.2 DISCUSSION
In this section, all discussion applies to the time corrected data. Figures 6 through10 present the results of a linear model least squares analysis of the test data for thereference diesel fiel. In the regression, data were first normalized against the emissionsfor run 1059. The normalized reference diesel emission data were then fit against (runnumber- 105 9) with a forced intercept of unity. All data were corrected to the zero time(run 1059) emissions.
Table 9 summarizes the emissions data. For diesel engines, the two mostImportant emissions are NOX and PM. The data clearly demonstrate the NOX-PMtradeoti, reducing PM in a given engine configuration often raises NOX. For neat .biodiesel, the NOX emission exceeds 5 g/bhp-hr , an increase of 0.53 g/bhp-hr over thereference fiel. The PM level is simultaneously reduced by 0.198 g/bhp-hr to a level equalto the 1994 truck engine standard. SOF determinations were not made. However, theparticulate appeared to be composed of a significant portion of oils which suggests that aSOF oxidation catalyst could be even more effective in particulate control

TABLE 9
THC ColdTHC HotTHC Composite
NOX ColdNOX HotNOX Composite
CO ColdCO HotCO Composite
C02 ColdC02 HotC02 Composite
PM ColdPM HotPM Composite
0% (REF)
0.2220.1540.164
4.9834,5774.635
5.5844.2704.458
568.03550.51553.01
0.3330.2950.300
SUMMARY OF RESULTS, TIME CORRECTED DATA
FUEL, PERCENT BIODIESEL20.0070 3 5 . 0 0 % 6 5 . 0 0 %
0.222 0.204 0.1840.130 0.139 0.1100.143 0.148 0.120
5.044 5.008 5.1984,629 4.625 4.7894.688 4.680 4.848
5.838 4.814 4.2193.858 3.477 3.0054.141 3.668 3.178
568.06 567.85 567.79548.53 546.62 545.24551,32 549.65 548.46
0.324 0.257 0.2090.248 0.216 0,1580.259 0.222 0.165
100.0070
0.1290.0850 . 0 9 2
5.5255.1065.166
3.0892.2422.363
580.42561.46564,16
0.1230.0980.102

15
*I-W* q ’ *
$
an
s.i=0
w “t “, -1
,,
s.-(JY

16
Table 10 shows the emwstons changes in percent from the reference fiel. Figures11 through 14 show these data graphically. Except for NOX, the regulated emissions arereduced proportionally to the oxygen con(ent. The NOX emission is curved upward; thechange in NOX at 20°/0 and 3 So/O biodiesel is on the order of 10/O. Between 35°/0 and 100°/0the NOX increases rapidly; at 65Y0, the NOX is increased by 4.60/i while for neat biodiesel,the emission is increased by 11 .5°/0.
Table 11 shows the results of a test for the difference between NO, emissions for20’?40 and 35V0 biodiesel blends compared to the reference diesel. In both cases, theobserved NO. increase for the blends is statistically significant at about the 0.01 level(99!40 confidence) based upon a student-t analysis. This means that the increased NOXemission observed for biodiesel blends is most likely real.
In other fiel work conducted at CIFER, we have found that certain fhel propertiesimpact emissions proportionally the same at high altitude as at low altitude. Specifically,the effects of aromatic content and cetane number for the Series 60 engine track resultsobtained by Unman, et al. (1990) and Nikanjam (1 993). The proportional changesobserved in this study for lower biodiesel blends seem to agree with low altitude datagathered from a variety of sources by the National Soy Diesel Board (NSDB).
An interesting result is the apparent low sensitivity of NO. emissions to biodieselamounts to 3 So/O by weight. At the 3 5°/0 level, the particulate reduction is large enough tooffer significant emission benefits to fleet operators at little or no NO. penalty.Additionally, the NO. emission change is small enough that it could be treatable withcetane enhancing additives or by adjusting the aromatic content of the base iiel.
3.3 PRELIMINARY EMISSIONS MODEL
Table 12 presents results from the CRC VE-I (Unman, et al., 1990) study for awide range of fuels in which cetane number and aromatic content were varied using Series60 technology The fhels did not contain significant levels of oxygen. We have verifiedthis model on the engine used in this study against a series of aromatic fhels ranging from8.8% to 35!10 aromatics and only a narrow range of natural cetane numbers (45 to 47.5) athigh altitude for both NO. and PM. Since the base emissions for our engine at altitude aredifferent than those reported by SWRI, the comparison is made on a relative basis; that is,we have demonstrated that the effect of fiel changes on emissions are proportionallycorrect.
In order to estimate the effect of key fuel property changes on emissions of NO.and PM, we have extended the SWRI model for oxygen content. (Additional data arerequired to verifi the model. ) The purpose of extending the model is to estimate theeffect of blending stock properties on emissions of fiels containing biodiesel. Thehypothesis posed is the following: how should base fiel properties be changed to producea NO, neutral fuel compared to diesel certification tiel?

17
<Nox>6sn
2~ pooled
npoo[cd
(Ol~n)pooled
Table 11
Statistical Analysis for NO, @crease Due to Biodiesel for Hot Runs
YO Biodieselo 20
4.577 4.629+0.052
0.031 0.02514 3
0.000922.470.0193
35
4.625+0.0480.0193
0.000882.470.0189
null hypothesis ~[+-PR = 0 alternative hypothesis P~-~R >0t 2.694 2.539to.95 1.753 1,753to,$lg 2.602 2.602
Reject null hypothesis. NOX increase is real. If t>t= reject null hypothesis and concludeemission increase is real.
< NoX> = average NO.
b = difference in averagess = standard deviationn = number of data pointso = variancev = true meanB = biodieselR = reference diesel

18
TABLE 12
GENERALIZED MODELS FOR ESTIMATING TRANSIENT EMISSIONSFROM A 1991 PROfOTYPE DDC SERIES 60 (60-11-330)
USING FL4 AROMATICS, ALONG WITH TOTAL AND BASE CETANE NUMBERS
Lo& FIA Aromatics LBcET35a LDCET35b
CoId-Start R2d \
Emission+ Intercept Coeff. P-Value Coeff. P-Value Coeff. P-Value
LMHC 2. 138 E- 1 -. .- -7.112E-1 O.0001 -6.879E-1 O.0001 0.881
LMCO 1.381 -- -- -3.180E-1 O.0001 -3.000E-1 O.0001 0.951
LNOX 1.814 03. CQ5E-3 O.0001 -2.438E-2 0.0151 -- -- 0.460
LPART -1.534 -- -- -1.368E-1 O.0001 - 1.306E-1 0.0030 0.517
Lo% FIA Aromatics LBcET35a LDcET35b
Hot-Start R2dErnission# Intercept Coeff. P-Value Coeff. P-Value Coeff. P-Value
LMHC 1.156 -- -- -1.004 0.0001 -9.434E-1 O.0001 0.944
LMCO 1.508 -- -- -4.227E-1 O.0001 -4.302E-1 O.oa)l 0.980
LNOX 1.566 2.619E-3 O.ml -5.443E-2 O.0001 -3.968E-2 0.0014 0.641
LPART -1.355 3.190E-3 0.0283 -2.013E-1 O.0001 - 1.377E- 1 O.m 0.719
Lo& FIA Aromatics LBcET35a LDcET35b
Composite R2dEmission@ Intercept Coeff. P-Value Coeff. P-Value Coeff. P-Value
LMHC 1.046 -- .- -9.718 E-1 O.0001 -9.153 E-I O.0001 0.940
LMco 1 .49Q -- -- -4.072E-1 O.0001 -4. ICX)E-I O.0001 0.977
LNOX 1.604 2.693E-3 O.0001 -4.867E-2 O.0001 -3.217E-2 0.0066 0.606
LPART -1.390 2.8 12E-3 0.0323 - 1.897E-I O.0001 -1.360E-1 0.0003 0.751
aLBCET35 is hge (Base Cetane - 35).bLDCET35 is Lo% (Total Cetane - 35) - Loge (Base Cetane - 35).%tirnated emission (g/hp-hr) = ex; where x = Lo& Emission Intercept + a (FIA, 96) + b (LBCET 35) +
c (LDCET35), and “e” = 2.71828.‘R2 terms when test time adjustment is transferred to the intercept.

In producing a model, the following steps were followed:
1. The trends predicted by VE-I for NOX and PM were assumed correct
2. The emissions for the aromatic and cetane numbers of our test fiels werecalculated using VE-I.
3. The model was adjusted to properly predict the emission of our diesel referencefhel.
4. The additional emission due to oxygen was determined and correlated against fieloxygen content.
Figures 15 and 16 show the regression data for NO. and PM, While the NOX fit isbetter, the overall predictive power of both models is adequate to investigate the impact offhel changes on NO. and PM emissions. Table 13 summarizes the model.
Table 13Model Coefficients for Oxygenated Fuels
Hot Run Emissions
Ln Emission= A + B (’?? aromatics)+CLn(CN#-35) + D (Yo oxygen)
NO, PMA 1.56264 -0.84387B 2.619 E-3 3.19 E-3c -5.440 E-2 -2.01 E-1D 0.02061 -0.07147
R* (adjusted) 0.737 0.715Std error 0.010 0,064
For the biodiesel data, the model predicts NOX emissions to f 1 ‘%0. Particulate arepredicted to f5?40.

20
Using the model, aromatics were varied at fixed cetane number and cetane numberwas varied at fixed aromatic content to produce a NO, neutral fiel. The impact on PMemission was also calculated. The reference fiel for NOX neutrality comparison was thebase diesel used in this study.
Table 14 shows that for B-20, a NO, neutral tiel could be made by reducing thearomatic content of the base about 4.6°/0 relative to the certification fiel aromatic content.Alternately, the natural cetane number of the base could be raised by 6.6 units. There issome data from the VE-I study (LJUman, et al., 1990) that indicates the impact of naturalcetane number on emissions is greater than the impact of improved cetane number using 2-Ethylhexylnitrate cetane improver. The treated cetane number would have to be increasedat least by this amount. The particulate model predicts a greater PM reduction than withbiodiesel alone.
In the case of35% biodiesel, the fbel would be NO, neutral if the aromatic contentwas lowered by about 13. 5°/0 or the base cetane number was raised by 18.1 units. In thiscase, PM changes are much greater than 25°/0 relative to the base fhel also,
Table 14Predicted Property Changes to Produce a NO. Neutral Biodiesel Blend
AOA Aromatics ACN in APM% Biodiesel in Base (level) Base (level) %
20% -4.6 (29.7) O (46.2) -22?40
o (34.3) +6.6 (52.8) -24%
35’?40 -13.5% (20.8) O (46.2) -35’%0
o (34,3) +18.1 (64.3) -380/o
3.4 APPLICABILITY
Biodiesel blends and neat biodiesel are potentially applicable in three areas:
1. On-road urban bus retrofits,2. On-road general use3. Off-road.
The on-road urban bus retrofit criteria which biodiesel blends best fit is the 25’?40PM reduction criteria. To be most widely applicable, such fiels should be NOX neutralrelative to certification fhel although strictly speaking this appears to not be required.

21
For general on-road use, biodiesel blends will have to be proven NO. neutral as apart of the diesel fiel waiver process.
Under EPA’s substantially similar rule currently in development for diesel &eIs,oxygenated diesels will require a he] waiver. A key element of such a waiver is that anysuch fhel be equivalent to (or better) than diesel certification fiel when examining eachregulated emission. For oxygenates in general, and especially for biodiesel, NOX emissionsare found to increase when compared to the fuel base stock to which the oxygenate isblended. A subset of fiel should be found with base stocks such that the No. emission ofthe blend is equivalent to certification tiel as the empirical model in the previous sectionattempted to demonstrate.
For off-road use, EPA is currently developing a certification test related to NO.and opacity. While no rules currently exist for off-road fiels, fiture rulemaklng couldinclude NO, control for off-road fbels.
It is concluded that NO, neutrality will be important to the use of biodiesei in mostapplications
To that end, we propose three areas of fiture work directed at betterunderstanding the relationship between fiel composition and emissions in the Series 60engine.
4.0 FUTURE WORK
1
2
3
The results of this brief study suggest several avenues of fhture work
Examme the effect of varying aromatic content and natural cetane number of the basehe] on emissions for fiels blended with biodiesel to validate the model and prove thatNO, neutral fiels can be produced as compared to certification.
Examine the effect of different oxygenates with widely differing cetane numbers (andpossibly boiling points), i.e. biodiesel produced from different feedstocks, includingwaste oils, to determine whether cetane enhancement due to oxygenates is effective inNO,, emission control. This study would further expand the fuel model by generalizingit for oxygenates and assist in introducing oxygenates generally into the marketplace.
Examine response of biodiesel blend fiels with various NO. additives, particularlycetane improvers at various base fiel quality levels (aromatics and CN), to establishthe NO, and PM response to cetane improvers in the presence of oxygen.

22
5.0 REFERENCES
Nikanjam, M., Development of the First CARB Certified California Alternative DieselFuel, Chevron Research, SAE 9307287 March, 1993.
Unman, T., Mason, R, Montalvo, D., Study of Cetane Number and Aromatic ContentEffects on Regulated Emissions from a Heavy-Duty Engine, SWRI, CRC Contract YE-1,September, 1990.

wozI.u(YwILU.1&
ii
,U3o0
*o0
No0
mo.r
Cnmo.
03cooY
0-)wo
0-lu)o
0-
4.64 ~
4.62
4.6
/
4.56
t
4.54
1
FIGURE 2 Run Number vs NOX for NREL Reference Diesel Runs
w
( ,4,5 1 , 1 I
1059 1069 1079 1089 1099 1109 1119
Run Number

FIGURE 3 Run Number vs CO Emissions for NREL Reference Diesel
4.4 ~
! ❑❑
4,3I
w‘J,
3.9 + ❑
3.8 , , , I
1059 1069 1079 1089 1099 1109 1119
Run Number
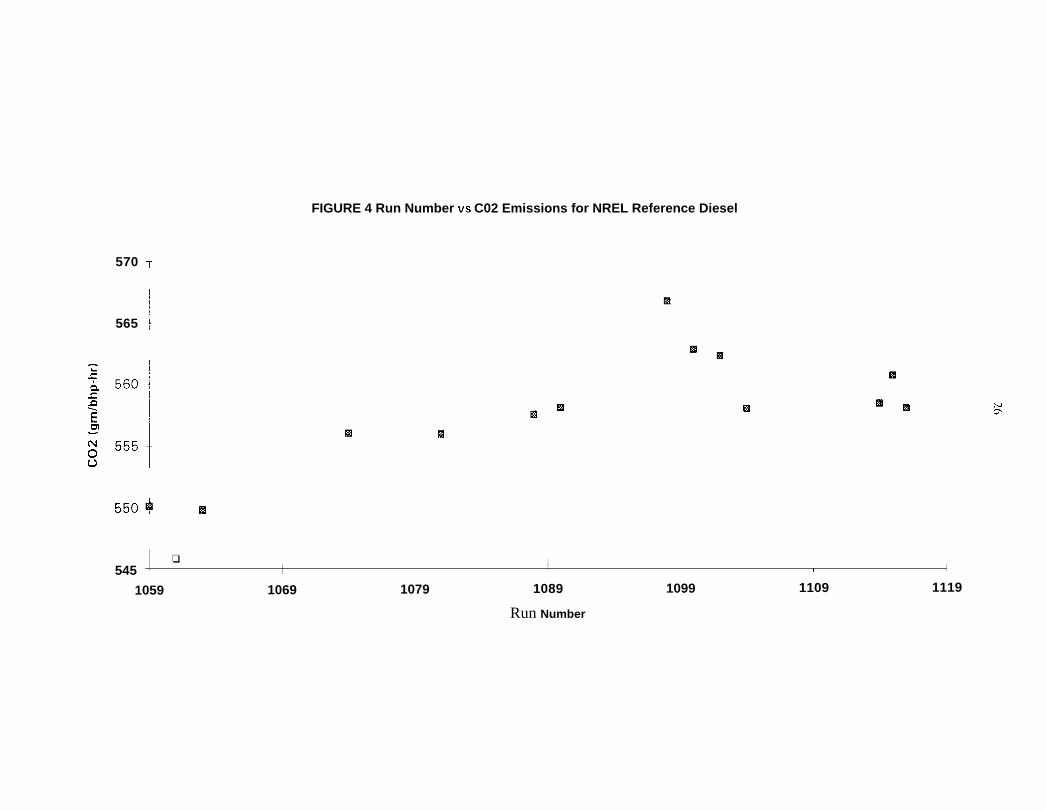
FIGURE 4 Run Number vs C02 Emissions for NREL Reference Diesel
570 T
565 I
la
❑✌545 I I I
1059 1069 1079 1089 1099 1109 1119
Run Number

27
I Ilo m0m 00
❑
—(n
in m m 03 Inm 04 a) N FN 0 N 0 w0 0 0
m0
03o-a0
ct?
m0
am0

28
CT)
■
z
9 I■
I■
■
I
1-
E
■
✏
■
❞� ✍✍‘La..
a0-)0
Cnu)0
CnIn0
m co 1= U2 m -0 0 0 0 0
3H1

29
m
❑
I , ,
M
,
U-J u-l In& o mz o mo
(I
—
3-23
CDao.
mcoo
03Fo
a-lcoo
Cnmo
m In”03 aJo m
oXON

1.04
1.02
1
0.98
0.96
0.94
0.92
0.9
FIGURE 8 CO Correction Plot
1059 1069 1079 1089 1099 1109 1119
Run Number

w
\
\
\\1
‘\
H ‘
mlo0
❑ ‘\
03
0-20
0-lm0
0-lco0
mCD0
mIn0

FIGURE 10 PM Correction Plot
0.95t
❑
0.94 ) , ,
1059 1069 1079 1089
❑
I
1099 1109 1119
Run Number

1 ’
33
❑
zo
- 1I.Llu)Lu
LL0t-oI.uILLU.1
*–+–—--+– -----+ -- —+~w * w. co w ‘m o-r-- 0 0 0 2! 00 0 0 0 0 0 0
tlH-dHZl/WEl 3H1
o0
0m
oco
oCD
ou-l
od-
0C9
0cd
0
0

FIGURE 12 NOX EMISSION AS A FUNCTION OF BIODIESEL CONTENT
5.1 +
5 --
4.9 - -
4.8 --
4.7 - -
❑ H
4.6 - -
,4.5 ( ! I i 1 , I
o 10 20 30 40 50 60 70 80 90 100
WEIGHT PERCENT BIODIESEL

FIGURE 13 CO EMISSION AS A FUNCTION OF BIODIESEL CONTENT
4.5 T
4 !
3.5 +I
0u
1.5
1 I
0.51
10 1 { \ \ , 1 1
0 10 20 30 40 50 60 70 80 90 100
WEIGHT PERCENT BIODIESEL

36
la I
m m0 N
0ml U7 m 00 0 0
0 0
00
HH-dHWW3 ‘Wd

■
o
37
Figure 15‘m
o 0 0 0m o
0 0In
No m
CNo
. 0 00 0 0 0 0 0
( L-3 A-XON)N1-(XON) N1

38
Figure 16
a I I ! II
! 1 1-+
o 00 0 ~ %
o 00 0 00 0 0
0- CN m e0 :
In u)0
1= co0
Cn0 0 0 0 0 0 0 0 0