emissions inventories for sp (brasseur) pdf
TRANSCRIPT
Air pollution modeling in the Estado de São Paulo using a bottom-up emissions inventory
Orientadora: Rita Yuri YnoueAluno: Sergio Ibarra Espinosa
2/10/14
Universidade de São PauloInstituto de Astronomia, Geofísica e Ciências Atmosféricas

1 Background
Expanded Area: Sao Paulo, Campinas, Santos and more

1 Background
Activity Level
E=FE∗VF∗TV∗L

Top-Down
Where are the cars?
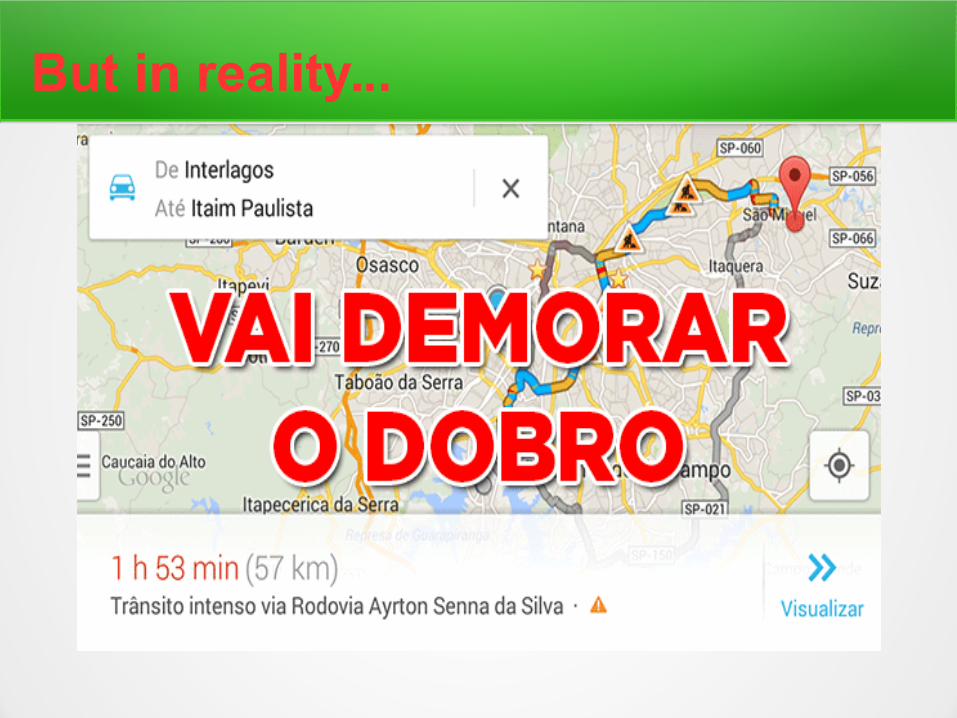
But in reality...

Bottom-up
Dynamics of vehicular flux should be incorporated to emissions models

1 Background
Activity Level
E=FE∗VF∗TV∗L
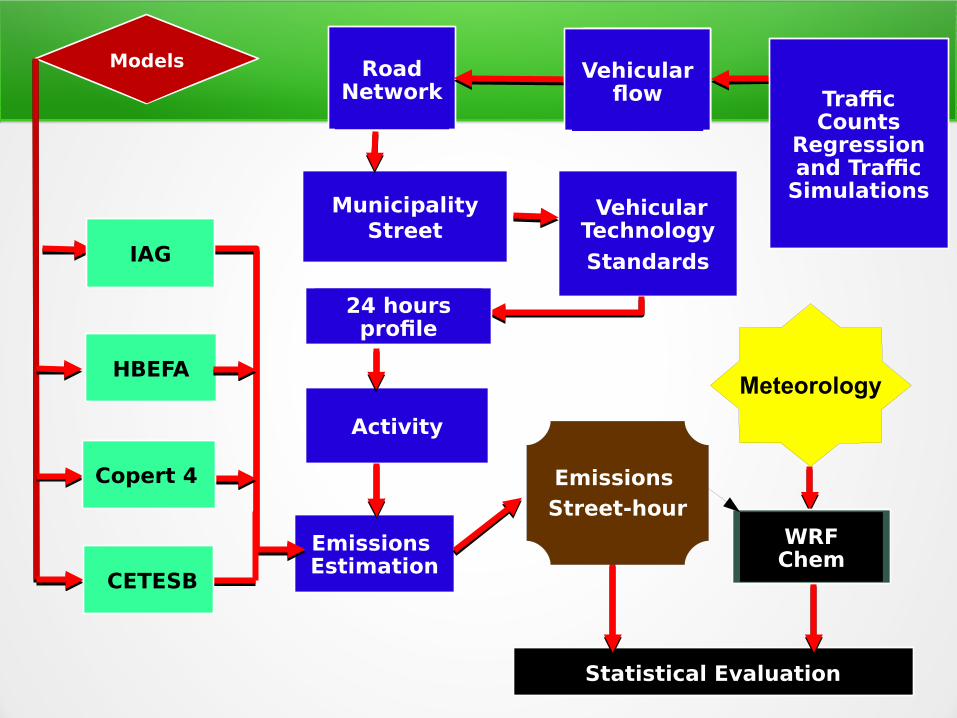
Activity
Road Network
Vehicular Technology
Standards
MunicipalityStreet
Models
Statistical Evaluation
HBEFA
Emissions Estimation
Vehicular flow
Vehicular flow
Copert 4
CETESB
IAG
WRFChem
Traffic Counts
Regression and Traffic
Simulations
24 hours profile
Meteorology
Emissions Street-hour

Metodos
206 points for counting
Regressions:●Distribution Poisson●Zero Inflated Negative Binomial●Normal

Model
βo: intercept; β1: estimate; TR: Type of Street; ε: Error
0 5 10 15 20 25 300
0.5
1
1.5
2
2.5
Distribuição normalizada 800:900 segunda São PauloRM São Paulo
seg
ter
qua
qui
sex
sab
dom
0 5 10 15 20 25 300
0.5
1
1.5
2
2.5
3
Distribuição normalizada 800:900 segunda São PauloRM Campinas
segterquaquisexsabdom

RMSP RMC RML RMS RMSP RMC RML RMS Santiago AMBAIAG IAG IAG IAG CETESB CETESB CETESB CETESB DICTUC D'Angiola
0
200000
400000
600000
800000
1000000
1200000
1400000Emissions inventories (t/y)
CO (t/a) Nox (t/a) COV (t/a)