emissions reduction market system annual performance ... · aqpstr17-02 emissions reduction market...
TRANSCRIPT

AQPSTR17-02
Emissions Reduction Market System
Annual Performance Review Report - 2016
Illinois Environmental Protection Agency
1021 North Grand Avenue East
Post Office Box 19276
Springfield, Illinois 62794-9276
May 2017

i
Table of Contents
Section Page
1.0 Introduction ................................................................................................................. 1
1.1 Nonattainment and the Chicago Area ............................................................. 1
1.2 Basics of ERMS .............................................................................................. 1
2.0 Scope of the Annual Performance Review Report ..................................................... 3
3.0 Area-wide Emission Status ......................................................................................... 5
3.1 Source Types ................................................................................................... 5
3.2 Total Aggregate VOM Emissions ................................................................... 6
3.3 Breakdown of ATU Use ................................................................................. 7
3.4 Expired ATUs ................................................................................................. 7
3.5 ATU Vintage Summary .................................................................................. 8
3.6 Findings........................................................................................................... 8
4.0 Evaluation of Trading Activities ................................................................................. 9
4.1 Account Officers ............................................................................................. 9
4.2 Website Access ............................................................................................... 9
4.3 Transaction Summary ................................................................................... 10
4.4 ATU Availability .......................................................................................... 14
4.5 Average ATU Market Price .......................................................................... 15
4.6 Findings......................................................................................................... 15
5.0 Alternative ATU Generation..................................................................................... 17
5.1 Summary of ERG Proposals ......................................................................... 17
5.2 Summary of Inter-sector Proposals ............................................................... 18
5.3 Findings......................................................................................................... 18
6.0 Performance Accountability ..................................................................................... 19
6.1 Seasonal Emissions Reports ......................................................................... 19
6.2 Alternative Compliance Market Account (ACMA) ..................................... 19
6.3 Excursion Compensation .............................................................................. 20
6.4 Source Inspections ........................................................................................ 21
6.5 Findings......................................................................................................... 21
7.0 Distribution of Emissions ......................................................................................... 23
7.1 Geographic Distribution of Transactions ...................................................... 23
7.2 Type of Source .............................................................................................. 29
7.3 Trends and Spatial Distributions of HAPs .................................................... 34
7.4 HAP Information Request Letters ................................................................ 42
7.5 Findings......................................................................................................... 42

ii
8.0 Historical Regional Data ........................................................................................... 47
9.0 Conclusions ........................................................................................................... 49
Appendix A: Township Names and Id Numbers ...............................................................A-1
Appendix B: Township Data ............................................................................................. B-1
Appendix C: Historical County Data ................................................................................. C-1
C.1 Allotments and Compensation .................................................................... C-1
C.2 Allotments and Retained ATUs .................................................................. C-3
C.3 Allotments and Expired ATUs .................................................................... C-6
C.4 Net ATUs Traded ........................................................................................ C-9
C.5 VOM Emissions and Reported HAPs ....................................................... C-11
C.6 Reduction from Baseline and Allotment................................................... C-14

iii
List of Tables
Number Page
3-1 Source Emission Breakdown ...................................................................................... 6
3-2 Special Unit Emission Breakdown ............................................................................. 6
3-3 Expired ATUs ............................................................................................................. 7
4-1 ATU Sellers .............................................................................................................. 10
4-2 ATU Buyers .............................................................................................................. 12
5-1 ERGs Receiving ATUs ............................................................................................. 17
6-1 ACMA Account Balance .......................................................................................... 20
6-2 ACMA Purchases...................................................................................................... 20
7-1 ATUs Traded by County ........................................................................................... 23
7-2 ATUs Comparison by County .................................................................................. 24
7-3 Total ATUs Expired and Retained by County .......................................................... 24
7-4 Number of Sources per Township ............................................................................ 25
7-5 Township Areas ........................................................................................................ 25
7-6 ATUs Traded by Township ...................................................................................... 26
7-7 Expired ATUs by Township ..................................................................................... 27
7-8 Retained ATUs by Township.................................................................................... 27
7-9 Townships with Emissions over Baseline Level ...................................................... 28
7-10 Townships with Emissions over Allotment Level .................................................... 28
7-11 Transactions by SIC Code ........................................................................................ 29
7-12 Total ATUs Expired and Retained by SIC Code ...................................................... 34
7-13 Reported HAP Emissions by Township ................................................................... 35
7-14 Key Results on HAPs for Six Highlighted Townships ............................................. 41

iv
List of Figures
Number Page
4-1 Average ATU Price................................................................................................... 14
7-1 Difference from Baseline .......................................................................................... 30
7-2 Difference from Allotment ....................................................................................... 31
7-3 Difference from Baseline and Traders ...................................................................... 32
7-4 Difference from Allotment and Traders ................................................................... 33
7-5 VOM HAP Reporting Sources (Difference from Baseline) ..................................... 37
7-6 VOM HAP Reporting Sources (Difference from Allotment) ................................... 38
7-7 Traders with VOM HAP Reporting Sources (Difference from Baseline) ................ 39
7-8 Traders with VOM HAP Reporting Sources (Difference from Allotment) ............. 40
7-9 Change in 2013-2014 Reported HAP Emissions (Difference from Baseline) ......... 43
7-10 Change in 2013-2014 Reported HAP Emissions (Difference from Allotment) ....... 44
7-11 VOM HAP Reporters with Population Density (Difference from Baseline) ........... 45
7-12 VOM HAP Reporters with Population Density (Difference from Allotment) ......... 46
8-1 Allotment and Compensation by Year ...................................................................... 47
8-2 Allotment and Expired ATUs by Year ..................................................................... 47
8-3 Allotment and Retained ATUs by Year .................................................................... 47
8-4 Emissions and Reported HAPs ................................................................................. 48
8-5 Reduction from Baseline and Allotment................................................................... 48
8-6 ACMA Balance by Year ........................................................................................... 48
B-1 Actual Emissions Compared to Allotment ............................................................. B-3
C-1 Cook County Allotment and Compensation ........................................................... C-1
C-2 DuPage County Allotment and Compensation ....................................................... C-1
C-3 Grundy County Allotment and Compensation ....................................................... C-1
C-4 Kane County Allotment and Compensation ........................................................... C-2
C-5 Kendall County Allotment and Compensation ....................................................... C-2
C-6 Lake County Allotment and Compensation ............................................................ C-2
C-7 McHenry County Allotment and Compensation .................................................... C-3
C-8 Will County Allotment and Compensation............................................................. C-3
C-9 Cook County Allotment and Retained ATUs ......................................................... C-3
C-10 DuPage County Allotment and Retained ATUs ..................................................... C-4
C-11 Grundy County Allotment and Retained ATUs...................................................... C-4
C-12 Kane County Allotment and Retained ATUs ......................................................... C-4
C-13 Kendall County Allotment and Retained ATUs ..................................................... C-5
C-14 Lake County Allotment and Retained ATUs .......................................................... C-5
C-15 McHenry County Allotment and Retained ATUs .................................................. C-5
C-16 Will County Allotment and Retained ATUs ........................................................... C-6
C-17 Cook County Allotment and Expired ATUs ........................................................... C-6
C-18 DuPage County Allotment and Expired ATUs ....................................................... C-6
C-19 Grundy County Allotment and Expired ATUs ....................................................... C-7

v
List of Figures (continued)
Number Page
C-20 Kane County Allotment and Expired ATUs ........................................................... C-7
C-21 Kendall County Allotment and Expired ATUs ....................................................... C-7
C-22 Lake County Allotment and Expired ATUs ........................................................... C-8
C-23 McHenry County Allotment and Expired ATUs .................................................... C-8
C-24 Will County Allotment and Expired ATUs ............................................................ C-8
C-25 Cook County Net Traded ATUs ............................................................................. C-9
C-26 DuPage County Net Traded ATUs ......................................................................... C-9
C-27 Grundy County Net Traded ATUs .......................................................................... C-9
C-28 Kane County Net Traded ATUs ........................................................................... C-10
C-29 Kendall County Net Traded ATUs ....................................................................... C-10
C-30 Lake County Net Traded ATUs ............................................................................ C-10
C-31 McHenry County Net Traded ATUs..................................................................... C-11
C-32 Will County Net Traded ATUs ............................................................................. C-11
C-33 Cook County Emissions and Reported HAPs ....................................................... C-11
C-34 DuPage County Emissions and Reported HAPs ................................................... C-12
C-35 Grundy County Emissions and Reported HAPs ................................................... C-12
C-36 Kane County Emissions and Reported HAPs ....................................................... C-12
C-37 Kendall County Emissions and Reported HAPs ................................................... C-13
C-38 Lake County Emissions and Reported HAPs ....................................................... C-13
C-39 McHenry County Emissions and Reported HAPs ................................................ C-13
C-40 Will County Emissions and Reported HAPs ........................................................ C-14
C-41 Cook County Reduction from Baseline and Allotment ........................................ C-14
C-42 DuPage County Reduction from Baseline and Allotment .................................... C-14
C-43 Grundy County Reduction from Baseline and Allotment..................................... C-15
C-44 Kane County Reduction from Baseline and Allotment ........................................ C-15
C-45 Kendall County Reduction from Baseline and Allotment .................................... C-15
C-46 Lake County Reduction from Baseline and Allotment ......................................... C-16
C-47 McHenry County Reduction from Baseline and Allotment ................................. C-16
C-48 Will County Reduction from Baseline and Allotment .......................................... C-16

vi
List of Acronyms
ACMA Alternative Compliance Market Account
AER Annual Emissions Report
ATU Allotment Trading Unit
BAT Best Available Technology
CAA Clean Air Act
CAAPP Clean Air Act Permit Program
EPA Environmental Protection Agency
ERG Emission Reduction Generator
ERMS Emissions Reduction Market System
FESOP Federally Enforceable State Operating Permit
HAP Hazardous Air Pollutant
LAER Lowest Achievable Emission Rate
MACT Maximum Achievable Control Technology
NAA Nonattainment Area
NAAQS National Ambient Air Quality Standard
NESHAP National Emission Standard for Hazardous Air Pollutants
RACT Reasonably Available Control Technology
ROP Rate of Progress
SER Seasonal Emission Report
TPD Tons Per Day
TRI Toxic Release Inventory
VOM Volatile Organic Material

vii
Executive Summary
Northeastern Illinois – the Chicago area – is designated as a nonattainment area (NAA) for the
eight-hour ozone National Ambient Air Quality Standard (NAAQS). Under provisions of the
Clean Air Act (CAA), as amended in 1990, the area was considered “marginal” in 2015 and was
supposed to be in attainment of this eight-hour standard by July 2015. Due in large part to an
extremely hot, dry year in 2012, the Chicago area did not attain by the deadline and was bumped
up to a classification of “moderate.”
Ozone is formed by the photochemical reaction of volatile organic materials (VOM) and
nitrogen oxides (NOx) on very warm summer days. Extensive air quality modeling has shown
emissions of both VOM and NOx must be reduced in order to meet air quality standards.
VOM emissions come from a wide variety of industrial activities, from painting and printing to
chemical manufacturing and even some types of food production. Most VOM emissions are
already controlled by technology-based rules, which are typically applicable year-round,
irrespective of air quality conditions. In the late 1990s, further reductions in emissions using
such “command and control” measures were viewed as being potentially very costly and would
have involved the State of Illinois determining how each individual industry could reduce
emissions even further. Instead, Illinois became the first state in the nation to adopt and operate
a market-based cap and trade program for emissions of VOM, the Emissions Reduction Market
System (ERMS). The ERMS program was designed as an emission trading program to reduce
overall VOM emissions in the Chicago NAA while allowing sources to best determine how to
reduce their own emissions in the most cost-effective manner.
The ERMS program operates from May 1 through September 30, correlating with the time of the
year when ozone formation is most significant in Illinois. The program allows trading among
participating sources in order to meet a reduced cap on their overall VOM emissions. Each
participant is given a baseline according to what they actually emitted in previous years, adjusted
for their compliance or noncompliance with existing rules. It is important to note that ERMS
participants must still adhere to all other state and federal emission limitations. From that
baseline, sources were given a number of allotment trading units (ATUs) corresponding to an
overall area-wide reduction of 12 percent, with some exceptions for units with emissions that
could not be further reduced.
ATUs, each of which represents 200 pounds of VOM, are retired by the Illinois EPA after each
trading season to account for all of a source’s emissions during that season. Sources may either
reduce their emissions by the use of emission controls or process changes, or they may buy
ATUs from other sources to account for any emissions in excess of their initial allotment. Any
source that reduces its VOM emissions below the allotment level may sell its excess ATUs to
another source. Such trading is aided by the Illinois EPA’s ERMS website, which provides an
area for buyers and sellers to post their needs. Furthermore, trading between sources can be
accomplished over the Internet.
As sources make reductions or buy ATUs from those who have, overall VOM emissions in the
Chicago NAA are reduced while providing a variety of mechanisms for sources to use in

viii
achieving their individual reductions. For the 2016 season, sources in the ERMS program
emitted 69.1 percent less VOM than their baselines would have allowed them to emit and 65.7
percent less than their actual ATU allotments. The ERMS program was designed to ensure
companies could not accumulate ATUs indefinitely, which would have left open the possibility
of a source having more emissions than anticipated in a single season. Instead, ATUs have a
limited life and expire at the end of two years if they are not utilized.
Illinois EPA is required by the ERMS rule to prepare an Annual Performance Review Report
addressing the effect of ERMS on VOM emissions, reviewing trends and patterns that have
emerged in the operation of ERMS, and looking at nine specific areas of the program for the
previous seasonal allotment period. The structure for this report was originally developed in
consultation with industry, environmental groups, USEPA, and economists from the University
of Illinois at Chicago, all of whom participated in an open dialogue that helped to frame the
information reported.
The 17th year of ERMS market operation produced 20 seasonal trades with 37 active long-term
transfer agreements. These trades involved a total of 35 sources as sellers and 47 as buyers, with
11,579 ATUs changing hands. This amounts to 11.9 percent of the total ATU allotment for the
area and 34.6 percent of the ATUs retired for compliance purposes.
In studying the available data, Illinois EPA finds the ERMS program is continuing to operate
successfully. Emissions are significantly lower than baseline and allotment levels, both locally
and in the overall region. Indeed, the allotment itself is 9.7 percent below the baseline level,
indicating that even if every company used its entire allotment, the area would still see a
significant reduction from the baseline. Furthermore, ATUs have been readily available for
sources needing to buy and the market has operated effectively.
Key Findings
The allotment shows a 9.7 percent reduction from the original baseline.
Sources were able to find trading partners, there was a sufficient supply of available
ATUs and market prices were conducive to trading.
Alternative ATU generation did not play a role in market performance.
The reconciliation and compensation processes performed as designed and operated in a
timely and effective manner.
Overall, sources in the ERMS program emitted 69.1 percent less VOM than their
baselines would have allowed them to emit and 65.7 percent less than their actual ATU
allotment for 2016.
Trading does not appear to influence HAP emissions.
ATUs equivalent to 65.8 percent of those allotted to participating sources in 2016 expired
without being used.
ix
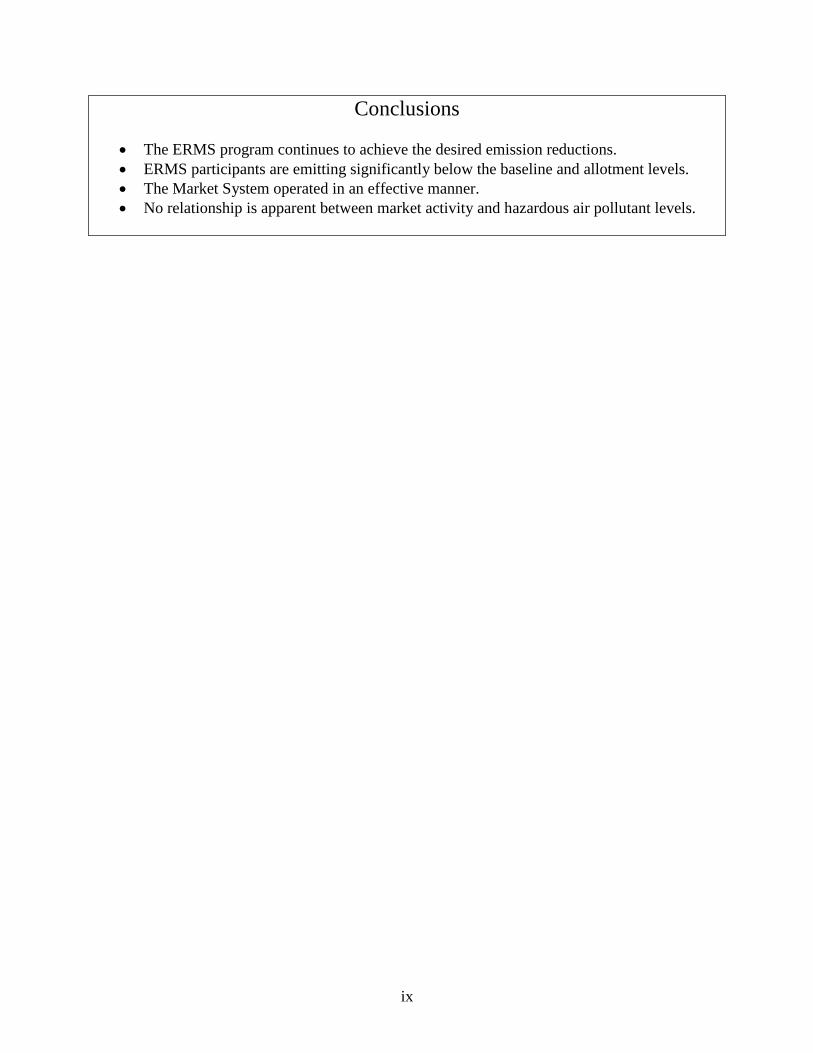
Conclusions
The ERMS program continues to achieve the desired emission reductions.
ERMS participants are emitting significantly below the baseline and allotment levels.
The Market System operated in an effective manner.
No relationship is apparent between market activity and hazardous air pollutant levels.

1
1 Introduction
1.1 Nonattainment in the Chicago Area
Northeastern Illinois, including the counties of Cook, DuPage, Kane, Lake, McHenry, and Will,
plus the townships of Aux Sable and Goose Lake in Grundy County and Oswego in Kendall
County, had been designated as a marginal nonattainment area (NAA) for the eight-hour ozone
National Ambient Air Quality Standard (NAAQS). Under the provisions of the Clean Air Act
(CAA), as amended in 1990, the area was supposed to be in attainment with the eight-hour
standard by July 2015. However, due in large part to an extremely hot, dry 2012, attainment was
not reached by that timeframe, causing the area to be bumped up to a classification of
“moderate.” Extensive air quality modeling over a number of years has shown that emissions of
volatile organic material (VOM), a component involved in the formation of ozone, needed to be
reduced. In the late 1990s, VOM emissions were already controlled by technology-based rules,
and further reductions in emissions using such “command and control” measures were viewed as
being potentially very costly. As such, the Illinois EPA proposed a VOM emission trading
program (ERMS) that would reduce these emissions overall in the Chicago NAA. The Illinois
Pollution Control Board adopted the ERMS program as a rule in November 1997 and the rule
appears in Title 35 of the Illinois Administrative Code, Subtitle B, Part 205.
1.2 Basics of ERMS
The ERMS program is designed to operate on a seasonal basis, from May 1 through September
30, to correlate with the time of year when ozone formation is most significant in Illinois. The
program allows trading among participating sources in order to meet a reduced cap on their
overall VOM emissions. Each participant has been given a baseline according to what they were
actually emitting in specified previous years, adjusted for their compliance or noncompliance
with existing rules. ERMS is the first cap-and-trade system in the United States for VOM.
Unlike the situation in some open market trading systems, sources must continue to adhere to all
other state and federal emission limitations.
Based on their baseline emissions, sources were given allotment trading units (ATUs)
corresponding to a reduction of 12 percent, with some exceptions for units with emissions that
could not be reduced further. Section 205.405 provides that units falling into one of the
following categories at the time baselines were determined are not required to reduce their
emissions by 12 percent:
Units subject to a Maximum Achievable Control Technology (MACT) or National
Emission Standard for Hazardous Air Pollutants (NESHAP)
Units that have demonstrated Lowest Achievable Emission Rate (LAER)
Units that have demonstrated Best Available Technology (BAT)
Space heaters and fuel combustion units
Internal combustion engines
2
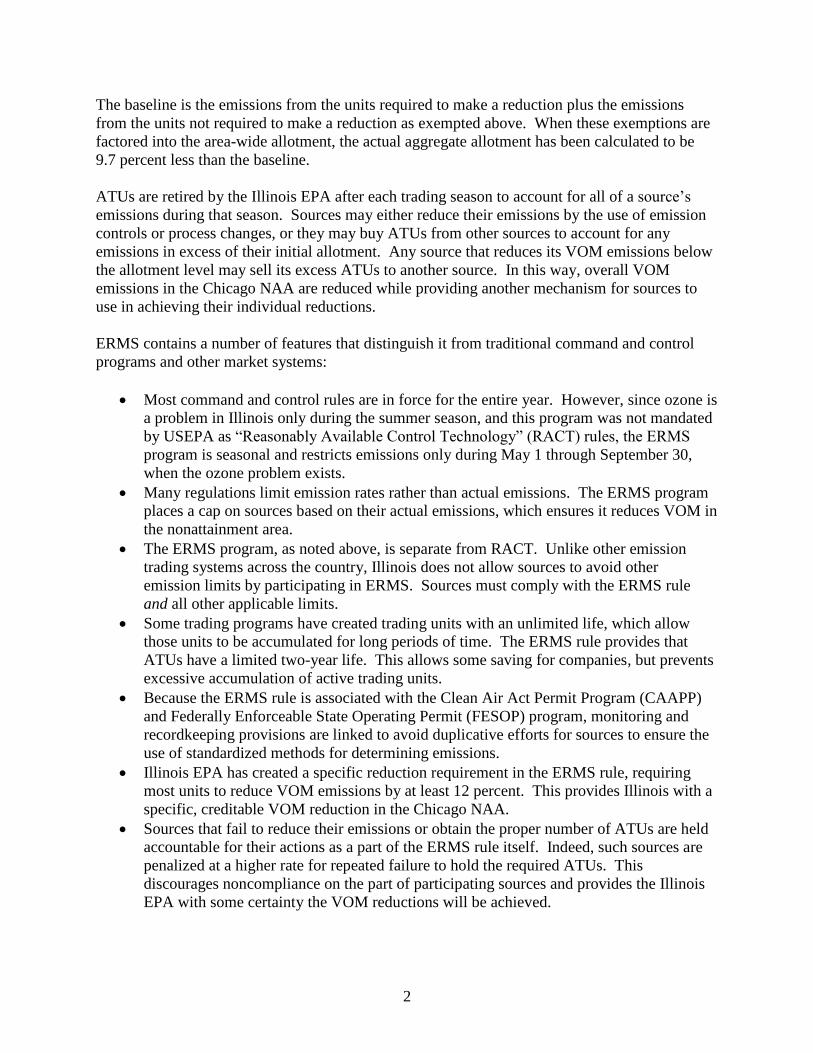
The baseline is the emissions from the units required to make a reduction plus the emissions
from the units not required to make a reduction as exempted above. When these exemptions are
factored into the area-wide allotment, the actual aggregate allotment has been calculated to be
9.7 percent less than the baseline.
ATUs are retired by the Illinois EPA after each trading season to account for all of a source’s
emissions during that season. Sources may either reduce their emissions by the use of emission
controls or process changes, or they may buy ATUs from other sources to account for any
emissions in excess of their initial allotment. Any source that reduces its VOM emissions below
the allotment level may sell its excess ATUs to another source. In this way, overall VOM
emissions in the Chicago NAA are reduced while providing another mechanism for sources to
use in achieving their individual reductions.
ERMS contains a number of features that distinguish it from traditional command and control
programs and other market systems:
Most command and control rules are in force for the entire year. However, since ozone is
a problem in Illinois only during the summer season, and this program was not mandated
by USEPA as “Reasonably Available Control Technology” (RACT) rules, the ERMS
program is seasonal and restricts emissions only during May 1 through September 30,
when the ozone problem exists.
Many regulations limit emission rates rather than actual emissions. The ERMS program
places a cap on sources based on their actual emissions, which ensures it reduces VOM in
the nonattainment area.
The ERMS program, as noted above, is separate from RACT. Unlike other emission
trading systems across the country, Illinois does not allow sources to avoid other
emission limits by participating in ERMS. Sources must comply with the ERMS rule
and all other applicable limits.
Some trading programs have created trading units with an unlimited life, which allow
those units to be accumulated for long periods of time. The ERMS rule provides that
ATUs have a limited two-year life. This allows some saving for companies, but prevents
excessive accumulation of active trading units.
Because the ERMS rule is associated with the Clean Air Act Permit Program (CAAPP)
and Federally Enforceable State Operating Permit (FESOP) program, monitoring and
recordkeeping provisions are linked to avoid duplicative efforts for sources to ensure the
use of standardized methods for determining emissions.
Illinois EPA has created a specific reduction requirement in the ERMS rule, requiring
most units to reduce VOM emissions by at least 12 percent. This provides Illinois with a
specific, creditable VOM reduction in the Chicago NAA.
Sources that fail to reduce their emissions or obtain the proper number of ATUs are held
accountable for their actions as a part of the ERMS rule itself. Indeed, such sources are
penalized at a higher rate for repeated failure to hold the required ATUs. This
discourages noncompliance on the part of participating sources and provides the Illinois
EPA with some certainty the VOM reductions will be achieved.

3
2 Scope of the Annual Performance Review Report
Section 205.760 of the ERMS rule directs the Illinois EPA to prepare an Annual Performance
Review Report addressing the effect of ERMS on VOM emissions, reviewing trends and patterns
that have emerged in the operation of ERMS, and looking at nine specific areas of the program
for the previous seasonal allotment period. These areas, all of which are included in later parts
of this report are:
1. Total aggregate VOM emissions from all ERMS sources.
2. A breakdown of the number of ATUs retired for compliance purposes or air quality
benefit, number currently banked, and the number used by new participating sources.
3. Evaluation of trading activities, including those sources who were net buyers, those that
were net sellers, and those that did not trade.
4. The use of the Alternative Compliance Market Account (ACMA), including its balance
and all transactions into or out of the account.
5. Summary of emission reduction generator (ERG) and inter-sector proposals.
6. Distribution of transactions by geographic area or character of source.
7. Availability of ATUs for purchase.
8. Average market price for ATUs.
9. Trends and spatial distributions of hazardous air pollutants (HAPs).
The Annual Performance Review Report must be prepared by June 15 of every year. This report
covers the 2016 ERMS season and all transactions pertaining to that season up to March 1, 2017.
Many of the terms and technical information referred to in this document are based on the
requirements in the ERMS rule. Readers who are unfamiliar with that rule should review it first
for a better overall understanding of the program and the terminology used in this report.


5
3 Area-wide Emission Status
3.1 Source Types
There are several different types of sources involved in the ERMS program as described below:
Participating sources are those that have baseline or actual emissions of at least 10 tons
during the season, are required to have a CAAPP permit or potential to emit of 25 tons
per year, were operating prior to May 1, 1999, and are located in the Chicago ozone
NAA. These make up the vast majority of sources in the ERMS program. They are
required to hold ATUs for all of their VOM emissions during the season.
New participating sources have actual seasonal emissions of at least 10 tons, are
required to have a CAAPP permit or potential to emit of 25 tons per year, but were not
operating prior to May 1, 1999. They must hold ATUs for all of their VOM emissions
during the season, but are not given baselines. They must acquire their ATUs through
trades or long-term transfer agreements.
Exempt sources are those which would otherwise need to be participating sources, but
have restricted their emissions in one of two ways. They may have used their CAAPP
permit or FESOP to limit seasonal VOM emissions to under 15 tons/season or they may
have already reduced their seasonal emissions by at least 18 percent of their baseline.
General participants are entities other than participating sources or new participating
sources who have obtained a transaction account and are allowed to trade ATUs.
Examples may include brokers or companies that were participating sources but who shut
down their operations and still want to retain control of their ATUs. For the purposes of
this report, there are two different types of general participants. There are those who
used to be participating sources and therefore continue to receive an allotment. The
second group includes those who were not previously classified as participating sources
and who never received allotments.
Special participants are entities that register with the Illinois EPA to purchase and retire
ATUs, but not sell ATUs. Any ATUs given or sold to a special participant are
automatically retired.

6
3.2 Total Aggregate VOM Emissions
Table 3-1 below summarizes the seasonal VOM emissions from each of the source categories.
Table 3-1: Source Emission Breakdown
Category Number of
Sources
Seasonal VOM
Emissions (tons)
Participating Sources 135 3,258.7
New Participating Source 7 76.7
Exempt due to 15 ton/season limit 79 178.1
Exempt due to 18% reduction 0 0.0
As a subset of participating sources and new participating sources, some emissions may be
covered by variances, consent orders, or CAAPP compliance schedules. Others may come from
contingent units, which are those units for which a construction permit was issued prior to 1998,
but for which three years of data is not yet available to determine a baseline – a situation that is
unlikely to occur now that many years have passed. A third subcategory is units that had an
emergency condition approved by the Illinois EPA as described in Section 205.750. Emissions
from the affected units are not included in the total for which ATUs are required in all of these
situations. Thus, they are subtracted out before reconciliation.
Other units may be part of a major modification to the source. Such a situation requires the
source to provide an additional reduction. This reduction is based upon the nonattainment status
at the time of the modification. Areas classified as severe, moderate and marginal nonattainment
require 1.3, 1.15 and 1.1 times the emissions from the applicable units, respectively, in order to
account for new source review requirements. Table 3-2 shows the emissions from these types of
units.
Table 3-2: Special Unit Emission Breakdown
Special Unit Type Number of
Sources
Seasonal VOM
Emissions (tons)
Contingent Units 0 0.00
Emergency 0 0.00
Variance, Consent Order, etc. 0 0.00
Major Modifications 2 0.92
Overall, there were a total of 11,789.6 tons of seasonal VOM emissions in the baselines of all
sources. These sources had an allotment of 97,392 ATUs (9,739.2 tons). This represents an
area-wide 9.7 percent reduction from the baseline VOM total to the allotment total before actual
emissions are taken into account.

7
3.3 Breakdown of ATU Use
ATUs are retired by the Illinois EPA to account for VOM emissions from participating and new
participating sources during the season. ATUs have a two-year life (except for some special
circumstances) and can be retained if they are not used or traded during the year in which they
are allotted. An ATU that is not used during this two-year period automatically expires. ATUs
may also be donated or sold to a special participant for air quality benefit (immediate retiring)
should a source so choose.
New and participating sources used 33,048 ATUs for compliance purposes, which does not
include ATUs from excursions (253 ATUs). Sources are retaining 96,514 ATUs, or
approximately 99.1 percent of the 2016 allotment, for the 2017 season.
3.4 Expired ATUs
At the end of the 2016 season, 61,602 ATUs expired from non-ERG sources. This represents
63.3 percent of the number of ATUs allotted in 2016. Table 3-3 identifies the source of these
expirations. General participants have been further split in this table to show those that have
received ATUs from ERGs/Inter-sectors separate from those that did not. For more information
on ERGs, see Section 5.
Table 3-3: Expired ATUs
Source Type
Number of
Sources with
Expired ATUs
Total Number of
Expired ATUs
Participating Source 116 35,141
General Participants (non-ERG) 7 4,912
New Participating Sources 2 823
Shutdowns 51 20,642
Out of Program 1 84
Total non-ERG 167 61,602
ERGs 7 2,504
Inter-sector 0 0
Total ERG/Inter-sector 7 2,504
Total 174 64,106

8
3.5 ATU Vintage Summary
While some companies allowed year 2015 issued ATUs to expire without using them, other
companies were retiring year 2015 issued ATUs for compliance purposes. Of the 33,425 ATUs
retired for compliance purposes after the 2016 season, 30,393 were originally issued in 2015.
Since ATUs with different expiration dates could be traded, the average price by ATU vintage
was analyzed. There were 1,147 ATUs traded in the 2016 season that were issued in 2015 (and
thus would have expired at the end of the 2016 season). These trades averaged $20.00/ATU.
Five trades, involving 696 ATUs that were issued in the 2016 season (which would have expired
at the end of the 2017 season) averaged $20.00/ATU. From this, it can be seen that remaining
ATU lifetime had little to no effect on price.
3.6 Findings
The initial design target for the ERMS program was a 12 percent reduction from the baseline,
made up of 9 percent for ROP, 1 percent for ACMA and 2 percent contingency. The resulting
allotment for 2016 was 9.7 percent below the baseline, which satisfies the needed reduction for
achieving ROP, given the net effect of exemptions, opt-outs, and contingency measures.
ATUs equivalent to a total of 65.8 percent of those allotted to participating sources expired at the
end of 2016 without being used.

9
4 Evaluation of Trading Activities
4.1 Account Officers
All sources required to participate in the ERMS program must have at least one account officer
designated to represent their transaction account. Designated account officers are ultimately
responsible for all information contained in each transaction account. Many sources have at least
two account officers so that one individual can be the primary and the other can be designated as
the alternate.
The ERMS rule specifies all prospective account officers must participate in account officer
training sponsored by the Illinois EPA prior to representing a transaction account. As of January
26, 2017, there are a total of 518 trained account officers.
The Agency has now made the training available online, which precludes the need for trainees to
come to Springfield. The training agenda included sections covering Title V permitting, ERMS
program overview, ATU creation review, seasonal emission reporting, emission compensation
process, functioning in the ERMS marketplace, transaction account, ACMA, and the ERMS
website. A common problem with the on-line training is that account officers indicate they have
done the training, but then do not submit the applicable forms. These persons are reminded via
e-mail to submit the necessary form(s).
Accessing and working with an assortment of information via the ERMS website is large part of
many account officers’ duties. Not only is the information on the website convenient to access,
it also provides the most up-to-date data available in the ERMS program.
4.2 Website Access
No additional issues regarding the web site were identified. As operating systems and browsers
continue to change, the Agency attempts to ensure proper access to the web site. In December
2014, the Illinois EPA web page was redesigned. The ERMS website can be found at
www.epa.illinois.gov/topics/air-quality/planning-reporting/erms/index.

10
4.3 Transaction Summary
During the 2015 season, the program generated 20 seasonal trades. There are currently 37 active
long-term transfer agreements. Transactions involved a total of 35 sources as sellers and 47 as
buyers (including excursion compensation sources). Four participating sources and five general
participants both bought and sold ATUs in 2016. Some of the sources that were both buying and
selling were shuffling ATUs to account for multiple locations. Most sources sold to other
participating sources or general participants, but two sources provided ATUs to a special
participant(s). Tables 4-1 and 4-2 list the total selling and buying of each source. Sources not
listed in the following two tables had no trading activity.
Table 4-1: ATU Sellers
Name ATU Sold
on Market
ATUs to
Special
Participants
ATUs to
ACMA
Transfer Agreements
Acme Packaging Corp 468
Acme Steel Co 221
AGI North America LLC 162
American NTN Bearing Mfg 30
AMPAC Flexicon Inc 200
Berlin Industries 80
Bluegreass Labels 242
Brown Printing Co (Account 1907) 88
Brown Printing Co (Account 3388) 162
BWay Packaging 398
Color Communications 185
Equilon Enterprises LLC 37
FC Graphics 70
Loparex 38
Marathon Ashland Petroleum LLC 177
Meyer Steel Drum 100
Palex Container Systems 862
Rexam Release 191
Rock-Tenn Co (Account 1675) 611
Rock-Tenn Co (Account 8728) 611
Silgan Closures, LLC 1,313
Silgan Containers 100
Sleepeck Printing Co 233 10
St. Clair Pakwell 100
Viskase Corp 1,670
Zenith Electronics 302
Transfer Agreement Subtotal 8,428 195 38
table continued on next page

11
Table 4-1: ATU Sellers (continued)
Name ATU Sold
on Market
ATUs to
Special
Participants
ATUs to
ACMA
Trades
ACMA 347
Abbott Laboratories 165
Arlington Plating 34
Buckeye Terminals 6
Chicago Baking 244
Equilon Enterprises 1
Fleischmann’s Vinegar Co Inc 166
Meyer Steel Drum 75
Pactiv Corporation 178
The Segerdahl Corp 39
Senior Flexonics 41
Viskase Corp 1,622
Trades Subtotal 2,918 0 0
Total 11,346 195 38

12
Table 4-2: ATU Buyers
Name
ATU
Bought on
Market
ATUs Bought
for Excursion
Compensation
Transfer Agreements
ACMA Account 38
Acme Packaging Corp 221
Air Products and Chemicals 230
American Litho Inc 80
Aux Sable Liquid Products 1000
Brown Printing (Account 3388) 70
Brown Printing (Account 22984) 250
Buckeye Terminals LLC 2
BWAY Corp 398
Captive Plastics LLC 242
Caterpillar 100
Dart Container Corp of Illinois 711
ECC Ltd (Account 3272) 233
ECC Ltd (Account 10183) 10
Equilon Enterprises LLC 35
Graphic Packaging 100
Illinois EPA 185
KNS Companies Inc 250
Law Office of Katherine Delahunt 302
Loparex Inc 191
Meyer Industrial Container 100
Meyer Steel Drum Inc (Account 1618) 431
Meyer Steel Drum Inc (Account 1750) 431
Multifilm Packaging Corp 232
MPLX Terminals LLC 177
Prairie State Group 120
Rock-Tenn Co/Waldorf Corp 611
S & C Electric 130
Signode Corp 468
Silgan Containers Corp 1313
Transfer Agreement Subtotal 8,661 0
table continued on next page

13
Table 4-2: ATU Buyers (continued)
Name
ATU
Bought on
Market
ATUs Bought
for Excursion
Compensation
Trades
AbbVie 165
Alpha Baking (Account 1706) 254
Campagna-Turano Bakery Inc 97
Chicago Steel Container 34
Coverhill Pastry-Vend LLC 166 90
Diago North America Inc 28 4
East Balt Commissary Inc 399
Equilon Enterprises LLC 1
Georgia Nut Co 75
Greif Packaging Inc LLC 6
Gold Standard Bakery 244
Highland Baking Co 166
Hunter Panels 233
Interlake Mecalux Inc 123
Kerry Ingredients 167
Kerry Ingredients & Flavors 41
Knead Dough Baking Co Inc 191
Lake Book Manufacturing 41
New WinCup Holdings 156
Pactiv LLC 178
Pepperidge Farms 14
Segerdahl Corp 39
Wood River Pipelines 6
Trades Subtotal 2,571 347
Total 11,232 347
Trades accounted for 11,579 ATUs. Trading activity comprised 11.9 percent of the total
allotment of 97,392 ATUs and 35.0 percent of the 33,048 ATUs that represent the emissions
reported for compliance purposes.

14
4.4 ATU Availability
There are several indicators of how accessible ATUs are to ERMS participants. One indicator is
the relative number of “buy” and “sell” postings to the ERMS bulletin board. There was a total
of one “sell” posting which showed 2,162 ATUs available for sale. There were no postings for
sources looking to buy ATUs. The fact that there was such a high ratio of ATUs for sale as
compared to those attempting to buy indicates ATUs were readily available to those looking for
them.
A second indicator is the average price. If ATUs are difficult to obtain, their price should rise as
a function of supply and demand. If they are readily available, the price should generally
decline. Prices declined in the early years but have steadied in recent years. Figure 4-1 shows
the average ATU prices in the past 10 years.
Figure 4-1: Average ATU Price ($/ATU)
A third indicator is that no source requested regular access to ACMA during the reconciliation
period. Sources would likely request such access if they could not find the ATUs they need on
the market. Thus, it can be concluded sources who were looking to acquire ATUs found the
ATUs they needed in the market.
A fourth indicator is the number of sources that went into excursion compensation because they
did not have enough ATUs to account for their emissions. Three sources went into excursion
compensation after the 2016 season. Only one of these three sources did not receive an
allotment. Circumstances regarding these excursions cannot be attributed to unavailability of
ATUs. The sources simply did not undertake the necessary actions to obtain required ATUs.
There has been no indication that any source that was actively looking for ATUs was unable to
obtain the needed amount.
A final indicator is the number of ATUs that expire. As discussed above, after the 2016 season,
64,106 ATUs expired without being used. This represents 65.8 percent of the ATUs allotted in
2016. If ATUs were in high demand, it is unlikely so many would have expired.
14.8618.22 19.32 20.10 20.06 19.93 19.86 19.80 19.31 20.00
0
5
10
15
20
25
2007 2008 2009 2010 2011 2012 2013 2014 2015 2016

15
4.5 Average ATU Market Price
The market price of an ATU is determined through trading among the ERMS participants. The
Illinois EPA uses information submitted with each trade to calculate the average market price by
dividing the total price of all included transactions by the number of ATUs traded. Trades may
not be included if the participants indicated special considerations were involved – for example,
if one branch of a company trades ATUs to another branch without charging a price. Long-term
transfer agreements are not included in the calculation of the average market price.
Using this method, the average market price for each ATU in the 2016 season was calculated to
be $20.00. ATUs were at a steady price of $20 each. When calculating the average ATU prices,
12 trades were included in determining this average.
There was no effect on price related to expiration date of an ATU. Out of the 12 trades used to
determine the average, three included ATUs that expired in a future year with the average price
of those trades being $20/ATU. The expiration date price of those ATUs being traded was not a
factor in establishing a price.
4.6 Findings
Sources were able to find trading partners
There was a sufficient supply of available ATUs
Market prices were conducive to trading


17
5 Alternative ATU Generation
5.1 Summary of Emissions Reduction Generator (ERG) Proposals
An emissions reduction generator (ERG) is a source that has achieved reductions in VOM
emissions but is not a participating source in ERMS. The reductions must be certified in a
permit and a participating source, new participating source, or general participant must propose
the reductions.
There were no new ERG proposals during 2016. In previous years, nine ERGs were approved.
Table 5-1 shows the ERGs that received ATUs in 2016.
All ERG proposals to date have been shutdowns for which facilities have forfeited their permits
to operate the affected units in order to receive ATUs. It is possible for sources to apply to
become ERGs using other methods, but all must show actual reductions in VOM emissions.
Any source wishing to receive ATUs on a continuing basis must modify its permit to incorporate
the limits, thus ensuring that actual reductions are achieved. Sources wishing only to get a single
issuance of ATUs must prove actual VOM reductions for that season.
Table 5-1: ERGs Receiving ATUs
Name ATU
Allotment
ATUs
Expiring at
the Source
ATUs to
ACMA
Alumax Extrusions 63 63
CCL Custom Manufacturing 147 147 36
General Mills 19 19
Industrial Coatings 82 82
Metal Box International 90 90
Pactiv 1,317 1,139 329
Sherwin-Williams 884 884 221
Solo Cup 99 99
Total 2,701 2,523 586
ATUs for ERGs equates to 2.8 percent of the total allotment to all sources in the ERMS program.
All of the ATUs allocated for ERGs in 2016, with the exception of General Mills, went into
general participating accounts. One general participant, Pactiv (Account 2654), traded 178
ATUs to a new participating source, Pactiv (Account 13689 – formerly Prairie Packaging). All
of these ATUs were retired. A total of 2,523 ATUs expired from these accounts after the 2016
season. The 178 ATUs retired are a small percentage of the allocation and the number of ATUs
that expired so ATUs generated from ERGs did not play a significant role in increasing
emissions.

18
5.2 Summary of Inter-Sector Proposals
There were no Inter-Sector proposals for the 2016 season.
5.3 Findings
ATU generation from ERGs played an extremely minor role in market performance
during the 2016 season
ATU generation from inter-sectors did not play a role in market performance during the
2016 season

19
6 Performance Accountability
6.1 Seasonal Emission Reports
Illinois EPA identified 185 sources that were required to submit seasonal emissions reports
(SERs) for the ERMS program. These reports are based on federally enforceable permit
conditions for recordkeeping, reporting, monitoring, and calculation methodology. Of these, 142
SERs were expected from permitted participating/new sources. Follow-up calls were made to
five facilities that did not submit their SERs by the deadline.
Illinois EPA deemed 4.3 percent of the SERs received from participating sources as unacceptable
because of a variety of errors. This percentage is much lower than previous years due to the fact
that the seasonal reporting form found on the ERMS web page is now a fillable form and
performs the calculations for the user. However, many sources do not use this capability.
Reasons for determining reports to be unacceptable continue to include items from previous
years:
Failure to include all significant emission units covered by the permit
Not reporting operating rate data
Mathematical or rounding errors (for those not using the online form)
Sources are required to report VOM HAP emissions on their SERs if they are subject to MACT,
report to TRI, or are major for HAPs. Some sources continued to report pollutants that were not
HAPs, or that were HAPs but were not VOM. Information pertaining to these pollutants was not
considered in this evaluation.
6.2 Alternative Compliance Market Account (ACMA)
The purpose of ACMA is to serve as a secondary source of ATUs for participants. Unlike ATUs
allocated to sources, those in ACMA have an indefinite life as long as they remain in ACMA.
Once they are bought, they must be used to account for either the preceding or subsequent
seasonal allotment period.
ACMA may receive ATUs in several ways. ACMA is given ATUs in an amount equal to one
percent of each year’s allotment to the participating sources. Sources that choose to become
exempt from ERMS by taking an 18 percent reduction have six percent of that reduction allotted
to ACMA. ATUs are also deposited in ACMA as a result of participating source shutdowns and
ERG shutdowns. Additionally, sources may donate ATUs to ACMA.
There were no expenditures from the ACMA account in 2016.
A total of 7,817 ATUs were deposited into ACMA, as detailed in Table 6-1 below. Of these, a
total of 38 ATUs were donated to ACMA by a source as part of the settlement of a compliance
issue.

20
Table 6-1: ACMA Account Balance
2012 2013 2014 2015 2016
Regular Allotment 1,001 1,001 1,003 1,003 975
Allotment from 18% Reduction 0 0 0 0 0
ERG Shutdowns 586 586 586 586 586
Participating Source Shutdowns 5,364 5,339 6,068 6,190 5,721
Donations to ACMA 38 38 38 38 38
ATUs Bought from ACMA -381 -1,189 -862 -1,676 -6,791
Previous Year’s Balance 29,882 36,490 42,265 49,095 55,236
Balance 36,490 42,265 49,095 55,236 55,765
Sources may buy ATUs from ACMA during the reconciliation period or, if necessary, in
excursion compensation. Of the 6,791 ATUs purchased from ACMA, 94 were for excursion
compensation for the 2015 season and 233 were for excursion compensation for the 2016 season.
A purchase of 6,464 ATUs was to account for multiple years of calculation errors. Recent
ACMA purchases by year can be seen in table 6-2.
Table 6-2: ACMA Purchases
2012 2013 2014 2015 2016
Sources 3 7 3 1 4
ATUs purchased 381 1,189 467 228 6,791
Total cost (nearest dollar) $11,461 $35,519 $13,870 $6,605 $181,873
6.3 Excursion Compensation
Three sources went into excursion compensation for the 2016 season. For these sources, lack of
action to purchase ATUs seemed to be the apparent cause of going into excursion rather than
being unable to obtain ATUs on the market. One of the sources in excursion was in excursion
for at least the second year in a row and was thus were required to provide 1.5 times the ATUs of
their excursion. The other sources were required to provide 1.2 times the ATUs of their
excursion.
Sources in excursion compensation have their ATUs withdrawn from ACMA unless they instruct
Illinois EPA to take them from the next year’s allotment. All sources in excursion for 2016
bought from ACMA.

21
6.4 Source Inspections
In order to make sure appropriate ERMS reporting and compliance is maintained, the Field
Operations Section includes conducts inspections of ERMS sources during the year. For 2016,
32 full compliance evaluations, which include ERMS Master File reviews, were performed at
participating/new participating sources. Master File inspections add a further level of review of
the source’s ERMS Compliance Master File to make sure all recordkeeping, HAP information,
and other ERMS related items are being properly maintained.
6.5 Findings
The same errors continue to be made on the SERs each year. These errors are
satisfactorily resolved once the company is notified.
Establishing a seasonal report form on the ERMS web page that performed the
calculation for the users greatly reduced math errors if they chose to use the form.
No requests for regular access to ACMA were received during the reconciliation period.
The reconciliation and compensation processes performed as designed and operated in a
timely and effective manner.
Inspections by the Illinois EPA found sources to be complying with the ERMS
requirements.


23
7 Distribution of Emissions
7.1 Geographic Distribution of Transactions
Table 7-1 summarizes the number of ATUs traded for each county. It should be noted the total
number of ATUs that appear to be leaving the nonattainment area is much higher than the total
coming in. This is mostly due to ATUs sold to general participants who do not reside in any
particular county and who have not then traded those ATUs back into the area for use by a
participant. In addition, ATUs traded to special participants are counted as being “sold” but not
“bought” because all such ATUs are immediately retired without being used in a particular
county. ATUs donated to ACMA would have a similar result as they are also not used in any
particular county. Similarly, the ATUs for excursion compensation did not come from any
county.
Table 7-1: ATUs Traded by County
County # of ERMS
Sources ATUs Sold
ATUs
Bought
Excursion
ATUs Net
Cook 127 9,418 4,389 233 -4,796
DuPage 14 0 527 20 547
Grundy 4 0 1,000 0 1,000
Kane 14 272 993 0 671
Kendall 1 0 0 0 0
Lake 11 165 165 0 0
McHenry 8 450 70 0 -380
Will 25 0 1,005 0 1,005
Cook County shows the largest differential in ATUs transfers with approximately 4,800 ATUs
leaving the county. Counties that show an increase may also include sources purchasing ATUs
to cover past compliance problems. The history of ATUs traded by county can be found in
Section 8.4.
During the 17 years of the program, no pattern or trend in trading has emerged in terms of ATU
flow among the counties.
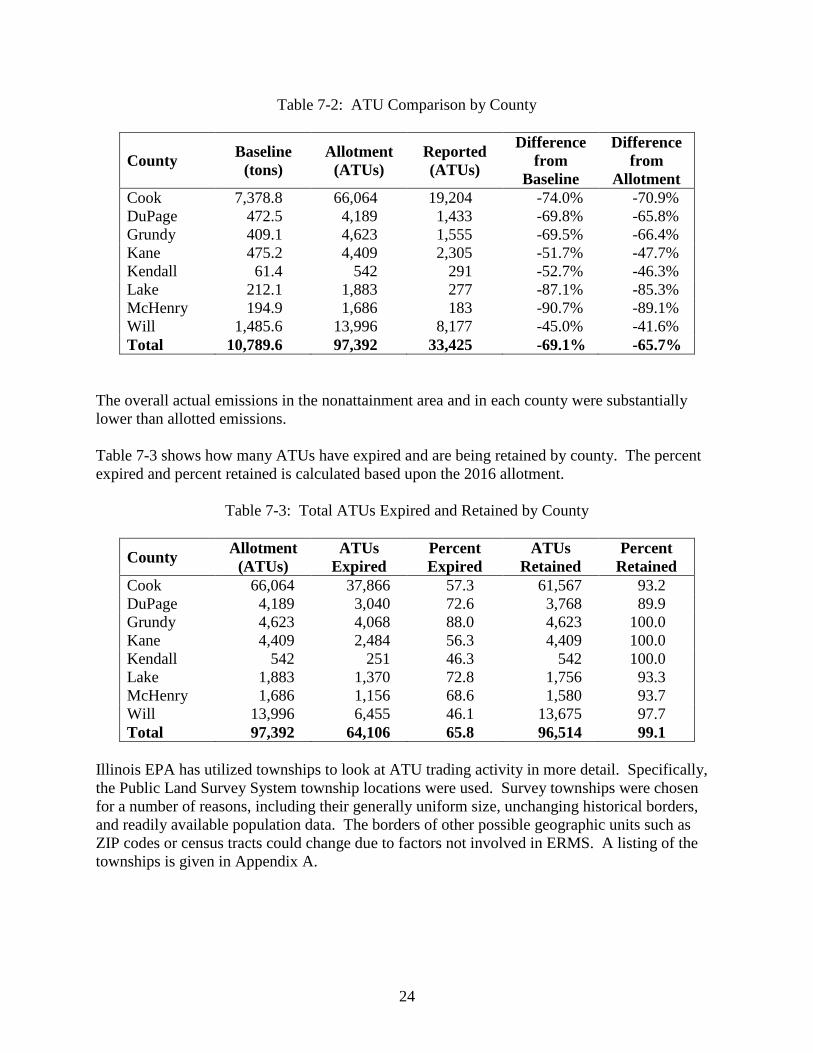
Table 7-2 provides a comparison by county showing baselines, allotments, and actual reported
ATU use.
24
Table 7-2: ATU Comparison by County
County Baseline
(tons)
Allotment
(ATUs)
Reported
(ATUs)
Difference
from
Baseline
Difference
from
Allotment
Cook 7,378.8 66,064 19,204 -74.0% -70.9%
DuPage 472.5 4,189 1,433 -69.8% -65.8%
Grundy 409.1 4,623 1,555 -69.5% -66.4%
Kane 475.2 4,409 2,305 -51.7% -47.7%
Kendall 61.4 542 291 -52.7% -46.3%
Lake 212.1 1,883 277 -87.1% -85.3%
McHenry 194.9 1,686 183 -90.7% -89.1%
Will 1,485.6 13,996 8,177 -45.0% -41.6%
Total 10,789.6 97,392 33,425 -69.1% -65.7%
The overall actual emissions in the nonattainment area and in each county were substantially
lower than allotted emissions.
Table 7-3 shows how many ATUs have expired and are being retained by county. The percent
expired and percent retained is calculated based upon the 2016 allotment.
Table 7-3: Total ATUs Expired and Retained by County
County Allotment
(ATUs)
ATUs
Expired
Percent
Expired
ATUs
Retained
Percent
Retained
Cook 66,064 37,866 57.3 61,567 93.2
DuPage 4,189 3,040 72.6 3,768 89.9
Grundy 4,623 4,068 88.0 4,623 100.0
Kane 4,409 2,484 56.3 4,409 100.0
Kendall 542 251 46.3 542 100.0
Lake 1,883 1,370 72.8 1,756 93.3
McHenry 1,686 1,156 68.6 1,580 93.7
Will 13,996 6,455 46.1 13,675 97.7
Total 97,392 64,106 65.8 96,514 99.1
Illinois EPA has utilized townships to look at ATU trading activity in more detail. Specifically,
the Public Land Survey System township locations were used. Survey townships were chosen
for a number of reasons, including their generally uniform size, unchanging historical borders,
and readily available population data. The borders of other possible geographic units such as
ZIP codes or census tracts could change due to factors not involved in ERMS. A listing of the
townships is given in Appendix A.

25
There are 62 townships with ERMS participants and a total of 118 townships in the
nonattainment area. Tables 7-4 and 7-5 summarize the number of sources in townships and the
area of townships.
Table 7-4: Number of Sources per Township
Number of
Sources
Number of
Townships
1 28
2-3 18
4-6 7
>6 9
Table 7-5: Township Areas
Area
(square miles)
Number of
Townships
30-39 100
20-30 7
<20 11
Table 7-6 summarizes trading at the township level.

26
Table 7-6: ATUs Traded by Township
Township
Allotment
(ATUs)
ATU
Increase
ATU
Decrease
Net
Change
from
Allotment
3408 4,623 1,000 0 1,000 21.6%
3409 7,991 230 0 230 2.9%
3510 629 100 0 100 15.9%
3609 97 28 0 28 28.9%
3610 143 278 0 278 194.4%
3710 2,948 369 0 369 12.5%
3714 6,698 221 468 -247 -3.7%
3715 608 0 221 -221 -36.3%
3808 1,755 711 0 711 40.5%
3812 22,818 470 3,298 -2,828 -12.4%
3813 5,780 0 802 -802 -13.9%
3814 2,981 100 410 -310 -10.4%
3912 2,524 198 382 -184 -7.3%
3913 2,672 1,889 360 1,529 57.2%
3914 2,776 399 862 -463 -16.7%
4008 420 0 242 -242 -57.6%
4009 145 156 0 156 107.6%
4010 634 330 0 330 52.1%
4011 1,437 41 0 41 2.9%
4012 2,518 328 932 -604 -24.0%
4013 1,743 166 1,313 -1,147 -65.8%
4108 834 232 0 232 27.8%
4109 1,932 0 41 -41 -2.1%
4110 300 0 80 -80 -26.7%
4111 4,214 283 215 68 1.6%
4114 220 130 0 130 59.1%
4208 603 0 30 -30 -5.0%
4210 243 0 34 -34 -14.0%
4211 187 39 0 39 20.9%
4212 0 166 0 166 -----
4308 88 0 88 -88 -100.0%
4309 332 0 200 -200 -60.2%
4407 74 70 162 -92 -124.3%
4411 537 165 165 0 0.0%

27
Tables 7-7 and 7-8 summarize the ATUs expired and retained at the township level of the entire
nonattainment area. The percentage given is for the number of ATUs that expired as compared
to the number of ATUs allotted to the township in 2015. See Appendix B for full details by
township number.
Table 7-7: Expired ATUs by Township
Percent of ATUs
Expired
Number of
Townships
0 9
0.1 - 20 3
20.1 – 40 5
40.1 – 60 11
60.1 – 80 15
80.1 – 100 14
=100 0
>100 2
Table 7-8: Retained ATUs by Township
Percent of ATUs
Retained
Number of
Townships
0 5
0.1 - 20 0
20.1 – 40 3
40.1 – 60 2
60.1 – 80 2
80.1 – 100 8
=100 35
>100 4
To get a full picture of how the ERMS program works at a township level, it is necessary to look
at the actual emissions rather than simply at trades. Some companies had excess ATUs they
could have sold if a buyer had been located. Others may have chosen not to sell even if their
emissions were lower than their allotments. Illinois EPA compared the actual emissions reported
by participants in each township to the baselines and allotments for those townships and used
this approach throughout the remainder of the analysis.
In this analysis, Illinois EPA found five townships, or 4.2 percent of the 118 townships in the
entire Chicago NAA, showed increases in emissions over their baselines, as shown in Table 7-9.

28
Table 7-9: Townships with Emissions Over Baseline Level
County
Township
Number
of
Sources
VOM
Increase
(tons)
Increase
from
Baseline
Cook 3711 – Lemont 1 6.5 48.8%
Cook 4211 – Wheeling 1 1.3 6.1%
DuPage 4009 – Wayne 1 13.6 83.4%
Will 3609 – Plainfield 1 1.6 14.3%
Will 3610 – Lockport 1 1.7 10.3%
Figure 7-1 shows all participating sources and the five townships highlighted in yellow with an
increase over their baselines. Each township with an increase over its baseline has only one
participating source.
Table 7-10 identifies the townships that had 2016 seasonal emissions exceeding their allotment
level. These six townships represent 5.1 percent of the total number of townships.
Table 7-10: Townships with Emissions Over Allotment Level
County
Township
Number
of
Sources
VOM
Increase
(ATUs)
Increase
from
Allotment
Cook 3711 – Lemont 1 82 69.5%
Cook 4211 – Wheeling 1 39 20.9%
DuPage 3811 – Downers Grove 1 32 8.5%
DuPage 4009 – Wayne 1 156 107.6%
Will 3609 – Plainfield 1 28 28.9%
Will 3610 – Lockport 1 36 25.2%
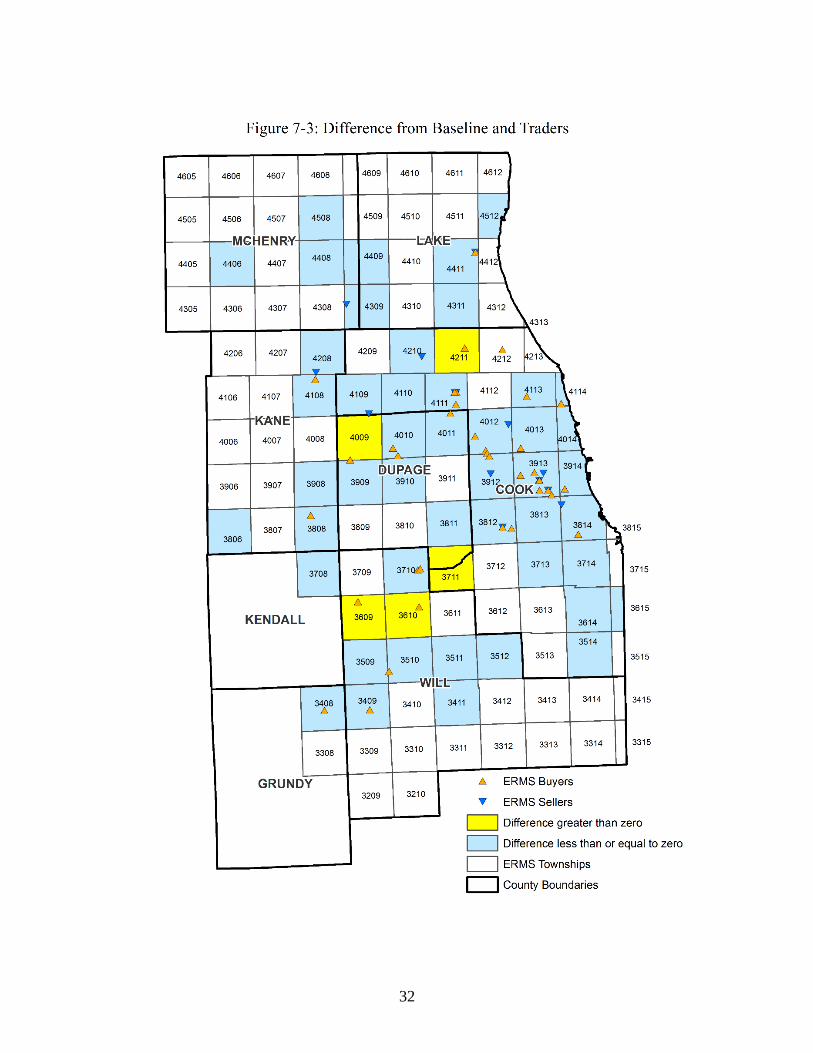
Figure 7-2 shows all participating sources in the NAA and highlights in yellow the six townships
which show increases over their allotments. Figures 7-3 and 7-4 show the highlighted townships
for both baseline and allotment comparisons and flag only those sources that traded. Both of
these maps show most often a single buyer in each of the affected townships put that township
over its baseline or allotment.
Each county and the nonattainment area overall showed emissions significantly less than both
the baseline and allotment. Appendix B contains the data from which all of the above
information was obtained and a map showing actual emissions compared to the allotment.

29
7.2 Type of Source
Table 7-11 identifies sources by their two-digit SIC code for each source that took part in a trade.
Table 7-11: Transactions by SIC Code
SIC and Description ATUs
Bought
ATUs
Sold Net
13 – Oil and Gas Extraction 1,000 0 1,000
20 – Food Products 1,828 410 1,418
26 – Paper Products 100 1,187 -1,087
27 – Printing & Publishing 582 1,186 -604
28 – Chemicals and Allied Products 645 165 480
30 – Rubber & Plastic Products 1,045 3,292 -2,247
33 – Primary Metals 0 221 -221
34 – Fabricated Metal Products 1,675 2,313 -638
35 – Industrial & Commercial Machinery 100 71 29
36 – Electronic & Electrical Equipment 130 302 -172
42 – Motor Freight Transportation 2 6 -4
46 – Pipelines (except natural gas) 284 0 284
51 – Wholesale Trade – Nondurable 177 215 -38
76 – Miscellaneous Repair Services 531 937 -406

30

31
32

33

34
Table 7-12 provides the allotments for every SIC code which has a participant and that are being
retained by sources in that industrial category.
Table 7-12: Total ATUs Expired and Retained by SIC Code
SIC Allotment
(ATUs)
ATUs
Expired
Percent
Expired
ATUs
Retained
Percent
Retained
13 – Oil and Gas Extraction 0 792 ----- 0 -----
20 – Food Products 9,402 4,051 43.1 7,954 84.6
22 – Textile Products 272 218 80.1 272 100.0
24 – Lumber/Wood 386 229 59.3 386 100.0
25 – Furniture 1,653 1,437 86.9 1,653 100.0
26 – Paper Products 17,784 13,194 74.2 16,982 95.5
27 – Printing/Publishing 4,526 2,425 53.6 4,296 94.9
28 – Chemical Products 16,194 10,910 67.4 16,194 100.0
29 – Petroleum 4,992 1,279 25.6 4,992 100.0
30 – Rubber/Plastic 8,267 2,610 31.6 7,530 91.1
31 – Leather Products 281 233 82.9 281 100.0
32 – Stone/Clay/Glass 127 0 0.0 0 0.0
33 – Primary Metals 5,702 3,477 61.0 5,702 100.0
34 – Fabricated Metals 8,988 6,089 67.7 7,978 88.8
35 – Industrial Machinery 2,976 2,519 84.6 2,976 100.6
36 – Electrical Equipment 766 403 52.6 464 60.6
37 – Transportation Equip. 6,836 2,872 42.0 6,836 100.0
39 – Misc. Manufacturing 172 139 80.8 172 100.0
42 – Motor Freight Transport 1,637 417 25.5 1,551 94.7
46 – Pipelines 898 332 37.0 775 86.3
49 – Elec./Gas Services 480 345 71.9 480 100.0
51 – Nondurable Goods 3,174 1,825 57.5 2,998 94.5
73 – Business Services 219 130 59.4 219 100.0
76 – Misc. Repair Services 1,261 426 33.8 830 65.8
82 – Educational Services 316 271 85.8 316 100.0
87 – Engineering/Research 83 67 80.7 83 100.0
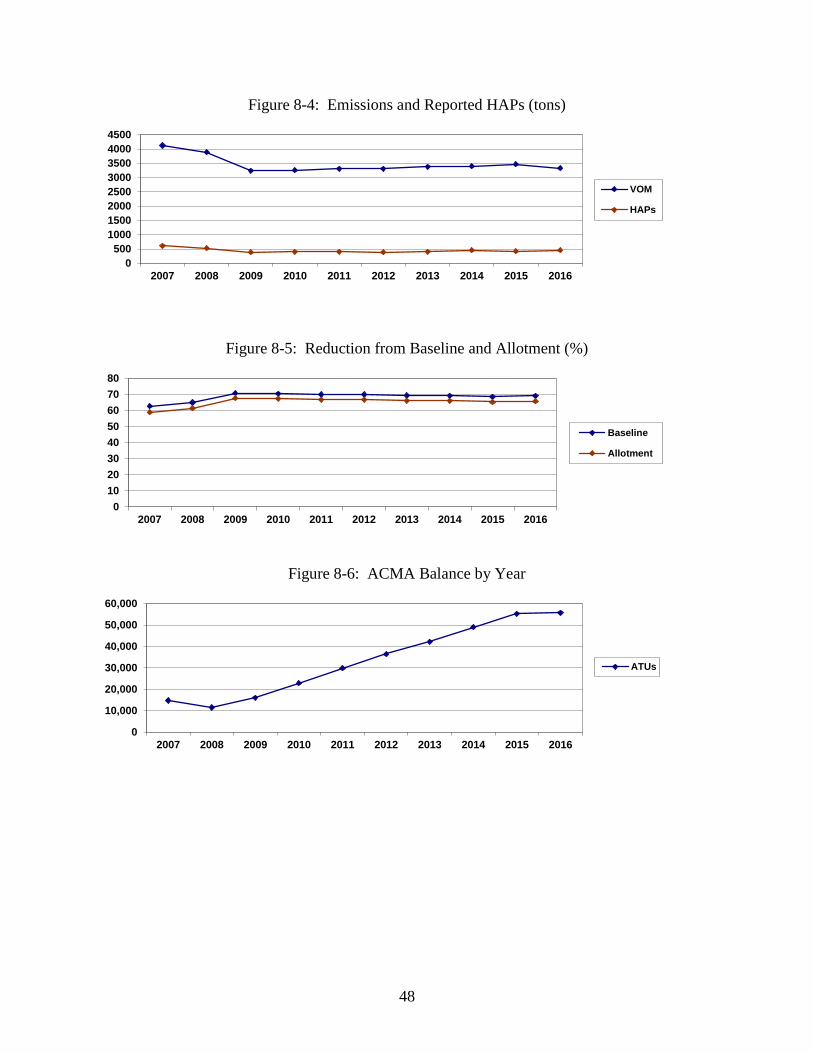
7.3 Trends and Spatial Distributions of Hazardous Air Pollutants (HAPs)
This is the 16th year sources have reported their HAP emissions. Area-wide emissions of HAPs
show a downward trend since the first reporting year of 2001. VOM emissions show a generally
downward trend. Emissions of HAPs by county can be found in Section 8.
Figures 7-5 and 7-6 show the previously mentioned townships and those ERMS sources that
reported VOM HAPs in their SER. While most of the townships in question do contain sources
that reported HAPs, there is no geographic concentration of such sources.

35
To further examine any possible relationship between HAP emitters and those townships which
saw an increase, Figures 7-7 and 7-8 show those sources which are both HAP reporters and also
participated in a trade during the 2016 season. As can be seen on those figures, there were two
ATU buyers that reported HAPs in the highlighted townships. Both buyers had decreases in
HAP emissions from 2015 to 2016. The total of this decrease was approximately 0.2 tons.
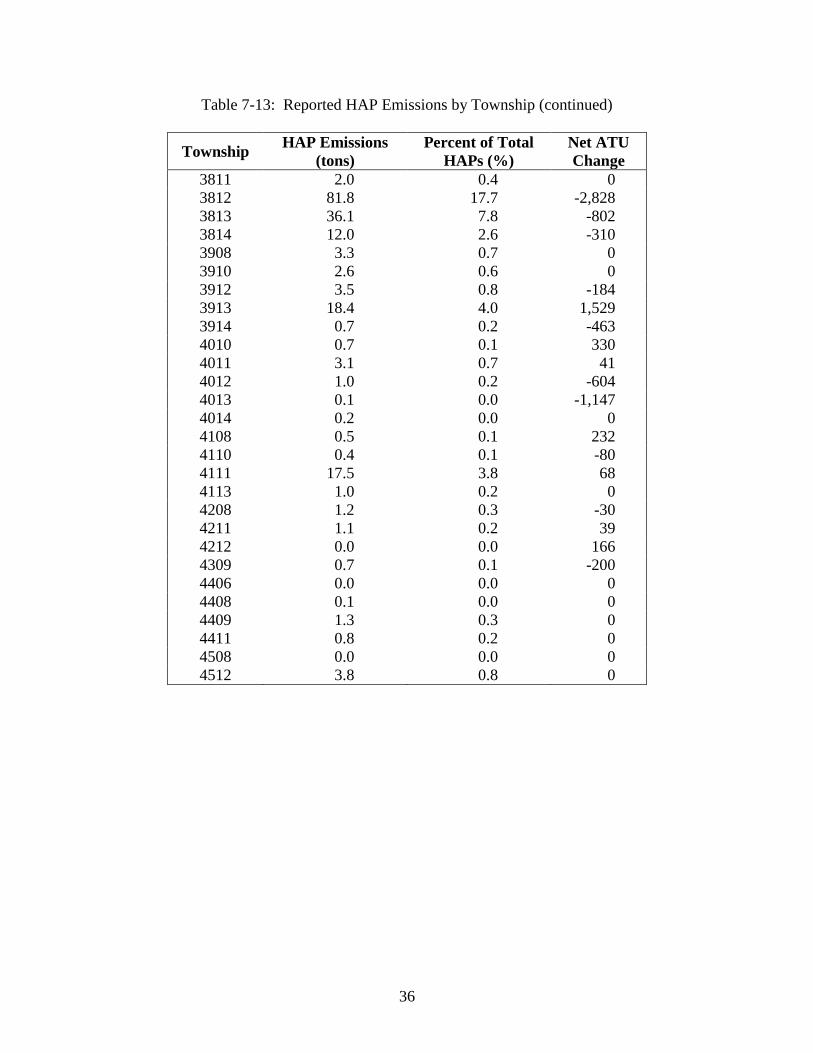
Table 7-13 shows the total HAPs reported for each township. It also shows the relative HAP
emission density by looking at the percentage of HAP emissions compared to the total reported
HAPs for the entire nonattainment area by ERMS sources and the net result of trading that took
place in those townships.
Once again, the areas with the highest HAP emissions were typically not buying ATUs and
increasing HAP emissions. The township, 3409, that had a large contribution of HAPs had an
increase, 418 pounds, in HAPs for the one source that traded. Furthermore, overall HAP
emissions have typically been decreasing over the years for which data had been collected.
There was an increase of 41.5 tons of HAP emissions from 2015 to 2016 which seems to be an
isolated even with the primary contributor to the increase being one company. The largest HAP
increase from a source that bought was 2.6 tons.
Table 7-13: Reported HAP Emissions by Township
Township HAP Emissions
(tons)
Percent of Total
HAPs (%)
Net ATU
Change
3408 13.1 2.8 1,000
3409 144.4 31.3 230
3411 0.3 0.1 0
3509 2.3 0.5 0
3510 0.1 0.0 100
3511 0.8 0.2 0
3514 3.9 0.8 0
3610 0.4 0.1 278
3614 17.6 3.8 0
3615 3.5 0.8 0
3708 1.2 0.3 0
3710 25.7 5.6 369
3713 4.1 0.9 0
3714 49.3 10.7 -247
3806 0.4 0.1 0
table continued on next page
36
Table 7-13: Reported HAP Emissions by Township (continued)
Township HAP Emissions
(tons)
Percent of Total
HAPs (%)
Net ATU
Change
3811 2.0 0.4 0
3812 81.8 17.7 -2,828
3813 36.1 7.8 -802
3814 12.0 2.6 -310
3908 3.3 0.7 0
3910 2.6 0.6 0
3912 3.5 0.8 -184
3913 18.4 4.0 1,529
3914 0.7 0.2 -463
4010 0.7 0.1 330
4011 3.1 0.7 41
4012 1.0 0.2 -604
4013 0.1 0.0 -1,147
4014 0.2 0.0 0
4108 0.5 0.1 232
4110 0.4 0.1 -80
4111 17.5 3.8 68
4113 1.0 0.2 0
4208 1.2 0.3 -30
4211 1.1 0.2 39
4212 0.0 0.0 166
4309 0.7 0.1 -200
4406 0.0 0.0 0
4408 0.1 0.0 0
4409 1.3 0.3 0
4411 0.8 0.2 0
4508 0.0 0.0 0
4512 3.8 0.8 0

37

38

39

40

41
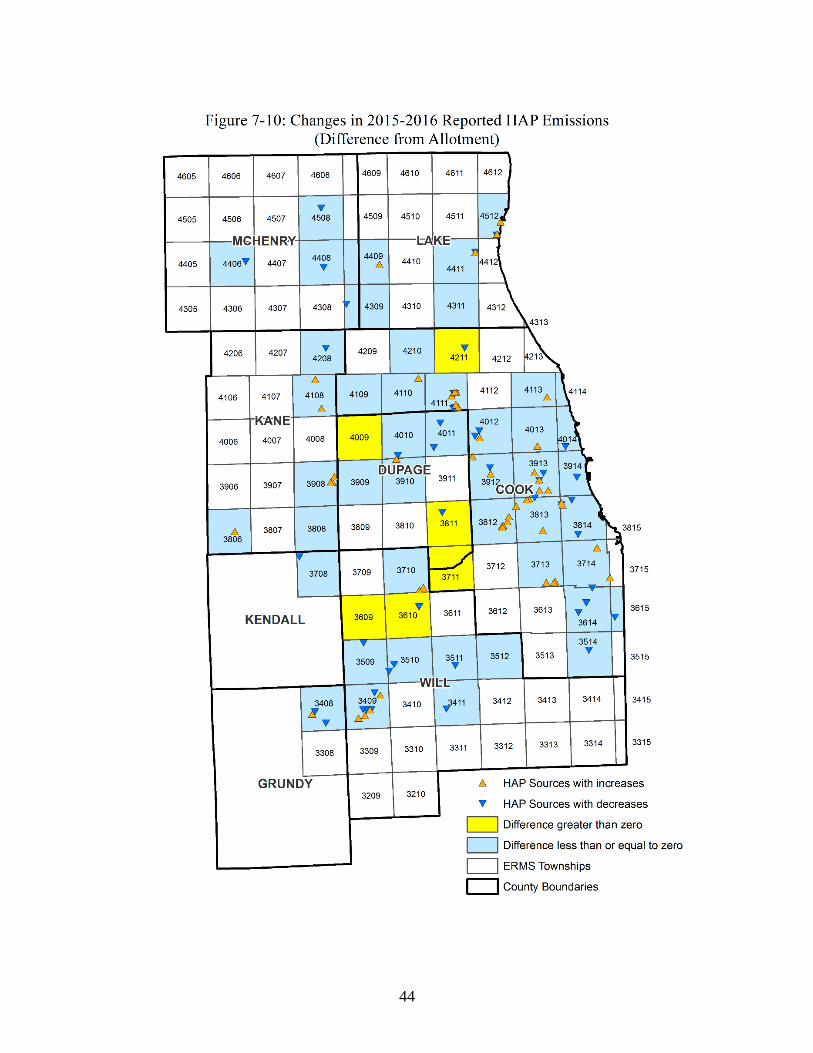
Figures 7-9 and 7-10 compare changes in HAP emissions on both a source and on a township
basis. For 2016, the number of sources, 46, with decreases in HAP emissions was approximately
equal to the number of sources with increases, 50, in HAP emissions. Overall, HAP emissions
increased 41.0 tons for the area. Four sources comprise the majority of the increase. The
sources with the largest increases were not in the areas of interest.
Illinois EPA also looked at population densities relative to HAP sources to determine if trading
activity might be affecting the more densely populated areas. Population densities, rather than
actual populations, were used to normalize the emissions as the population might be distributed
over a wide area.
Figures 7-11 and 7-12 show the sources which reported HAPs on a map that is color-coded for
population density. The two higher-density areas, 3811 and 4211, each have a single HAP
reporter who had a decrease in HAP emissions.
It should be noted that all of the sources that increased their HAP emissions could have done so
without the ERMS program and would have been less restricted in doing so because the ERMS
program holds them accountable for those emissions as with any other VOM emissions.
Table 7-14 summarizes the key results from evaluating Figures 7-9 through 7-12.
Table 7-14: Key Results on HAPs for Six Highlighted Townships
Township
HAP
Source
Present?
Trading
HAP
Source?
Population
Density
Level
Percent of
VOM that
are HAPs
3609 – Plainfield No No 3 0.0
3610 – Lockport Yes Yes 3 2.4
3711 – Lemont (Cook) No No 3 0.0
3811 – Downers Grove Yes No 4 5.0
4009 – Wayne No No 3 0.0
4211 – Wheeling Yes Yes 4 4.8
For 2016, 13.8 percent of the VOM emitted was a HAP.
42
7.4 HAP Information Request Letters
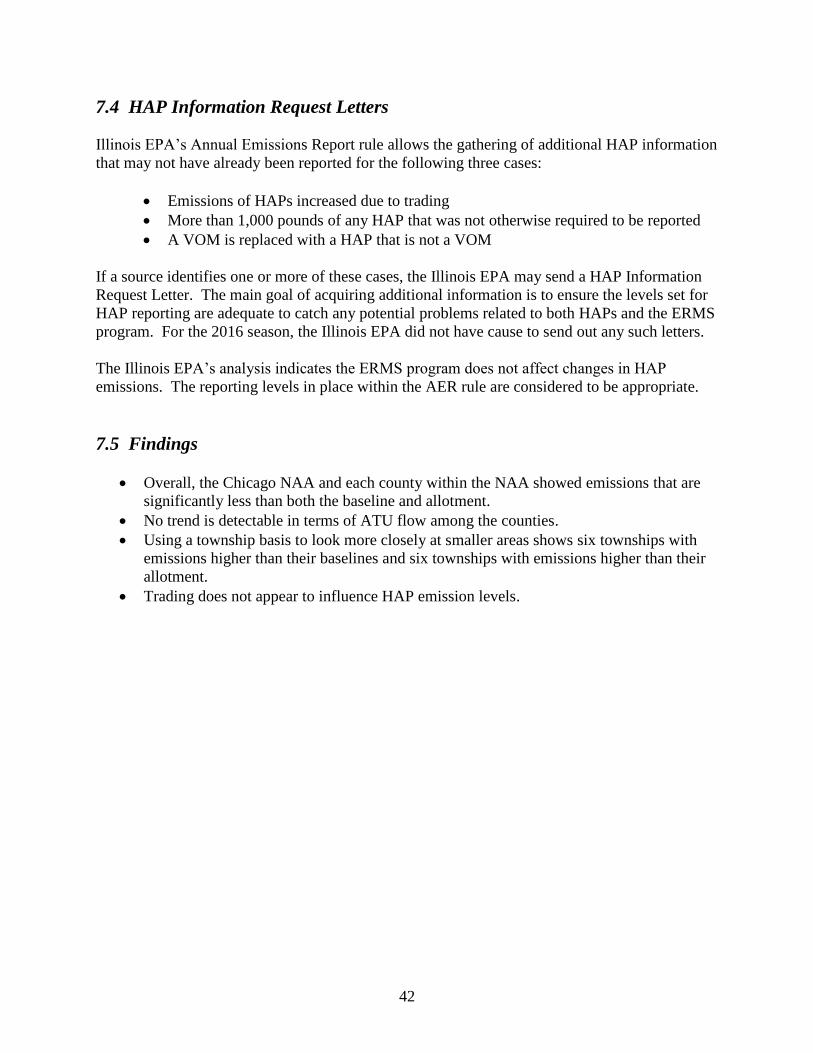
Illinois EPA’s Annual Emissions Report rule allows the gathering of additional HAP information
that may not have already been reported for the following three cases:
Emissions of HAPs increased due to trading
More than 1,000 pounds of any HAP that was not otherwise required to be reported
A VOM is replaced with a HAP that is not a VOM
If a source identifies one or more of these cases, the Illinois EPA may send a HAP Information
Request Letter. The main goal of acquiring additional information is to ensure the levels set for
HAP reporting are adequate to catch any potential problems related to both HAPs and the ERMS
program. For the 2016 season, the Illinois EPA did not have cause to send out any such letters.
The Illinois EPA’s analysis indicates the ERMS program does not affect changes in HAP
emissions. The reporting levels in place within the AER rule are considered to be appropriate.
7.5 Findings
Overall, the Chicago NAA and each county within the NAA showed emissions that are
significantly less than both the baseline and allotment.
No trend is detectable in terms of ATU flow among the counties.
Using a township basis to look more closely at smaller areas shows six townships with
emissions higher than their baselines and six townships with emissions higher than their
allotment.
Trading does not appear to influence HAP emission levels.

43
44

45

46

47
8 Historical Regional Data
Figure 8-1: Allotment and Compensation by Year
Figure 8-2: Allotment and Expired ATUs by Year
Figure 8-3: Allotment and Retained ATUs by Year
0
20,000
40,000
60,000
80,000
100,000
120,000
2007 2008 2009 2010 2011 2012 2013 2014 2015 2016
Allot.
Comp.
0
20,000
40,000
60,000
80,000
100,000
120,000
2007 2008 2009 2010 2011 2012 2013 2014 2015 2016
Allot.
Expired
0
20,000
40,000
60,000
80,000
100,000
120,000
2007 2008 2009 2010 2011 2012 2013 2014 2015 2016
Allot.
Retained
48
Figure 8-4: Emissions and Reported HAPs (tons)
Figure 8-5: Reduction from Baseline and Allotment (%)
Figure 8-6: ACMA Balance by Year
0
500
1000
1500
2000
2500
3000
3500
4000
4500
2007 2008 2009 2010 2011 2012 2013 2014 2015 2016
VOM
HAPs
0
10
20
30
40
50
60
70
80
2007 2008 2009 2010 2011 2012 2013 2014 2015 2016
Baseline
Allotment
0
10,000
20,000
30,000
40,000
50,000
60,000
2007 2008 2009 2010 2011 2012 2013 2014 2015 2016
ATUs

49
9 Conclusions
As required by Section 205.760, Illinois EPA has documented the performance of ERMS for the
2016 season and evaluated these data for trends or patterns emerging from the ERMS program.
Illinois EPA believes the ERMS program is working as intended and is achieving VOM emission
reductions included as part of the State’s ozone SIP for Chicago. Illinois EPA’s conclusions are:
The ERMS program continued to achieve the desired emission reductions. The
allotment shows a 9.5 percent reduction from the original baseline and exceeded the
necessary 9 percent reduction for the 16th year in a row. Thus, even if every allotted
ATU was used, there would still be a significant reduction from the VOM baseline in the
area.
ERMS participants are performing significantly below the baseline and allotment
levels. The ERMS program was created to help reduce VOM emissions from the
Chicago NAA and to aid in bringing that area into attainment with the NAAQS for
ozone. A review of the emission data for ERMS participating sources shows these
sources have, as a whole, reduced VOM emissions by a substantial amount compared to
their baselines and allotments. Sources emitted 69.1 percent less VOM than their
baselines would have allowed them to emit and 65.7 percent less than their actual ATU
allotments for 2016.
The Market System operated in an effective manner. Sources were able to find
trading partners, there was sufficient supply of available ATUs, and market prices were
conducive to trading. Alternative ATU generation did not play a role in market
performance during the 2016 season. Reconciliation and compensation processes
performed as designed.
No relationship is apparent between market activity and HAP levels. The 16th year
of HAP reporting by ERMS participants did not indicate trading had any influence on
HAP emissions.

A-1
Appendix A
*Township Names and Id Numbers
Township
ID
Township Name County
3209 Custer/Reed Will
3210 Wesley Will
3308 Goose Lake Grundy
3309 Wilmington Will
3310 Florence Will
3311 Wilton Will
3312 Peotone Will
3313 Will Will
3314 Washington Will
3315 Washington - East Will
3408 Aux Sable Grundy
3409 Channahon Will
3410 Jackson Will
3411 Manhattan Will
3412 Green Garden Will
3413 Monee Will
3414 Crete Will
3415 Crete - East Will
3509 Troy Will
3510 Joliet Will
3511 New Lennox Will
3512 Frankfort Will
3513 Rich Cook
3514 Bloom Cook
3515 Bloom - East Cook
3609 Plainfield Will
3610 Lockport Will
3611 Homer Will
3612 Orland Cook
3613 Bremen Cook
3614 Thornton Cook
3615 Thornton - East Cook
3708 Oswego Kendall
3709 Wheatland Will
3710 DuPage Will
3711 Lemont Cook/DuPage
3712 Palos Cook
3713 Worth Cook

A-2
Township
ID
Township Name County
3714 Calumet Cook
3715 Chicago - 3715 Cook
3806 Big Rock Kane
3807 Sugar Grove Kane
3808 Aurora Kane
3809 Naperville DuPage
3810 Lisle DuPage
3811 Downers Grove DuPage
3812 Lyons Cook
3813 Berwyn Cook
3814 Chicago - 3814 Cook
3815 Chicago - 3815 Cook
3906 Kaneville Kane
3907 Blackberry Kane
3908 Batavia/Geneva Kane
3909 Winfield DuPage
3910 Milton DuPage
3911 York DuPage
3912 Proviso Cook
3913 Cicero Cook
3914 Chicago - 3914 Cook
4006 Virgil Kane
4007 Campton Kane
4008 St. Charles Kane
4009 Wayne DuPage
4010 Bloomingdale DuPage
4011 Addison DuPage
4012 Leyden Cook
4013 Chicago - 4013 Cook
4014 Chicago - 4014 Cook
4106 Burlington Kane
4107 Plato Kane
4108 Elgin Kane
4109 Hanover Cook
4110 Schaumburg Cook
4111 Elk Grove Cook
4112 Maine Cook
4113 Niles Cook
4114 Evanston Cook
4206 Hampshire Kane
4207 Rutland Kane
4208 Dundee Kane
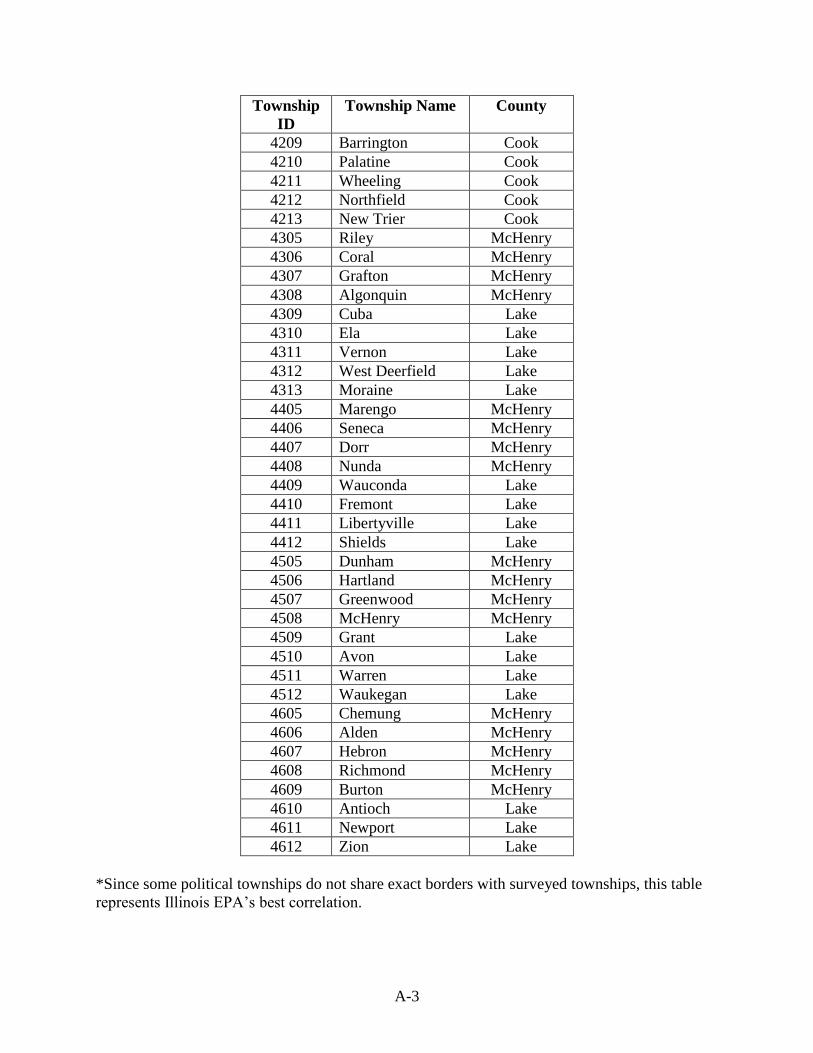
A-3
Township
ID
Township Name County
4209 Barrington Cook
4210 Palatine Cook
4211 Wheeling Cook
4212 Northfield Cook
4213 New Trier Cook
4305 Riley McHenry
4306 Coral McHenry
4307 Grafton McHenry
4308 Algonquin McHenry
4309 Cuba Lake
4310 Ela Lake
4311 Vernon Lake
4312 West Deerfield Lake
4313 Moraine Lake
4405 Marengo McHenry
4406 Seneca McHenry
4407 Dorr McHenry
4408 Nunda McHenry
4409 Wauconda Lake
4410 Fremont Lake
4411 Libertyville Lake
4412 Shields Lake
4505 Dunham McHenry
4506 Hartland McHenry
4507 Greenwood McHenry
4508 McHenry McHenry
4509 Grant Lake
4510 Avon Lake
4511 Warren Lake
4512 Waukegan Lake
4605 Chemung McHenry
4606 Alden McHenry
4607 Hebron McHenry
4608 Richmond McHenry
4609 Burton McHenry
4610 Antioch Lake
4611 Newport Lake
4612 Zion Lake
*Since some political townships do not share exact borders with surveyed townships, this table
represents Illinois EPA’s best correlation.

B-1
Appendix B: Township Data
Twp # of
Sources
Baseline
(tons)
Allotment
(ATUs)
Reported
Emissions
(tons)
Reported
Emissions
(ATUs)
ATUs
In
ATUs
Out
Excur.
In
(ATUs)
Expired
(ATUs)
Available
(ATUs)
HAPs
(tons)
Diff. from
Baseline
(%)
Diff. from
Allotment
(%)
3408 5 509.1 4,623 155.3 1,555 1,000 0 0 4,068 4,623 13.1 -69.5 -66.4
3409 9 858.9 7,991 444.8 4,451 230 0 0 3,774 7,987 144.4 -48.2 -44.3
3411 1 48.3 472 14.4 145 0 0 0 327 472 0.3 -40.1 -69.3
3509 2 36.4 347 9.4 94 0 0 0 227 347 2.3 -74.3 -72.9
3510 3 71.3 629 9.1 92 100 0 0 637 629 0.1 -87.2 -85.4
3511 1 16.8 169 6.3 63 0 0 0 106 169 0.8 -62.7 -62.7
3512 1 120.0 1,200 80.2 803 0 0 0 397 1,200 0.0 -33.2 -33.1
3514 3 193.2 1,721 50.7 507 0 0 0 1,052 1,721 3.9 -73.8 -70.5
3609 1 10.9 97 12.5 125 28 0 0 0 0 0.0 14.3 28.9
3610 1 16.2 143 17.9 179 278 0 0 0 37 0.4 -10.3 25.2
3614 3 213.2 1,883 69.8 701 0 0 0 1,182 1,883 17.6 -67.2 -62.8
3615 1 23.8 210 18.6 186 0 0 0 24 210 3.5 -21.7 -11.4
3708 1 61.4 542 29.1 291 0 0 0 251 542 1.2 -52.7 -46.3
3710 6 306.7 2,948 222.3 2,225 369 0 0 987 2,834 25.7 -27.5 -24.5
3711 1 13.4 118 19.9 200 0 0 0 0 36 0.0 48.8 69.5
3712 1 19.5 172 0.0 0 0 0 0 138 172 0.0 ----- -----
3713 6 350.3 3,243 45.9 461 0 0 0 2,567 3,243 4.1 -86.9 -85.8
3714 4 760.6 6,698 350.7 3,509 221 0 0 2,942 6,230 49.3 -53.9 -47.6
3715 2 63.3 608 0.0 0 0 221 0 266 608 0.0 ----- -----
3806 1 21.4 188 3.7 37 0 0 0 151 188 0.4 -82.7 -80.3
3808 2 183.2 1,755 175.0 1,751 711 0 0 587 1,755 0.0 -4.5 -0.2
3809 1 0.0 0 0.5 5 0 0 6 0 0 0.0 ----- -----
3811 1 42.9 378 41.0 410 0 0 14 0 0 2.0 -4.5 8.5
3812 14 2,543.0 22,818 400.0 4,003 470 3,298 0 13,436 22,694 81.8 -84.3 -82.5
3813 12 643.3 5,780 110.2 1,106 0 802 0 3,482 4,978 36.1 -82.9 -80.9
3814 8 336.5 2,981 97.6 979 100 410 0 1,543 2,787 12.0 -71.0 -67.2
3908 3 64.4 609 10.5 107 0 0 0 502 609 3.3 -83.6 -82.4
3909 2 18.5 164 6.3 63 0 0 0 95 183 0.0 -66.1 -61.6
3910 1 162.6 1,431 20.5 206 0 0 0 1,225 1,431 2.6 -87.4 -85.6
3912 9 286.3 2,524 94.3 946 198 382 0 1,312 2,524 3.5 -67.0 -62.5
3913 11 302.9 2,672 206.7 2,072 1,889 360 0 1,956 3,065 18.4 -31.8 -22.5

B-2
Twp # of
Sources
Baseline
(tons)
Allotment
(ATUs)
Reported
Emissions
(tons)
Reported
Emissions
(ATUs)
ATUs
In
ATUs
Out
Excur.
In
(ATUs)
Expired
(ATUs)
Available
(ATUs)
HAPs
(tons)
Diff. from
Baseline
(%)
Diff. from
Allotment
(%)
3914 9 310.7 2,776 90.9 912 399 862 0 1,223 1,623 0.7 -70.7 -67.1
4008 2 47.6 420 0.0 0 0 242 0 143 420 0.0 ----- -----
4009 1 16.4 145 30.3 301 156 0 0 0 0 0.0 83.4 107.6
4010 3 71.9 634 33.1 331 330 0 0 544 714 0.7 -54.0 -47.8
4011 6 160.3 1,437 11.5 117 41 0 0 1,176 1,440 3.1 -92.8 -91.9
4012 14 281.4 2,518 72.1 725 328 932 233 1,217 2,216 1.0 -74.4 -71.2
4013 5 197.7 1,743 38.9 390 166 1,313 0 149 358 0.1 -80.3 -77.6
4014 1 28.9 281 4.7 48 0 0 0 233 281 0.2 -83.7 -82.9
4108 3 90.3 834 32.3 324 232 0 0 656 834 0.5 -64.2 -61.2
4109 2 204.9 1,932 4.1 42 0 41 0 1,675 1,932 0.0 -98.0 -97.8
4110 2 34.0 300 21.2 212 0 80 0 230 200 0.4 -37.7 -29.3
4111 14 478.3 4,214 144.9 1,454 283 215 0 2,817 4,038 17.5 -69.7 -65.5
4113 3 25.0 222 15.4 155 0 0 0 67 118 1.0 -38.4 -30.2
4114 1 23.0 220 14.2 143 130 0 0 207 220 0.0 -38.3 -35.0
4208 3 68.3 603 8.6 86 0 30 0 445 603 1.2 -87.4 -85.7
4210 1 24.4 243 6.1 61 0 34 0 148 243 0.0 -75.1 -74.9
4211 1 21.2 187 22.5 226 39 0 0 0 187 1.1 6.1 20.9
4212 1 0.0 0 16.6 166 166 0 0 0 0 0.0 ----- -----
4308 1 10.0 88 0.0 0 0 88 0 0 0 0.0 ----- -----
4309 1 37.6 332 8.1 81 0 200 0 51 332 0.7 -78.5 -75.6
4311 1 15.8 139 1.4 15 0 0 0 124 139 0.0 -90.9 -89.2
4405 2 48.8 346 0.0 0 0 0 0 361 346 0.0 ----- -----
4406 1 22.4 225 1.8 18 0 0 0 207 225 0.0 -92.0 -92.0
4407 1 7.4 74 0.0 0 70 162 0 0 56 0.0 ----- -----
4408 1 16.2 157 6.8 68 0 0 0 89 157 0.1 -58.3 -56.7
4409 1 14.4 127 1.4 14 0 0 0 0 0 1.3 -90.4 -89.0
4411 3 60.4 537 7.8 80 165 165 0 403 537 0.8 -87.1 -85.1
4508 1 52.6 464 1.5 16 0 0 0 448 464 0.0 -97.1 -96.6
4512 4 90.9 809 16.7 168 0 0 0 625 809 3.8 -81.7 -79.2
4612 2 30.7 271 0.0 0 0 0 0 218 271 0.0 ----- -----

B-3

C-1
Appendix C Historical County Data
C.1 Allotments and Compensation
Figure C-1: Cook County Allotment and Compensation
Figure C-2: DuPage County Allotment and Compensation
Figure C-3: Grundy County Allotment and Compensation
0
10,000
20,000
30,000
40,000
50,000
60,000
70,000
2007 2008 2009 2010 2011 2012 2013 2014 2015 2016
Allot.
Comp.
0
500
1000
1500
2000
2500
3000
3500
4000
4500
2007 2008 2009 2010 2011 2012 2013 2014 2015 2016
Allot.
Comp.
0
500
1000
1500
2000
2500
3000
3500
4000
4500
5000
2007 2008 2009 2010 2011 2012 2013 2014 2015 2016
Allot.
Comp.

C-2
Figure C-4: Kane County Allotment and Compensation
Figure C-5: Kendall County Allotment and Compensation
Figure C-6: Lake County Allotment and Compensation
0
500
1000
1500
2000
2500
3000
3500
4000
4500
5000
2007 2008 2009 2010 2011 2012 2013 2014 2015 2016
Allot.
Comp.
0
100
200
300
400
500
600
700
2007 2008 2009 2010 2011 2012 2013 2014 2015 2016
Allot.
Comp.
0
500
1000
1500
2000
2500
3000
3500
4000
4500
5000
2007 2008 2009 2010 2011 2012 2013 2014 2015 2016
Allot.
Comp.

C-3
Figure C-7: McHenry County Allotment and Compensation
Figure C-8: Will County Allotment and Compensation
C.2 Allotments and Retained ATUs
Figure C-9: Cook County Allotment and Retained ATUs
0
200
400
600
800
1000
1200
1400
1600
1800
2000
2007 2008 2009 2010 2011 2012 2013 2014 2015 2016
Allot.
Comp.
0
2,000
4,000
6,000
8,000
10,000
12,000
14,000
16,000
2007 2008 2009 2010 2011 2012 2013 2014 2015 2016
Allot.
Comp.
0
10,000
20,000
30,000
40,000
50,000
60,000
70,000
2007 2008 2009 2010 2011 2012 2013 2014 2015 2016
Allotment
Retained

C-4
Figure C-10: DuPage County Allotment and Retained ATUs
Figure C-11: Grundy County Allotment and Retained ATUs
Figure C-12: Kane County Allotment and Retained ATUs
0
500
1000
1500
2000
2500
3000
3500
4000
4500
2007 2008 2009 2010 2011 2012 2013 2014 2015 2016
Allotment
Retained
0
500
1000
1500
2000
2500
3000
3500
4000
4500
5000
2007 2008 2009 2010 2011 2012 2013 2014 2015 2016
Allotment
Retained
0
500
1000
1500
2000
2500
3000
3500
4000
4500
5000
2007 2008 2009 2010 2011 2012 2013 2014 2015 2016
Allotment
Retained

C-5
Figure C-13: Kendall County Allotment and Retained ATUs
Figure C-14: Lake County Allotment and Retained ATUs
Figure C-15: McHenry County Allotment and Retained ATUs
0
100
200
300
400
500
600
2007 2008 2009 2010 2011 2012 2013 2014 2015 2016
Allotment
Retained
0
500
1000
1500
2000
2500
3000
3500
4000
4500
5000
2007 2008 2009 2010 2011 2012 2013 2014 2015 2016
Allotment
Retained
0
200
400
600
800
1000
1200
1400
1600
1800
2000
2007 2008 2009 2010 2011 2012 2013 2014 2015 2016
Allotment
Retained

C-6
Figure C-16: Will County Allotment and Retained ATUs
C.3 Allotments and Expired ATUs
Figure C-17: Cook County Allotment and Expired ATUs
Figure C-18: DuPage County Allotment and Expired ATUs
0
2,000
4,000
6,000
8,000
10,000
12,000
14,000
16,000
2007 2008 2009 2010 2011 2012 2013 2014 2015 2016
Allotment
Retained
0
10,000
20,000
30,000
40,000
50,000
60,000
70,000
2007 2008 2009 2010 2011 2012 2013 2014 2015 2016
Allotment
Expired
0
500
1000
1500
2000
2500
3000
3500
4000
4500
2007 2008 2009 2010 2011 2012 2013 2014 2015 2016
Allotment
Expired

C-7
Figure C-19: Grundy County Allotment and Expired ATUs
Figure C-20: Kane County Allotment and Expired ATUs
Figure C-21: Kendall County Allotment and Expired ATUs
0
500
1000
1500
2000
2500
3000
3500
4000
4500
5000
2007 2008 2009 2010 2011 2012 2013 2014 2015 2016
Allotment
Expired
0
500
1000
1500
2000
2500
3000
3500
4000
4500
5000
2007 2008 2009 2010 2011 2012 2013 2014 2015 2016
Allotment
Expired
0
100
200
300
400
500
600
2007 2008 2009 2010 2011 2012 2013 2014 2015 2016
Allotment
Expired

C-8
Figure C-22: Lake County Allotment and Expired ATUs
Figure C-23: McHenry County Allotment and Expired ATUs
Figure C-24: Will County Allotment and Expired ATUs
0
1000
2000
3000
4000
5000
6000
2007 2008 2009 2010 2011 2012 2013 2014 2015 2016
Allotment
Expired
0
200
400
600
800
1000
1200
1400
1600
1800
2000
2007 2008 2009 2010 2011 2012 2013 2014 2015 2016
Allotment
Expired
0
2,000
4,000
6,000
8,000
10,000
12,000
14,000
16,000
2007 2008 2009 2010 2011 2012 2013 2014 2015 2016
Allotment
Expired

C-9
C.4 Net ATUs Traded
Figure C-25: Cook County Net Traded ATUs
Figure C-26: DuPage County Net Traded ATUs
Figure C-27: Grundy County Net Traded ATUs
-14,000
-12,000
-10,000
-8,000
-6,000
-4,000
-2,000
0
2007 2008 2009 2010 2011 2012 2013 2014 2015 2016
ATUs
0
100
200
300
400
500
600
700
800
2007 2008 2009 2010 2011 2012 2013 2014 2015 2016
ATUs
0
200
400
600
800
1000
1200
2007 2008 2009 2010 2011 2012 2013 2014 2015 2016
ATUs

C-10
Figure C-28: Kane County Net Traded ATUs
Figure C-29: Kendall County Net Traded ATUs
Figure C-30: Lake County Net Traded ATUs
-2000
-1500
-1000
-500
0
500
1000
2007 2008 2009 2010 2011 2012 2013 2014 2015 2016ATUs
0
10
20
30
40
50
60
2007 2008 2009 2010 2011 2012 2013 2014 2015 2016
ATUs
-700
-600
-500
-400
-300
-200
-100
0
100
200
300
400
2007 2008 2009 2010 2011 2012 2013 2014 2015 2016ATUs

C-11
Figure C-31: McHenry County Net Traded ATUs
Figure C-32: Will County Net Traded ATUs
C.5 VOM Emissions and Reported HAPs
Figure C-33: Cook County Emissions and Reported HAPs (tons)
-400
-350
-300
-250
-200
-150
-100
-50
0
2007 2008 2009 2010 2011 2012 2013 2014 2015 2016
ATUs
-5000
-4000
-3000
-2000
-1000
0
1000
2000
2007 2008 2009 2010 2011 2012 2013 2014 2015 2016
ATUs
0
500
1000
1500
2000
2500
2007 2008 2009 2010 2011 2012 2013 2014 2015 2016
VOM
HAPs
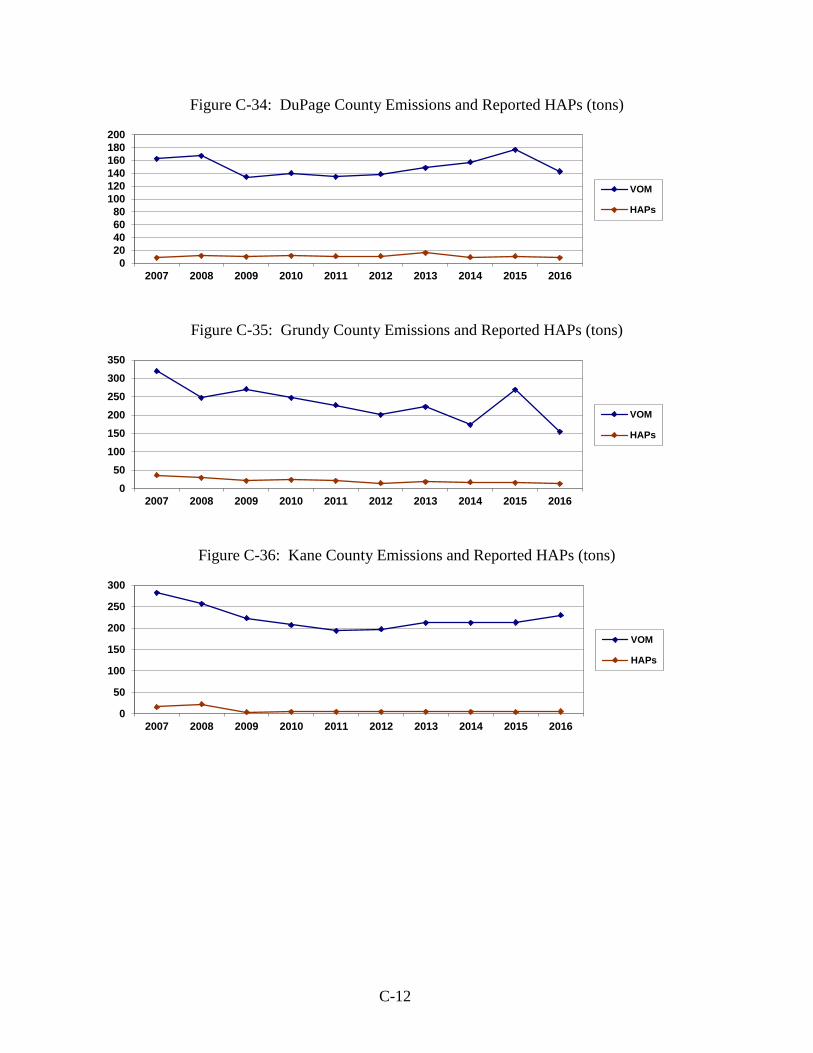
C-12
Figure C-34: DuPage County Emissions and Reported HAPs (tons)
Figure C-35: Grundy County Emissions and Reported HAPs (tons)
Figure C-36: Kane County Emissions and Reported HAPs (tons)
0
20
40
60
80
100
120
140
160
180
200
2007 2008 2009 2010 2011 2012 2013 2014 2015 2016
VOM
HAPs
0
50
100
150
200
250
300
350
2007 2008 2009 2010 2011 2012 2013 2014 2015 2016
VOM
HAPs
0
50
100
150
200
250
300
2007 2008 2009 2010 2011 2012 2013 2014 2015 2016
VOM
HAPs

C-13
Figure C-37: Kendall County Emissions and Reported HAPs (tons)
Figure C-38: Lake County Emissions and Reported HAPs (tons)
Figure C-39: McHenry County Emissions and Reported HAPs (tons)
0
10
20
30
40
50
60
70
2007 2008 2009 2010 2011 2012 2013 2014 2015 2016
VOM
HAPs
0
20
40
60
80
100
120
2007 2008 2009 2010 2011 2012 2013 2014 2015 2016
VOM
HAPs
0
10
20
30
40
50
60
70
80
90
100
2007 2008 2009 2010 2011 2012 2013 2014 2015 2016
VOM
HAPs

C-14
Figure C-40: Will County Emissions and Reported HAPs (tons)
C.6 Reduction from Baseline and Allotment
Figure C-41: Cook County Reduction from Baseline and Allotment (%)
Figure C-42: DuPage County Reduction from Baseline and Allotment (%)
0
100
200
300
400
500
600
700
800
900
1000
2007 2008 2009 2010 2011 2012 2013 2014 2015 2016
VOM
HAPs
0
10
20
30
40
50
60
70
80
90
2007 2008 2009 2010 2011 2012 2013 2014 2015 2016
Baseline
Allotment
0
10
20
30
40
50
60
70
80
2007 2008 2009 2010 2011 2012 2013 2014 2015 2016
Baseline
Allotment

C-15
Figure C-43: Grundy County Reduction from Baseline and Allotment (%)
Figure C-44: Kane County Reduction from Baseline and Allotment (%)
Figure C-45: Kendall County Reduction from Baseline and Allotment (%)
0
10
20
30
40
50
60
70
80
2007 2008 2009 2010 2011 2012 2013 2014 2015 2016
Baseline
Allotment
0
10
20
30
40
50
60
70
2007 2008 2009 2010 2011 2012 2013 2014 2015 2016
Baseline
Allotment
-20
-10
0
10
20
30
40
50
60
70
2007 2008 2009 2010 2011 2012 2013 2014 2015 2016
Baseline
Allotment

C-16
Figure C-46: Lake County Reduction from Baseline and Allotment (%)
Figure C-47: McHenry County Reduction from Baseline and Allotment (%)
Figure C-48: Will County Reduction from Baseline and Allotment (%)
0
10
20
30
40
50
60
70
80
90
100
2007 2008 2009 2010 2011 2012 2013 2014 2015 2016
Baseline
Allotment
0
10
20
30
40
50
60
70
80
90
100
2007 2008 2009 2010 2011 2012 2013 2014 2015 2016
Baseline
Allotment
0
5
10
15
20
25
30
35
40
45
50
2007 2008 2009 2010 2011 2012 2013 2014 2015 2016
Baseline
Allotment